unconfined compressive strength of stabilized soil · estimated by conducting unconfined...
TRANSCRIPT

International Journal of Emerging Technology in Computer Science & Electronics (IJETCSE)
ISSN: 0976-1353 Volume 21 Issue 3 – APRIL 2016.
583
UNCONFINED COMPRESSIVE STRENGTH OF
STABILIZED SOIL K. Saranya M.E*Asst.prof .,Panimalar Engineering College.,Chennai,India
Deepak.V**.,Muniyandi.S**.,Balaji.S**.,Arunkumar.M**
B.E (Final Year Students)Panimalar Engineering College, Chennai.,
Abstract -Improvement of soft soils by deep mixing is gaining
popularity in many countries. Among the various stabilizers
available for stabilization of soft soil by deep mixing, lime and
lime-cement have been used for several decades. In recent
years fly ash, Which is a waste product from the thermal
power stations is also utilized for improving the engineering
properties of soils. The strength of stabilized soils is generally
estimated by conducting unconfined compression test, Where
astriaxial compression test, are used very rarely further the
undrained strength of stabilized soil is consider for design.
Extensive experimental programme is carried out to evaluate
the unconfined compressive strength of stabilized soft soil. The
various stabilizers proposed to be used are lime alone
(3%,5%,7%), cement alone(1.5%,3%,5%), fly ash alone
(10%,15%,20%) and glass powder (5%,10%,15%), cement-
glass powder mixer. UCC strength was obtained for soil was
treated with cement alone (1.5%,3%,5%),lime alone
(3%,5%,7%), Fly ash (10%,15%,20%), Glass powder
(5%,10%,15%) and combination of cement glass powder
(1.5%+5%, 3%+10% , 5%+15%) and cured for 2,7 and 14
days. In general it is noticed that the UCC strength increases
with increase in the percentage of stabilizer curing period.
Index Terms: Flyash, undrained strength, Glass powder, UCC
Strength
I.INTRODUCTION
Soil stabilization, in a broad sense, incorporates, the
various methods employed for modifying the properties of a
soil to improve its engineering performance. Stabilization is
being used for a variety of engineering works, where the
main objective is to increase the strength or stability of soil
and to reduce the construction cost by making best use of
the locally available materials.
Methods of stabilization may be grouped under two main
types,
1. Modification or improvement of a soil property of the
existing soil without any admixture.
2. Modification of the properties with the help of
admixtures.
The properties of soft soils can be improved by either of the
above mentioned methods.
II.MATERIALS
SOIL
Locally available expansive soil has been used for the
experimental investigation. Soil sample collected from the
local area (kelambakkam)
Chennai at a depth of 0.5 – 1.0 m was used in the present
study. To characterize the soil various experiments were
conducted as per BIS specification.
parameter Symbol or
percentage
Values
Specific
gravity
Gs 2.33
Clay % 80
Silt % 12
Sand % 8
Liquid limit % 58
Plastic limit % 34
Plasticity
index
% 24
Shrinkage
limit
% 61.71
Dry density g/cc 1.7
IS
Classification
CH Clay of
high
plasticity
International Journal of Emerging Technology in Computer Science & Electronics (IJETCSE)
ISSN: 0976-1353 Volume 21 Issue 3 – APRIL 2016.
584
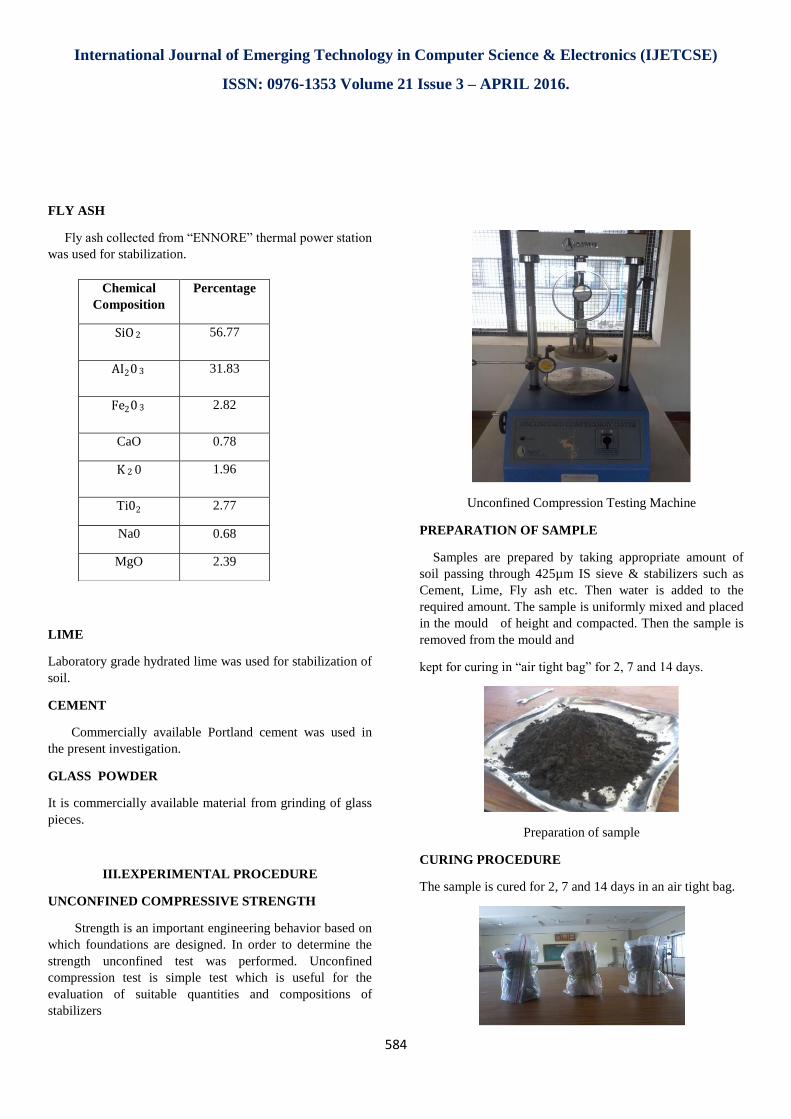
FLY ASH
Fly ash collected from “ENNORE” thermal power station
was used for stabilization.
LIME
Laboratory grade hydrated lime was used for stabilization of
soil.
CEMENT
Commercially available Portland cement was used in
the present investigation.
GLASS POWDER
It is commercially available material from grinding of glass
pieces.
III.EXPERIMENTAL PROCEDURE
UNCONFINED COMPRESSIVE STRENGTH
Strength is an important engineering behavior based on
which foundations are designed. In order to determine the
strength unconfined test was performed. Unconfined
compression test is simple test which is useful for the
evaluation of suitable quantities and compositions of
stabilizers
Unconfined Compression Testing Machine
PREPARATION OF SAMPLE
Samples are prepared by taking appropriate amount of
soil passing through 425µm IS sieve & stabilizers such as
Cement, Lime, Fly ash etc. Then water is added to the
required amount. The sample is uniformly mixed and placed
in the mould of height and compacted. Then the sample is
removed from the mould and
kept for curing in “air tight bag” for 2, 7 and 14 days.
Preparation of sample
CURING PROCEDURE
The sample is cured for 2, 7 and 14 days in an air tight bag.
Chemical
Composition
Percentage
SiO 2 56.77
AI20 3 31.83
Fe20 3 2.82
CaO 0.78
K 2 0 1.96
Ti02 2.77
Na0 0.68
MgO 2.39

International Journal of Emerging Technology in Computer Science & Electronics (IJETCSE)
ISSN: 0976-1353 Volume 21 Issue 3 – APRIL 2016.
585
Curing procedure
RESULTS AND DISCUSSIONS
Fig 1 Stress strain curve of stabilized soil with 1.5%
cement
Fig 1 plots the stress strain curve of the stabilized soil with
1.5% cement. It is observed that irrespective of increase in
curing periods the stress becomes asymmetric to strain and
exhibits less compressive strength when compared to other
percentages
Fig 2 below stress-strain relationship of stabilized soil with
3% cement is shown in Fig 2 The stress-strain curve shows
the pronounced peak as the curing periods favors the soil-
cement reaction to complete and achieve maximum
compressive strength
Fig 2 Stress strain curve of stabilized soil with 3%
cement
Curing periods
Lime
alone
%
Cement alone
%
Fly ash alone
%
Glass powder
alone
%
Cement +
glass powder
%
0
3
5
7
1.5
3
5
10
15
20
5
10
15
1.5+5
3+10
5+15
2
3
5
7
1.5
3
5
10
15
20
5
10
15
1.5+5
3+10
5+15
7
3
5
7
1.5
3
5
10
15
20
5
10
15
1.5+5
3+10
5+15
14
3
5
7
1.5
3
5
10
15
20
5
10
15
1.5+5
3+10
5+15

International Journal of Emerging Technology in Computer Science & Electronics (IJETCSE)
ISSN: 0976-1353 Volume 21 Issue 3 – APRIL 2016.
586
Fig 3 Stress strain curve of stabilized soil with 5% cement
Fig 3 the stress strain relationship of stabilized soil with 5%
cement cured for 2, 7 & 14 days. The sample cured for 2
days showed a plastic behavior, that is the stress between
almost constant with increase in strain for that of 5% cement
content. Hence increase in curing of samples 7, 14 days
showed increase in strength.
Table.1 UCC strength of cured cement stabilized soil of
(1.5, 3 and 5%)
Table 1 summarizes the strength of UCC stabilized soil with
1.5%, 3% and 5% cement content cured for 2, 7 and 14
days. Data presented in the table 4.1 brings out that the UCC
strength of soil increased with increase in cement content
and as well, as increase in curing periods. When compared
to 1.5% and 3% of cement content strength is increases with
curing periods. But compared to 1.5% and 5% of cement
content strength is much more effective.
Fig 4 Variation of UCC strength with curing periods and
cement content
Fig 4 shows strength ratio of stabilized soil with 1.5%, 3%
and 5% cement content cured for 2, 7 and 14 days. The
strength of 5% cement is almost 1.4 to 3.5 times the strength
of 1.5% cement treated soil for various curing periods.
The increase in the strength for the soil treated with 1.5%,
3% and 5% of cement is 1.6 to 1.8 times for change in
curing period from 2 to 7 days curing. After 14 days curing
the strength is increased to nearly 1.8 to 2.6 times the 2 days
curing the strength for all cement contents.
Fig 5 Stress strain curve of stabilized soil with 3% lime
Fig 4.5 plots the stress strain curve of the stabilized soil with
3% lime. It is observed that the irrespective of increase in
curing periods the stress becomes asymmetric to strain and
exhibits less compressive strength when compared to other
percentages.
Curing periods
( days)
UCC strength (kPa)
1.5% Cement
3% Cement
5% Cement
0 71.61 79.5 88.3
2 76.51 87.3 103
7 83.38 108 147
14 94.17 118 177

International Journal of Emerging Technology in Computer Science & Electronics (IJETCSE)
ISSN: 0976-1353 Volume 21 Issue 3 – APRIL 2016.
587
Fig 6 below stress-strain relationship of stabilized soil with
5% lime is shown in Fig 6. The stress-strain curve shows
the pronounced peak as the curing period increases. This is
due to the fact that, increase in curing period. Further the
reaction is changed from dispersed to flocculated one. The
sudden failure of specimen indicates the breakage of bond
developed due to soil lime reaction.
Fig 6 Stress strain curve of stabilized soil with 5% lime
Fig 7 plots the stress strain relationship of stabilized soil
with 7% lime cured for 2, 7 and 14 days. The sample cured
for 2 days showed a plastic behavior that is the stress is
almost constant with increase in strain. In case of 7 and 14
day cured samples strength is increased with increase in
stabilizer. Hence curing day increases the same time
strength is also increased.
Fig 7 Stress strain curve of stabilized soil with
7% lime
Curing periods
( days)
UCC strength (kPa)
3% Lime
5% Lime
7% Lime
0 21.58 26.5 30.41
2 43.16 53 62.78
7 68.67 90.3 117.72
14 78.48 128 166.77
Table 2 UCC strength of cured lime stabilized soil of (3, 5 and 7%)
Table 2 summarizes the strength of UCC stabilized soil with
3%, 5% and 7%lime content cured for 2, 7 and 14 days.
Data presented in the table 4.2 brings out that the UCC
strength of soil increased with increase in lime content and
as well, as increase in curing periods. This is due to the
beneficial effects derived from soil- lime reaction. It can be
observed that addition of 3% lime is not much effective in
improving the strength. However, as soon as lime is added
to the soil both modification and stabilization process starts
together and it cannot be said that only after modifying the
plasticity characterization the strength should be improved.
Hence in the present investigation even 5% and 7% lime
addition showed a marginal increase in UCC strength.

International Journal of Emerging Technology in Computer Science & Electronics (IJETCSE)
ISSN: 0976-1353 Volume 21 Issue 3 – APRIL 2016.
588
Fig 8 Variation of UCC strength with curing periods and
lime content
Fig 8 shows strength ratio of stabilized soil with 3%, 5% and
7% lime content cured for 2, 7 and 14 days. The strength of
7% lime is almost 1.1 to 1.4 times the strength of 3% lime
treated soil for various curing periods.
The increase in the strength for the soil treated with 3%, 5%
and 7% of lime is 1.1 to 1.4 times for change in curing
period from 2 to 7 days curing. After 14 days curing the
strength is increased to nearly 1.2 to 1.7 times the 2 days
curing the strength for all lime contents.
Fig 9 Stress strain curve of stabilized soil with 10% fly
ash
Fig 9 shows the stress strain curve of the stabilized soil with
10% fly ash. It is observed that irrespective of increase in
curing periods the stress becomes asymmetric to strain and
exhibits less compressive strength when compared to other
stabilizers. When compared from 2 to 14 days of curing with
10% fly ash, stress is increases at the same time strain is
increased.
Fig 10 below stress-strain relationship of stabilized soil with
15% fly ash is shown in Fig 10. The stress strain curve
shows the undrainedstrenth is increases with increase in the
ash content. When compared from 0 to 14 days the strength
is increases corresponding with respect to stress strain curve.
Fig 10 Stress strain curve of stabilized soil with 15% fly
ash
Fig 11 Stress strain curve of stabilized soil with 20% fly
ash
Fig 11 the stress strain relationship of stabilized soil with
20% fly ash cured for 2, 7 and 14 days. The sample cured
for 2 days showed a plastic behavior, that is the stress
between almost constant with increase in strain for that of
20% fly ash content. Hence increase in curing of samples 7,
14 days showed increase in strength.
Curing
periods
( days)
UCC strength (kPa)
10% Fly
ash
15% Fly
ash
20% Fly
ash
0 26.5 37.3 57.9
2 31.4 43.2 71.6
7 35.3 50 81.4
14 46.1 57.9 98.1
Table 3 UCC strength of cured fly ash stabilized soil of (10,
15 and 20%)
Table 3 summarizes the strength of ucc stabilized soil with
10%, 15% and 20% fly ash content cured for 2, 7 and 14
days. Data presented in the table 4.3 bring out that the UCC
strength of soil increased with increase in fly ash content
and as well, as increase in curing periods. When compared
to 10 and 20% fly ash content the strength is not much
effective in improving the strength parameters. When fly ahs
content increases there is a decrease in the optimum
moisture content and the maximum dry unit weight
increases.

International Journal of Emerging Technology in Computer Science & Electronics (IJETCSE)
ISSN: 0976-1353 Volume 21 Issue 3 – APRIL 2016.
589
Fig 12 Variation of UCC strength with curing periods and
fly ash content
Fig 12 summarizes strength ratio of stabilized soil with
10%, 15%, 20% fly ash content cured for 2, 7 and 14 days .
The strength of 20% lime is almost 1.7 to 2.1 times the
strength of 10% cement treated soil for various curing
periods.
The increase in the strength for the soil treated with
10%,15% and 20% of fly ash content1.1 to 1.2 times for
change in curing period from 2 to 7 days curing. After 14
days curing the strength is increased nearly 1.3 to 1.5 times
increases.
Fig 4.13 Stress strain curve of stabilized soil with 5%
glass powder
Fig 13 plots the stress strain curve of the stabilized soil with
5% glass powder. It is observed that irrespective of increase
in curing periods the stress becomes asymmetric to strain
and exhibits compressive strength is moderate.
Fig 14 below stress-strain relationship of stabilized soil
with 10% glass powder is shown in Fig 4.14. The stress-
strain curve shows the pronounced peak as the curing
periods favors the soil- glass powder reaction to complete
and achieve very less compressive strength
Fig 14 Stress strain curve of stabilized soil with 10% glass
powder
Fig 15 Stress strain curve of stabilized soil with 15% glass
powder
Fig 15 the stress strain relationship of stabilized soil with
15% glass powder cured for 2, 7 and 14 days. The sample
cured for 2 days the stress is almost constant with increase
in strain for that of 15% glass powder content. Hence
increase in curing of samples 7, 14 days showed increase in
strength.
Curing
periods
( days)
UCC strength (kPa)
5%
Glass
powder
10%
Glass
powder
15%
Glass
powder
0 25 43.2 54
2 32 55.9 64.7
7 37 66.7 75.5
14 48 77.5 92.2
Table 4 UCC strength of cured glass powder stabilized soil
of (5, 10 and 15%)
Table 4 summarizes the strength of ucc stabilized soil with
5%, 10% and 15% glass powder content cured for 2, 7 and
14 days. Data presented in the table 4.4 bring out that the
UCC strength of soil increased with increase in glass
powder content and as well, as increase in curing periods.
However , it can be observed that addition of 5% glass
powder is not much effective in improving the strength ,
when compared to 15%, 20% of glass powder content.
International Journal of Emerging Technology in Computer Science & Electronics (IJETCSE)
ISSN: 0976-1353 Volume 21 Issue 3 – APRIL 2016.
590
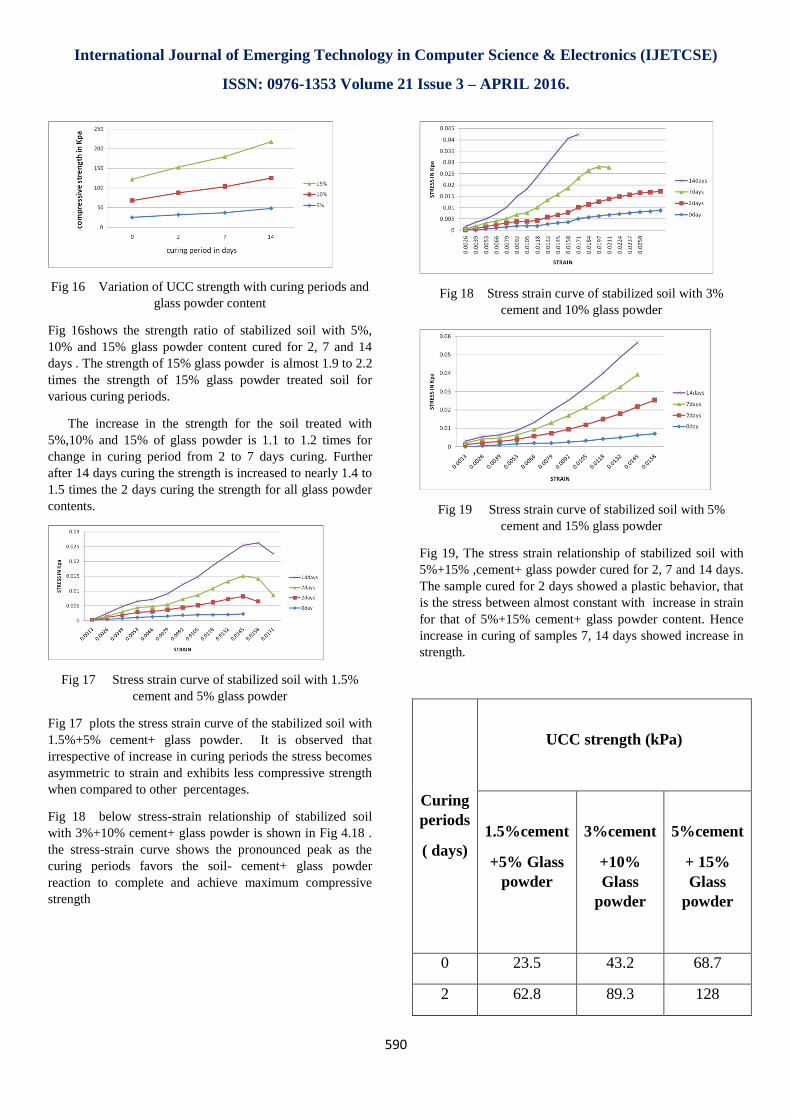
Fig 16 Variation of UCC strength with curing periods and
glass powder content
Fig 16shows the strength ratio of stabilized soil with 5%,
10% and 15% glass powder content cured for 2, 7 and 14
days . The strength of 15% glass powder is almost 1.9 to 2.2
times the strength of 15% glass powder treated soil for
various curing periods.
The increase in the strength for the soil treated with
5%,10% and 15% of glass powder is 1.1 to 1.2 times for
change in curing period from 2 to 7 days curing. Further
after 14 days curing the strength is increased to nearly 1.4 to
1.5 times the 2 days curing the strength for all glass powder
contents.
Fig 17 Stress strain curve of stabilized soil with 1.5%
cement and 5% glass powder
Fig 17 plots the stress strain curve of the stabilized soil with
1.5%+5% cement+ glass powder. It is observed that
irrespective of increase in curing periods the stress becomes
asymmetric to strain and exhibits less compressive strength
when compared to other percentages.
Fig 18 below stress-strain relationship of stabilized soil
with 3%+10% cement+ glass powder is shown in Fig 4.18 .
the stress-strain curve shows the pronounced peak as the
curing periods favors the soil- cement+ glass powder
reaction to complete and achieve maximum compressive
strength
Fig 18 Stress strain curve of stabilized soil with 3%
cement and 10% glass powder
Fig 19 Stress strain curve of stabilized soil with 5%
cement and 15% glass powder
Fig 19, The stress strain relationship of stabilized soil with
5%+15% ,cement+ glass powder cured for 2, 7 and 14 days.
The sample cured for 2 days showed a plastic behavior, that
is the stress between almost constant with increase in strain
for that of 5%+15% cement+ glass powder content. Hence
increase in curing of samples 7, 14 days showed increase in
strength.
Curing
periods
( days)
UCC strength (kPa)
1.5%cement
+5% Glass
powder
3%cement
+10%
Glass
powder
5%cement
+ 15%
Glass
powder
0 23.5 43.2 68.7
2 62.8 89.3 128

International Journal of Emerging Technology in Computer Science & Electronics (IJETCSE)
ISSN: 0976-1353 Volume 21 Issue 3 – APRIL 2016.
591
7 67.7 147 167
14 118 206 235
Table 5 UCC strength of cured cement and glass powder
stabilized soil of (1.5+5%, 3+10% and 5+15%)
Table 5 summarizes the strength of ucc stabilized soil with
1.5%+5%, 3%+10%, 5%+15% cement+ glass powder
content cured for 2, 7, 14 days. Data presented in the table
bring out that the ucc strength of soil increased with increase
in fly ash content and as well, as increase in curing periods.
This due to the beneficial effects derived from soil- %
cement+ glass powder.
How ever , it can be observed that addition of 10% lime is
not much effective in improving the strength , when
compared to 3%+10%, 5%+15% cement+ glass powder
content.
Fig 20 Variation of UCC strength with curing periods and
cement,glass powder content
Table 2(e) summarizes strength ratio of stabilized soil with
with 1.5%+5%, 3%+10%, 5%+15% cement+ glass powder
content cured for 2, 7, 14 days . the strength of %, 5%+15%
cement+ glass powder is almost 3 to 5 times the strength of
%,1. 5%+5% cement+ glass powder treated soil for various
curing periods.
The soil treated with cement+ glass powder of 1.5%+5%,
3%+10%, 5%+15% the strength after 7 days is nearly 1.1 to
1.2 times as that of 2 days strength. Further after 14 days
curing the strength is increased to nearly 1.8 to 1.9 times the
2 days curing the strength for all fly ash contents
CONCLUSION
Soft clay deposits are geologically recent deposits which are
found in several parts of the world especially along the coast
in tidal plane and swamp areas. In tamilnadu also these
deposits occur in many parts like backwater areas of
kovalam
Based on the detailed experimental investigation and
analyzing the data the following conclusion are arrived
1.Soil exhibits very low strength when tested immediately
after mixing the stabilizers (lime, fly ash, cement & glass
powder with the soil. Hence curing period plays a major role
in improving the strength.
2.Unconfined compressive strength of soil treated with
various percentage of lime, fly ash, cement, glass powder
etc. showed increase in strength with increase in percentage
of stabilizers & increase in curing days.
3.In case of lime the overall increase in strength of 14th is 6
times to the strength 0th day lime.
4.In case of cement the overall increase in strength of 14th is
2.4 times to the strength 0th day cement.
5.In case of fly ash the overall increase in strength of 14th is
3.7 times to the strength 0th day fly ash.
6.In case of glass powder the overall increase in strength of
14th is 3.6 times to the strength 0th day glass powder.
7.In case of glass powder+ cement the overall increase in
strength of 14th is 10 times to the strength 0th day glass
powder+ cement.
8.The combination of soil + cement gives the predominant
value when compared to other stabilizers after the 2, 7, 14
curing periods.
REFERANCES
1.R. J. McLaren and A. M. Digioia, The typical engineering
properties of fly ash, Proc. Conf. on Geotechnical Practice
for Waste Disposal, ASCE, New York, pp. 683–697 (1987).
2. N. S. Pandian, Fly ash characterization with reference to
geotechnical applications(1998) IISC, Bangalore.
3. K. C. Sahu, S. Tripathy and C. Samuel, Geochemistry of
Indian coal and fly ash. Environmental considerations, Proc.
Int. Conf. on Environmental Impact of Coal Utilization from
Raw Materials to Waste Resources (K. C. Sahu, ed.), Indian
Institute of Technology, Bombay, pp. 23–38 (1991).
4. K. C. Sahu, Coal and fly ash problem, Proc. Int. Conf. on
Environmental Impact of Coal Utilization from Raw
Materials to Waste Resources (K. C. Sahu, ed.), Indian
Institute of Technology, Bombay, pp. 11–22 (1991).
5. J. P. Prashanth, Evaluation of the properties of fly ash for
its use in geotechnical applications, Ph. D. Thesis, Indian
Institute of Science, Bangalore (1998).

International Journal of Emerging Technology in Computer Science & Electronics (IJETCSE)
ISSN: 0976-1353 Volume 21 Issue 3 – APRIL 2016.
592