unconventional natural gas: an lca with a conventional answer library/events/2012/univ...
TRANSCRIPT
Unconventional Natural Gas: An LCA With a Conventional Answer James Littlefield – Booz Allen Hamilton Joe Marriott, PhD. – Booz Allen Hamilton Timothy J. Skone, P.E. – National Energy Technology Laboratory 2012 University Turbine Systems Research Workshop October 3, 2012
2 2
Agenda
• Resource Profile of Natural Gas • Life Cycle Analysis (LCA) • NETL’s LCA of Natural Gas • Role of Policy and Voluntary
Actions • Role of Power Plants
3 3
In what ways is the resource profile of domestic natural gas changing?
4 4
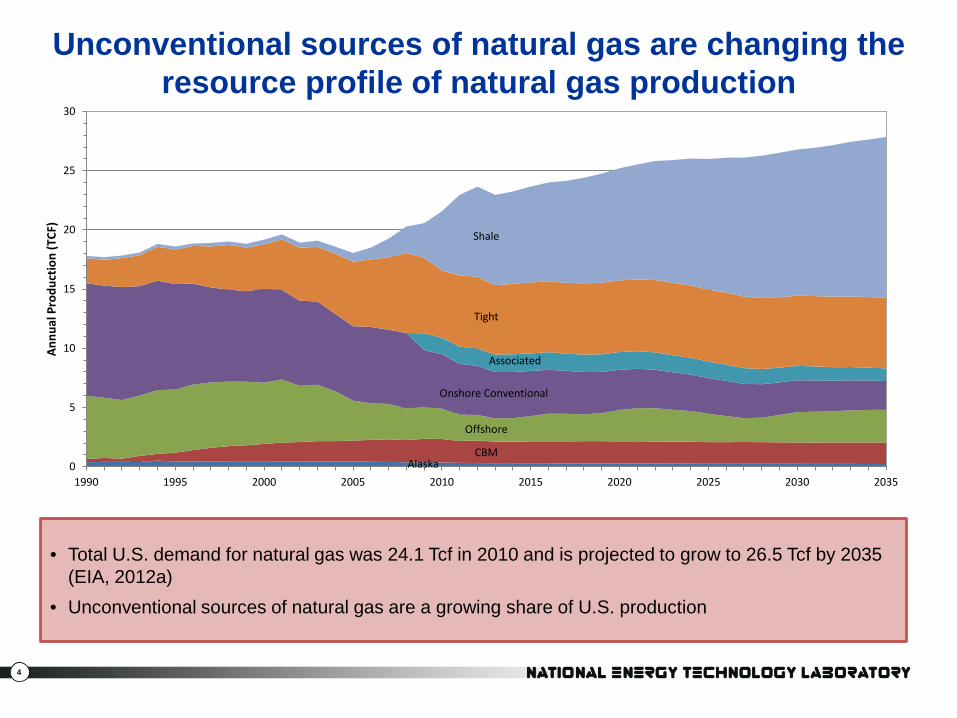
Unconventional sources of natural gas are changing the resource profile of natural gas production
• Total U.S. demand for natural gas was 24.1 Tcf in 2010 and is projected to grow to 26.5 Tcf by 2035 (EIA, 2012a)
• Unconventional sources of natural gas are a growing share of U.S. production
Source: EIA, 2012a
Alaska CBM
Offshore
Onshore Conventional
Associated
Tight
Shale
0
5
10
15
20
25
30
1990 1995 2000 2005 2010 2015 2020 2025 2030 2035
Annu
al P
rodu
ctio
n (T
CF)
5 5
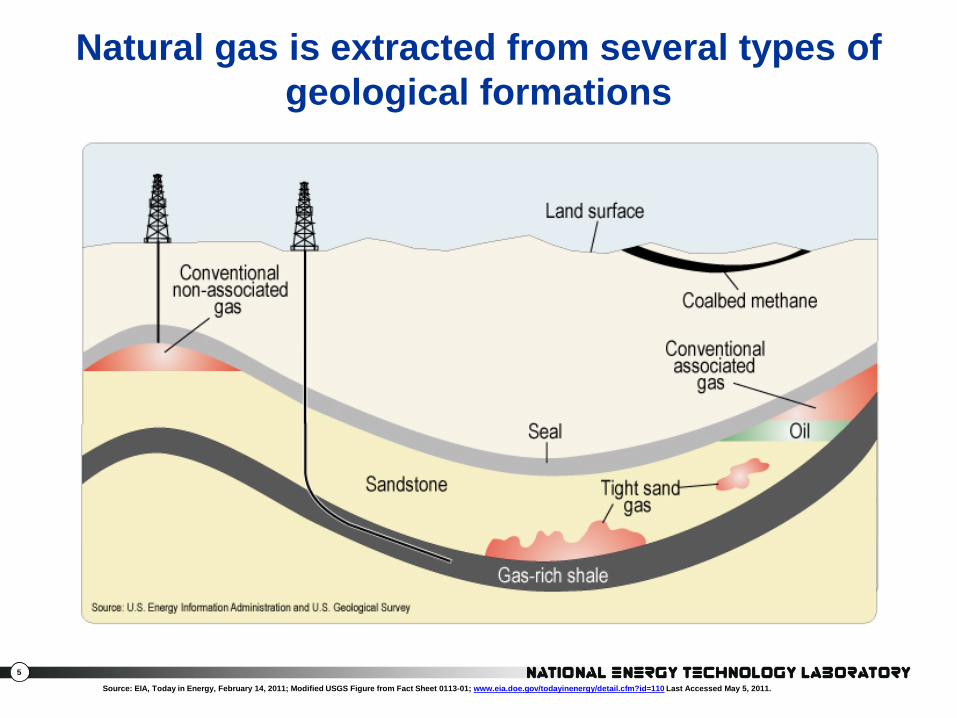
Natural gas is extracted from several types of geological formations
Source: EIA, Today in Energy, February 14, 2011; Modified USGS Figure from Fact Sheet 0113-01; www.eia.doe.gov/todayinenergy/detail.cfm?id=110 Last Accessed May 5, 2011.

6 6
Natural gas extraction locations are also changing
Source: EIA, Natural Gas Maps, http://www.eia.doe.gov/pub/oil_gas/natural_gas/analysis_publications/maps/maps.htm Last Accessed May 5, 2011.

7 7
What is LCA?

8 8
LCA Defined
• Compilation and evaluation of inputs, outputs, and potential environmental impacts of a product or service throughout its life cycle, from raw material acquisition to final disposal
• Used to identify hot spots or opportunities for improving environmental performance of products or systems
• NETL uses LCA to inform policy
9 9
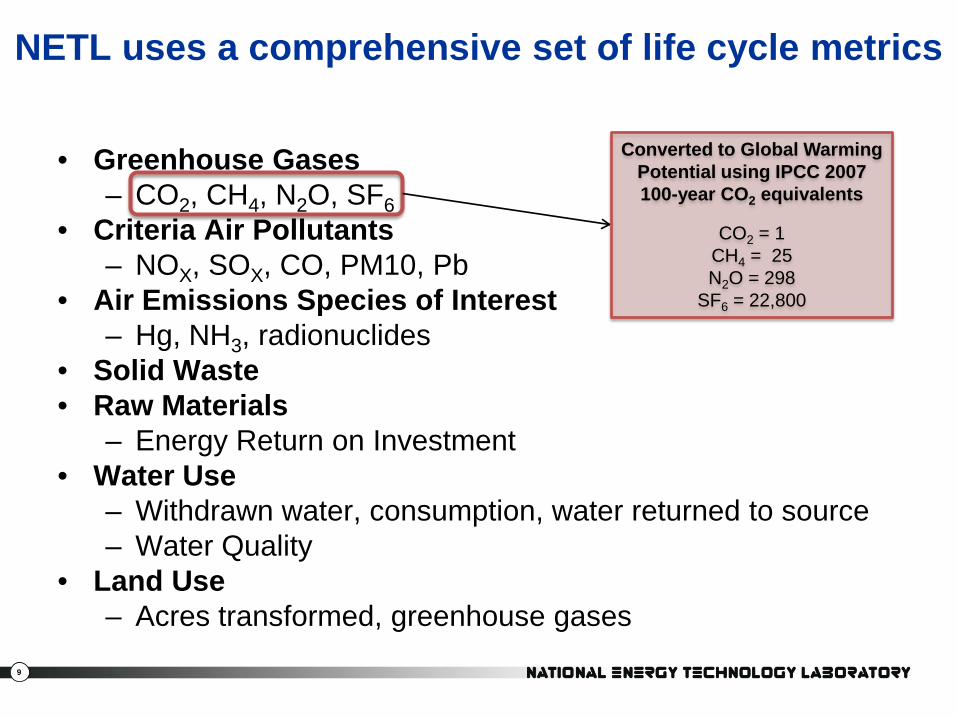
• Greenhouse Gases – CO2, CH4, N2O, SF6
• Criteria Air Pollutants – NOX, SOX, CO, PM10, Pb
• Air Emissions Species of Interest – Hg, NH3, radionuclides
• Solid Waste • Raw Materials
– Energy Return on Investment • Water Use
– Withdrawn water, consumption, water returned to source – Water Quality
• Land Use – Acres transformed, greenhouse gases
NETL uses a comprehensive set of life cycle metrics
Converted to Global Warming Potential using IPCC 2007 100-year CO2 equivalents
CO2 = 1
CH4 = 25 N2O = 298
SF6 = 22,800
10 10
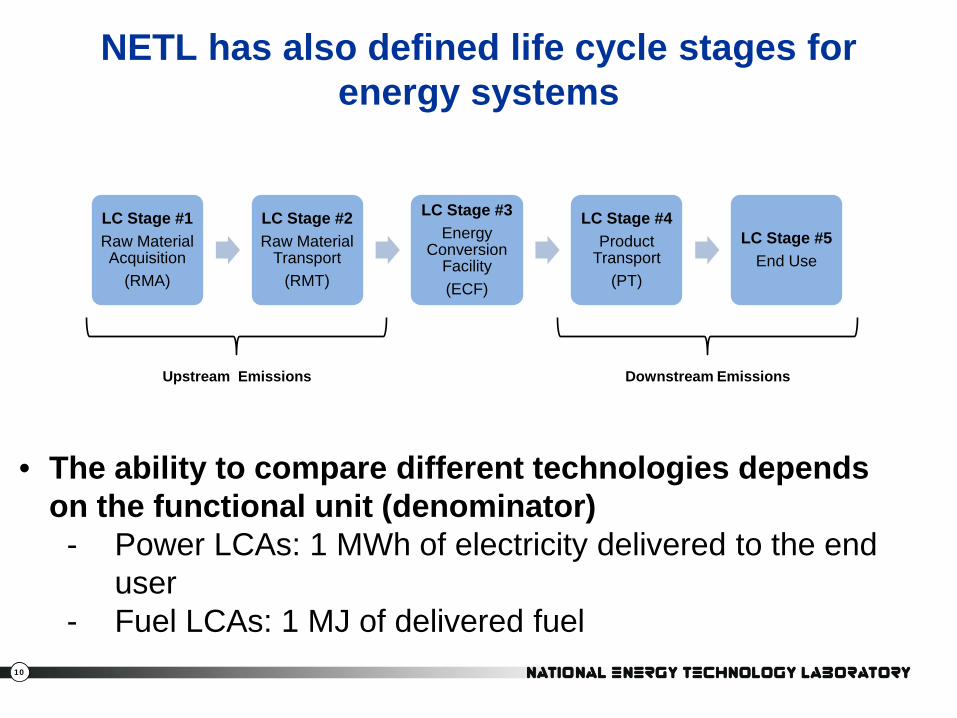
NETL has also defined life cycle stages for energy systems
LC Stage #1 Raw Material Acquisition
(RMA)
LC Stage #2 Raw Material
Transport (RMT)
LC Stage #3 Energy
Conversion Facility (ECF)
LC Stage #4 Product
Transport (PT)
LC Stage #5 End Use
Upstream Emissions Downstream Emissions
• The ability to compare different technologies depends on the functional unit (denominator) - Power LCAs: 1 MWh of electricity delivered to the end
user - Fuel LCAs: 1 MJ of delivered fuel

11 11
How does NETL’s LCA model of natural gas work and what does it tell us?
12 12
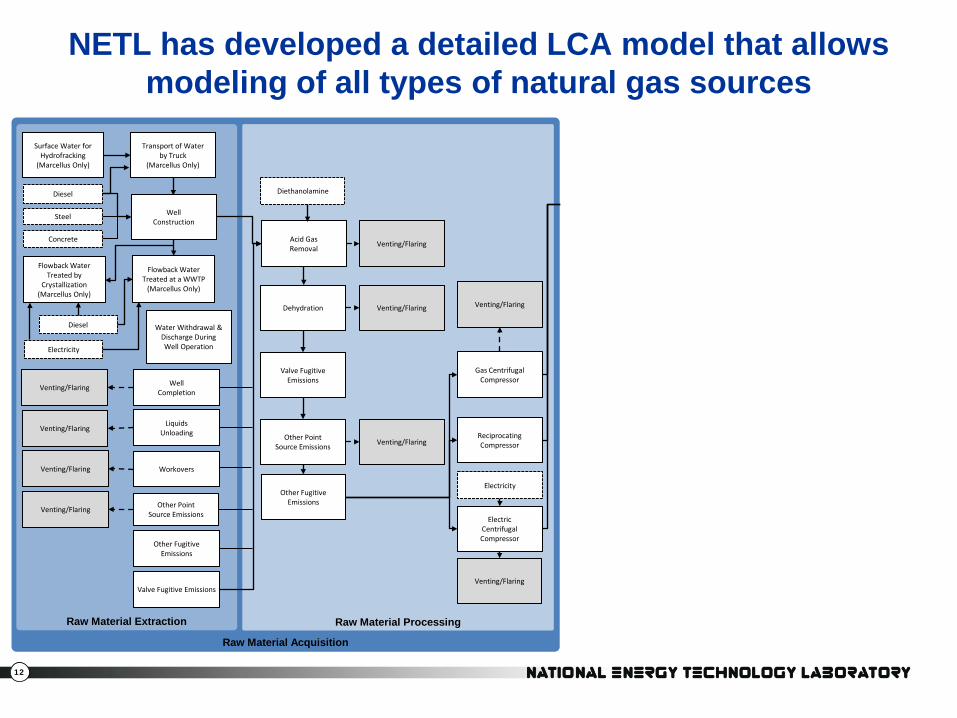
NETL has developed a detailed LCA model that allows modeling of all types of natural gas sources
Raw Material Acquisition
Raw Material Processing Raw Material Extraction
Energy Conversion Facility Product
Transport
Raw Material Transport
Pipeline Operation (Energy &
Combustion Emissions)
Plant Operation
Plant Construction
Pipeline Construction
Trunkline Operation
Switchyard and Trunkline Construction
Transmission & Distribution
CCUS Operation
CCUS Construction
Gas Centrifugal Compressor
Valve Fugitive Emissions
Dehydration
Acid Gas Removal
Reciprocating Compressor
Electric Centrifugal Compressor
Liquids Unloading Venting/Flaring
Workovers Venting/Flaring
Other Point Source Emissions Venting/Flaring
Other Fugitive Emissions
Venting/Flaring
Venting/Flaring
Well Construction
Well Completion Venting/Flaring
Other Point Source Emissions Venting/Flaring
Other Fugitive Emissions
Valve Fugitive Emissions
Venting/Flaring
Venting/Flaring
Diesel
Steel
Concrete
Surface Water for Hydrofracking
(Marcellus Only)
Transport of Water by Truck
(Marcellus Only)
Flowback Water Treated at a WWTP
(Marcellus Only)
Diethanolamine
Steel
Concrete
Electricity
Cast Iron
Steel
Concrete
Electricity
Pipeline Operation
(Fugitive Methane) Flowback Water
Treated by Crystallization
(Marcellus Only)
Diesel
Electricity
Water Withdrawal & Discharge During Well Operation
Aluminum
Diesel
End Use
End Use (Assume 100%
Efficient)
13 13
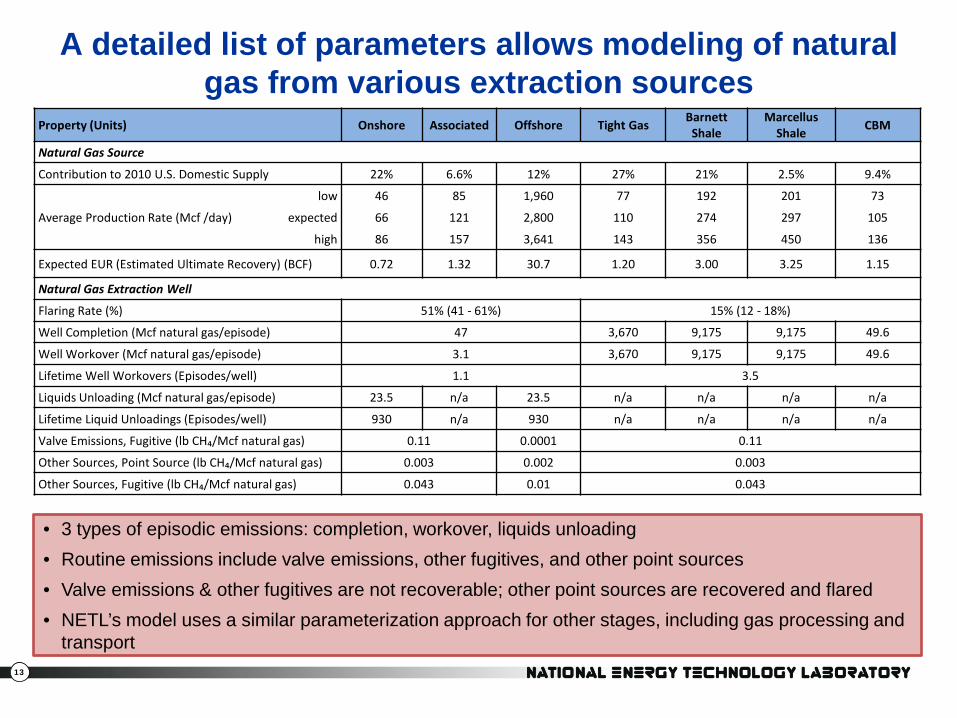
A detailed list of parameters allows modeling of natural gas from various extraction sources
• 3 types of episodic emissions: completion, workover, liquids unloading • Routine emissions include valve emissions, other fugitives, and other point sources • Valve emissions & other fugitives are not recoverable; other point sources are recovered and flared • NETL’s model uses a similar parameterization approach for other stages, including gas processing and
transport
Property (Units) Onshore Associated Offshore Tight Gas Barnett Shale
Marcellus Shale CBM
Natural Gas Source Contribution to 2010 U.S. Domestic Supply 22% 6.6% 12% 27% 21% 2.5% 9.4%
Average Production Rate (Mcf /day) low 46 85 1,960 77 192 201 73
expected 66 121 2,800 110 274 297 105 high 86 157 3,641 143 356 450 136
Expected EUR (Estimated Ultimate Recovery) (BCF) 0.72 1.32 30.7 1.20 3.00 3.25 1.15
Natural Gas Extraction Well Flaring Rate (%) 51% (41 - 61%) 15% (12 - 18%) Well Completion (Mcf natural gas/episode) 47 3,670 9,175 9,175 49.6
Well Workover (Mcf natural gas/episode) 3.1 3,670 9,175 9,175 49.6
Lifetime Well Workovers (Episodes/well) 1.1 3.5 Liquids Unloading (Mcf natural gas/episode) 23.5 n/a 23.5 n/a n/a n/a n/a Lifetime Liquid Unloadings (Episodes/well) 930 n/a 930 n/a n/a n/a n/a Valve Emissions, Fugitive (lb CH₄/Mcf natural gas) 0.11 0.0001 0.11 Other Sources, Point Source (lb CH₄/Mcf natural gas) 0.003 0.002 0.003 Other Sources, Fugitive (lb CH₄/Mcf natural gas) 0.043 0.01 0.043
14 14
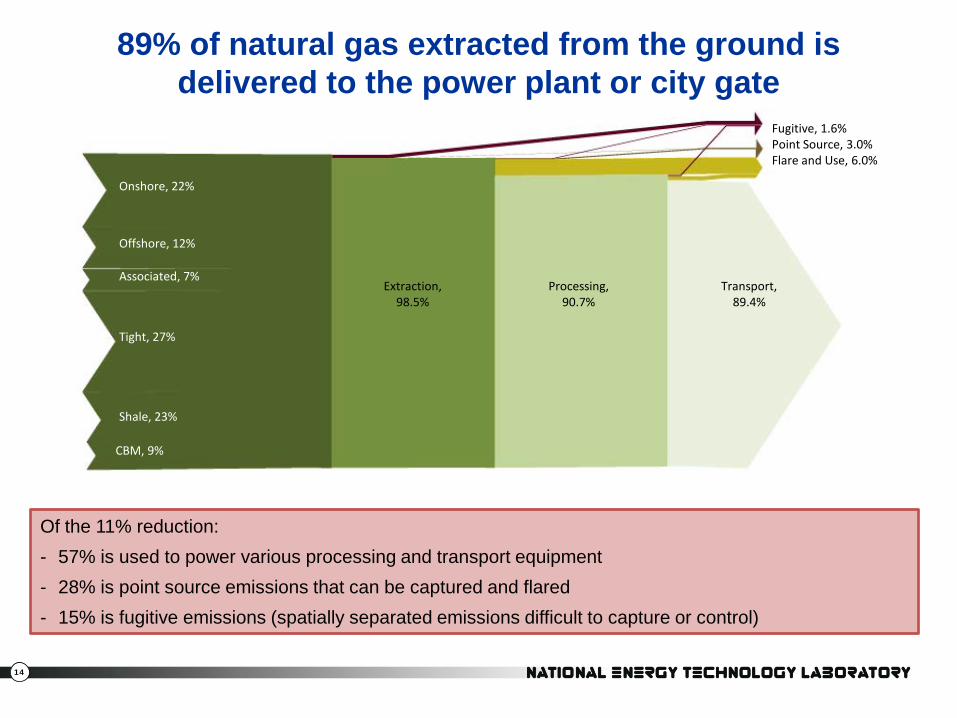
89% of natural gas extracted from the ground is delivered to the power plant or city gate
Of the 11% reduction: - 57% is used to power various processing and transport equipment - 28% is point source emissions that can be captured and flared - 15% is fugitive emissions (spatially separated emissions difficult to capture or control)
Onshore, 22%
Transport, 89.4%
Associated, 7%
Offshore, 12%
Tight, 27%
Shale, 23%
CBM, 9%
Processing, 90.7%
Extraction, 98.5%
Fugitive, 1.6% Point Source, 3.0% Flare and Use, 6.0%
15 15
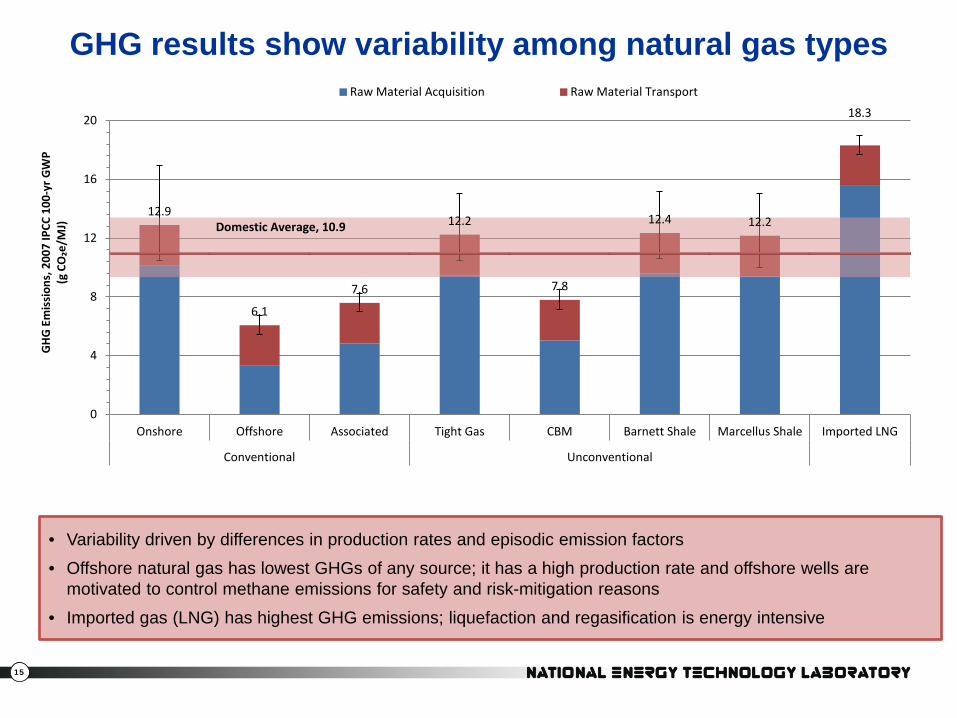
GHG results show variability among natural gas types
• Variability driven by differences in production rates and episodic emission factors
• Offshore natural gas has lowest GHGs of any source; it has a high production rate and offshore wells are motivated to control methane emissions for safety and risk-mitigation reasons
• Imported gas (LNG) has highest GHG emissions; liquefaction and regasification is energy intensive
12.9
6.1
7.6
12.2
7.8
12.4 12.2
18.3
0
4
8
12
16
20
Onshore Offshore Associated Tight Gas CBM Barnett Shale Marcellus Shale Imported LNG
Conventional Unconventional
GH
G E
mis
sion
s, 2
007
IPCC
100
-yr G
WP
(g C
O₂e
/MJ)
Raw Material Acquisition Raw Material Transport
Domestic Average, 10.9
16 16
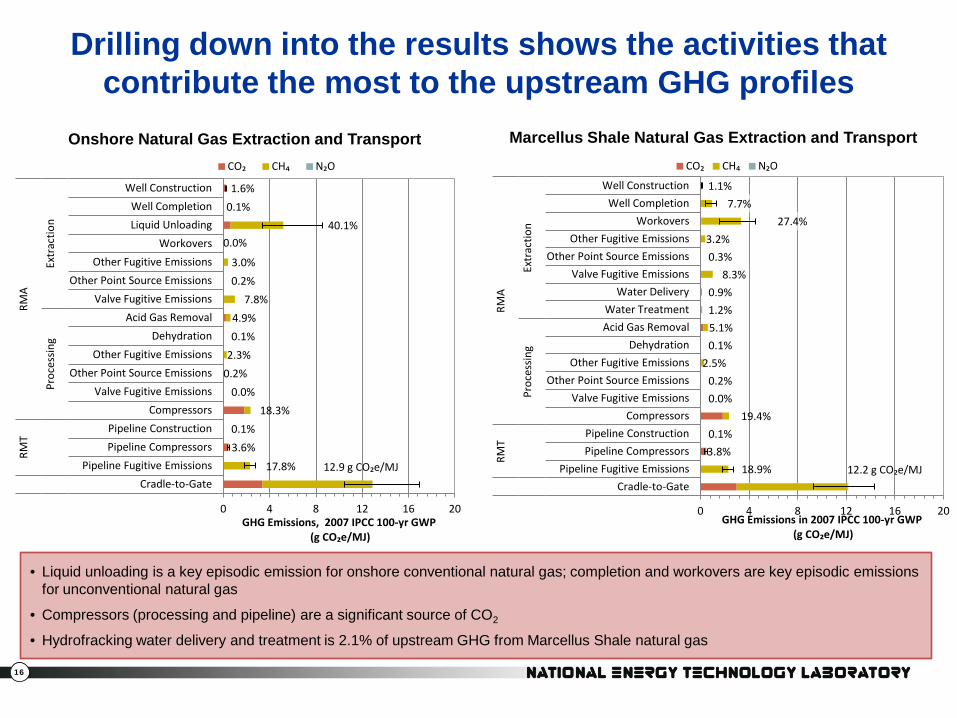
Drilling down into the results shows the activities that contribute the most to the upstream GHG profiles
• Liquid unloading is a key episodic emission for onshore conventional natural gas; completion and workovers are key episodic emissions for unconventional natural gas
• Compressors (processing and pipeline) are a significant source of CO2
• Hydrofracking water delivery and treatment is 2.1% of upstream GHG from Marcellus Shale natural gas
Onshore Natural Gas Extraction and Transport Marcellus Shale Natural Gas Extraction and Transport
12.9 g CO₂e/MJ 17.8%
3.6% 0.1%
18.3% 0.0%
0.2% 2.3% 0.1% 4.9%
7.8% 0.2% 3.0%
0.0% 40.1%
0.1% 1.6%
0 4 8 12 16 20
Cradle-to-Gate Pipeline Fugitive Emissions
Pipeline Compressors Pipeline Construction
Compressors Valve Fugitive Emissions
Other Point Source Emissions Other Fugitive Emissions
Dehydration Acid Gas Removal
Valve Fugitive Emissions Other Point Source Emissions
Other Fugitive Emissions Workovers
Liquid Unloading Well Completion
Well Construction
Proc
essin
g Ex
trac
tion
RMT
RMA
GHG Emissions, 2007 IPCC 100-yr GWP
(g CO₂e/MJ)
CO₂ CH₄ N₂O
12.2 g CO₂e/MJ 18.9% 3.8% 0.1%
19.4% 0.0% 0.2%
2.5% 0.1% 5.1% 1.2% 0.9%
8.3% 0.3% 3.2%
27.4% 7.7%
1.1%
0 4 8 12 16 20
Cradle-to-Gate Pipeline Fugitive Emissions
Pipeline Compressors Pipeline Construction
Compressors Valve Fugitive Emissions
Other Point Source Emissions Other Fugitive Emissions
Dehydration Acid Gas Removal Water Treatment
Water Delivery Valve Fugitive Emissions
Other Point Source Emissions Other Fugitive Emissions
Workovers Well Completion
Well Construction
Proc
essin
g Ex
trac
tion
RMT
RMA
GHG Emissions in 2007 IPCC 100-yr GWP (g CO₂e/MJ)
CO₂ CH₄ N₂O
17 17
1.1%
-1.2%
2.5%
-5.1%
7.7%
8.3%
23.8%
27.4%
27.4%
-35.9%
-60% -40% -20% 0% 20% 40% 60%
Well Depth
Processing Flare Rate
Other Fugitives, Processing
Extraction Flare Rate
Completion Vent Rate
Pneum. Vent Rate, Extraction
Pipeline Distance
Workover Vent Rate
Workover Frequency
Production Rate
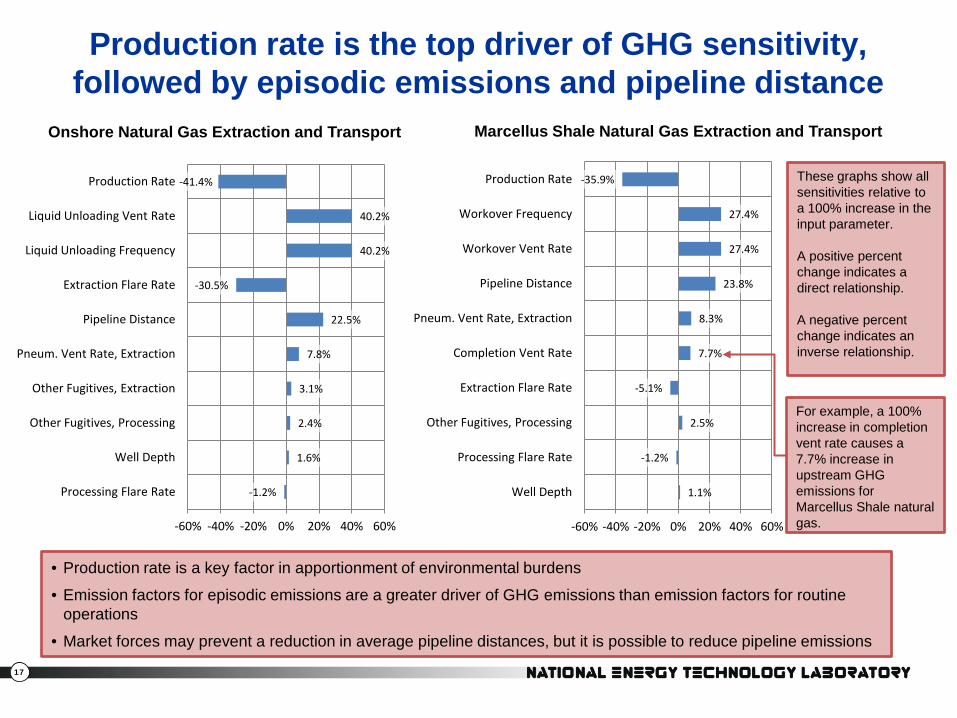
Production rate is the top driver of GHG sensitivity, followed by episodic emissions and pipeline distance
• Production rate is a key factor in apportionment of environmental burdens
• Emission factors for episodic emissions are a greater driver of GHG emissions than emission factors for routine operations
• Market forces may prevent a reduction in average pipeline distances, but it is possible to reduce pipeline emissions
These graphs show all sensitivities relative to a 100% increase in the input parameter. A positive percent change indicates a direct relationship. A negative percent change indicates an inverse relationship.
For example, a 100% increase in completion vent rate causes a 7.7% increase in upstream GHG emissions for Marcellus Shale natural gas.
Onshore Natural Gas Extraction and Transport Marcellus Shale Natural Gas Extraction and Transport
-1.2%
1.6%
2.4%
3.1%
7.8%
22.5%
-30.5%
40.2%
40.2%
-41.4%
-60% -40% -20% 0% 20% 40% 60%
Processing Flare Rate
Well Depth
Other Fugitives, Processing
Other Fugitives, Extraction
Pneum. Vent Rate, Extraction
Pipeline Distance
Extraction Flare Rate
Liquid Unloading Frequency
Liquid Unloading Vent Rate
Production Rate
18 18
Production rates for onshore conventional wells are variable, while Marcellus performance is uncertain
• What’s a typical well for onshore conv. production? – 479,000 conventional onshore wells in the U.S. – With respect to well count, the average well produces
70 Mcf/day – With respect to contribution to total production, the
average well produces ~500 Mcf/day • There’s no historical data for Marcellus production
– Current data support estimated ultimate recoveries of 3.2 BCF/well life
– Recent USGS data suggest that ultimate recoveries could be closer to 2.0 BCF/well life
19 19
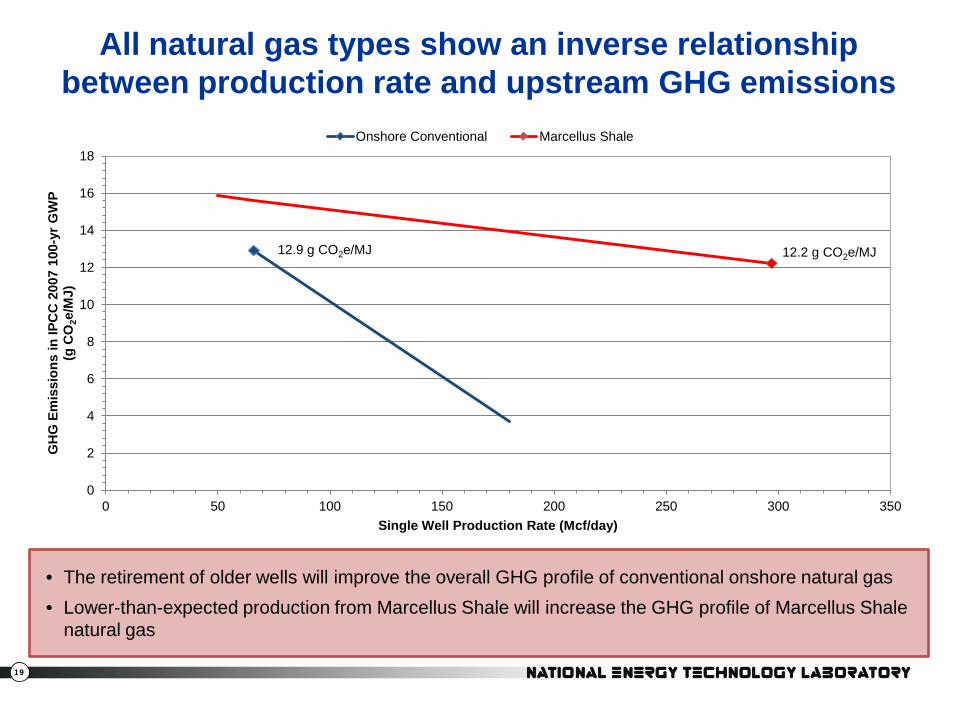
All natural gas types show an inverse relationship between production rate and upstream GHG emissions
• The retirement of older wells will improve the overall GHG profile of conventional onshore natural gas • Lower-than-expected production from Marcellus Shale will increase the GHG profile of Marcellus Shale
natural gas
12.9 g CO2e/MJ 12.2 g CO2e/MJ
0
2
4
6
8
10
12
14
16
18
0 50 100 150 200 250 300 350
GH
G E
mis
sion
s in
IPC
C 2
007
100-
yr G
WP
(g
CO
2e/M
J)
Single Well Production Rate (Mcf/day)
Onshore Conventional Marcellus Shale
20 20
How will new regulations and voluntary emission reductions change the
environmental profile of natural gas?
21 21
EPA New Source Performance Standards (NSPS) regulate VOC emissions from the oil and gas sector
• Final NSPS rule established August 16, 2012 • Methane is key VOC from natural gas extraction and processing • NSPS regulates emissions from:
– Well completions and workovers – Centrifugal compressors – Reciprocating compressors – Storage tanks – Pneumatic controllers
• NSPS does not regulate emissions from: – Liquid unloading from conventional wells – Compressors used for pipeline transmission
22 22
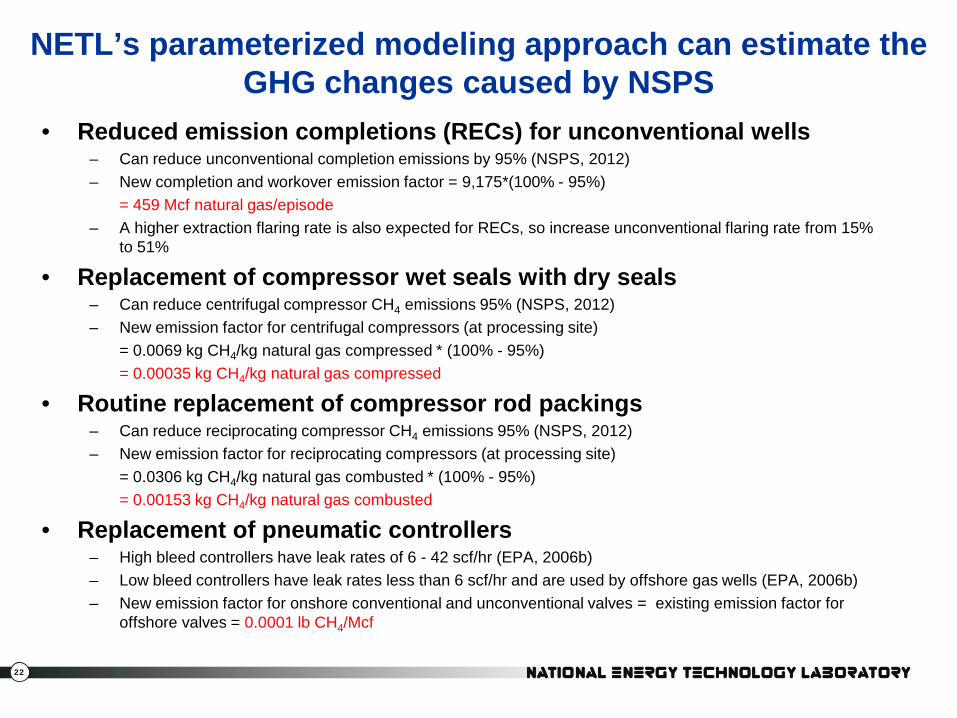
NETL’s parameterized modeling approach can estimate the GHG changes caused by NSPS
• Reduced emission completions (RECs) for unconventional wells – Can reduce unconventional completion emissions by 95% (NSPS, 2012) – New completion and workover emission factor = 9,175*(100% - 95%) = 459 Mcf natural gas/episode – A higher extraction flaring rate is also expected for RECs, so increase unconventional flaring rate from 15%
to 51%
• Replacement of compressor wet seals with dry seals – Can reduce centrifugal compressor CH4 emissions 95% (NSPS, 2012) – New emission factor for centrifugal compressors (at processing site) = 0.0069 kg CH4/kg natural gas compressed * (100% - 95%) = 0.00035 kg CH4/kg natural gas compressed
• Routine replacement of compressor rod packings – Can reduce reciprocating compressor CH4 emissions 95% (NSPS, 2012) – New emission factor for reciprocating compressors (at processing site) = 0.0306 kg CH4/kg natural gas combusted * (100% - 95%) = 0.00153 kg CH4/kg natural gas combusted
• Replacement of pneumatic controllers – High bleed controllers have leak rates of 6 - 42 scf/hr (EPA, 2006b) – Low bleed controllers have leak rates less than 6 scf/hr and are used by offshore gas wells (EPA, 2006b) – New emission factor for onshore conventional and unconventional valves = existing emission factor for
offshore valves = 0.0001 lb CH4/Mcf
23 23
12.9 11.4
6.1 5.7
7.6 6.1
12.2
6.3 7.8
6.3
12.3
6.4
12.2
6.5
10.9
7.3
0
2
4
6
8
10
12
14
16
18
Curr
ent
NSP
S
NSP
S +
Volu
ntar
y
Curr
ent
NSP
S
NSP
S +
Volu
ntar
y
Curr
ent
NSP
S
NSP
S +
Volu
ntar
y
Curr
ent
NSP
S
NSP
S +
Volu
ntar
y
Curr
ent
NSP
S
NSP
S +
Volu
ntar
y
Curr
ent
NSP
S
NSP
S +
Volu
ntar
y
Curr
ent
NSP
S
NSP
S +
Volu
ntar
y
Curr
ent
NSP
S
NSP
S +
Volu
ntar
y
Onshore Offshore Associated Tight Gas CBM Barnett Shale Marcellus Shale
Conventional Unconventional Domestic Mix (2010)
GHG
Em
issi
ons
in 2
007
IPCC
100
-yr G
WP
(g
CO
₂e/M
J)
NG Acquistion Pipeline Transmission
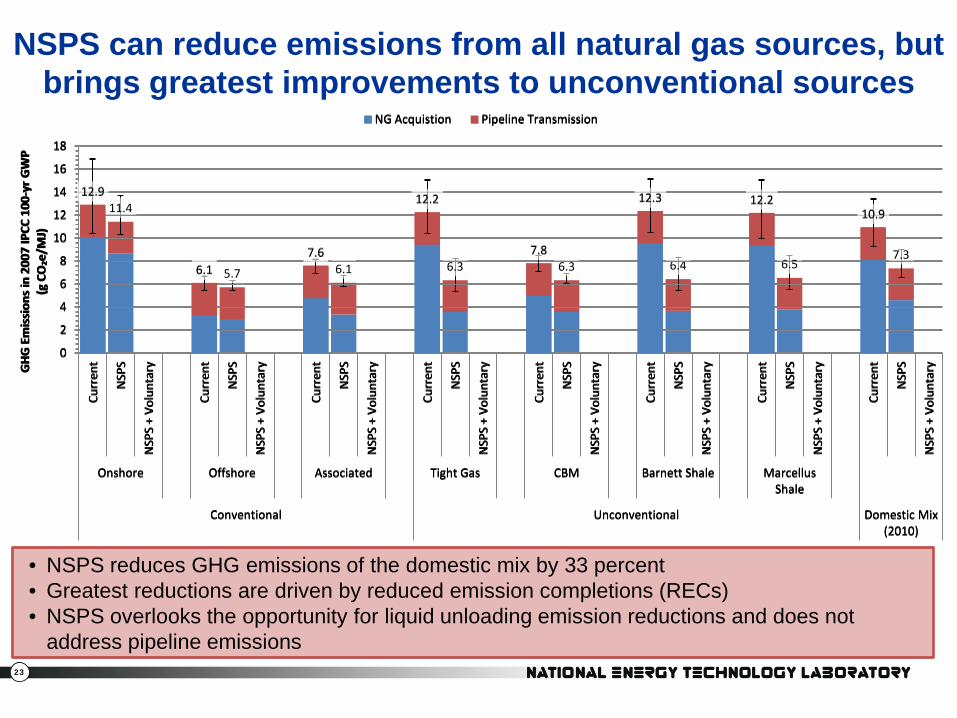
NSPS can reduce emissions from all natural gas sources, but brings greatest improvements to unconventional sources
• NSPS reduces GHG emissions of the domestic mix by 33 percent • Greatest reductions are driven by reduced emission completions (RECs) • NSPS overlooks the opportunity for liquid unloading emission reductions and does not
address pipeline emissions
12.9
6.1 7.6
12.2
7.8
12.3 12.2 10.9
0
2
4
6
8
10
12
14
16
18
Curr
ent
NSP
S
NSP
S +
Volu
ntar
y
Curr
ent
NSP
S
NSP
S +
Volu
ntar
y
Curr
ent
NSP
S
NSP
S +
Volu
ntar
y
Curr
ent
NSP
S
NSP
S +
Volu
ntar
y
Curr
ent
NSP
S
NSP
S +
Volu
ntar
y
Curr
ent
NSP
S
NSP
S +
Volu
ntar
y
Curr
ent
NSP
S
NSP
S +
Volu
ntar
y
Curr
ent
NSP
S
NSP
S +
Volu
ntar
y
Onshore Offshore Associated Tight Gas CBM Barnett Shale Marcellus Shale
Conventional Unconventional Domestic Mix (2010)
GHG
Em
issi
ons
in 2
007
IPCC
100
-yr G
WP
(g
CO
₂e/M
J)
NG Acquistion Pipeline Transmission
24 24
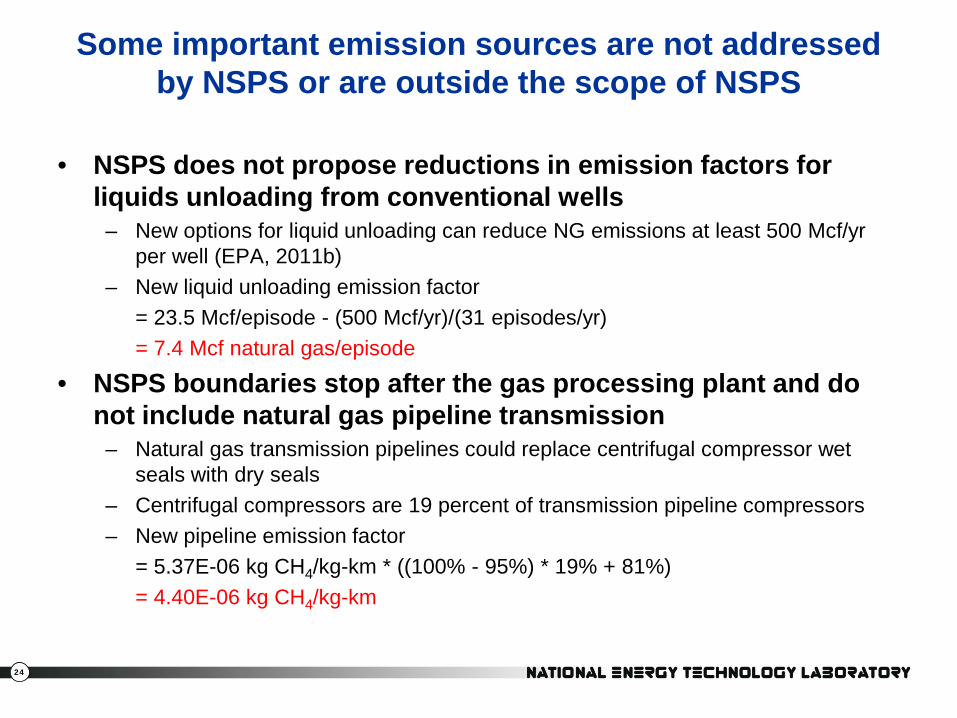
Some important emission sources are not addressed by NSPS or are outside the scope of NSPS
• NSPS does not propose reductions in emission factors for liquids unloading from conventional wells
– New options for liquid unloading can reduce NG emissions at least 500 Mcf/yr per well (EPA, 2011b)
– New liquid unloading emission factor = 23.5 Mcf/episode - (500 Mcf/yr)/(31 episodes/yr) = 7.4 Mcf natural gas/episode
• NSPS boundaries stop after the gas processing plant and do not include natural gas pipeline transmission
– Natural gas transmission pipelines could replace centrifugal compressor wet seals with dry seals
– Centrifugal compressors are 19 percent of transmission pipeline compressors – New pipeline emission factor = 5.37E-06 kg CH4/kg-km * ((100% - 95%) * 19% + 81%) = 4.40E-06 kg CH4/kg-km
25 25
12.9 11.4
6.1 5.7
7.6 6.1
12.2
6.3 7.8
6.3
12.3
6.4
12.2
6.5
10.9
7.3
0
2
4
6
8
10
12
14
16
18
Curr
ent
NSP
S
NSP
S +
Volu
ntar
y
Curr
ent
NSP
S
NSP
S +
Volu
ntar
y
Curr
ent
NSP
S
NSP
S +
Volu
ntar
y
Curr
ent
NSP
S
NSP
S +
Volu
ntar
y
Curr
ent
NSP
S
NSP
S +
Volu
ntar
y
Curr
ent
NSP
S
NSP
S +
Volu
ntar
y
Curr
ent
NSP
S
NSP
S +
Volu
ntar
y
Curr
ent
NSP
S
NSP
S +
Volu
ntar
y
Onshore Offshore Associated Tight Gas CBM Barnett Shale Marcellus Shale
Conventional Unconventional Domestic Mix (2010)
GHG
Em
issi
ons
in 2
007
IPCC
100
-yr G
WP
(g
CO
₂e/M
J)
NG Acquistion Pipeline Transmission
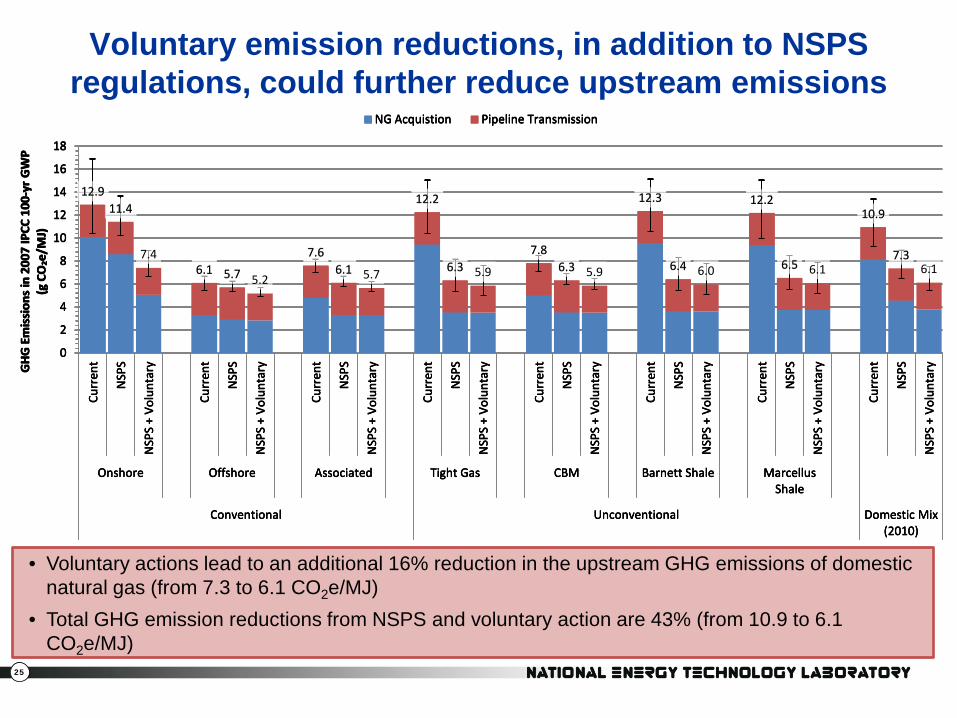
Voluntary emission reductions, in addition to NSPS regulations, could further reduce upstream emissions
• Voluntary actions lead to an additional 16% reduction in the upstream GHG emissions of domestic natural gas (from 7.3 to 6.1 CO2e/MJ)
• Total GHG emission reductions from NSPS and voluntary action are 43% (from 10.9 to 6.1 CO2e/MJ)
12.9
6.1 7.6
12.2
7.8
12.3 12.2 10.9
0
2
4
6
8
10
12
14
16
18
Curr
ent
NSP
S
NSP
S +
Volu
ntar
y
Curr
ent
NSP
S
NSP
S +
Volu
ntar
y
Curr
ent
NSP
S
NSP
S +
Volu
ntar
y
Curr
ent
NSP
S
NSP
S +
Volu
ntar
y
Curr
ent
NSP
S
NSP
S +
Volu
ntar
y
Curr
ent
NSP
S
NSP
S +
Volu
ntar
y
Curr
ent
NSP
S
NSP
S +
Volu
ntar
y
Curr
ent
NSP
S
NSP
S +
Volu
ntar
y
Onshore Offshore Associated Tight Gas CBM Barnett Shale Marcellus Shale
Conventional Unconventional Domestic Mix (2010)
GHG
Em
issi
ons
in 2
007
IPCC
100
-yr G
WP
(g
CO
₂e/M
J)
NG Acquistion Pipeline Transmission
12.9 11.4
7.4 6.1 5.7 5.2
7.6 6.1 5.7
12.2
6.3 5.9
7.8 6.3 5.9
12.3
6.4 6.0
12.2
6.5 6.1
10.9
7.3 6.1
0
2
4
6
8
10
12
14
16
18
Curr
ent
NSP
S
NSP
S +
Volu
ntar
y
Curr
ent
NSP
S
NSP
S +
Volu
ntar
y
Curr
ent
NSP
S
NSP
S +
Volu
ntar
y
Curr
ent
NSP
S
NSP
S +
Volu
ntar
y
Curr
ent
NSP
S
NSP
S +
Volu
ntar
y
Curr
ent
NSP
S
NSP
S +
Volu
ntar
y
Curr
ent
NSP
S
NSP
S +
Volu
ntar
y
Curr
ent
NSP
S
NSP
S +
Volu
ntar
y
Onshore Offshore Associated Tight Gas CBM Barnett Shale Marcellus Shale
Conventional Unconventional Domestic Mix (2010)
GHG
Em
issi
ons
in 2
007
IPCC
100
-yr G
WP
(g
CO
₂e/M
J)
NG Acquistion Pipeline Transmission

26 26
Conclusions
• LCA is a valuable tool for identifying opportunities for improvement in a supply chain
• Methane emissions from natural gas acquisition and delivery can be reduced with existing, cost-effective technologies
• Greatest opportunities for upstream GHG emission reductions are the development of productive wells, capture of episodic emissions, and prevention of pipeline emissions
• Some emission reductions will be achieved through regulations, while others will be voluntary
• If new wells are not developed and methane capture technologies are not implemented, the average GHG profile of natural gas will increase

27 27
What about the rest of the life cycle?
28 28
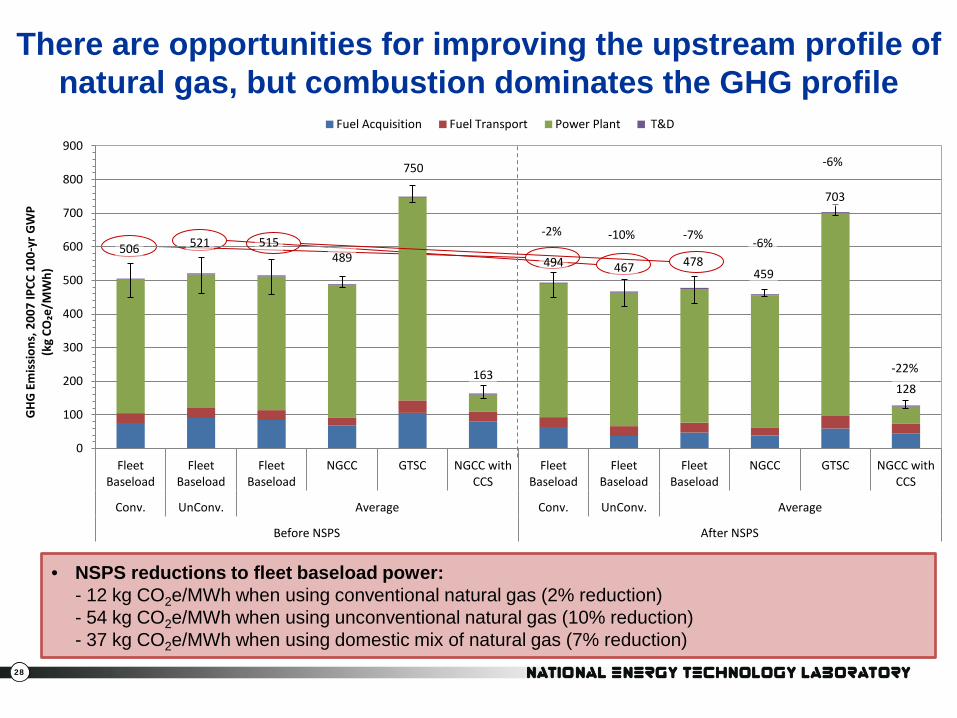
There are opportunities for improving the upstream profile of natural gas, but combustion dominates the GHG profile
• NSPS reductions to fleet baseload power: - 12 kg CO2e/MWh when using conventional natural gas (2% reduction) - 54 kg CO2e/MWh when using unconventional natural gas (10% reduction) - 37 kg CO2e/MWh when using domestic mix of natural gas (7% reduction)
506 521 515 489
750
163
494 467 478 459
703
128
-2% -10% -7% -6%
-6%
-22%
0
100
200
300
400
500
600
700
800
900
Fleet Baseload
Fleet Baseload
Fleet Baseload
NGCC GTSC NGCC with CCS
Fleet Baseload
Fleet Baseload
Fleet Baseload
NGCC GTSC NGCC with CCS
Conv. UnConv. Average Conv. UnConv. Average
Before NSPS After NSPS
GHG
Em
issi
ons,
200
7 IP
CC 1
00-y
r GW
P (k
g CO
₂e/M
Wh)
Fuel Acquisition Fuel Transport Power Plant T&D
29 29
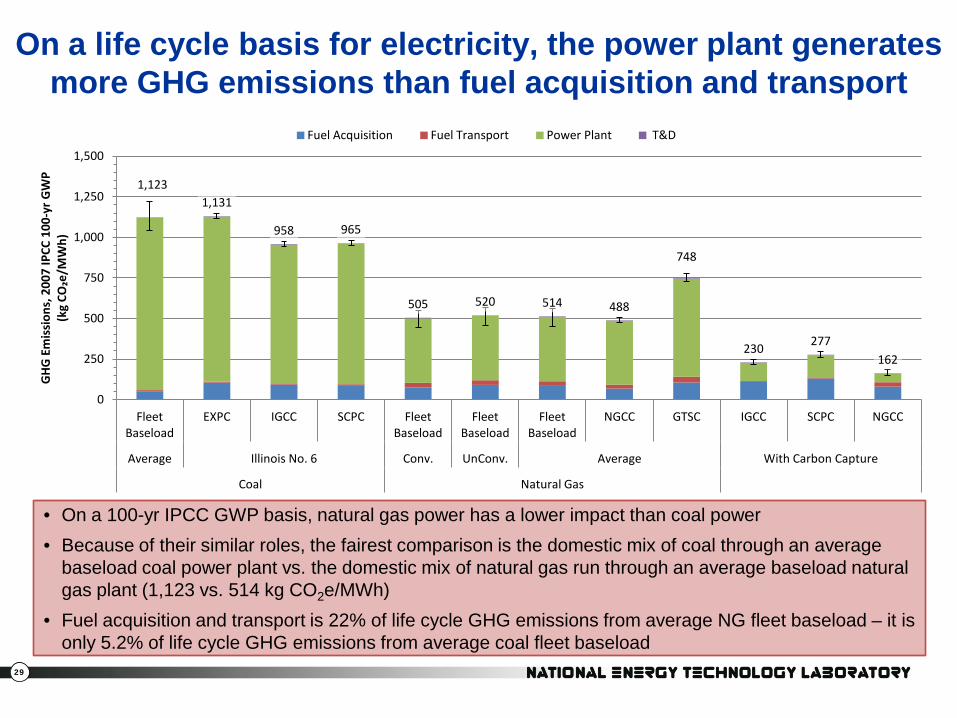
On a life cycle basis for electricity, the power plant generates more GHG emissions than fuel acquisition and transport
• On a 100-yr IPCC GWP basis, natural gas power has a lower impact than coal power • Because of their similar roles, the fairest comparison is the domestic mix of coal through an average
baseload coal power plant vs. the domestic mix of natural gas run through an average baseload natural gas plant (1,123 vs. 514 kg CO2e/MWh)
• Fuel acquisition and transport is 22% of life cycle GHG emissions from average NG fleet baseload – it is only 5.2% of life cycle GHG emissions from average coal fleet baseload
1,123 1,131
958 965
505 520 514 488
748
230 277 162
0
250
500
750
1,000
1,250
1,500
Fleet Baseload
EXPC IGCC SCPC Fleet Baseload
Fleet Baseload
Fleet Baseload
NGCC GTSC IGCC SCPC NGCC
Average Illinois No. 6 Conv. UnConv. Average With Carbon Capture
Coal Natural Gas
GHG
Em
issi
ons,
200
7 IP
CC 1
00-y
r GW
P (k
g CO
₂e/M
Wh)
Fuel Acquisition Fuel Transport Power Plant T&D
30 30
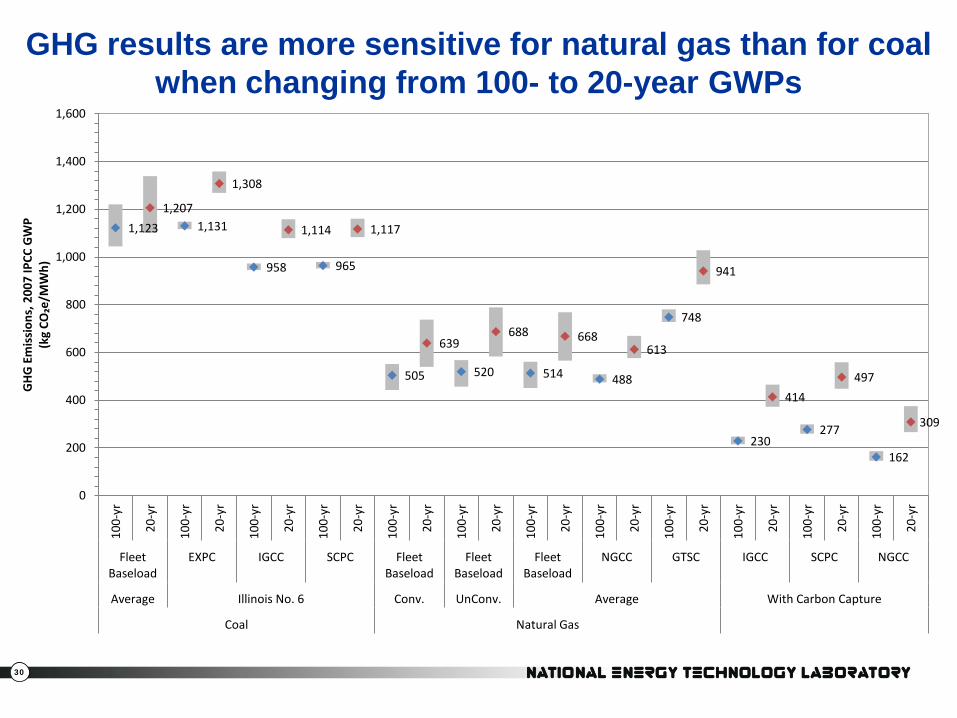
GHG results are more sensitive for natural gas than for coal when changing from 100- to 20-year GWPs
1,123 1,207
1,131
1,308
958
1,114
965
1,117
505
639
520
688
514
668
488
613
748
941
230
414
277
497
162
309
0
200
400
600
800
1,000
1,200
1,400
1,600 10
0-yr
20-y
r
100-
yr
20-y
r
100-
yr
20-y
r
100-
yr
20-y
r
100-
yr
20-y
r
100-
yr
20-y
r
100-
yr
20-y
r
100-
yr
20-y
r
100-
yr
20-y
r
100-
yr
20-y
r
100-
yr
20-y
r
100-
yr
20-y
r
Fleet Baseload
EXPC IGCC SCPC Fleet Baseload
Fleet Baseload
Fleet Baseload
NGCC GTSC IGCC SCPC NGCC
Average Illinois No. 6 Conv. UnConv. Average With Carbon Capture
Coal Natural Gas
GHG
Em
issi
ons,
200
7 IP
CC G
WP
(kg
CO₂e
/MW
h)

31 31
Bottom Line: Combustion Emissions Still Matter Most
• Upstream emission reductions are a near term opportunity, but CO₂ from combustion remains the largest contributor to the GHG emissions from natural gas power
– Best case regulatory approaches reduce life cycle GHG emissions of baseload natural gas power by only 7%
– Difficult to improve upon efficiency of combined cycle power plants
– After upstream GHG reductions have been made, CO2 capture, utilization and storage (CCUS) will be the next step toward reductions in the life cycle GHGs from natural gas power
32 32
References Baker-Hughes. (2012). North America Rotary Rig Counts: Baker Hughes Incorporated.
Dennis, S. M. (2005). Improved Estimates of Ton-Miles. Journal of Transportation and Statistics, Volume 8, Number 1. U.S. Department of Transportation, Research and Innovative Technology Administration, Bureau of Transportation Statistics.
EIA. (2010). United States Distribution of Wells by Production. U.S. Energy Information Administration Retrieved July 19, 2011, from http://www.eia.gov/pub/oil_gas/petrosystem/us_table.html
EIA. (2011). Natural Gas Gross Withdrawals and Production. U.S. Energy Information Administration Retrieved April 5, 2011, from http://www.eia.doe.gov/dnav/ng/ng_prod_sum_a_EPG0_VRN_mmcf_a.htm
EIA. (2012a). AEO2012 Early Release Overview. (DOE/EIA-0383ER(2012)). Washington, DC: U.S. Energy Information Administration Retrieved April 17, 2012, from http://www.eia.gov/forecasts/aeo/er/early_intensity.cfmEIA. (2011d). Weekly Natural Gas Storage Report: U.S. Department of Energy, Energy Information Administration.
Engelder, T. (2009, August). Marcellus 2008: Report Card on the Breakout Year for Gas Production in the Appalachian Basin. Fort Worth Basin Oil and Gas Magazine, 18-22.
EPA. (1995). Compilation of Air Pollutant Emission Factors, Volume I: Stationary Point and Area Sources. (AP-42). Research Triangle Park, NC: U.S. Environmental Protection Agency, Office of Air Quality Planning and Standards Retrieved May 18, 2010, from http://www.epa.gov/ttnchie1/ap42
EPA. (2006b). Options for Reducing Methane Emissions from Pneumatic Devices in the Natural Gas Industry. U.S. Environmental Protection Agency. Washington, D.C. Retrieved August 22, 2012 from http://www.epa.gov/gasstar/documents/ll_pneumatics.pdf
EPA. (2006c). Convert Gas Pneumatic Controls To Instrument Air. U.S. Environmental Protection Agency. Washington, D.C. Retrieved August 17, 2012 from http://www.epa.gov/gasstar/documents/ll_instrument_air.pdf
EPA. (2006b). Convert Gas Pneumatic Controls To Instrument Air. U.S. Environmental Protection Agency. Washington, D.C. Retrieved August 17, 2012 from http://www.epa.gov/gasstar/documents/ll_instrument_air.pdf
EPA. (2010). Emissions & Generation Resource Integrated Database (eGrid). from United States Environmental Protection Agency http://www.epa.gov/cleanenergy/energy-resources/egrid/
EPA. (2011). Inventory of U.S. Greenhouse Gas Emissions and Sinks: 1990-2009. (EPA 430-R-11-005). Washington, D.C. Environmental Protection Agency, Retrieved August 23, 2011, from http://epa.gov/climatechange/emissions/usinventoryreport.html
EPA. (2011b). Reduced Emissions Completions for Hydraulically Fractured Natural Gas Wells. U.S. Environmental Protection Agency. Washington, D.C. Retrieved August 17, 2012 from http://www.epa.gov/gasstar/documents/reduced_emissions_completions.pdf
EPA. (2011c). Options for Removing Accumulated Fluid and Improving Flow in Gas Wells . U.S. Environmental Protection Agency. Washington, D.C. Retrieved August 17, 2012 from http://www.epa.gov/gasstar/documents/ll_options.pdf
FERC. (2010). Federal Energy Regulatory Commission: Form 2/2A - Major and Non-major Natural Gas Pipeline Annual Report: Data (Current and Historical) Retrieved August 23, 2011, from http://www.ferc.gov/docs-filing/forms/form-2/data.asp
Hedman, B. (2008). Waste Energy Recovery Opportunities for Interstate Natural Gas Pipelines. Interstate Natural Gas Association of America Retrieved July 25, 2011, from http://www.ingaa.org/File.aspx?id=6210
NETL. (2010a). Cost and Performance Baseline for Fossil Energy Plants, Volume 1: Bituminous Coal and Natural Gas to Electricity (Revision 2 ed.): U.S. Department of Energy, National Energy Technology Laboratory.
Pierce, B., Colman, J., & Demas, A. (2011). USGS Releases New Assessment of Gas Resources in the Marcellus Shale, Appalachian Basin. USGS. Retrieved May 18, 2012, from http://www.usgs.gov/newsroom/article.asp?ID=2893

33 33
Contact Information
Timothy J. Skone, P.E. Senior Environmental Engineer Office of Strategic Energy Analysis and Planning (412) 386-4495 [email protected]
Robert James, Ph.D. General Engineer Office of Strategic Energy Analysis and Planning (304) 285-4309 [email protected]
Joe Marriott, Ph.D. Lead Associate Booz Allen Hamilton (412) 386-7557 [email protected]
James Littlefield Associate Booz Allen Hamilton (412) 386-7560 [email protected]
NETL www.netl.doe.gov
Office of Fossil Energy www.fe.doe.gov
34 34
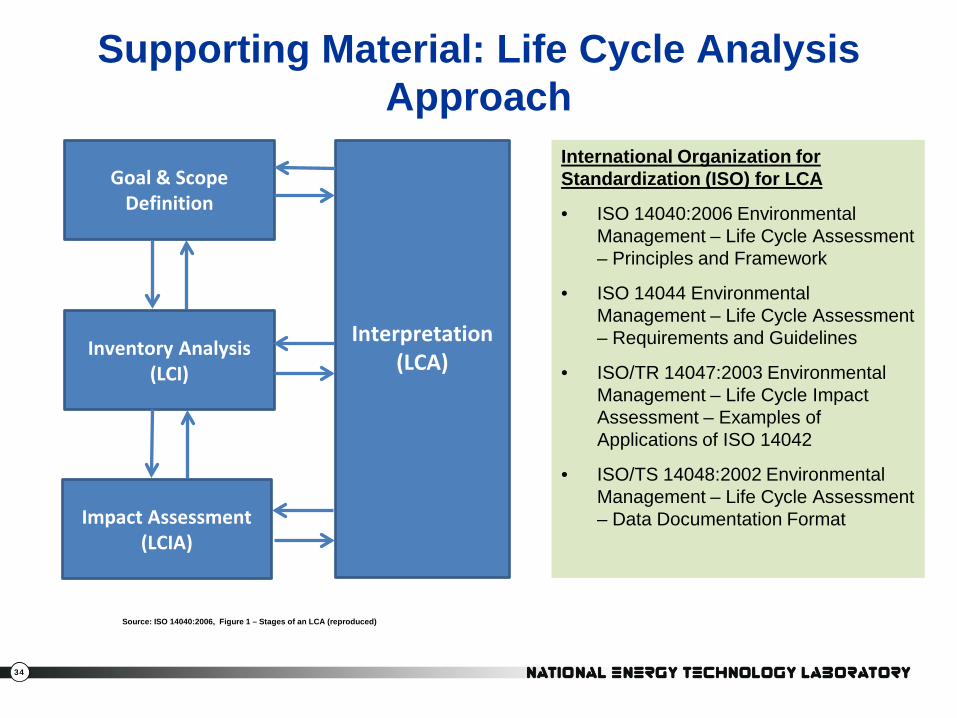
Supporting Material: Life Cycle Analysis Approach
International Organization for Standardization (ISO) for LCA
• ISO 14040:2006 Environmental Management – Life Cycle Assessment – Principles and Framework
• ISO 14044 Environmental Management – Life Cycle Assessment – Requirements and Guidelines
• ISO/TR 14047:2003 Environmental Management – Life Cycle Impact Assessment – Examples of Applications of ISO 14042
• ISO/TS 14048:2002 Environmental Management – Life Cycle Assessment – Data Documentation Format
Goal & Scope Definition
Impact Assessment (LCIA)
Inventory Analysis (LCI)
Interpretation (LCA)
Source: ISO 14040:2006, Figure 1 – Stages of an LCA (reproduced)
35 35
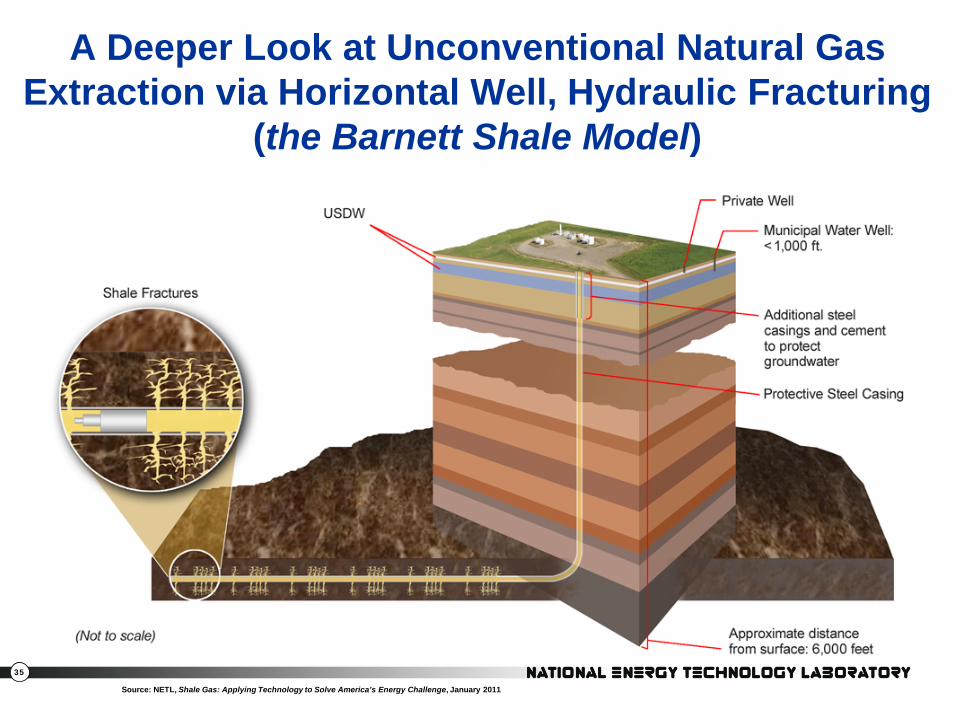
A Deeper Look at Unconventional Natural Gas Extraction via Horizontal Well, Hydraulic Fracturing
(the Barnett Shale Model)
Source: NETL, Shale Gas: Applying Technology to Solve America’s Energy Challenge, January 2011
36 36
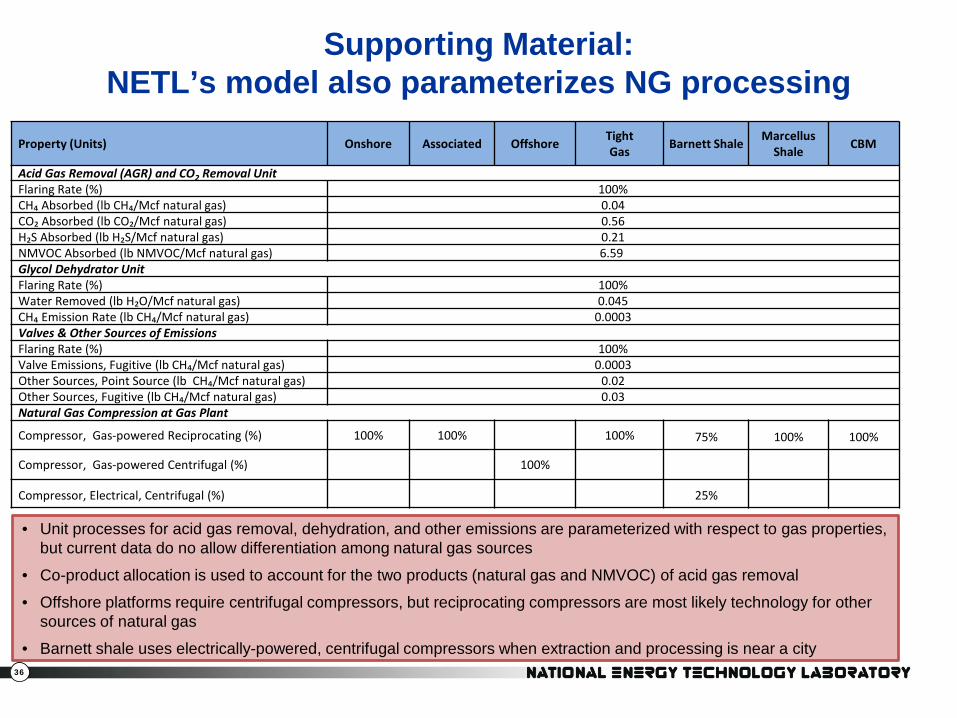
Supporting Material: NETL’s model also parameterizes NG processing
• Unit processes for acid gas removal, dehydration, and other emissions are parameterized with respect to gas properties, but current data do no allow differentiation among natural gas sources
• Co-product allocation is used to account for the two products (natural gas and NMVOC) of acid gas removal
• Offshore platforms require centrifugal compressors, but reciprocating compressors are most likely technology for other sources of natural gas
• Barnett shale uses electrically-powered, centrifugal compressors when extraction and processing is near a city
Property (Units) Onshore Associated Offshore Tight Gas Barnett Shale Marcellus
Shale CBM
Acid Gas Removal (AGR) and CO2 Removal Unit Flaring Rate (%) 100% CH₄ Absorbed (lb CH₄/Mcf natural gas) 0.04 CO₂ Absorbed (lb CO₂/Mcf natural gas) 0.56 H₂S Absorbed (lb H₂S/Mcf natural gas) 0.21 NMVOC Absorbed (lb NMVOC/Mcf natural gas) 6.59 Glycol Dehydrator Unit Flaring Rate (%) 100% Water Removed (lb H₂O/Mcf natural gas) 0.045 CH₄ Emission Rate (lb CH₄/Mcf natural gas) 0.0003 Valves & Other Sources of Emissions Flaring Rate (%) 100% Valve Emissions, Fugitive (lb CH₄/Mcf natural gas) 0.0003 Other Sources, Point Source (lb CH₄/Mcf natural gas) 0.02 Other Sources, Fugitive (lb CH₄/Mcf natural gas) 0.03 Natural Gas Compression at Gas Plant
Compressor, Gas-powered Reciprocating (%) 100% 100% 100% 75% 100% 100%
Compressor, Gas-powered Centrifugal (%) 100%
Compressor, Electrical, Centrifugal (%) 25%

37 37
Supporting Detail: Onshore conventional wells exhibit the most variability in production rates
0%
2%
4%
6%
8%
10%
12%
14%
16%
0-1 1-2 2-4 4-6 6-8 8-10 10-12 12-15 15 - 20 20 - 25 25 - 30 30 - 40 40 - 50 50 - 100 100 - 200
200 - 400
400 - 800
800 - 1600
1600 - 3200
3200 - 6400
6400 - 12800
> 12800
Con
trib
utio
n to
Tot
al
U.S
. Ons
hore
Pro
duct
ion
Production Rate Bracket (BOE/day)
The 25-30 BOE bracket is representative of an
average onshore conventional well
The 100-200 BOE bracket is representative
of an average unit of onshore conventional
natural gas
• Low production rate brackets have a high well count; high production rate brackets have a low well count • As old wells are retired, the average production rate will be more representative of the higher production
rate brackets
• Historical data not available for Marcellus Shale • Current estimated ultimate recoveries (EUR) for Marcellus Shale wells are 3.2 BCF, but could be closer to
2 BCF (Pierce et al., 2012)
Source: EIA, 2010 (United States Distribution of Wells by Production)

38
Supporting Material: In contrast to the unit processes for extraction and
processing, pipeline transport is based on national data • National methane emissions from natural gas pipeline transmission
(EPA, 2011) – Emethane = 2.12 billion kg CH4/yr
• National natural gas consumption (EIA, 2011) – NGconsumption = 21.8 MMBtu/yr
• Methane emission factor from pipeline operations – National ton-miles of natural gas transmission (Dennis, 2005 and EPA, 2011) – Fuel consumed by pipeline companies (FERC, 2010) – Methane emission factor for natural gas combustion in reciprocating compressors and gas
turbines used by centrifugal compressors (EPA, 1995) – Percent split between pipeline compressor types (Hedman, 2008) – EFmethane = 9.97E-05 kg CH4/MMBtu-km
39 39
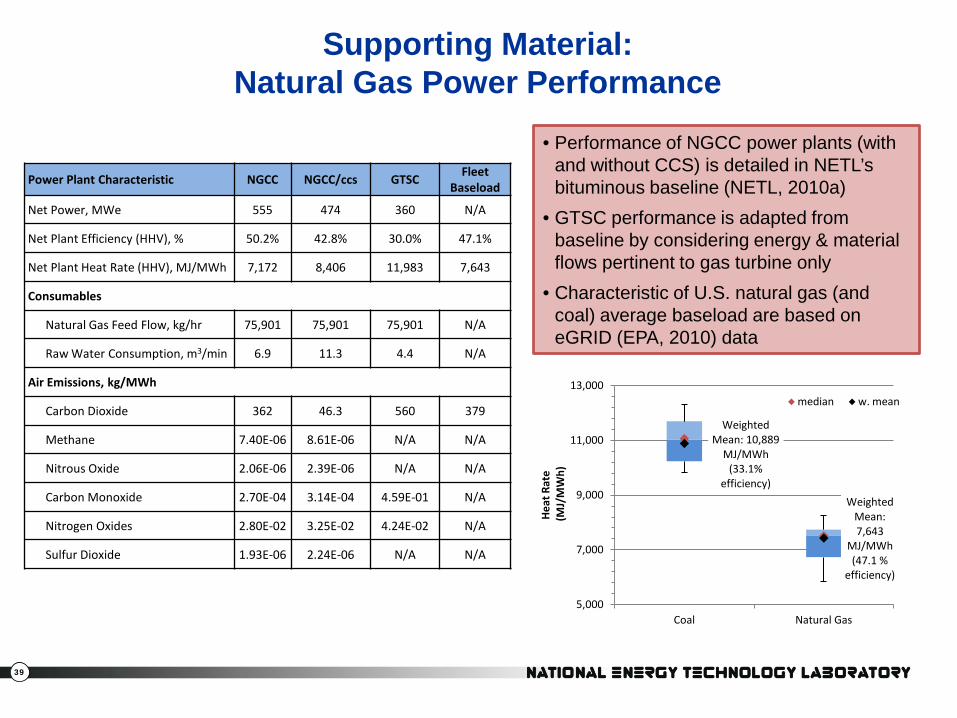
Supporting Material: Natural Gas Power Performance
• Performance of NGCC power plants (with and without CCS) is detailed in NETL’s bituminous baseline (NETL, 2010a)
• GTSC performance is adapted from baseline by considering energy & material flows pertinent to gas turbine only
• Characteristic of U.S. natural gas (and coal) average baseload are based on eGRID (EPA, 2010) data
Power Plant Characteristic NGCC NGCC/ccs GTSC Fleet Baseload
Net Power, MWe 555 474 360 N/A
Net Plant Efficiency (HHV), % 50.2% 42.8% 30.0% 47.1%
Net Plant Heat Rate (HHV), MJ/MWh 7,172 8,406 11,983 7,643
Consumables
Natural Gas Feed Flow, kg/hr 75,901 75,901 75,901 N/A
Raw Water Consumption, m3/min 6.9 11.3 4.4 N/A
Air Emissions, kg/MWh
Carbon Dioxide 362 46.3 560 379
Methane 7.40E-06 8.61E-06 N/A N/A
Nitrous Oxide 2.06E-06 2.39E-06 N/A N/A
Carbon Monoxide 2.70E-04 3.14E-04 4.59E-01 N/A
Nitrogen Oxides 2.80E-02 3.25E-02 4.24E-02 N/A
Sulfur Dioxide 1.93E-06 2.24E-06 N/A N/A
Weighted Mean: 10,889
MJ/MWh (33.1%
efficiency) Weighted
Mean: 7,643
MJ/MWh (47.1 %
efficiency)
5,000
7,000
9,000
11,000
13,000
Coal Natural Gas
Heat
Rat
e (M
J/M
Wh)
median w. mean
40 40
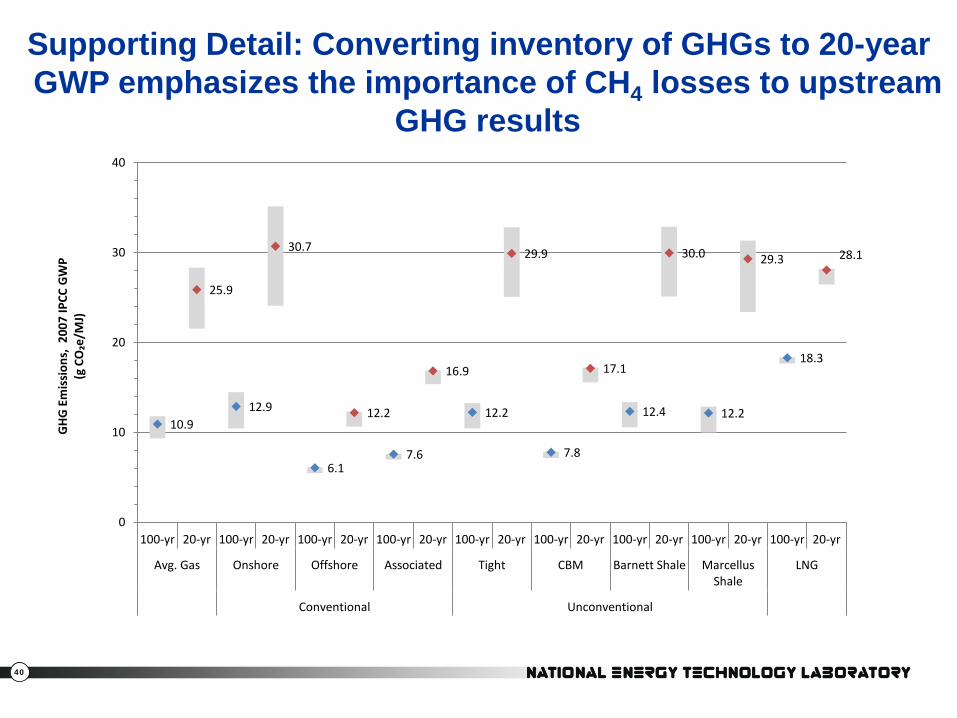
Supporting Detail: Converting inventory of GHGs to 20-year GWP emphasizes the importance of CH4 losses to upstream
GHG results
10.9
25.9
12.9
30.7
6.1
12.2
7.6
16.9
12.2
29.9
7.8
17.1
12.4
30.0
12.2
29.3
18.3
28.1
0
10
20
30
40
100-yr 20-yr 100-yr 20-yr 100-yr 20-yr 100-yr 20-yr 100-yr 20-yr 100-yr 20-yr 100-yr 20-yr 100-yr 20-yr 100-yr 20-yr
Avg. Gas Onshore Offshore Associated Tight CBM Barnett Shale Marcellus Shale
LNG
Conventional Unconventional
GHG
Em
issi
ons,
200
7 IP
CC G
WP
(g C
O₂e
/MJ)