unconventional superconductivity in mgb2 influence of...
TRANSCRIPT

Karen Oganisian
Unconventional
superconductivity in MgB2:
Influence of doping, intraband
and interband scattering on
properties of a superconductor
with a double energy gap
Supervisor: Dr. hab. Krzysztof Rogacki
Professor of the ILT&SR, PAS
Institute of Low Temperature and Structure Research,
Polish Academy of Science,
Wroclaw, Poland.
Wroclaw - 2012

Karen Oganisian
Niekonwencjonalne nadprzewodnictwo
w MgB2:
wpływ domieszkowania oraz rozpraszania
wewnątrzpasmowego i międzypasmowego
na właściwości nadprzewodnika z
podwójną przerwą energetyczną
Praca doktorska wykonana w Instytucie Niskich Temperatur i Badań Strukturalnych
Polskiej Akademii Nauk,
pod kierunkiem Dr. hab. Krzysztofa Rogackiego, Profesora INTiBS
Wrocław - 2012

Acknowledgements
First of all, I would like to acknowledge my supervisor Dr. hab. Krzysztof Rogacki,
Professor of the Institute, for continuing advice and throughout support during the course of my
work.
I am deeply grateful to Dr. C. Sułkowski for invaluable assistance and help in the thermo-
power measurements and to Dr. hab. Tomasz Plackowski for his support during the development
of the PC program used for computing of the thermopower results.
I would like to thank cordially Prof. Janusz Karpiński and his coworkers from the High
Pressure Group of the Laboratory for Solid State Physics at ETH, Zurich, where I studied the
high temperature and high pressure method of the crystal growth. Thanks also go to Dr. N. D.
Zhigadlo, for improving my crystal growth skills and to Dr. Sergey Katrich who helped me to
understand and explore the beautiful Switzerland during my short stay at the HP Group.
I would like to acknowledge Yevgen Syryanyy and, especially, Dr. Alexander Abal’oshev,
from the Institute of Physics, Warsaw, for developing the great method of preparation of the low-
resistance contacts for resistivity measurements. Thanks go also to Prof. Marta Cieplak from the
Institute of Physics, for giving me the opportunity to learn and use this method.
I acknowledge also Dr. Małgorzata Małecka for providing precise thickness measurements
of the single crystals by Scanning Electron Microscope.
I have greatly benefited from many informal discussions with Dr. Vasyl Kinzhybalo, Dr.
Oleksandr Tkachenko and other PhD students who have been forced to listen my boring reports.
Special thanks go to my Polish friends Marek and Monika Gusowski as well as Andrzej and
Ania Gągor for the good times which we have spent together and for the throughout support.
I am grateful to Prof. Wiesław Stręk who provided me financial support during the last year
of my PhD studying. I am also grateful to Polish Ministry of Science and Education, for financial
support during the studying period (2006-2010) and for the project No. N N202 235937 (2009-
2010) I was granted. Thanks also go to administration of the ILTSR for provided throughout
support.
My parents Valerik and Galina are thanked infinitely for their continuing support during my
whole life. My Ukrainian friends also deserve mentioning: Dr. Casper, Alik and many others
who are not mentioned but I remember all of them.
Finally, last three years would have been completely different without Natasha who changed
my life and inspired me during the finalization of the PhD thesis. Thank you, Natasha, you are
my life.

Contents
Acknowledgements
1. Abstract and general goal ………………………………………………………….. 1
2. Introduction
2.1. Historical background …………………………………………………………. 2
2.2. Properties of MgB2 compound ………………………………………………... 3
2.2.1. Crystallographic structure …………………………………………….... 3
2.2.2. Electronic structure …………………………………………………….. 5
3. Substitutional chemistry
3.1. Electron doing …………………………………………………………………. 9
3.2. Hole doping ……………………………………………………………………. 16
3.3. Co-doping ……………………………………………………………………… 18
3.4. Isovalent and magnetic substitutions ………………………………………….. 20
4. Preparation of single crystals
4.1. Phase diagrams ………………………………………………………………… 23
4.2. Process of crystal growth ……………………………………………………… 26
5. Experimental techniques
5.1. Thermopower measurements ………………………………………………….. 32
5.1.1. Experimental set-up ……………………………………………………. 32
5.1.2. Calibration ……………………………………………………………… 34
5.1.3. PC program ……………………………………………………………... 36
5.1.4. Measurement of small crystals …………………………………………. 38
5.2. Resistivity measurements
5.2.1. Experimental set-up ……………………………………………………. 39
5.2.2. Preparation of contacts …………………………………………………. 40
5.2.3. Measurement sequences ………………………………………………... 43
6. Results of thermopower studies
6.1. Undoped MgB2 crystals ……………………………………………………….. 44
6.2. Crystals doped with electrons …………………………………………………. 45
6.3. Crystals doped with holes ……………………………………………………… 47
6.4. Crystals substituted with Mn …………………………………………………... 48
6.5. Examples of co-substituted crystals …………………………………………… 49
6.6. Simple model ………………………………………………………………….. 51
6.7. Discussion ……………………………………………………………………… 54
7. Results of resistivity studies
7.1. Resistivity measurements ……………………………………………………… 60
7.2. Upper critical field …………………………………………………………….. 61
7.3. Theoretical description ………………………………………………………... 64
7.4. Discussion ……………………………………………………………………… 69
8. Conclusions ………………………………………………………………………… 80
List of publications ……………………………………………………………………... 83
Attended Conferences ………………………………………………………………….. 83
Appendix A …………………………………………………………………………….. 84

1
1. Abstract and general goal
This work presents results of the influence of doping and the inter- and intraband scattering
on the properties of a two-gap superconductor – the MgB2 compound. As widely known,
substitutional chemistry can modify in the controlled way the electronic structure and thus other
properties, such as the superconducting transition temperature, the upper critical field, and the
superconducting gaps width. Depending on the valence state of the substituted atoms, the
crystals can be doped with holes or electrons, or can be substituted isovalently. The introduced
atoms may additionally cause some disorder into the crystal structure and, in this way, modify
the inter- and intraband scattering and defect structure.
The main goal of this work was to examine the transport normal-state properties and the
thermodynamic superconducting properties of MgB2 single crystals substituted with various
atoms, to describe the impact of doping and/or impurity scattering on these properties. During
the studies, high purity MgB2 single crystals with various substitutions, such as Al, C, Li, Mn, as
well as co-substitutions, such as Al-Li and C-Li, have been investigated. We concentrated on
thermopower and in-field resistivity properties of the MgB2 single crystals, including the
temperature behavior of the upper critical filed (Hc2) and its anisotropy. The experimental
thermopower results have been analyzed in the frame of the simplified model using the Mott’s
formula within the free electron approach for the diffusive part of the thermopower. The
experimental upper critical field results have been studied in the frame of the two-band model in
the clean limit, for unsubstituted MgB2 single crystals, and in the dirty limit, for the substituted
crystals.
The obtained results allow us to distinguish between the doping and scattering effects,
depending on a kind of substitutions. The fundamental properties of the two-gap
superconductivity in MgB2, which we have studied here, are important also from the practical
point of view, since Hc2 of the C-substituted compound has surpassed that of Nb3Sn. As we
discuss in this work, Hc2 of MgB2 can be significantly increased at low temperatures by
appropriate enhancement of the impurity scattering, particularly in the π-band. Considering the
weakness of the interband scattering in MgB2 it seems to be possible to increase Hc2 further
toward the strong-coupling paramagnetic limit by selective substitutions on Mg or B sites. Thus,
understanding the mechanism of the intra- and interband scattering and the competition between
scattering and doping effects we find as an important task.

2
2. Introduction
The discovery of superconductivity in MgB2 initiated a great interest for researchers because
of unique properties of this compound. Magnesium diboride has a superconducting critical
temperature which is almost twice higher than those observed for other superconducting binary
alloys. Also the upper critical field of MgB2 is much higher than that obtained for Nb3Sn, which
is widely used in superconducting magnets. Additionally, the so-called weak-link problem,
which limits applications of other high temperature superconductors, is strongly reduced in
MgB2. Cheap materials combined with high values of critical fields and currents allow to suggest
that MgB2 may play a dominant role for applications in the near future.[2.1] For these reasons,
the electronic structure and other physical and chemical properties of MgB2 are of large interest
to scientists from its discovery until today. Despite the fact that the phenomenon of
superconductivity in MgB2 has been intensively studied and can be described in the BCS terms,
a lot of questions are still open and require to be examined. One of them is a question about the
influence of interband and intraband scattering on the superconducting properties. For the decade
of the intensive investigations, there is no clear theoretical description of these interactions that
has been published. However, it is well known, that the inter- and intraband scattering plays one
of the main roles in the superconducting properties of the MgB2 compound.
2.1. Historical background
When J. Akimitsu (Aoyama Gakuin University, Japan) announced at the symposium on
"Transition Metal Oxides" (January 10, 2001, Sendai, Japan) the discovery of superconductivity
in MgB2 at 39 K, the community named it as a breakthrough in the superconductivity. The
discovery was then published in Nature,[2.2] where the crystallographic structure and the
temperature dependences of resistivity and susceptibility of MgB2 were presented. The
superconducting transition temperature, Tc, is almost twice higher than that for other known
binary compounds.
In Fig. 2.1 a brief history of discovering of various superconductors is shown pictorially.[2.3]
This Figure shows the so-called BCS-type superconductors (red circles, except of MgB2 and
FeAs), high-Tc cuprates (blue diamonds), and several other unconventional low-Tc
superconductors. The MgB2 and FeAs-based compounds have the highest Tc amongst the metal-
like (non-ceramic) compounds. As mentioned above, now MgB2 is a material with the best
relation between its price and the physical properties important for applications. Thus, this
compound is still of a great interest for experimental and theoretical studies, both for better

3
understanding the new interesting physics and for optimization of the costs and high
performance of the final products such as tapes and wires. The interesting physics of MgB2 may
consist in the two-band two-gap superconductivity, which is considered as a reason of high-Tc
for this material and also for recently discovered FeAs-based compounds.
Figure 2.1. Superconducting transition temperature, Tc, versus year of discovery for several superconductors. Few Tc’s measured under pressures (marked, e.g., @30GPa) are also plotted.[2.3]
2.2. Properties of MgB2 compound
This part presents a general information on the crystallographic and electronic structure of
MgB2. It is interesting to note that the crystallographic structure and even electronic one were
known more than 30 years ago, but during that time nobody conjectured about the existence of
superconductivity in this compound.
2.2.1. Crystallographic structure
The crystallographic structure of MgB2 is shown in Fig. 2.2. The structure is hexagonal with
a space group of AlB2-type: 16hD –P6/mmm with Z = 1. [2.4] Positions of atoms (in a unit cell)
are as follows: Mg: 0, 0, 0; 2B: 1/3, 2/3, 1/2 and 2/3, 1/3, 1/2. Table 2.1 presents the coordination
numbers and the coordination polyhedrons of each element. As shown in Fig. 2.2, one of the
characteristic feature of MgB2 is its layered structure, as for other high-Tc superconductors.
However, contrary to others, the stoichiometric MgB2 is an optimally doped compound, i.e. no
doping can increase its Tc, which is equal to 39 and 40 K, for single crystals and polycrystalline
samples, respectively.

4
Boron atoms form 2D graphite-like honeycombed layers due to the strong covalent bonds
with localized holes. Magnesium atoms are located above centers of boron hexagons. They are
separated of boron layers and form quasi 3D bonds of more metallic character with delocalized
holes and electrons. Table 2.2 shows the lattice parameters of MgB2. The intralayer B-B bond is
much shorter than the interlayer distance and thus the B-B bounding is strongly anisotropic.
However, since the intralayer bonds are only twice shorter than the interlayer ones, a finite
interlayer hopping of charge carriers seems to be also possible. In graphite, for example, the
interlayer to intralayer ratio is equal to 2.4. In diamond the distance between nearest neighbors is
equal to 1.55 Å, like for fullerene C60 where it amounts to 1.4 - 1.45 Å.[2.6] Thus, MgB2 shows
the strong intralayer bonding with weak interlayer interaction and, as a consequence, relatively
large anisotropy.
Figure 2.2. Crystallographic structure of MgB2 compound. The structure consists of Mg and B layers arranged alternately.
Table 2.1. Coordination numbers and polyhedrons of Mg and B atoms in MgB2 compound.[2.4]
Atoms Coordination number Coordination polyhedron
Mg 20 MgB12Mg8
B 9 BMg6B3
Table 2.2. Lattice parameters of the MgB2 hexagonal structure.[2.4, 2.5]
a
(Å)
c
(Å)
c/a
B–B intralayer distance, 3/a
(Å)
B–B interlayer distance
(Å)
Mg–B distance, 4/3/ 22 ca +
(Å)
V
(Å3)
3.0834 3.5213 1.142 1.780 3.520 2.504 29.01

5
2.2.2. Electronic structure
In MgB2 the electronic states at the Fermi level are mainly σ- and π-bonding orbitals of
boron. The σ- and π-bonding states are confined in boron planes and out of the planes,
respectively. The σ-bonding states couple strongly to the in-plane vibrations of B atoms and this
results in formation of Cooper pairs with the energy gap Δ(0) ≈ 7 meV. The π-bonding states
reveal much weaker coupling to the lattice vibrations and thus the characteristic energy gap Δ(0)
is equal to about 2 meV.[2.7] Figure 2.3 shows the σ- and π-bonding states at the Fermi level
originated from boron px,y and pz orbitals, respectively.
(a) (b)
Figure 2.3. Bonding states at the Fermi level of MgB2: (a) σ-bonding states originated from boron px,y orbitals, and (b) π-bonding states originated from boron pz orbitals.[2.7]
Fermi surface of MgB2 was reported long before the discovery of superconductivity in this
compound. The Fermi surface consist of four separated sheets, as shown in Fig. 2.4.[2.8] Two of
them (colored in red and orange), which look like cylinders, are originated from the σ-bonding
px,y orbitals of boron and formed around the four Γ-A lines. Other two (colored in blue and blue-
green), which look like webbed tunnels, are originated from the π-bonding pz orbitals of boron
and formed around K-M and H-L lines. The smaller cylindrical σ sheets (shown in red) have
superconducting energy gap of about 7.2 meV with small deviation which is less than 0.1 meV.
The wider cylindrical σ sheets (shown in orange) have superconducting energy gap which ranges
from 6.4 to 6.8 meV. They have a maximum near Γ and a minimum near A. On the π sheets
(shown in blue and green) superconducting energy gap ranges from 1.2 to 3.7 meV. The
temperature dependence of the superconducting energy gaps for σ and π bonding states is shown
in Fig. 2.5. Values of the gaps, Δσ and Δπ, are greatly different below Tc. Both gaps, however,
vanish simultaneously at the transition temperature.

6
Figure 2.4. Fermi surface of MgB2 at 4 K. The σ-bands form two nearly cylindrical sheets around the Γ-A line (red and orange). The π-bands form two planar honey comb tubular networks (blue-green): an antibonding electron-type sheet (H-L lines) and a similar, but more compact, bonding hole-type sheet (K-M lines).[2.7]
Figure 2.5. Superconductivity energy gaps of σ (upper line) and π (lower line) bands in low temperature region.[2.7]
The total density of states (DOS) at the Fermi energy is 0.12 states per eV-atom-spin. The σ
sheets contain 44% of states and the other 56% of states belong to the π sheets.[2.7] The holes at
two unfilled σ-bands are localized within the B layers and show 2D properties. The holes and
electrons at two π-bands are delocalized and reveal more 3D properties. As the 2D covalent and
3D metal-like states contribute roughly equally to the total density of states at the Fermi level,

7
charge carriers from both σ-bands and π-bands are expected to contribute significantly to the
transport properties of MgB2. For superconductivity, more important are the unfilled (hole-like)
σ-bands, which experience strong interaction with longitudinal vibrations (optical E2g phonons)
present in the B layers.[2.6] The π-bands are only weakly coupled to phonons and thus are much
less important. The longitudinal vibrations in the B layers are shown schematically in Fig. 2.6. In
this Figure, when B atoms move in the arrow directions, the shortened bonds (marked by A)
become attractive to electrons, while elongated bonds (marked by R) become repulsive.[2.7]
Figure 2.6. Longitudinal vibrations of boron atoms which couple strongly to σ-bonding electronic states at the Fermi level.[2.7]
Properties of MgB2 can be changed by doping and/or modification of the intraband (in-plane)
and interband (out-of-plane) scatterings. Both these effects can be obtained by appropriate
substitutions. This we discuss in the next chapter.
References:
[2.1] M. Eisterer, Supercond. Sci. Technol. 20, R47 (2007).
[2.2] J. Nagamatsu, N. Nakagawa, T. Muranaka, Y. Zenitani and J. Akimitsu, Nature 410, 63 (2001).
[2.3] Superconductivity: Present and Future Applications, CCAS/IEEE brochure (2008), http://superpower-inc.com/system/files/ccas_brochure_web.pdf.
[2.4] C. Buzea and T. Yamashita, Supercond. Sci. Technol. 14, R115 (2001).
[2.5] M. Jones and R. Marsh, J. Am. Chem. Soc. 76, 1434, (1954)
[2.6] I.I. Mazin and V.P. Antropov, Physica C 385, 49 (2003).
[2.7] H. J. Choi, D. Roundy, H. Sun, M. L. Cohen and S. G. Louie, Nature 418, 758 (2002).
[2.8] I.I. Tupitsyn, Sov. Phys. Solid State 18, 1688 (1976).

8
3. Substitutional chemistry
There are two types of substitution effects in MgB2 important for superconducting properties.
One of them is the modification of the density of states (DOS) at the Fermi level, and the second
one is the introduction of various defects into the structure, which eventually results in increased
quasiparticle scattering and may lead to the superconducting pair breaking. For MgB2 multiband
superconductor, both of these effects cause a change of the superconducting transition
temperature. Therefore, to study the effects of doping and scattering on the superconducting
properties of MgB2 we need to study this compound with various substitutions, which may lead
to:
• electron doping,
• hole doping,
• electron and hole co-doping,
• isovalent substitution,
• magnetic ion substitution.
Electron, hole and co-doping result usually in both types of effects, changing of the density
of states at the Fermi level and introduction of structure defects. Isovalent or magnetic ion
substitutions are related mostly to introduction of defect structure or magnetic ion network which
both increase the quasiparticle scattering. The effect of various substitutions on the critical
temperature Tc of MgB2 single crystals is shown in Fig. 3.1.
Figure 3.1. Superconducting transition temperature, Tc, for MgB2 single crystals with various substi-tutions. Aluminum and carbon introduce electrons and Li+1 holes. Isovalent Mn+2 is a magnetic ion.[3.1, 3.8]

9
3.1 Electron doping
MgB2 single crystals can be doped with electrons by introduction of aluminum (Mg1-xAlxB2)
or carbon (MgB2-xCx) atoms.
Aluminum substitution
For substitution of MgB2 single crystals with aluminum two methods were developed [3.2].
Lower content of aluminum (up to about x = 0.1) can be introduced by a method where a part of
Mg is substituted with Al in precursor. For higher content of aluminum (up to about x = 0.3), a
disc made of Al is placed in the crucible together with Mg and B powder. Al-substituted crystals
were grown at temperatures between 1860 and 1960 °C and at about 30 kbar pressure in the high
temperature and high pressure cubic anvil system, as described in Chapter 4.
The amount of Al was detected by Energy Dispersive X-ray (EDX) spectroscopy. For the
substituted crystals, the amount of Al is lower than in precursor and depends on the precursor
composition and growth temperature. The Al-substituted single crystals used in our studies have
sizes up to 1x1x0.1 mm3. These crystals are listed in Table 3.1 together with their
superconducting transition temperature.
Table 3.1. Magnetically obtained superconducting transition temperature of Al-substituted MgB2 single crystals used in our experiments. Tc marked by a star was obtained both from magnetic and resistivity measurements.
Composition Tc, K
Mg0.97Al0.03B2 35.5
Mg0.92Al0.08B2 32.5
Mg0.915Al0.085B2 33/32.5*
Mg0.84Al0.16B2 28.6
Mg0.8Al0.2B2 27
Mg0.72Al0.28B2 15.5
The Four-Circle Single Crystal X-ray Diffractometer Siemens P4 has been used to determine
the lattice parameters of Al-substituted single crystals. For calculation of the lattice parameters,
the same set of 40 reflections recorded in the wide range of 2Θ angle (20-40 deg) have been
used. The crystals with lower Al content (x < 0.1) were identified as single-phase material.
However, for crystals with higher Al doping (x > 0.1), the precipitation of Al-rich (MgAlB4)
phase was detected. The lattice parameters c and a of substituted crystals are shown in Fig. 3.2
versus Al content. As expected, the parameters decrease with rising Al amount, since Al ions are

10
smaller than the Mg ions. It’s clearly seen that the c-axis parameter is more sensitive to the Al
content than the a-axis parameter. This may reflect the strong in-plain covalent bonding and the
2D nature of the MgB2 structure.
Figure 3.2. Lattice parameters c and a of Al-substituted MgB2 single crystals versus Al content determined with EDX. Full circles indicate the lattice parameters for single-phase crystals or the lattice parameters for the main phase of multiphase crystals, as determined with a Siemens P4 diffractometer. The phase separation occurs at Al contents x > 0.1; for these contents the lattice parameters were determined for an averaged lattice. Opened triangles indicate the lattice parameters for crystals studied also by a Mar-300 Image Plate system. For details see Ref. 3.2.
Figure 3.3 shows the dependence of the superconducting transition temperature on the lattice
parameter c. The transition temperature decreases systematically with values of c, i.e. with
increasing amount of substituted Al, and shows a tendency to cluster around few values of Tc.
This suggests that for crystals with higher Al content, additional than (Mg,Al)B2 phases may
occur as impurities. It is indeed the case for the crystals with x ≥ 0.1, i.e. for Al-substituted
crystals with Tc < 30 K. Thus special attention has been paid to the material characterization and
to the interpretation of obtained results for crystals with Tc < 30 K used in our experiments. This
we discuss in appropriate chapters devoted to the analysis of experimental results.

11
Figure 3.3. Superconducting transition temperature as a function of the lattice parameter c of the single-phase crystals or the main Mg1−xAlxB2 phase of multiphase crystals, determined with the Siemens P4 diffractometer (full circles) and with the Mar-300 Image Plate system (open triangles).[3.2]
Figure 3.4 shows examples of the results obtained from the detailed structure analysis of Al-
substituted MgB2 crystals with x = 0.022, 0.044, 0.085, and 0.185. The impurity phases (MgAlB4
and, most likely, B2O) start to appear for the crystal with x = 0.044, and are clearly present for
the crystal with x = 0.185. The Al-reach impurity phase has been studied by a High-Resolution
Transmission Electron Microscopy (HRTEM). Figure 3.5(a) shows a part of the Al heavier
substituted crystal which includes areas (in the white circles) with a higher Al content. Panels (b)
and (c) present the superstructure reflections in the various crystallographic directions. The Al-
reach areas, which were identified as AlMgB4 compound, constitute about 5% of the sample
volume. Magnetic susceptibility measurements of all crystals contained Al-rich phases show
only a single transition to the superconducting state. It means that the MgAlB4 phase and other
possible minor phases are not superconducting and thus they don’t influence the most important
results obtained and discussed in this work, i.e. the Hc2(T) dependences.
According to the literature, aluminum occupies magnesium sites and dopes MgB2 with
electrons. This doping decreases both the π-band and the σ-band energy gaps (see [3.2] and
references therein). As a result, the interband scattering increases and, additionally, DOS in the
hole σ-band decreases. The σ-band is the most import one for superconductivity, thus
superconducting transition temperature gradually decreases with the rising doping level.
Aluminum, as being substituted for Mg, is expected to change the intraband scattering mainly in
the π-band, while the intraband scattering in the σ-band should be only weakly affected, if any.

12
Figure 3.4. Line profiles along c* of reconstructed (h0l) layers of Mg1-xAlxB2 single crystals with various Al content. Data obtained for the crystal with x = 0.022 (panel a), x = 0.085 (panel b), x = 0.044 (panel c), and x = 0.185 (panel d) are presented. The indices of the reflections (00l) of Mg1-xAlxB2 (phase I; c ≈ 3.46 Å), MgAlB4 (phase II; c ≈ 6.72 Å) and an additional impurity (phase III; c ≈ 7.11 Å) are shown. The peaks of additional phases are absent for the crystals AN229/1 and AN262/2, they are slightly developed for AN217/7 and are well visible for AN210/5.[3.2]
Figure 3.5. Panel (a): Z-contrast image of an area containing rectangular shaped areas with brighter contrast (white circles) for the crushed crystal of AN210/5. These areas are supposed to contain a higher Al-content. Panels (b) and (c): various types of superstructure reflections (gray circles) observed in diffraction patterns taken from regions containing Al-reach areas. Dislocations (marked by arrows) present in the crystal appear to be independent of the local composition.[3.2]

13
Carbon substitution
Carbon substituted single crystals were grown using the high pressure and high temperature
cubic anvil system. In the precursors the following components have been used: magnesium
(Fuka, >99% purity), amorphous boron (Alfa Aesar, >99.99% purity), carbon graphite powder
(Alfa Aesar, >99.99% purity). For preparation of C-substituted crystals, a precursor with
graphite used as a source of carbon has been used. The crystals were grown at the 1900 - 1950
°C temperature and at the 30 kbar pressure, as described in more detail in Chapter 4.
The carbon substituted single crystals were smaller than the Al-substituted crystals and
grown with sizes up to 0.8x0.8x0.02 mm3. The list of C-substituted single crystals which we
used in our investigations is presented in Table 3.2. The carbon content in the MgB2 single
crystals cannot be determined with satisfactory accuracy by EDX spectroscopy while for this
method, C is too light element. Thus, the C content in our crystals was determined from the
lattice parameter a, because according to results presented in Ref. 3.3, the C content is linearly
related to this parameter. Despite the fact that this method may only be a rough approximation,
there is currently no better method for the C content estimation due to similar scattering factors
for B and C atoms. Figures 3.6 shows the dependence of superconducting transition temperature
Tc as a function of the lattice parameter a and the concentration of carbon.
Table 3.2. Magnetically measured superconducting transition temperature of C-substituted MgB2 single crystals used in our experiments.
Composition Tc, K
MgB1.97C0.03 37.05
MgB1.89C0.11 34.50
MgB1.80C0.20 29.30 As shown in Fig. 3.6(a), Tc increases monotonically with increasing a parameter, thus
according to Ref. 3.3, Tc decreases (monotonically) with the increasing C content. This relation,
shown in Fig. 3.6(b), is really very useful to estimate the C content in substituted crystals from
the Tc values, and we used it for our crystals, when crystallographic data were not available. The
lattice parameters for few crystals from the same batch and thus with very similar Tc than our
crystals were obtained to confirm the Tc versus a relation. All crystals explored in our studies
were characterized at least by measuring their superconducting transition temperature by DC
susceptibility technique. Figure 3.7 shows the transition to the superconducting state for several

14
C-substituted single crystals. The transition is relatively sharp, even for highly substituted
crystals.
Figure 3.6. Variation of the superconducting transition temperature as a function of: (a) the lattice parameter a, and (b) the carbon concentration x, as obtained for a series of C-substituted MgB2 single crystals.[3.4]
Figure 3.7. Magnetization versus temperature for several MgB2-xCx single crystals with various carbon content (adopted from Ref. 3.4). The data were obtained for the zero-field-cooled (ZFC) mode and normalized to the signal at 4.2 K.
Detailed structural analysis of C-substituted MgB2 single crystals have been made, as
described in Ref. 3.4. Cell parameters were refined from the same set of 23 reflections in a wide
range of θ angles. It was found, that C atoms are statistically distributed in the B sites with the
absence of superstructure. The substituted crystals are showed a highly anisotropic broadening in
the preliminary study of reflection profiles. Figure 3.8(a) shows two dimensional profiles of
reflections along the c* direction in the reciprocal space for 15% C-substituted crystal. As can be

15
seen, this crystal shows elongation of reflections along the c* direction. On the other hand, the
a*b* plane reflections are similar to those of the unsubstituted compound.
Figure 3.8. (a) ω-θ scan of 300 reflections of Mg(B0.85C0.15)2; c* is parallel to the plane and to the ω axis, and a*b* is perpendicular to the plane; the contour at 0 (dashed line), 12.5, 25, 50, 100, then contour step 100 sec-1. The reflection of the C-substituted MgB2 crystal shows an elongation in the c* direction. (b) ω-θ scan of 300 reflections of Mg(B0.85C0.15)2; c* is perpendicular to the plane, a*b* is parallel to the plane, and a* is parallel to the reflection; the contour at 0 (dashed line), 12.5, 25, 50, 100, 200, then contour step 200 sec-1. The shape of the reflections is similar to that of the unsubstituted MgB2 crystal.[3.4]
The observed anisotropy of reflections indicates crystal disordering, but simple structural
investigations don’t allow to determine the type of disorders. Microscopic phase separations
have been suggested by Maurin at al.[3.5], but other reasons for the broadening of reflections
have been also considered, such as local inhomogeneities in the distribution of carbon. Detailed
refinement of the structural data indicates a small deficiency of Mg ions in the structure, which
increases slightly with the C content. Additionally, the Mg ions can be shifted from the ideal
positions, leading to the asymmetric coordination in the unit cells with C ions.[3.6] This effect
seems to be confirmed by the small positive residual peaks, which have been observed about 0.6-
0.8 Å from Mg and 1.8-2.3 Å from B (or C) position. This observation corresponds to the
interatomic distances in the structure of MgB2C2 phase considered as impurity. More detailed
structure analysis suggests that our C substituted crystals show a local disorder rather than the
impurity phase, however the disorder is difficult to be characterized in detail.[3.6]
b a

16
As mentioned in Chapter 2, C which occupies B sites dopes MgB2 with electrons (see Ref.
3.4 and references therein). As a result, the σ-band gap decreases, due to the reduction of DOS,
while the π-band gap remains practically unaffected.[3.1] At the same time, the interband
scattering seems to increase, because the only reduction of DOS cannot explain the observed
decrease of Tc with the given amount of substituted carbon.[3.7] The critical temperature changes
in a similar way as for Al substituted crystals, however 2 times smaller percentage-content of
substituted C is required to observe similar reduction of Tc (see Fig. 3.1) Concerning the
intraband scattering, C which occupies B sites is expected to change the scattering mainly in the
σ-band.
3.2 Hole doping
Lithium substitution
Lithium substituted MgB2 crystals can be grown using the cubic anvil system in the same
way as for growing of the unsubstituted crystals. For substitution of Li, the precursor mixture has
been enriched with lithium nitride powder of different grain size (Alfa Asear, >99.5% purity).
No distinct influence of the grain size on the distribution of Li atoms in the Mg1-xLixB2 structure
has been observed. The amorphous boron was annealed under dynamic vacuum to minimize the
contamination by oxygen. For preparation of the precursor mixture, all the components were
mixed and pressed into a glove box due to hygroscopic properties of Li3N. The pressed pellets
were treated as described in Chapter 4. The best conditions for growing Li-substituted crystals
have been found at a pressure of about 30 kbar and a temperature of 1900-1950 °C which were
held during 30 minutes. After that, the pressure and temperature were reduced to ambient during
1-2 hours. The single crystals grown in this way have sizes up to 1.5x0.8x0.1 mm3 and similar
golden color as unsubstituted ones (see Fig. 4.1 in Chapter 4).
The crystallographic structure of Li-substituted single crystals has been investigated using
the x-ray Xcalibur PX Oxford Diffraction and Siemens P4 diffractometers. Content of Li has
been determined from structure refinement as described in Ref. 3.8. As was proposed earlier
theoretically, only 0.75 atoms of Mg per unit cell are necessary for the chemical bonding in the
Mg0.96B2 compound.[3.9] The rest 0.21 (0.96-0.75) form the covalent bonding between Mg and
B atoms along the [001] direction.[3.10] Thus Li, which provides fewer electrons than Mg, can
occupy the Mg site in the MgB2 structure. This has been confirmed by refinement and,
additionally, by showing that atomic displacement parameters of both cations are negligible. The
deviation of estimated values of the Li content is about 1-1.5%. Figure 3.9 shows the dependence

17
of lattice parameters on the concentration of Li in Mg1-xLixB2 single crystals. The lattice
parameter c decreases roughly linearly with the Li content confirming the substitution process to
be present, while the parameter a remains almost unchanged.
Figure 3.9. Lattice parameters a and c as a function of Li content in Mg1-xLixB2 single crystals.[3.8]
The two-dimensional profiles of the (002) reflection for the MgB2 and Mg0.89Li0.11B2 single
crystals are shown in Figure 3.10. These profiles were constructed from 30-40 one-dimensional
scans using the P4 Siemens diffractometer. Should be noted that for both pure and Li-substituted
crystals, the reflection profiles are narrow for the direction perpendicular to the c* axis, but
elongated along the b* axis in the a*b* plane of the reciprocal space. This anisotropic
broadening can be a result of lattice disordering. As results from Fig. 3.10, Li-substituted crystals
seem to be more ordered than unsubstituted ones. This is consistent with the fact, that
unsubstituted crystals show a deficiency in the Mg content of about 4-5 % and thus substitution
of Li atoms may lead to better ordering of the crystal structure.
As mentioned, Li occupies Mg sites and dopes the π-band of MgB2 with holes.[3.8] As a
result, DOS in the hole π-band increases but, unexpectedly, Tc slightly decreases with a growing
doping level. This suggests that MgB2 is optimally doped compound, so any doping can only
result in decreasing Tc. The substitution of of Li may also enhance the intraband scattering in the
π-band and the interband scattering as well. Table 3.3 contains a list of Li-substituted MgB2
single crystals which were investigated in this work.

18
Figure 3.10. Two-dimensional profiles of the (022) reflection for (a) MgB2 and (b) Mg0.89Li0.11B2 single crystals. Upper pictures: ω-θ scan of the (002) reflection; c* is parallel to the reflection, and a*b* is perpendicular to the plane of the reciprocal space. Lower pictures: ω- χ scan of the (002) reflection; c* is perpendicular to the plane, a*b* is parallel to the plane, and b* is parallel to the reflection.[3.8]
Table 3.3. Superconducting transition temperature of the Li-substituted MgB2 single crystals studied in this work.
Composition Tc, K
Mg0.91Li0.09B2 36
Mg0.91Li0.09B2 36.1
Mg0.92Li0.08B2 37.05
3.3 Co-doping
In this work we also studied intriguing co-substituted MgB2 single crystals. These crystals
can be divided in two groups with different types of doping. One of them constitute the
simultaneous doping of the π-band with both holes and electrons. The second one is a doping of
π-band with holes and of σ-band with electrons. Lithium (hole doping) is a common substituted
element for both cases. Crystals with the first type of doping contains additionally Al atoms.

19
Crystals which belong to the second type of doping contain additionally C atoms. Table 3.4
presents a list Li-Al and Li-C co-substituted single crystals which were investigated in this work.
Table 3.4. Superconducting transition temperature of Li-Al and Li-C co-substituted Mg1-xLixB2-yCy single crystals used in our studies.
Composition Tc, K
Mg0.962Li0.02Al0.018B2 35.8
Mg0.854Li0.05Al0.096B2 27.5
Mg0.812Li0.05Al0.138B2 27.5
Mg0.77Li0.09Al0.14B2 26.8
Mg0.94Li0.06B1.96C0.04 35.2
The co-substituted MgB2 single crystals have been grown in the similar way as described
above for the Al, C, and Li substituted crystals. For single-substituted crystals, content of Al was
determined from the EDX analysis and from the value of c lattice parameter. Concentration of C
was estimated from the value of a lattice parameter. Content of Li was evaluated by a structure
refinement. For co-substituted crystals, combination of these methods was used to obtain the Li,
Al, and C contents. Li-C co-substituted crystals are black but Li-Al co-substituted crystals are
more silver.
Two-dimensional profiles of the (002) reflection for the Li-C co-substituted crystal are
shown in Fig. 3.11. The shapes of these reflection profiles are similar to those observed for the
Li-substituted crystals. This means that single-substituted and co-substituted crystals are ordered
(disordered) in a similar degree.

20
Figure 3.11. Two-dimensional profiles of the (022) reflection for the Mg0.90Li0.10B1.85C0.15 single crystal. Right panel: ω-θ scan of the (002) reflection; c* is parallel to the reflection and a*b* is perpendicular to the plane of the reciprocal space. Left panel: ω- χ scan of the (002) reflection; c* is perpendicular to the plane, a*b* is parallel to the plane and b* is parallel to the reflection.[3.8]
3.4 Isovalent and magnetic substitutions
Despite many tries, the only isovalent substitution, which we were able to carry out for MgB2
single crystals, was the Mn substitution. As Mn is a magnetic element, we could not compare
directly the effects of non-magnetic scattering and doping, as we wanted. This makes our data
analysis difficult. However, as our excuse, we would like to state that any isovalently substituted
MgB2 single crystals with acceptable quality were not reported in the literature.
Similarly to others, the Mn-substituted single crystals were grown using a cubic anvil system,
as described in detail in Chapter 4. The best crystals were grown at a pressure of 30 kbar and
temperature of 1960 °C, reached in 1 hour, held for 0.5-1 hour, and then decreased to the room
temperature during about 1 hour. The crystals have sizes up to 2.0x0.8x0.1 mm3. Their high
phase purity was confirmed by x-ray diffraction. The structure refinement was done and the
lattice parameters were determined, as described before for other MgB2 single crystals. Amount
of Mn was evaluated with an accuracy of ± 0.05% by averaging of several EDX results obtained
from different parts of a crystal.
Figure 3.12 shows the lattice parameters c and a versus Mn content, for the Mn-substituted
MgB2 single crystals. The c-axis parameter decreases much more definitely with the amount of

21
substituted Mn than the a-axis parameter. In this Figure (dashed lines) the lattice parameters of
the Al-substituted single crystals are also shown in the same range of substitution (0 < x < 0.07),
for comparison. For this range, the lattice parameters c and a changes with x in a similar way.
This may suggest that the effective ionic radius for both substituted elements is similar.
Moreover, it means that Mn ions enter the crystal structure in a comparable manner to Al ions,
i.e. Mn substitutes for Mg only. This suggestion has been fully confirmed by x-ray
investigations, where Mn atoms were found in the Mg position only. The Mn-substituted MgB2
single crystals used in this work are listed in Table 3.5.
Figure 3.12. Lattice parameters c and a vs Mn content, x, for Mg1-xMnxB2 single crystals (closed symbols, solid lines). The crystals are superconducting for x < 0.02. The solid lines are linear fits to the data. The dashed lines represent the lattice parameters for Al-substituted crystals.[3.11]
Table 3.5. Superconducting transition temperature of Mn-substituted MgB2 single crystals used in our studies.
Composition Tc, K
Mg0.994Mn0.006B2 30.9
Mg0.993Mn0.007B2 29.3
Mg0.986Mn0.014B2 18.6
Mg0.984Mn0.016B2 12.2
Mg0.980Mn0.020B2 0

22
The magnetic and x-ray absorption spectroscopy studies revealed that Mn atoms in MgB2 are
divalent and in the low-spin configuration.[3.11] Thus, no charge doping is present in that case.
However, Tc strongly decreases for even small amount of substituted Mn (Tc = 0 for x = 0.02; see
Fig. 3.1). This effect cannot be explained by the inter- or intra-band scattering, as similar amount
of substituted Al decreases Tc only very slightly (Tc = 34 K for x = 0.05; see Fig. 3.1). The Mn
ions are magnetic, therefore the observed drastic suppression of superconductivity has been
explained as a result of strong pair breaking due to the spin-flip scattering on magnetic
impurities.
References
[3.1] J. Karpinski, N. D. Zhigadlo, S. Katrych, R. Puzniak, K. Rogacki, and R. Gonnelli, Physica C 456, 3 (2007), and references therein.
[3.2] J. Karpinski, N. D. Zhigadlo, G. Schunk, S. M. Kazakov, B. Batlogg, K. Rogacki, R. Puzniak, J. Jun, E. Muller, P. Wagli, R. Gonnelli, D. Daghero, G. A. Ummarino, and V.A. Stepanov, Phys. Rev. B 71, 174506 (2005).
[3.3] M. Avdeev, J. D. Jorgensen, R. A. Riberio, S. L. Bud’ko, and P. C. Canfield, Physica C 387, 301 (2003).
[3.4] S. M. Kazakov, R. Puzniak, K. Rogacki, A. V. Mironov, N. D. Zhigadlo, J. Jun, Ch. Soltmann, B. Batlogg, and J. Karpinski. Phys. Rev. B 71, 024533 (2005).
[3.5] I. Maurin, S. Margadonna, K. Prassides, T. Takenobu, T. Ito, D. H. Chi, Y. Iwasa, and A. Fitch, Physica B 318, 392 (2002); I. Maurin, S. Margadonna, K. Prassides, T. Takenobu, Y. Iwasa, and A. N. Fitch, Chem. Mater. 14, 3894 (2002).
[3.6] M. Woerle and R. Nesper, J. Alloys Compd. 216, 75 (1994).
[3.7] D. Daghero, R. S. Gonnelli, A. Calzolari, G. A. Ummarino, M. Tortello, V. A. Stepanov, N. D. Zhigadlo, K. Rogacki, J. Karpinski, and M. Putti, Adv. Sci. Technol. 47, 75 (2006).
[3.8] J. Karpinski, N. D. Zhigadlo, S. Katrych, K. Rogacki, B. Batlogg, M. Tortello, and R. Puzniak, Phys. Rev. B 77, 214507 (2008).
[3.9] J. Schmidt, W. Schnelle, Y. Grin, and R. Kniep, Solid St. Science 5, 535 (2003).
[3.10] U. Burkhardt, V. Gurin, F. Haarmann, H. Borrmann, W. Schnelle, A. Yaresko, and Y. Grin, J. Solid State Chem. 177, 389 (2004).
[3.11] K. Rogacki, B. Batlogg, J. Karpinski, N. D. Zhigadlo, G. Schuck, S. M. Kazakov, P. Wägli, R. Puźniak, A. Wiśniewski, F. Carbone, A. Brinkman, and D. van der Marel, Phys. Rev. B 73, 174520 (2006).

23
4. Preparation of single crystals
Single crystals of MgB2 used in our investigations have been prepared in the Prof.
Karpinski’s High Pressure Synthesis (HPS) group at the Solid State Physics Laboratory of ETH
in Zurich, Switzerland. This laboratory has equipment which allows to produce crystals that can
be grown at high pressure and temperature. Single crystals of MgB2 are very small; they have
sizes up to 1.5 x 1 x 0.1 mm3 and weight up to 230 μg as maximum. The substituted crystals are
even smaller, thus special techniques often have to be developed to study these crystals. Figure
4.1 shows the largest MgB2 single crystals which were grown in the HPS group of the Solid
State Physics Laboratory.
(a) (b) (c)
Figure 4.1. Examples of MgB2 single crystals: (a) unsubstituted, (b) substituted with Li, and (c) substituted with Al. For (a) and (b), the scale is 1 mm.[3.1, 3.8, 3.2]
In October 2007 I spent a few weeks at the HPS group to grow MgB2 single crystals with
various substitutions using a high pressure and high temperature cubic anvil system. The system
(in detail) and some of my achievements are described in the next chapters.
4.1 Phase diagrams
The crystals of MgB2 cannot be grown from stoichiometric melt because MgB2 melts non-
congruently. Bigger crystals can be grown only at high temperature and high pressure by using
the cubic anvil system and by heating the mixture of Mg and B which has to be closed in
metallic container.[4.1] Below the Mg melting point at the ambient pressure (1107 °C) the
solubility of MgB2 in Mg is very low. For temperatures above 1600 °C, the solubility is high
enough but the partial pressure of Mg rapidly increases up to 50 bars. Another problem is the
MgB2 decomposes at temperatures above 1000 °C at ambient pressure. Thus, as it was calculated
[4.2], the crystals growth is possible in the conditions with the temperatures above the melting
point of Mg and at a pressure from 10 to 35 kbar.

24
Figure 4.2. Pressure–temperature phase diagram for the Mg:B atomic ratio xMg/xB ≥ 1/2. The region “Liquid + MgB2“ represents the thermodynamic stability window for the growth of MgB2 from solution in Mg.[4.2]
In Fig.4.2 the region named “Liquid + MgB2“ outlines the parameters for which the growth
of MgB2 single crystals from solution in Mg is possible. For pressure 10 < p < 35 kbar the
crystals can be grown at temperatures up to 2190 °C. Figure 4.3 shows the phase diagram
“temperature versus boron atomic fraction” at the pressure of 30 kbar. For this pressure, MgB2
single crystals can be grown from solution at temperatures up to 2400 °C, as well as from the
stoichiometric MgB2 melt.
0.0 0.2 0.4 0.6 0.8500
1000
1500
2000
2500
T (C
o )
B at. fraction
L
L + MgL + MgB2
Mg + MgB2
MgB
2 + M
gB4
L + MgB4P = 30 kbar
Figure 4.3. Phase diagram which shows a possibility to grow MgB2 single crystals from solution at temperatures up to 2400 °C, as well as from the stoichiometric MgB2 melt.[4.1]

25
In the real experiment, the mixture of components (the precursor) is placed in BN crucible
which reacts with the melt at the temperature of crystal growth. This means that liquid Mg is
very aggressive toward the crucible for temperatures above 1100 °C. As was shown by Lee et
al,[4.3] MgB2 decomposes at about 1200 and 1600 °C at 20 and 50 kbar, respectively. For these
conditions, Mg reacts with BN and the reaction in the ternary Mg-B-N system has to be taken
into account. Ternary Mg–B–N system together with compounds involved in the MgB2 crystal
growth is shown in Fig. 4.4. A field marked with P corresponds to the composition of precursor
to be used for the crystal growth.
Figure 4.4. Ternary Mg-B-N system with compounds involved in the growth of MgB2 single
crystals.[4.1]
Compositions which have been used for the crystal growth have had a ratio of Mg to B equal
to 1:1.2. Excess of Mg is necessary because at high temperatures Mg evaporates very strong.
Figure 4.5 shows the P–T phase diagram of Mg–B–N system, for a composition with an excess
of Mg resulting in the Mg:B ratio equal to 1:1.2. Symbols show phases observed in the samples.
Empty squares indicate the MgB2 single crystals which were grown at the relevant conditions.
The MgB4 compound was present in some samples as a secondary phase. Additionally, BN
hexagonal phase and Mg were also present in all samples (not shown on diagram). The MgNB9
compound above the dashed line appeared only as a metastable secondary phase. The best MgB2
single crystals have been grown at 1700 °C and at pressure of 30 kbar.

26
Figure 4.5. Pressure-temperature phase diagram showing compounds observed in grown samples (see text for details).[4.1]
4.2 Process of crystal growth
The process of crystal growth can be performed in two steps. The first step is a preliminary
work which consists in preparation of the components and mixing them. The second step is the
crystal growth using the high pressure and high temperature cubic anvil system.
Figure 4.6. Elements which are needed for the process of crystal growth in the high pressure and high temperature cubic anvil system. From left to right: BN crucible with a cover, two pyrophyllite pellets, graphite cylinder with two covers, and a cubic pyrophyllite container with two Ta or Mo discs.

27
For growing single crystals in the cubic anvil system, the following elements (see Fig. 4.6)
are required:
• BN crucible with a cover,
• two pyrophyllite pellets,
• graphite cylinder with two covers,
• pyrophyllite container;
• two Ta or Mo discs.
BN crucible has a size of 6 mm internal diameter and 7 mm length. So the volume of the BN
crucible is about 0.2 cm3. The graphite cylinder (with covers) is used to conduct the heating
current and because this material can stand high temperatures during long time. Pyrophyllite is
the Al2Si4O10(OH)2 compound. This material has the required specifications of elasticity and
thermal conductivity at high pressure and high temperature conditions. Tantalum and
molybdenum have a high melting point, thus they can be used for heating of sample up to 2000
°C and even above. Heating is realized by flowing a large current (about 400 A) through these
discs, and the graphite cylinder.
As mentioned above, I have visited the HPS group of the Solid State Physics Laboratory at
ETH to study the crystal growth procedure and to grow crystals. We concentrated on the
synthesis of MgB2 single crystals substituted with Li and Zn. As an example, the process of
growing 15% Li-substituted single crystals will be here described. For this process, the used
chemical components should meet the following relation:
8.5 Mg + 0.5 (Li3N) + 12 B + BN.
Thus, the appropriate amounts of the components are:
0.36565 g (Mg) + 0.03082 g (Li3N) + 0.22959 g (B) + 0.04392 g (BN),
for a 0.67 gram sample, which fully fills the volume of the BN crucible. The components are
carefully mixed and pressed into a pellet with about 20 ton pressure (see Fig. 4.7a). It's necessary
to do that in the glove box at argon medium because Li3N is very hydroscopic. Then the pllet is
palced into a BN crucible (Fig. 4.7b), closed with a BN cover, and the whole BN capsule is
placed into the graphite cylinder (Fig. 4.7c). After that, the graphite cylinder is put into the
pyrophyllite cube and closed with two pyrophyllite pellets (Fig. 4.8a). Then the pyrophyllite
cube is closed with two graphite discs (Fig. 4.8b) and two Ta or Mo plates (Fig. 4.8c). Finally,
the cube is placed into the high pressure and high temperature cubic anvil system (see Fig. 4.9)
and the growing process can be started.
28
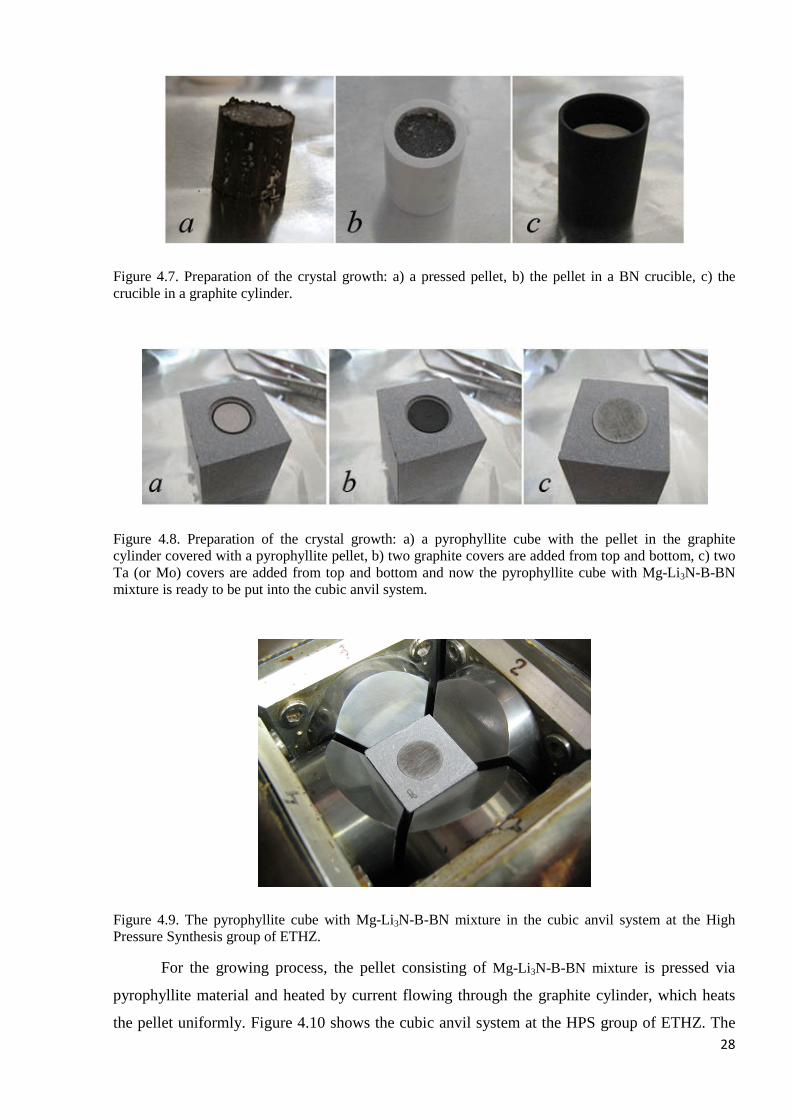
Figure 4.7. Preparation of the crystal growth: a) a pressed pellet, b) the pellet in a BN crucible, c) the crucible in a graphite cylinder.
Figure 4.8. Preparation of the crystal growth: a) a pyrophyllite cube with the pellet in the graphite cylinder covered with a pyrophyllite pellet, b) two graphite covers are added from top and bottom, c) two Ta (or Mo) covers are added from top and bottom and now the pyrophyllite cube with Mg-Li3N-B-BN mixture is ready to be put into the cubic anvil system.
Figure 4.9. The pyrophyllite cube with Mg-Li3N-B-BN mixture in the cubic anvil system at the High Pressure Synthesis group of ETHZ.
For the growing process, the pellet consisting of Mg-Li3N-B-BN mixture is pressed via
pyrophyllite material and heated by current flowing through the graphite cylinder, which heats
the pellet uniformly. Figure 4.10 shows the cubic anvil system at the HPS group of ETHZ. The

29
force is supplied by a hydraulic press and the system is configured in a way to provide uniform
force acting on the sample, as shown schematically in this Figure.
Figure 4.10. The high pressure and high temperature cubic anvil system: a) general view, b) forces acting on the pellet (schematic view).
In Chapter 3 the conditions of crystal growth have been described in detail, for each type of
substitutions. Usually, the single-crystal synthesis has been performed at a pressure of 30-35
kbar and at the temperatures of about 2000 oC. When the pressure of 30 kbar is applied the
temperature is ramped up within 1.5 h to the maximum value of about 1700 - 2000 oC, kept for
0.5 - 3 hours (e.g., in the case of Li substituted MgB2 - 1.5 h), and then the pressure and
temperature are decreased to ambient conditions in 1-2 h. This process is shown schematically in
Fig. 4.11.
Figure 4.11. Schematic view of the temperature changes during the typical process of the MgB2 single crystals growth.
When the crystal growth process is finished, the pyrophyllite cube with significantly changed
volume (see Fig. 4.12) is taken from the anvil system and the pellet is removed from the cube.
Finally, the pellet with potentially grown single crystals is heated to 750 °C and held for about
15 min in a dynamic vacuum to remove an excess of Mg. Figure 4.13(a) shows a graphite

30
cylinder with a crucible inside. Figure 4.13(b) shows a pellet removed from the crucible and
heated at 750 °C in a dynamic vacuum. The BN and Mg(Li)B2 single crystals strongly stick
together.
Figure 4.12. Pyrophyllite cube after growing of the Mg(Li)B2 single crystals in the cubic anvil system.
Figure 4.13. A view of the pellet pressed and heated in the cubic anvil system: a) before the annealing in vacuum at 750 °C, b) after the annealing, thus BN and Mg(Li)B2 single crystals may be visible.
Generally, the cubic anvil system allows to grow high purity MgB2 single crystals with
various substitutions. Such crystals usually have the superconducting transition width of about
0.4-0.5 K, which confirms their high quality. As mentioned before, we also tried to produce the
MgB2 crystals substituted with Zn to obtain the isovalent substitution. The grown crystals have
Tc about 35 K with narrow superconducting transition width that allows us to assume that the
crystals are free of any additional phases. But, unfortunately, the structural analysis did not
provide any proof that Zn was substituted into the structure. No reports have been found in
literature about the Zn-substituted MgB2 single crystals of good quality.

31
References:
[4.1] J. Karpinski, M. Angst, J. Jun, S. M. Kazakov, R. Puzniak, A.Wisniewski, J. Roos, H. Keller, A. Perucchi, L. Degiorgi, M. R. Eskildsen, P. Bordet, L. Vinnikov, and A. Mironov, Supercond. Sci. Technol. 16, 221 (2003).
[4.2] Z-K. Liu, D. G. Schlom, Q. Li, and X. X. Xi, Appl. Phys. Lett. 78, 3678 (2001).
[4.3] S. Lee, T. Masui, H. Mori, Y. Eltsev, A. Yamamoto, and S Tajima, Supercond. Sci. Technol. 16, 213 (2003).

32
5. Experimental techniques
Superconducting and normal-state properties of MgB2 single crystals have been investigated by:
• magnetic measurements, to characterize basic superconducting properties,
• thermopower measurements, to explore normal state properties,
• resistivity measurements, to study both normal state and superconducting properties.
The thermopower was investigated with the help of the hand-made experimental system
which allows to measure the Seebeck effect in the temperature range from 10 to 300 K.
Resistivity and magnetic measurements were performed in the temperature range from 2 to 300
K by using the Physical Property Measurement System (PPMS) of Quantum Design. Studies in
PPMS were done in DC magnetic fields up to 9 T. To measure small single crystals (∼ 0.8 x 0.4
x 0.05 mm3), several experimental techniques have to be developed, as we describe in the next
chapter.
5.1 Thermopower measurements
5.1.1 Experimental set-up
For the thermopower studies we have used the hand-made experimental set-up, which is
shown schematically in Fig. 5.1. The measuring principle is as follows: two heaters (Ht and Hb)
keep a certain temperature difference (∆T) along the sample. Two thermometers (Tt and Tb)
measure the temperature difference and register temperature changes to control the equilibrium
conditions. A nanovoltmeter (V) measures the potential difference between the top and bottom
ends of a sample. All data are processed and saved with a personal computer.
Figure 5.1. Schematic diagram of the experimental set-up for measurements of the Seebeck effect. Ht and Hb mark top and bottom heaters, respectively, Tt and Tb – top and bottom thermometers, V – a nano-voltmeter, and PC – a personal computer.

33
Schematic diagram of the sample holder is shown in Fig. 5.2. A sample is placed between
two copper blocks. Platinum thermometers are located close to the inner edges of the blocks. The
heaters are located close to the outside edges of the blocks. Similar method to study the
thermopower of small (1 mm long) samples has been reported in Ref. 5.1, and the S(T) results
obtained for constantan samples with different cross section and lengths have been discussed in
detail. As shown in Fig. 5.2, the temperature difference measured by the thermometers is the sum
of three differences: ΔTt and ΔTb, which occur between the thermometers and the sample, and
ΔTS, which appears along the sample. We have checked that for the required accuracy and at the
experimental conditions we have applied, ΔTt and ΔTb can be neglected and the measured
temperature difference assumed to be ΔT ≈ ΔTS. Due to this assumption and other unknown
factors, an experimental error of the thermopower values was lower than 0.2 µV/K, as we show
in the next chapter.
Figure 5.2. Schematic diagram of the sample holder for thermopower measurements. A sample is placed between two copper blocks. Heaters and thermometers are arranged as shown in the Figure and well thermally contacted with the blocks.
Figure 5.3 shows two photos of the sample holder without and with a plastic cover. This
holder is put into a helium cryostat, where it stays at helium atmosphere. By moving the holder
up and down, a temperature range from 10 to 300 K is available for measurements. A required
temperature gradient can be obtained by controlling power released in heaters. For better
stabilization of the temperature difference along the sample, the unit is placed into a plastic tube
which increases thermal isolation. Using this sample holder, the thermopower of MgB2 single
crystals can be measured both in-plane (Sab) and out-of-plane (Sc).

34
Figure 5.3. Pictures of the sample holder for thermopower measurements; a) without a cover, and b) with a plastic tube as a cover to increase thermal isolation.
5.1.2 Calibration
Several testing experiments have been performed to calibrate the measurement system. For
clarity, the calibration process has been divided into following main parts:
• correction due to detrimental thermopowers,
• estimation of the accuracy of the measured thermopower,
• determination of an optimal temperature gradient along a sample,
• testing the system by measuring the thermopower of YBa2Cu3O7 single crystal with known S(T) dependence.
Correction of the measurement system has been carried out by using the high purity
antimony, which has a large value of thermopower at room temperature and this value smoothly
goes to zero at low temperatures. First, the measurement system was tuned to show S = 0 for ∆T
= 0. This tuning is relatively tiny and corrects the influence of detrimental thermopowers. Then,
the S(T) dependence has been measured and the results are shown in Fig. 5.4. The observed
behavior of S(T) is characteristic for antimony.
The accuracy of the measured thermopower has been estimated by measurement of a small
piece (∼1 mm3) of pure (5N) lead. Figure 5.5 shows the by-us-measured S(T) dependence of Pb
in comparison with the reference data widely accepted as the Pb standards.[5.2] The difference
between our results and the standard values is less than 0.2 µV/K in the temperature range from
20 to 300 K. Thus the relative accuracy of our S(T) data has been estimated to be less than 5% at
room temperature, for most of the measured MgB2 single crystals (S > 4 µV/K). The scattering
of S(T) values is typically lower than 0.1 µV/K, thus the statistic relative error can be neglected.

35
0 50 100 150 200 250 3000
10
20
30
Sb (4N)
S (µ
V/K)
T (K) Figure 5.4. Thermopower versus temperature for antimony, measured with our experimental set-up.
0 50 100 150 200 250 300
-1.2
-0.8
-0.4
0.0 New standard Old standard Pb (5N, 1 mm3)
S (µ
V/K)
T (K) Figure 5.5. Thermopower versus temperature for a small piece (∼1 mm3) of lead (squares), measured with our experimental set-up, in comparison with the reference data, which are the new (circles) and old (triangles) standard results.[5.2]
To determine the optimal temperature gradient along the sample, the thermopower has been
measured for various temperature differences (∆T) at a constant temperature. As an example,
Fig. 5.6 shows the S(∆T) results for Mg0.98Mn0.02B2 and MgB2 single crystals at ∼100 K and
∼250 K, respectively. It was possible to determine the characteristic temperature gradient above
which the S(T) values not depend on ∆T. For Sab at middle temperatures (see Fig. 5.6a), the
thermopower values decrease with increasing temperature gradient and then remain constant at
∆T ≥ 2. For Sc at higher temperatures (see Fig. 5.6b), the thermopower values increase with
increasing temperature gradient, however also stabilize at ∆T ≥ 0.7 K. Thus, both Sab(T) and
Sc(T) have been measured with ∆T from a range of 2-4 K. Exceptionally, at temperatures close to
Tc the temperature difference has been reduced to about 1 K, because at the transition to
superconducting state S(T) drops to zero rapidly.

36
-3 -2 -1 0 1 2 3 4 58.0
8.2
8.4
8.6
8.8
9.0Mg0.98Mn0.02B2
S ab (µ
V/K)
∆T (K)
102.8103.1103.5
102.8
103.4
103.6
103.4
103.4
103.8
102.9
103.2
103.3
0.0 0.5 1.0 1.5 2.0 2.5 3.01
2
3
4
S C (µ
V/K)
∆T (K)
251.9251.3
248
250.8251.2
251.1250.7
250.9250.6
251
251.9
252.1
MgB2
Figure 5.6. Thermopower as a function of the temperature difference for (a) Mg0.98Mn0.02B2 single crystal measured along the ab-plane at about 100 K, and (b) MgB2 single crystal measured along the c-axis at about 250 K.
Finally, the S(T) dependence has been briefly measured, for a high quality YBa2Cu3O7 single
crystal with Tc = 92 K (ΔTc ≈ 0.8 K). The Sc(T) results are shown in Fig. 5.7. They stay in good
agreement with relevant data reported in literature.[5.3] The YBa2Cu3O7 single we measured has
dimensions ∼ 1 x 0.8 x 0.1 mm3. Therefore we believe our experimental method is suitable to
measure the thermopower of small samples, namely the MgB2 single crystals.
0 50 100 150 200 250 300
0
5
10
15
20
25
S c (µV
/K)
T (K)
YBa2Cu3O7, Tc = 92 K
Figure 5.7. Out-of-plane thermopower of a high quality YB2C3O7 single crystal with Tc = 92 K and the transition width ∆Tc ≈ 0.8 K.
5.1.3 PC program
Computing program has been developed to control the experiment and collect data. This
program has been made by using the “Lab View 8.0” platform, produced by the National
a b

37
Instruments Company. Figure 5.8 shows the main window of the workspace of this program,
where the numbers denote:
1 - textbox with the sample name,
2 - graph of measured values, S(T),
3 - table of stored data,
4 - switcher of the auto-manual mode,
5 - currents flowing through the heaters,
6 - resistance of the thermometers (temperature)
Figure 5.8. The main window of a workspace of the PC program which controls the thermopower measurements and collects the S(T) data.
When a sample is mounted and put into a liquid He-4 transport vessel, the program can be
started. Firstly, the user has to enter the name of a sample in the sample name textbox. Then, he
should press the START button and input the name of a raw data file. After confirmation the
program will start automatically. Next, the user has to initialize the text-boxes, which have to be
filled with the values of current flowing through the top and bottom heaters. Then, when the
thermodynamic equilibrium is achieved (i.e., changes of the temperature at the top and bottom
thermometers are lower than the desired value), the user has to press the button MEASURE and
the measured data will be stored in the raw data file. Next, the temperature is changed by moving
the sample holder down in a He-4 transport vessel and the procedure is repeated. The
temperature dependence of the measured thermopower values will be shown in the graph, point
by point.
The PC program allows to perform the S(T) measurements in manual and semi-automatic
modes. In the manual mode, the user should notice that the thermodynamic equilibrium has been
obtained and decide to write the data down. In the semi-automatic mode, the program determines
that the equilibrium conditions are obtained and then the data are collected automatically. Both

38
methods require the temperature difference (∆T) to be defined by the user. The saved data (*.txt
files) can be opened and worked out in the “Origin 7.5” graphic program.
5.1.4 Measurement of small crystals
Due to very small sizes of MgB2 single crystals, fixing a crystal in the sample holder is a
difficult task, especially for measurements performed along the ab-plane. Figure 5.9 shows the
method to fix a small single crystal for the S(T) measurements in the ab-plane. The crystal is
placed in a slit cut in a thin plastic ring. To keep the crystal in this ring, an outer plastic ring with
a slit has been used as a spring. This is drawn schematically in Fig. 5.9(a) and a picture is shown
in Fig. 5.10(a). The whole assembly is placed between the copper blocks as shown in Fig. 5.3(a).
In this method, the crystal is thermally isolated from helium gas by piece of plastic and the
crystal is cooled/heated through point contacts with the copper blocks only. Such a method
results in an enhanced scattering of the measured values at low temperatures.
Figure 5.9. Schematic drawing (top view) of the MgB2 single crystal fixed in two plastic rings for measurements of S(T) in the ab-plane. Figures (a) and (b) show the described old and new mounting methods, respectively.
Figure 5.10. Picture (top view) of the MgB2 single crystal with dimensions of ∼0.8 x 0.35 x 0.07 mm3, prepared for measurements of S(T) in the ab-plane. The inner (white) plastic ring fixes the single crystal. The outer (yellow) plastic ring works as a spring. Thickness of the plastic rings is about 0.8 mm. The whole assembly is placed between the copper blocks as shown in Fig. 5.3(a). Pictures (a) and (b) show the described old and new mounting methods, respectively.

39
During the experimental works, a new method to fix small crystals has been developed to
assure better thermal equilibrium and to reduce the scattering of the Sab(T) values. For this
method, a side part of the single crystal has been opened to the helium atmosphere that provided
better cooling/heating of the crystal with the help of helium gas. The new mounting method is
drawn schematically in Fig. 5.9(b) and a picture is shown in Fig. 5.10(b).
The proposed modification of the single crystals mounting resulted in lower scattering of the
Sab(T) values, as shown in Fig. 5.11. The Sab(T) data has been obtained for the
Mg0.94Li0.06B1.96C0.04 single crystal fixed in plastic rings by using the old and new methods. At
higher temperatures, the difference between Sab(T) values obtained for both methods is
negligible, however, for the new method, the thermodynamic equilibrium has been reached
quicker. At low temperatures, the new mounting method gives better accuracy and lower
scattering of the Sab(T) values, as can be seen in the Figure.
0 50 100 150 200 25
0
2
4Mg0.94Li0.06B1.96C0.04
old method new method
S ab (µ
V/K)
T (K) Figure 5.11. Thermopower versus temperature measured along the ab-plane, for the Mg0.94Li0.06B1.96C0.04 single crystal fixed with the plastic rings according to the old (circles) and new (triangles) methods, as described in text in detail.
5.2 Resistivity measurements
5.2.1 Experimental set-up
Resistivity measurements have been performed using the PPMS (Physical Property
Measurement System) by Quantum Design. Figure 5.12 shows the general view and internal
structure of the PPMS. To measure resistance, a single crystal is mounted on the sample holder
(a puck) and placed into the center of a 9 T superconducting magnet. The crystal can be mounted
with the ab-plane oriented perpendicular or parallel to direction of the magnetic field. An
inaccuracy of the orientation has been estimated to be lower than 1 degree. Resistance has been
measured with the classic four-wires method by using the AC transport mode (f = 19 Hz) of
PPMS in the temperature range of 2-300 K.

40
Figure 5.12. Physical Property Measurement System (PPMS); the main view and internal structure.
5.2.2 Preparation of contacts
A single crystal prepared for resistance measurements is shown schematically in Fig. 5.13.
Four wires are attached to the crystal glued to the glass plate. Two external wires are used to
supply an AC current, two internal wires are used to measure a voltage signal. Then, the
measured resistance is taken to calculate resistivity for the known crystal geometry. As
mentioned earlier, MgB2 single crystals are very small, thus the contacts should be prepared
carefully and the geometry for calculation of the resistivity should be determined with large
accuracy.
Figure 5.13. Schema of the four-wire resistance measurement method used for our studies.
First, we prepared the electric contacts by using a two-component silver paste. Figure 5.14
shows a picture of a single crystal with the contacts made by this method. Gold wires with
diameter of ø = 12.5 µm have been attached by small amount of the silver paste. Due to small
sizes of the single crystal it was difficult to get the electric contacts with resistance lower than 20

41
Ohms, which is the upper limit to obtained good quality (error < 1%) results. Also the geometry
of single crystal to calculate the resistivity is too arbitrary. Fortunately, we were able to develop
a method, which allows to reduce the dimensions and resistance of the contacts considerably.
The main idea of this method is to flow a pulsed current through the gold wire, which touches
the crystal, and to make the wire soft (close to the melting point) by heating with eddy currents.
This results in a good electric contact with the resistance of few Ohms between the wire and the
single crystal.
Figure 5.14. Picture of the MgB2 single crystal with 12.5 µm gold wires attached with the silver paste. The crystal is glued to a glass substrate with GE-varnish. For illustration reasons, the substrate was located on a piece of millimeter paper.
Further lowering of the contacts resistance has been obtained by using an Ultrasonic Bonding
System (UBS), made by the Warsaw University of Technology. The ultrasonic wire-bonding
technique has been developed in close collaboration with the Institute of Physics PAS (Warsaw).
Figure 5.15 shows a principle of the wire bonding with the UBS. This method uses aluminum
wires with a combination of heat, pressure and ultrasonic energy. It is a type of solid state
welding where two solids (metallic wire and a crystal) are in close contact that leads to
interdiffusion and results in formation of strong bonding. The obtained contact resistance stays
much below 1 Ohm and is satisfactory for our measurements. Figure 5.16 shows the pictures of
two crystals with electric contacts prepared by using the UBS.
Resistance measurements have been performed in the PPMS equipped with a 9 T magnet.
For measurements in a magnetic field oriented perpendicular to the ab-plane, a single crystal
with a substrate was glued directly to the sample holder (a puck). For measurements in the
magnetic field oriented along the ab-plane, a plastic (or metallic) cube was mounted on the
sample holder and the crystal with a substrate was placed on its side. Figure 5.17 shows pictures
of the sample holders with MgB2 single crystals prepared for measurements in the magnetic field
oriented along the c-axis (Fig. a) and along the ab-plane (Fig. b).
42
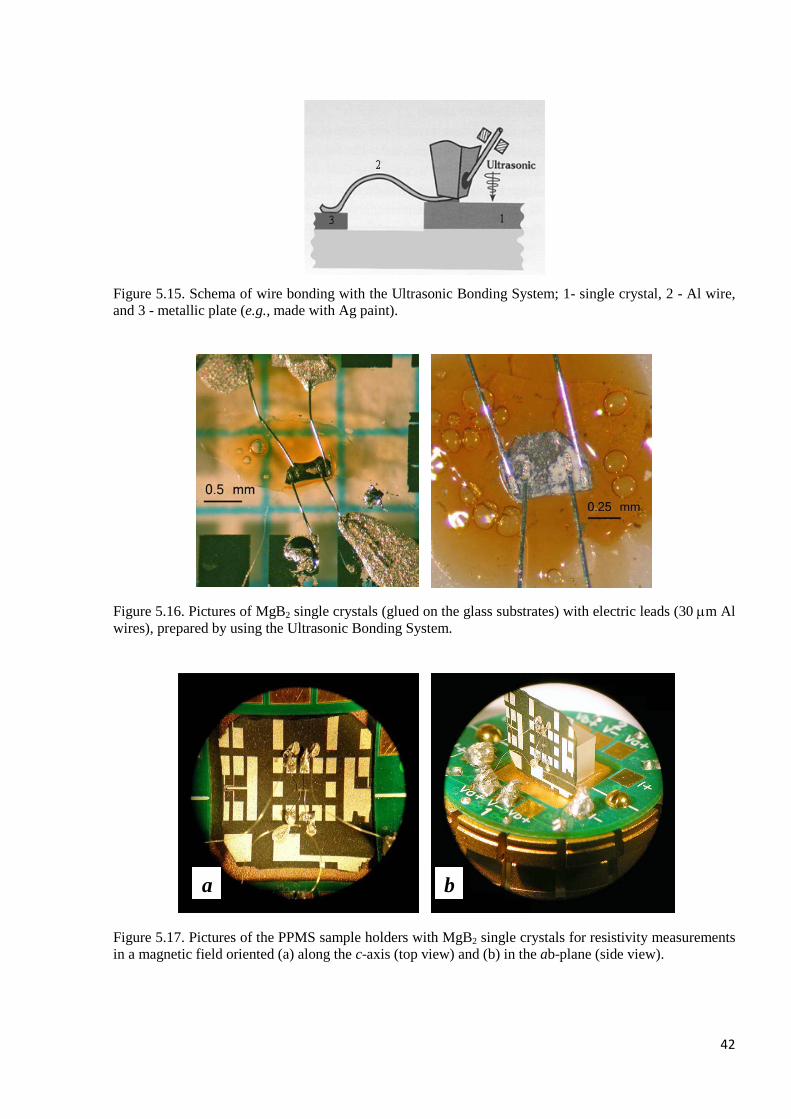
Figure 5.15. Schema of wire bonding with the Ultrasonic Bonding System; 1- single crystal, 2 - Al wire, and 3 - metallic plate (e.g., made with Ag paint).
Figure 5.16. Pictures of MgB2 single crystals (glued on the glass substrates) with electric leads (30 µm Al wires), prepared by using the Ultrasonic Bonding System.
Figure 5.17. Pictures of the PPMS sample holders with MgB2 single crystals for resistivity measurements in a magnetic field oriented (a) along the c-axis (top view) and (b) in the ab-plane (side view).
a b

43
5.2.3 Measurement Sequences
For resistance and upper critical field measurements, a PPMS sequence has been written,
individually for every single crystal measured, considering the intrinsic physical characteristics
such as the temperature of the superconducting transition, orientation of the magnetic field
according to the crystal structure, composition, etc. The measurements were performed in the
temperature range 2-300 K and the magnetic fields up to 9 T. The sequence is constructed in the
way to cool a single crystal to the superconducting state in presence of the magnetic field, i.e. the
field was applied in the normal state. An example of the PPMS sequence used for the upper
critical field measurements is shown in Appendix A.
References:
[5.1] Z. Henkie, P. J. Markowski, A. Wojakowski, and Ch. Laurent, J. Phys. E: Sci. Instrum. 20, 40 (1987).
[5.2] R. B. Roberts, Nature 265, 226 (1977).
[5.3] J. W. Cochrane, A. Hartmann, and G. J. Russell, Physica C 265, 135 (1996).

44
6. Results of thermopower studies
The aim of the thermopower studies was to investigate the influence of charge doping and/or
scattering on this transport property of MgB2. The single crystals we measured were substituted
with aluminum, carbon, lithium, manganese, and co-substituted with aluminum-lithium and
carbon-lithium. Thus, due to the substitutions, MgB2 single crystals were doped with electrons
(Al, C), holes (Li), electrons and holes simultaneously (Al:Li, C:Li), or were substituted
isovalently. Substitutional chemistry of various elements and description of obtained (expected)
results were described in Chapter 3.
6.1. Undoped MgB2 crystals
A few MgB2 single crystals have been measured as reference samples. Figure 6.1 shows the
temperature dependences of the thermopower for two typical crystals. The measurements were
performed in the ab-plane (Sab, Fig. 6.1a) and along the c-axis (Sc, Fig. 6.1b). As usually for the
S(T) experiments, the data were collected with decreasing temperature. Some values of the
thermopower were also checked when temperature was increased.
0 50 100 150 200 250 300
0
2
4
6
8
10
12
Tc = 38.4 K
MgB2
S ab (µ
V/K)
T (K)
a
0 50 100 150 200 250 300
0
1
2
3
4
Tc = 38.4 K
S c (µV
/K)
T (K)
MgB2
b
Figure 6.1. Temperature dependence of the thermopower of two similar MgB2 single crystals (open
and closed circles) measured: (a) in the ab-plane and (b) along the c-axis direction.
The obtained results are very similar for both single crystals. Sab(T) data are almost identical
and Sc(T) data differ only slightly, roughly within the measurement accuracy. Due to the “old
method” (see Chapter 5.1.4) used for mounting of the crystals for the measurements along the c-
axis, the Sc(T) results scatter more than usually. Above Tc, the Sab(T) dependence is close to
linear in a wide temperature range, what suggests that the diffusive part of the thermopower is
dominating.

45
6.2. Crystals doped with electrons
The doping of MgB2 compound with electrons can be done in two ways: by the substitution
of magnesium with aluminum and boron with carbon. These substitutions may affect transport
properties of MgB2 in a different way, because as suggested by Kortus et al., substitution at the
B site is more effective with reference to superconductivity than substitution at the Mg site.[6.1,
6.2] The authors argued that for substitutions at the B site, the band filling is the main ingredient
responsible for changes in Tc and other parameters. On the other hand, Ervin and Mazin
suggested that for substitutions at the Mg site, the pair-breaking σ-π interband scattering should
be an important factor controlling the superconducting properties of the substituted MgB2
compound.[6.3] For the normal state properties, the influence of various substitutions seems to
be even more complex, since it was shown that holes from two σ-sheets and one π-sheet together
with electrons from the second π-sheet are important for conductivity.[6.1-6.4]
Al-substituted crystals
Aluminum occupies Mg sites and dopes with electrons mainly the σ-band of MgB2, however
the π-band can be also influenced by this doping.[6.2, 6.4] The doping decreases the Fermi
energy and leads to the reducing of the density of states (DOS) at the Fermi level. As a result,
both the π-band and the σ-band energy gaps decrease and Tc drops significantly for larger
amount of substituted Al.[3.1, 3.2]
Figure 6.2 shows the temperature dependence of the thermopower of Al-substituted MgB2
single crystals with various levels of substitution. The measurements were performed in the ab-
plane and along the c-axis. The red curve presents the thermopower for the unsubstituted crystal
0 50 100 150 200 250 300
0
2
4
6
8
10
12
x = 0.2; Tc = 27 K x = 0.27; Tc = 18.5 K x = 0.28; Tc = 15.5 K x = 0.28; Tc = 15.5 K
x = 0; Tc = 38.4 K x = 0.03; Tc = 35.5 K x = 0.08; Tc = 32.5 K x = 0.16; Tc = 28.6 K
S ab(µ
V/K)
T (K)
Mg1-xAlxB2 a
0 50 100 150 200 250 300
0
2
4
6b
x = 0.28; Tc = 15.5 K x = 0.28; Tc = 15.5 K
x = 0; Tc = 38.4 K x = 0.03; Tc = 35.5 K x = 0.08; Tc = 32.5 K x = 0.16; Tc = 28.6 K x = 0.27; Tc = 18.5 K
S c(µV/
K)
T (K)
Mg1-xAlxB2
Figure 6.2. Temperature dependence of the thermopower of aluminum substituted MgB2 single crystals measured: (a) in the ab-plane and (b) along the c-axis direction.

46
and is shown here for comparison. Thermopower values in the ab-plane change only slightly for
a weak doping, however these values decrease rapidly for crystals substituted with larger amount
of Al, thus for crystals with Tc below 20 K. At low temperatures, Sab(T) changes roughly linearly
and deviates from the linear dependence at higher temperatures, T > Td. For the unsubstituted
crystal, Td ≈ 150 K and this temperature decreases with Al content, similarly as observed for the
polycrystalline MgB2 material.[6.5] The linear S(T) dependence has been revealed for all MgB2
single crystals we have studied, unsubstituted and substituted with various elements, however the
temperature range where the linear dependence is observed depends on a kind and amount of the
substituted atoms. This property of S(T) has been interpreted as caused by the diffusion part of
the thermopower of the hole-type charge carriers.
For the c-axis direction, the thermopower changes non-monotonically: with increasing Al
content, Sc(T) first increases then decreases to very low and even negative values, at least at low
temperatures. We suggest that this effect is a result of combined two effects: charge doping and
interband scattering. It should be noticed that the single crystals with Tc < 20 K have less perfect
(or more defected) structure, thus the deformation of the B planes may be larger than expected
for the particular Al content. Consequently, the Sab(T) and Sc(T) results for heavily substituted
single crystals may not characterize properly the characteristic properties of the Al-substituted
homogenous MgB2 compound.
C-substituted crystals
Carbon occupies boron sites and dopes the σ-band of MgB2 with electrons. As a result, the σ-
band superconducting gap decreases due to band filing and the reduction of electronic DOS.
Simultaneously, the π-band gap remains nearly constant due to the compensation of band filling
and interband scattering.[3.1, 6.2] Furthermore, anisotropy of the upper critical field also
decreases due to increasing of the interband scattering.[3.4]
The temperature dependence of the thermopower of C-substituted MgB2 single crystals is
shown in Fig. 6.3. For these crystals, where C is substituted for B, both Sab and Sc decrease with
increasing carbon content and, for a larger amount of C, both of them change sign to negative.
For Sab, the introduction of about 10% (x = 0.2) of C is enough to observe negative values. For
Sc, negative values have been obtained already at 1.5% (x = 0.03) of the substituted carbon.
Small values of Sab and Sc suggest that the C-substituted MgB2 has more metallic character than
the unsubstituted compound. Thus, the substitution of C for B, which donates electrons mostly
into the σ-band, strongly influences the electronic structure and results in substantial changes of
the thermoelectric properties in both directions, parallel and perpendicular to the ab-plane. The

47
difference between Sab and Sc decreases with C content, so we conclude that the C substitution
not only fills the band but most probably also noticeably increases the interband scattering.
0 50 100 150 200 250 300-2
-1
0
1
2
3
4
5 x = 0; Tc = 38.4 K x = 0.03; Tc = 37.05 K x = 0.11; Tc = 34.5 K x = 0.2; Tc = 29.3 K
S ab (µ
V/K)
T (K)
MgB2-xCx
a
0 50 100 150 200 250 300-4
-3
-2
-1
0
1
2
b
x = 0; Tc = 38.4 K x = 0.03; Tc = 37.05 K x = 0.11; Tc = 34.5 K x = 0.2; Tc = 29.3 K
S c (µV
/K)
T (K)
MgB2-xCx
Figure 6.3. Temperature dependence of the thermopower of carbon substituted MgB2 single crystals measured (a) in the ab-plane and (b) along the c-axis direction.
6.3. Crystals doped with holes
As reported in literature, until now there is only one way to dope stoichiometric MgB2 with
holes, that is the substitution of twovalent Mg with monovalent Li.[3.1, 3.8] As shown by means
of first-principles calculations, Li dopes with holes almost entirely the π-band.[6.6] Thus this
doping results in increasing of DOS mainly in the π-band and, additionally, in growing of the
intraband scattering in this band.[3.7] The enhancement of the intraband scattering has been
confirmed by an increase of the in-plane resistivity observed for Li-substituted crystals.[3.8]
During the crystal preparation procedure, when Li-substituted crystals are annealed to remove an
excess of magnesium, the lithium atoms partially evaporate increasing the hole doping (lack of
magnesium corresponds to two additional holes in the conducting band). It should be noted that
the superconducting transition temperature for the Li-substituted crystals does not change
significantly, even for large amount of introduced lithium.
Figure 6.4 shows the temperature dependence of the thermopower for two Li-substituted
single crystals. Both of them have the same estimated concentration of lithium (see Chapter 3.2),
but values of the thermpower are different. Perhaps, the single crystal which shows lower values
of Sab and Sc is slightly better ordered. In general, the doping of the π-band with holes has a small
influence on both the superconducting transition temperature and the thermopower. The
temperature dependence of Sab and Sc for Li-substituted crystals is very similar to that for the
unsubstituted compound. This is consistent with the results obtained by band structure
calculations,[6.2, 6.6, 6.7] which show that the σ-band rather than the π-band is important for

48
normal-state electronic and even more important for superconducting properties of MgB2.
However, as mentioned above, contribution from the π-band to the normal state properties can
not be completely excluded. This we analyze somewhat dipper in Chapters 6.6 and 6.7.
0 50 100 150 200 250 300
0
2
4
6
8
10
12Mg1-xLixB2
x = 0; Tc = 38.4 K x = 0.09; Tc = 36.1 K x = 0.09; Tc = 36 K
S ab(µ
V/K)
T (K)
a
0 50 100 150 200 250 300
0
2
4
6
b
x = 0; Tc = 38.4 K x = 0.09; Tc = 36.1 K x = 0.09; Tc = 36 K
S c(µV/
K)
T (K)
Mg1-xLixB2
Figure 6.4. Temperature dependence of the thermopower of lithium substituted MgB2 single crystals measured (a) in the ab-plane and (b) along the c-axis direction.
6.4. Crystals substituted with Mn
Manganese occupies magnesium sites isovalently, so there is no charge doping in this case.
The Mn2+ ions are magnetic, therefore, a drastic suppression of superconductivity is observed as
a result of strong pair breaking due to the spin-flip scattering of charge carriers on magnetic
impurities.[3.11] Figure 6.5 shows the temperature dependence of Sab and Sc for Mn-substituted
crystals. It is interesting that even a small amount of substituted Mn (1.4%) can increase the
values of Sab and Sc for about 30% and 60%, respectively. A formula for total thermopower can
be written as: S = Sd + Sph + Sm, where Sd, Sph, and Sm are the diffusive, phonon-drag, and
magnetic parts, respectively. Thus the observed increase of Sab and Sc is a result of the introduced
magnetic scattering centers which scatter charge carriers very effectively.
The Mn-substitution is the only isovalent substitution reported in literature for single phase
MgB2 compound. Thus, it is not possible to separate directly the influence of the band filling
effects (Al, C, Li substitutions) from the non-magnetic intra- and interband scattering effects.
However, we will try to distinguish between the charge doping and scattering effects indirectly
analyzing the thermopower, resistivity, and upper critical field results obtained for variously
substituted MgB2 single crystals.

49
0 50 100 150 200 250 300
0
4
8
12
16
20x = 0; Tc = 38.4 Kx = 0.007; Tc = 29.3 Kx = 0.014 ; Tc = 18.6 Kx = 0.016 ; Tc = 12.2 Kx = 0.02; non sup.
S ab (µ
V/K)
T (K)
Mg1-xMnxB2
a
0 50 100 150 200 250 300
0
2
4
6
8
b
x = 0; Tc = 38.4 Kx = 0.007; Tc = 29.3 Kx = 0.014 ; Tc = 18.6 Kx = 0.016 ; Tc = 12.2 Kx = 0.02; non sup.
Mg1-xMnxB2
S c (µV
/K)
T (K) Figure 6.5. Temperature dependence of the thermopower of manganese substituted MgB2 single crystals measured: (a) in the ab plane and (b) along the c-axis direction.
6.5. Examples of co-substituted crystals
Within the S(T) studies of the co-substitution effects, Al-Li and C-Li substituted crystals
were investigated. Such a co-substitution was found to be far from trivial,[3.1, 3.8, 6.6] however
we may try to roughly interpret the obtained results. Aluminum dopes MgB2 with electrons and,
simultaneously, Li dopes the compound with holes.[3.6] For such co-doping, one may expect the
electron-hole compensation and thus the only significant influence of the introduced atoms on
the S(T) properties of substituted MgB2 may be the effects of scattering.
Figure 6.6 shows the S(T) results obtained in the ab-plane and along the c-axis direction for
the Al-Li co-substituted crystals. The only small influence of the introduced Al-Li atoms on S(T)
has been observed at higher temperatures despite of a large reduction of Tc present in the co-
substituted crystals. The observed increase of the thermopower at lower temperatures is most
likely due to the increase of the intraband scattering in the π-band, since Al and Li both
substitute for Mg. Slightly different results obtained for crystals with similar Tc may be attributed
to somewhat different compositions and thus different doping/scattering effects in these crystals.
As shown in Fig. 6.6, the behavior of S(T) for co-substituted crystals differ substantially from
that observed for the Al or Li single-substituted crystals. Considering, that Al-Li co-substitution
results only in minor changes of the thermopower, we assume that this substitution can not cause
any significant modifications of the Fermi surface. Thus we conclude that electrons coming from
Al to the π-band are compensated by holes coming from Li to the same band.[6.2, 6.4, 6.6, 6.7]
The observed reduction of Tc in co-substituted crystals may be explained as a result of
uncompensated electrons coming from Al to the σ-band, which is more important for
superconductivity.
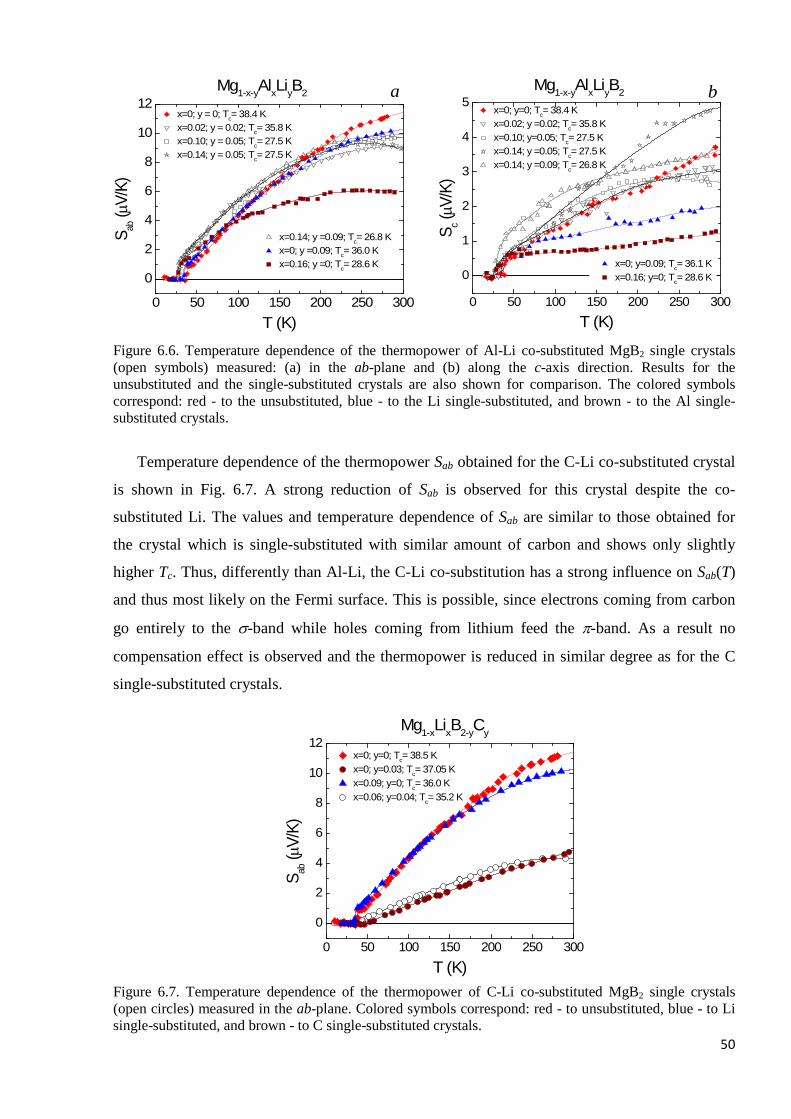
50
0 50 100 150 200 250 300
0
2
4
6
8
10
12
x=0.14; y =0.09; Tc= 26.8 Kx=0; y =0.09; Tc= 36.0 Kx=0.16; y =0; Tc= 28.6 K
x=0; y = 0; Tc= 38.4 Kx=0.02; y = 0.02; Tc= 35.8 Kx=0.10; y = 0.05; Tc= 27.5 Kx=0.14; y = 0.05; Tc= 27.5 K
S ab (µ
V/K)
T (K)
Mg1-x-yAlxLiyB2 a
0 50 100 150 200 250 300
0
1
2
3
4
5b
x=0; y=0.09; Tc= 36.1 Kx=0.16; y=0; Tc= 28.6 K
Mg1-x-yAlxLiyB2
x=0; y=0; Tc= 38.4 Kx=0.02; y =0.02; Tc= 35.8 Kx=0.10; y=0.05; Tc= 27.5 Kx=0.14; y =0.05; Tc= 27.5 Kx=0.14; y =0.09; Tc= 26.8 K
S c (µV
/K)
T (K)
Figure 6.6. Temperature dependence of the thermopower of Al-Li co-substituted MgB2 single crystals (open symbols) measured: (a) in the ab-plane and (b) along the c-axis direction. Results for the unsubstituted and the single-substituted crystals are also shown for comparison. The colored symbols correspond: red - to the unsubstituted, blue - to the Li single-substituted, and brown - to the Al single-substituted crystals.
Temperature dependence of the thermopower Sab obtained for the C-Li co-substituted crystal
is shown in Fig. 6.7. A strong reduction of Sab is observed for this crystal despite the co-
substituted Li. The values and temperature dependence of Sab are similar to those obtained for
the crystal which is single-substituted with similar amount of carbon and shows only slightly
higher Tc. Thus, differently than Al-Li, the C-Li co-substitution has a strong influence on Sab(T)
and thus most likely on the Fermi surface. This is possible, since electrons coming from carbon
go entirely to the σ-band while holes coming from lithium feed the π-band. As a result no
compensation effect is observed and the thermopower is reduced in similar degree as for the C
single-substituted crystals.
0 50 100 150 200 250 300
0
2
4
6
8
10
12x=0; y=0; Tc= 38.5 Kx=0; y=0.03; Tc= 37.05 Kx=0.09; y=0; Tc= 36.0 Kx=0.06; y=0.04; Tc= 35.2 K
S ab (µ
V/K)
T (K)
Mg1-xLixB2-yCy
Figure 6.7. Temperature dependence of the thermopower of C-Li co-substituted MgB2 single crystals (open circles) measured in the ab-plane. Colored symbols correspond: red - to unsubstituted, blue - to Li single-substituted, and brown - to C single-substituted crystals.

51
6.6. Simple model
Basically, the thermopower mostly depends on the scattering and the concentration of charge
carriers. The thermopower increases due to additional scattering as well as the reduction of the
charge carriers’ number. Thus the temperature dependence of the thermopower is governed by
the temperature dependences of the scattering rate and the density of states at the Fermi level.
Generally, the temperature dependence of the thermopower of materials without magnetic
impurities can be described by equation:
TBATSSS phd /+=+= , (6.1)
where Sd is a diffusive part of the thermopower, Sph is a part related to phonon drag, and A and B
are constants.
In the case when Sph is small (negligible), application of a simple model to the temperature
dependence of Sd allows to estimate the Fermi energy of the investigated materials. At low
temperatures, where the impurity scattering dominates, Mott’s formula can be used within the
free electrons approach for the diffusive part of the thermopower [6.8]:
FE
Bd e
TkS
∂∂
=ε
εσπ )(ln3
22
, (6.2)
where kB is the Boltzmann constant, e is the charge of electron and )(εσ is a conductivity-like
function for electrons of energy ε. In low temperature region, where the carrier relaxation time is
limited by impurity scattering and the resistivity is almost temperature independent, Eq. (6.2) can
be simplified to the following one:
)(3
22
TeSTk
d
BF
πε = , (6.3)
where εF is the Fermi energy calculated for holes from the top of the conduction band. However,
it should be noted, that this model assumes a spherical Fermi surface and temperature
independent relaxation time. The last assumption is valid only at low temperatures, where R(T) is
nearly constant (see Figs. 6.8 and 7.3), and thus Eq. (6.3) is not expected to explain the S(T)
dependence in the whole temperature range. Moreover, the Fermi surface of MgB2 is far from
being spherical and, additionally, apart from the major hole-like sheets the minor electron-like
sheet also exists making the analysis of S(T) even more complicated. Negative charges may
result in negative contribution to the Seebeck coefficient and this contribution may increase with
increasing temperature. Thus a significant deviation from the linear S(T) dependence towards
lower values is expected at higher temperatures, as it was indeed observed for MgB2 single
crystals studied in this work.

52
Figure 6.8 shows the temperature dependence of the in-plane resistance reduced with the
value at 300 K, for unsubstituted and C-substituted MgB2 single crystals.[3.4] The resistance is
almost independent on temperature up to about 100 K. Similar R(T) results have been obtained
for unsubstituted and Al-, Li-, and Mn-substituted crystals, as shown in Fig. 7.3 (Chapter 7).
Thus, within the simple model which we consider, the linear part of the S(T) dependence allows
us to assume that the thermopower of MgB2 mostly depends on the diffusive part and Eq. (6.3)
can be valid at low temperatures. Considering that transport properties at low temperatures are
defined mainly by hole carriers in the σ-band, Eq. (6.3) could be used for approximate estimation
of the Fermi energy of these carriers, i.e. the energy of holes at the top of the σ-band.[6.5, 6.9]
0 20 40 60 80 100
0.0
0.3
0.6
0.9
x = 0.05
x = 0
R(T)
/R(3
00)
T (K)
x = 0.095
MgB2-xCx
Figure 6.8. Temperature dependence of the reduced residual resistance of the C-substituted MgB2 single crystals with various concentrations of substituted atoms.[3.4]
Equation (6.3) shows that the Fermi energy of the major charge carriers depends on the slope
∆S/∆T. Thus, any significant changes of this slope due to substitutions may be interpreted as an
influence of the charge doping on the electronic structure. Table 6.1 shows the Fermi energy
calculated by using Eq. (6.3) for the MgB2 crystals with various substitutions. Thermopower
values measured along the ab-plane were taken for these calculations, assuming that electronic
transport in the considered temperature range is mainly due to hole carriers in the σ-band. It
should be noted, however, that the reliable estimation of EF can be done only for relatively large
values of S, because for small values (e.g., close to Tc), it is difficult to properly determine the
slope ∆S/∆T due to the increased measurement error. For this reason, EF for only three Al and
one C single-substituted crystals has been included in the Table, despite the fact that Sab for more
Al and C substituted crystals has been measured.
Values of EF listed in Table 6.3 are in reasonable agreement with the difference between the
Fermi energy and the top of the σ-band of about 0.9 eV obtained for MgB2 from the first-

53
principles calculations.[6.9] Smaller values of EF which we have obtained may be the result of
limited validity of our simple model, however the theoretical value of 0.9 eV can be also
overestimated due to the approximation used in the calculations. Results similar to ours have
been reported for the thermopower measurements of Al-substituted polycrystalline MgB2.[6.5]
For the polycrystalline samples, EF ≈ 0.5 eV has been obtained at low temperatures and this
value agrees very well with EF ≈ 0.4 eV estimated in our studies. For polycrystalline material,
larger EF derived from the S(T) dependence is expected, since the S(T) values are averaged and
thus lower than Sab(T) due to the influence of the smaller Sc(T) component.
Table 6.1. Slopes of the linear part of Sab(T) at the residual resistance temperature region and the Fermi energies calculated by using Eq. (6.3), for unsubstituted, single-substituted and co-substituted MgB2 single crystals.
Composition Tc, K ∆Sab/∆T, µV/K2 E F, eV
MgB2 38.4 0.062 0.39
Mg0.97Al0.03B2 35.5 0.077 0.31
Mg0.92Al0.08B2 32.5 0.066 0.36
Mg0.80Al0.20B2 27.0 0.057 0.42
MgB1.97C0.03 37.05 0.022 1.1
Mg0.91Li0.09B2 36.0 0.059 0.41
Mg0.91Li0.09B2 36.1 0.051 0.47
Mg0.993Mn0.007B2 29.3 0.086 0.28
Mg0.986Mn0.014B2 18.6 0.092 0.26
Mg0.984Mn0.016B2 12.2 0.068 0.35
Mg0.96Al0.02Li0.02B2 35.8 0.064 0.38
Mg0.81Al0.14Li0.05B2 27.5 0.062 0.39
Mg0.77Al0.14Li0.09B2 26.8 0.058 0.42
Mg0.94Li0.06B1.96C0.04 35.2 0.023 1.1
As discussed, the absolute value of EF can be estimated with Eq. (6.3) only very
approximately. However, the relative changes of EF, e.g., generated by substitutions, may be
studied more appropriately. When Al is substituted, both the σ-band and the π-band are doped
with electrons. Thus, the substitution of Al may influence the Fermi energy in a non-trivial way.
As shown in Table 6.1, small amount of Al decreases EF evidently, most likely due to the
reduced number of holes in the σ-band, however this energy increases for larger amount of Al,
probably due to the increased number of electrons in the electron-like sheet of the π-band.
Substitution of Li, which dopes holes mainly into the π-band, possibly results in a small increase

54
of EF. This can be interpreted as an effect of the increased amount of holes in the hole-like
second sheet of the π-band. Changes of EF for Al- and Li-substituted crystals are rather small.
However, EF for the C-substituted crystal increases substantially from ~0.4 to ~1 eV. In this
case, the hole-like σ-band is doped with electrons and, moreover, the scattering of charge
carriers in this band is expected to increase. Both effects should result in an enhancement of the
thermopower values, thus the observed reduction of S for the C-substituted crystals can not be
interpreted within the simple model we apply. No electron-hole compensation is observed for the
C-Li co-substituted crystal, where EF = 1.1 eV has been derived, which is the same as for the C
single-substituted crystal with similar amount of introduced C and only slightly higher Tc. This is
understood since, as mentioned before, electrons coming from C and holes coming from Li go to
different bands.
Formula (6.3) can’t be used to analyze the thermopower results for material with magnetic
impurities. When Mn is substituted for Mg, as in our case, it is substituted isovalently. Thus, the
observed significant increase of Sab and Sc has to be attributed to the pure scattering effect. Both
Sab and Sc increase systematically with increasing amount of the substituted Mn, thus with rising
concentration of the magnetic scattering centers. The only exception is the single crystals with
very low Tc = 12.2 K, where Sab has lower values as expected.
6.7. Discussion
Single crystals of MgB2 doped with electrons show a substantial decrease of thermopower
values, if only the doping level is high enough. Moreover, the C and strong Al substitutions even
lead to a change of the sign of Sab and Sc which may suggest significant modification of the
Fermi surface topology. Although the Fermi surface of MgB2 consists of sheets with hole and
sheets with electron states, the hole states dominate.[6.1] This was confirmed by observation of
the positive sign and the linear temperature dependence of the thermopower for majority of the
single crystals we studied. The linear S(T) region is usually located between Tc and 200 K (e.g.,
for the unsubstituted crystals). Within the free-electron model, Mott's formula for the diffusive
part of S(T) can be applied to estimate the Fermi energy in the low temperature region, where the
resistivity is temperature independent, and it is governed by the impurity scattering only. This
approach allows to assume that at low temperatures the slope of S(T) reflects properties of the
Fermi surface and the density of states at the Fermi level.
For C-substituted MgB2 single crystals, the linear part of the S(T) dependence extends to
higher temperatures. Thus, the C-substituted compound shows properties characteristic for the
disordered metals, where the phonon heat current is significantly suppressed. It is worth to note

55
that there is no substantial phonon drag contribution to the thermopower of the MgB2 single
crystals, both unsubstituted and substituted with Al, C, Li, and Mn. The phonon drag results in
an increase of the thermopower at low temperatures and is typical for pure metals. Deviation
from the linear S(T) dependence, which is observed at higher temperatures, can be related to the
contribution of charge carriers from the π-band electronic-like sheets of the Fermi surface.
For Al-substituted MgB2 single crystals, when both π-band and σ-band are considered to be
doped with electrons, the doping changes the S(T) characteristics moderately or, for heavier
doping, more substantially. Comparing the results obtained for C- and A-substituted crystals, we
conclude that much larger influence of the electron doping on S(T) and thus, we believe, on the
Fermi surface is observed when C is substituted for B and electrons are added to the σ-band. The
hole doping, which appears when Li is substituted for Mg and mainly the π-band is doped, has
only very weak influence on S(T) and thus on the Fermi surface sheets which contribute to
conductivity. The discussed results show that the σ-band rather than the π-band determines the
transport properties of MgB2 in the normal state. In certain conditions, however, an influence of
the π-band charge carriers (holes or electrons) on the transport characteristics may be also taken
into account.
Anisotropy of thermoelectric power
The relatively strong anisotropy of the thermopower we have observed has to be naturally a
result of the anisotropic multiband electronic structure of MgB2. Substitution of different atoms
is expected to reduce the anisotropy by introducing disordering into the crystal structure. In turn
the disordering usually leads to changes in the Fermi surface. Thus modification of the Fermi
surface due to doping or disordering of the crystal structure by various substitutions may be
detected through variation of the thermopower anisotropy. As known, it is difficult to find the
universal definition of the anisotropy for any values of S (e.g., try to compare the anisotropy for
Sab = 2 and Sc = 1, and for Sab = 2 and Sc = -1). However, to analyze the S(T) data, we define a
practical coefficient of the thermopower anisotropy as:
γ = γ+ or γ - , where
γ+ = Sab/Sc, for Sab and Sc > 1, and
γ - = Sc/Sab, for Sab and Sc < -1.
Figure 6.10 shows the temperature dependence of the thermopower anisotropy of the MgB2
single crystals which have |Sab| and |Sc| > 1. Except of Mn- and Li-substituted crystals, the others
show considerable decrease of the thermopower anisotropy in comparison with the unsubstituted
compound. Substituted C reduces the thermopower anisotropy γ similarly as Al and much more

56
effectively than Li and Mn. To explain the observed large reduction of γ it is reasonable to
assume that, apart from the electron doping of the σ-band, the substituted C increases notably the
interband scattering. The reduction of γ for Al-substituted crystals is also large and seems to
saturate with increasing amount of introduced Al. As Al dopes electrons both into the σ-band
and the π-band, an increase of the interband scattering could be lower, however it should be also
considered in this case. The suggested stronger influence of the substituted C on the interband
scattering has been confirmed by point contact spectroscopy measurements where the
superconducting energy gaps, ∆σ and ∆π, near and finally merge with increasing C content.[3.1,
6.10] Such a merging has not been observed for the Al and Mn-substituted MgB2 single
crystals.[3.1, 3.2, 6.11, 6.12]
The substitution of Li influences the thermopower anisotropy only slightly. This is because
Li, which dopes holes mainly to the π-band, does not change the carrier content in the more
anisotropic σ-band. For the Al-Li co-substituted crystal (14% Al, 9% Li), the thermopower
anisotropy is reduced less than for the Al single-substituted crystal (8% Al), despite of the much
larger amount of substituted Al in the co-substituted sample. This feature is considered as a
result of the electron-hole compensation effect, which however seems to be limited since Tc for
Al-Li co-substituted crystal remains low.
0 50 100 150 200 250 3000
1
2
3
4
5MgB2, TC= 38.4 KMg0.97Al0.03B2, TC= 35.5 KMg0.92Al0.08B2, TC= 32.5 K
γ
T (K)
MgB1.8C0.2, TC= 29.3 KMg0.993Mn0.007B2, TC= 29.3 K
Mg0.91Li0.09B2, TC= 36.1 KMg0.77Al0.14Li0.09B2, TC= 26.8 K
Figure 6.10. Temperature dependence of the thermopower anisotropy γ (see text) of MgB2 single crystals with various substitutions.
It is interesting to note, that the Mn, Li, C, and Al-Li substituted crystals reveal a clear
temperature dependence of the anisotropy. Such a behavior can be interpreted as an influence of
two effects; the crystal structure disordering and the charge doping. For electron doped MgB2,
the clear γ(T) dependence is observed only for crystals with low Tc, thus for crystals with a

57
substantially modified electronic structure. In the case of C and Al-Li substituted MgB2, the
apparent γ(T) dependence is observed for crystals which are heavily doped with electrons. In the
case of Mn-substituted MgB2, the clear γ(T) dependence is present for crystals where magnetic
scattering is extremely large.
Evident reduction of the thermopower anisotropy, observed for several compositions at lower
temperatures, can be understood since with decreasing temperature the phonon interaction
gradually reduces and the thermopower (and resistivity, see Fig. 7.3) depends more on the
impurities scattering. Let consider this for the Mn-substituted crystal, which at room temperature
shows similar thermopower anisotropy as for the unsubstituted compound. This anisotropy
significantly lowers with decreasing temperature and finally drops much below the values
obtained for the unsubstituted single crystals. This we try to explain considering that the increase
of S, observed for Mn-substituted crystals (the isovalent substitution), is caused by the magnetic
scattering. This scattering has larger influence on S at lower temperatures where phonons begin
to freeze and thus scatter the charge carriers less effectively. Indeed, the ratio S(1.4% Mn) to
S(0% Mn) is equal to about 1.3 at T = 300 K and increases to about 2.6 at 50 K. The magnetic
scattering in tern seems to be more isotropic than the phonon scattering since the charge carriers
strongly coupled to phonons come from the σ-band which shows a substantial anisotropy.[6.7]
References
[6.1] J. Kortus, I. I. Mazin, K. D. Belashchenko, V. P. Antropov, and L. L. Boyer, Phys. Rev. Lett. 86, 4656 (2001).
[6.2] J. Kortus, O. V. Dolgov, R. K. Kremer, and A. A. Golubov, Phys. Rev. Lett. 94, 027002 (2005).
[6.3] S. C. Erwin, I. I. Mazin, Phys. Rev. B 68, 132505 (2003).
[6.4] P. de la Mora, M. Castro, and G. Tavizon, J. Phys.: Condens. Matter 17, 965 (2005).
[6.5] B. Lorenz, R. L. Meng, Y. Y. Xue, and C. W. Chu, Phys. Rev. B 64, 052513 (2001).
[6.6] F. Bernardini and S. Massidda, Phys. Rev. B 74, 014513 (2006).
[6.7] D. Kasinathan, K.-W. Lee, and W. E. Pickett, Physica C 424, 116 (2005).
[6.8] F. J. Blatt, P.A. Schroeder, and C. L. Foiles, Thermoelectric Power of Metals (Plenum Press, New York, 1976).
[6.9] S. Suzuki, S. Higai and K. Nakao, J. Phys. Soc. Jpn. 70, 1206 (2001).
[6.10] R. S. Gonnelli, D. Daghero, A. Calzolari, G. A. Ummarino, Valeria Dellarocca, V. A. Stepanov, S. M. Kazakov, N. Zhigadlo, and J. Karpinski, Phys. Rev. B 71, 060503(R) (2005).
58
[6.11] M. Putti, C. Ferdeghini, M. Monni, I. Pallecchi, C. Tarantini, P. Manfrinetti, A. Palenzona, D. Daghero, R. S. Gonnelli, and V. A. Stepanov, Phys. Rev. B 71, 144505 (2005).
[6.12] R. S. Gonnelli, D. Daghero, G. A. Ummarino, A. Calzolari, M. Tortello, V. A. Stepanov, N. D. Zhigadlo, K. Rogacki, J. Karpinski, F. Bernardini, and S. Massidda, Phys. Rev. Lett. 97, 037001 (2006).

59
7. Results of resistivity studies
Resistance measurements were performed with the four-contact method, as described in
Chapter 5.2. Resistivity was calculated by using the formula:
lsR ⋅
=ρ , (7.1)
where R is a measured resistance, l is a distance between the voltage contacts, and s is a cross-
section area. Figure 7.1 shows the schematic diagram of a single crystal with electric contacts.
Inner wires register the voltage while the current flows through the outer wires. For MgB2 single
crystals, l >> d so formula (7.1) is much more sensitive to the thickness of a crystal than to the
distance between the voltage contacts. Thus, to reduce the error of the resistivity calculation, the
thickness should be measured very precisely.
Figure 7.1. Schematic diagram of a single crystal with electric contacts. Inner wires register the voltage while the current flows through the outer wires. In the Figure: l is a distance between the voltage contacts, s is a cross-section area, and d is a thickness of a crystal.
The Scanning Electron Microscope (SEM) has been used for estimation of the thickness of
MgB2 single crystals used for resistance measurements. Figure 7.2 shows the picture of six
crystals glued to a substrate for the thickness measurements. With this method the thickness is
measured with an accuracy of about few per cent.
Figure 7.2. Picture of the MgB2 single crystals glued to a substrate for the thickness measurements.

60
7.1. Resistivity measurements
Resistivity measurements have been performed in the temperature range from 1.5 to 300 K,
for the magnetic field up to 9 T oriented parallel to the c-axis or to the ab-plane of a single
crystal and for current flowing always in the ab-plane. The measured crystals and their
superconducting transition temperatures are listed in Table 7.1.
Table 7.1. Single crystals studied by resistance measurements and the superconducting transition temperatures obtained from the resistance (Tc
R) and magnetization (TcM) data.
Composition TcR (K) Tc
M (K)
MgB2 38.4 38.4
Mg0.91Li0.09B2 36.2 -
Mg0.92Al0.08B2 33.0 32.5
Mg0.994Mn0.006B2 30.9 30.0
Mg0.81Al0.19B2 26.8 26.8
Mg0.98Mn0.02B2 0 0
Figure 7.3 shows the temperature dependences of the resistivity, ρ(T), for all measured single
crystals, except of the crystal Mg0.98Mn0.02B2, which have the values of ρ(T) too large to be
shown in the scale of this Figure. For all substituted single crystals, the resistivity increases
substantially as a result of doping (for Al substitution) and as an effect of increased amount of
scattering centers (for Al, Li, and Mn substitutions). The resistivity of C-substituted MgB2 single
crystals has been measured previously for crystals coming from the same source and thus, for
our analysis, we will use the published results.[3.4] Independently of substitutions, ρ(T) shows
metallic-like behavior, however the resistivity increases and the RRR ratio, defined as ρ300K/ρ50K,
decreases for all substituted crystals.
Substitution of magnetic Mn increases resistivity much more than substitution of other
atoms, however RRR decreases relatively less. For example, introduction of Mn in the amount of
0.6 at.% increases ρ300K from 5.9 µΩcm (unsubstituted MgB2) to about 12 µΩcm.
Simultaneously, RRR changes from 6.9 to 3.3. For Al-substituted crystals, 8 at.% of Al increases
ρ300K less, only to about 10 µΩcm, however this substitution reduces RRR up to 2.6. It is
interesting to note that 2 at.% of substituted Mn increases ρ300K to about 24 µΩcm (see Fig. 7.4)
and changes the character of the ρ(T) dependence from metallic to semi-conducting at low
temperatures. This shows that the magnetic Mn ions work as very effective scattering centers as

61
concluded also from the thermopower results. The observed turn-up of the resistivity has been
related to the Kondo effect which appears at low temperatures when a small amount of magnetic
impurities interact with charge carriers. As shown in Fig. 7.4, the substitution of 2 at.% of Mn
completely suppresses the superconducting transition. It was reported that the spin-flip scattering
of charge carriers on magnetic moments of Mn ions is responsible for this effect.[3.11]
0 50 100 150 200 250 300
0
2
4
6
8
10
12 MgB2, Tc= 38.4 K Mg0.91Li0.09B2, Tc= 36.2 K Mg0.92Al0.08B2, Tc= 33.0 K Mg0.81Al0.19B2, Tc= 26.8 K Mg0.994Mn0.006B2, Tc= 30.9 K
ρ (µ
Ω cm
)
T (K)
Figure 7.3. Resistivity as a function of temperature for the MgB2 unsubstituted and Li, Al, and Mn substituted single crystals.
0 50 100 150 200 250 300
0
4
8
12
16
20
24 MgB2
Mg0.98Mn0.02B2
ρ (µ
Ω c
m)
T(K) Figure 7.4. Temperature dependence of the resistivity of the Mg0.98Mn0.02B2 single crystal in comparison with the resistivity of the MgB2 crystal.
7.2. Upper critical field
The temperature dependence of the upper critical field, Hc2, has been determined from the
R(T) measurements performed in a dc magnetic field. Figure 7.5 shows the transition to the
superconducting state at various magnetic fields, for the unsubstituted MgB2 single crystal. The

62
transition is sharp even at high fields confirming good quality of the single crystal. A value of
Hc2(T) is determined at the temperature corresponding to 50% drop of R from the normal-state
value, Rn. For this single crystal, a small positive magnetoresistance has been clearly observed at
higher fields. For these fields, a deviation from the roughly linear drop of ρ(T) appears as a result
of particular vortex dynamics (melting or distinguishing peak effects) in this compound.
Therefore, the superconducting transition temperature was determined as a temperature where
the red line crosses with the dashed line which marks a value of 0.5Rn (see Fig. 7.5). One more
example of the in-field resistance results is shown in Fig. 7.6, where the R(T) data for the Li-
substituted MgB2 single crystal with Tc = 36.2 K is presented.
15 20 25 30 35 400.0
0.1
0.2
0.3
0 T 0.2 T 0.5 T 1 T 2 T 3 T 4 T 6 T 8 T
R (m
Om
)
T (K)
B||ab(a)
10 15 20 25 30 35 400.0
0.1
0.2
0.3 0 T 0.1 T 0.3 T 0.6 T 1 T 1.4 T 1.8 T 2.2 T 2.4 T 2.6 T 2.8 T 3 T
R (m
Ohm
)
T (K)
B||c (b)
Figure 7.5. Temperature dependence of the resistance of the unsubstituted MgB2 single crystal at the dc magnetic field oriented parallel (a) to the ab-plane and (b) to the c-axis. The red straight line in (a) corresponds to the resistance (at 6 T) without a shift triggered by vortex dynamics. The middle dashed line corresponds to the criterion R = 0.5Rn, which was used to determine Hc2(T) values. For example, at µ0H = 6 T, the critical temperature is taken as the temperature which is marked by the vertical arrow. The blue short-dashed line shows the evolution of the vortex dynamic effects with magnetic field.
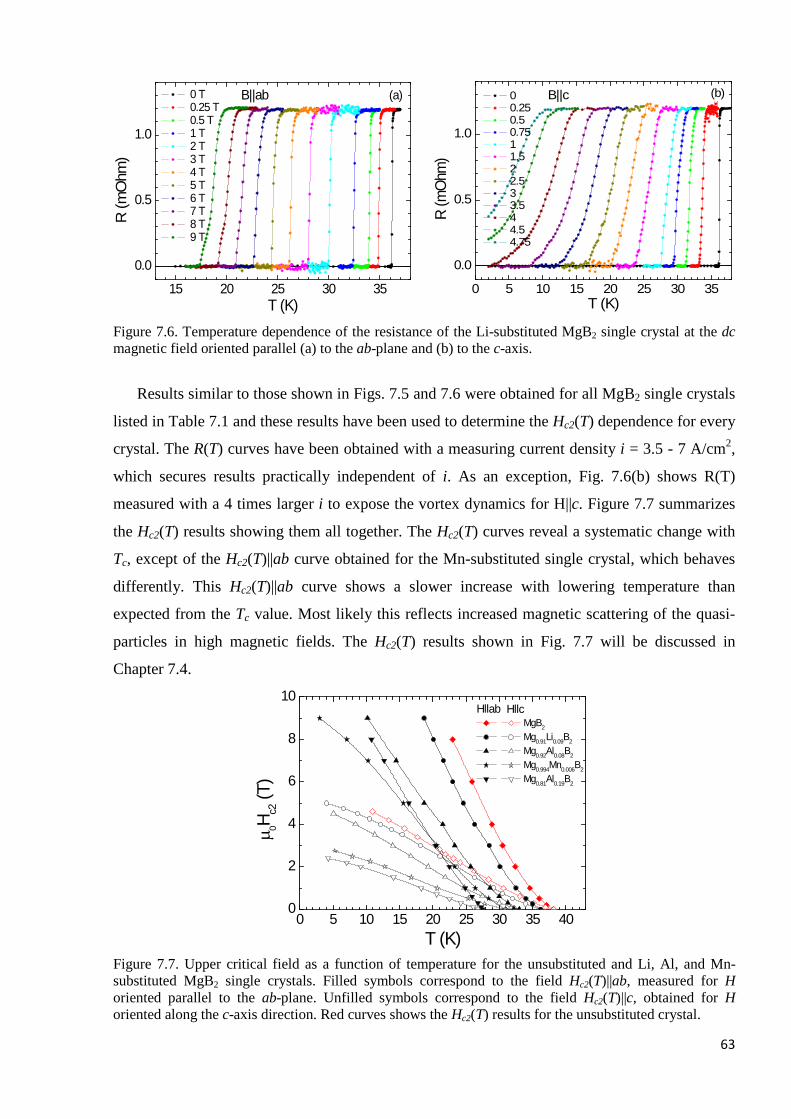
63
15 20 25 30 35
0.0
0.5
1.0
0 T 0.25 T 0.5 T 1 T 2 T 3 T 4 T 5 T 6 T 7 T 8 T 9 T
R (m
Ohm
)
T (K)
B||ab (a)
0 5 10 15 20 25 30 35
0.0
0.5
1.0
0 0.25 0.5 0.75 1 1.5 2 2.5 3 3.5 4 4.5 4.75
R (m
Ohm
)
T (K)
B||c (b)
Figure 7.6. Temperature dependence of the resistance of the Li-substituted MgB2 single crystal at the dc magnetic field oriented parallel (a) to the ab-plane and (b) to the c-axis.
Results similar to those shown in Figs. 7.5 and 7.6 were obtained for all MgB2 single crystals
listed in Table 7.1 and these results have been used to determine the Hc2(T) dependence for every
crystal. The R(T) curves have been obtained with a measuring current density i = 3.5 - 7 A/cm2,
which secures results practically independent of i. As an exception, Fig. 7.6(b) shows R(T)
measured with a 4 times larger i to expose the vortex dynamics for H||c. Figure 7.7 summarizes
the Hc2(T) results showing them all together. The Hc2(T) curves reveal a systematic change with
Tc, except of the Hc2(T)||ab curve obtained for the Mn-substituted single crystal, which behaves
differently. This Hc2(T)||ab curve shows a slower increase with lowering temperature than
expected from the Tc value. Most likely this reflects increased magnetic scattering of the quasi-
particles in high magnetic fields. The Hc2(T) results shown in Fig. 7.7 will be discussed in
Chapter 7.4.
0 5 10 15 20 25 30 35 400
2
4
6
8
10Hllc
µ 0Hc2
(T)
T (K)
MgB2
Mg0.91Li0.09B2
Mg0.92Al0.08B2
Mg0.994Mn0.006B2
Mg0.81Al0.19B2
Hllab
Figure 7.7. Upper critical field as a function of temperature for the unsubstituted and Li, Al, and Mn-substituted MgB2 single crystals. Filled symbols correspond to the field Hc2(T)||ab, measured for H oriented parallel to the ab-plane. Unfilled symbols correspond to the field Hc2(T)||c, obtained for H oriented along the c-axis direction. Red curves shows the Hc2(T) results for the unsubstituted crystal.
64
7.3. Theoretical description
As it was mentioned in Chapter 2, MgB2 has three different impurity scattering channels.
Two of them concern the intraband scattering within the σ and π Fermi surface sheets and one of
them involves the interband scattering which occurs between these sheets. Thus the MgB2
compound should be described by the theory of two-band superconductivity, which has to be
generalized to include the effects of impurities and, due to high-Tc, strong electron-phonon
coupling. According to Anderson theorem, the intraband electron diffusion, which is a result of
strong impurity scattering in the dirty limit, does not affect Tc, but reduces the intrinsic
anisotropy of the respected gap. On the other hand, the interband scattering may reduce Tc
significantly. It should be noted that in MgB2 the interband scattering is weak since the σ and π
orbitals are perpendicular each other.
Recently A. Gurevich developed a theory of the superconducting magnetic properties of a
two-gap superconductor in the dirty limit which could be applied to magnesium diboride [7.1,
7.2]. Based on the Usadel approach he obtained the Ginzburg-Landau (G-L) equations and the
equations for Tc and Hc2, with the account of both intraband and interband scattering by
nonmagnetic impurities. Here we shortly summarize his results.
Solutions of the Usadel equations revealed an unexpected feature of the normal state
electronic diffusivity tensors αβmD , which influence the superconducting properties of a two-gap
superconductor, namely the temperature dependence of Hc2. The index m means a relevant Fermi
surface sheet and α and β label the Cartesian indices, which correspond to the crystallographic
directions. Since αβσD and αβ
πD describe the underlying symmetry of the Fermi surface, the
properties of atomic orbitals, which form the σ and π bands, are reflected by the properties of αβσD and αβ
πD . Indeed, the value of cDσ is significantly smaller than aDσ and bDσ due to the 2D
nature of the σ-band which is formed by in-plane bounding and antibounding pxy orbitals of
boron. The values of cDπ , aDπ and bDπ , however, differ less due to the 3D character of the π-band
formed by the out-of-plane pz orbitals of boron. Gurevich showed that the property ( cDσ / aDσ ) <<
( cDπ / aDπ ) manifests the anomalous temperature dependence of the anisotropy of Hc2 in
comparison with the predictions of the anisotropic G-L theory for a one-gap superconductor.
Using the Usadel equations for calculation of the London penetration depth, Λαβ, the
following formula has been obtained:
∆
∆+∆
∆=ΛT
DNT
DNc
e2
tanh2
tanh4 2222
11112
222- αβαβαβ
π , (7.2)

65
where e is electron charge, N1 and N2 are partial densities of states in the bands σ and π, Δ1 and
Δ2 are order parameters of the bands σ and π, respectively. It’s clearly seen that -2αβΛ contain the
sum of intraband diffusivities of both bands which are notably different with respect to values
and anisotropies. Therefore the London penetration depth Λαβ is determined by the cleanest band
with maximum diffusivity.
Estimation of the upper critical field is much more complicated, especially in the wide terms,
thus it was done first for the case of negligible rates of the interband scattering, 'mmγ . Thus, it
could be assumed, that the nonmagnetic impurities do not affect Tc. Taking into account those
conditions, the final equation for Hc2 close to Tc has a form:
)()(8
22112
02 DaDa
TTH cc +
−=
πφ , (7.3)
where φ0 is the quantum of magnetic flux, and a1 and a2 are the G-L expansion coefficients of
the bands σ and π, respectively. Here, for the case D1 = D2, this equation yields the well known
result of the one-band theory, Hc2 = 4φo(Tc-T)/π2D.[7.3-7.5] Equation (7.3) shows that close to
Tc, the upper critical field of a two-gap superconductor is determined by the maximum
diffusivity D1 or D2, similarly as the London penetration depth.
At zero temperature, Hc2(0) is described by the formula:
=
2exp
2)0(
21
02
gDD
TH cc γ
φ , (7.4)
wDD
wDD
wg 0
2/1
2
1
2
122
20 ln2ln λλλ
−
++= − , (7.5)
where λ0, λ- and w are complex parameters describing the intra and interband coupling in the
BCS matrix, and γ is a constant that lnγ = 0.577.[7.2] For the case D1 = D2, Eqs. (7.4) and (7.5)
yield the result of the one-band dirty limit theory, Hc2(0) = φoTc/2γD. However, for D1 ≠ D2, the
theory developed by Gurevich predicts an unexpected increase of the upper critical field close to
zero temperature in comparison with well-known universal relation:
ccc THH 22 '69.0)0( = , (7.6)
where H’c2 = dHc2/dT at Tc. Generally, the slope of Hc2 at Tc can be also defined as:
nFB
c NeckH ρπ
4' 2 = , (7.7)
where NF is the density of states at the Fermi level, kB – the Boltzmann constant, ρn – the normal

66
state residual resistivity, and e is electron charge. Note that Eq. (7.7) describes Hc2’ for the case
of negligible interband scattering, that to some extent is realized in the MgB2 compound. For
very different diffusivities, Hc2(0) is determined by the band with minimum diffusivity [7.1]:
wcc e
DTH 2/)(
2
02
0
2)0( λλ
γφ +− −= , weDD /
120λ−<< , (7.8)
wcc e
DT
H 2/)(
1
02
0
2)0( λλ
γφ −− −= , weDD /
210λ−<< , (7.9)
These equations allow to analyze the main behavior of Hc2 at low temperatures when scattering
and thus diffusivities are changing due to substitutions.
Figure 7.8 shows the temperature dependence of the Hc2(T)/Hc2(0) ratio for different
D2/D1 ratios, as obtained in the frame of the presented theory. For D2 << D1 (see Fig. 7.8(a)), the
unusual upturn of the Hc2(T) dependence is observed at low temperatures. According to Eq. (7.8)
Figure 7.8. Temperature dependence of the reduced upper critical field, Hc2(T/Tc)/Hc2(0), obtained in the frame of the two-gap supercon-ductivity theory, for the different D2/D1 ratio, where D2 and D1 are the π-band and σ-band diffusivities, respectively.[7.1]

67
this behavior originates from properties of the π-band, the band with minimum diffusivity. It is
also clear that for D2 → 0, Hc2(T) diverges at T → 0. For D2 = D1 and D2 >> D1 (see Figs. 7.8 (b)
and (c)), the properties of Hc2 do not change significantly and the Hc2(T) dependence reminds the
classical one, except for the temperature region close to Tc, where an upward curvature is
observed when D2 >> D1.
To better understand how diffusivity influences the Hc2(T) dependence, it is useful to show
total Hc2(T) as a sum of contributions from different bands. This is illustrated in Fig. 7.9, for the
case D2 = 0.1D1, i.e. for MgB2 with the dirty π-band. As shown in the Figure, the unexpected
enhancement of Hc2(T) at low temperatures is due to the more isotropic π-band. Taken into
account that Hc2(T) is determined by cleaner band at higher temperatures (close to Tc) and by
dirtier band at lower temperatures, it is clear that the upper critical field at low temperatures can
be significantly increased by making the π-band dirtier than the σ-band. This can be obtained by
introducing disorder in the Mg sublattice, which may disturb the pz boron out-of-plane orbitals.
Figure 7.9. Temperature dependence of the upper critical field of a two-gap superconductor. The dashed curves show Hc2(T) calculated for the σ and π bands separately, in the one-gap dirty limit theory with Dπ = 0.1Dσ. The solid curve shows Hc2(T) calculated within the two-gap dirty limit theory.[7.2]
Another property of a two-gap superconductor which can be described in the frame of the
presented theory is the upper critical field anisotropy, γH = Hc2(T)||ab/Hc2(T)||c. Near Tc, this
anisotropy can be obtained from the angular dependences of Hc2:
))()(()(8)(
22112
02 θθπ
φθDaDa
TTH cc +
−= , (7.10)
where the angular-dependent diffusivities D1(θ) and D2(θ) for both bands are:
2/12)()(22)( ]sincos[)( θθθ cm
am
amm DDDD += , (7.11)

68
where Dm(a) and Dm
(c) mean the in-plane and out-of-plane diffusivities for the mth band,
respectively.[7.1] For the case D1 ≠ D2, the anisotropy of Hc2 depends on the in-plane diffusivity
ratio, D2(ab)/D1
(ab), as shown in Fig. 7.10. Since this ratio reflects the mutual relation between the
intraband diffusivities (scattering) of the π and σ bands, we may try to predict the behavior of the
Hc2 anisotropy of MgB2 substituted with different ions. Substitutions which increase scattering
(reduce diffusivity) in the σ-band should result in lowering of γH near Tc (see Fig. 7.10(c)).
Substitutions which increase scattering in the π-band are expected to reduce γH at low
temperatures (see Fig. 7.10(a)).
In conclusion, let us emphasize some points. The properties of the upper critical field of MgB2
strongly dependent on the intraband diffusivity ratio, D2/D1, which in turn depends on the
intraband impurity scattering. Thus, it is possible to increase Hc2 by smart substitutions at the Mg
or B sites. For instance, substitutions for Mg affect mainly the out-of-plane pz orbitals of B and,
Figure 7.10. Temperature dependence of the upper critical field anisotropy, γH = Hc2||ab/ Hc2||c (in Figure, ⊥
2||2 / cc HH ), for a two-gap
multi-band superconductor with a different in-plane diffusivity ratio, D2
(ab)/D1(ab).[7.1]

69
as a result, the π-band scattering increases decreasing D2. On the other hand, substitutions for B
disturb mainly the in-plane pxy orbitals of B and, consequently, the σ-band scattering increases
decreasing D1. Thus, using various substitutions, one has an opportunity to tune the D2/D1 ratio
and, in this way, to change Hc2 values and the temperature dependence. Considering the π and σ
bands as interplayed films, the total Hc2 is determined by the film with the highest Hc2 values
(see Fig. 7.9). For this model, Hc2(0) can be increased much above the one-gap value by
providing the condition: D1 >> D2. However, we should remember that the substitutions affect
the properties of MgB2 in quite complex way, since the introduced atoms change not only the
diffusivities but, due to charge doping, also the electronic structure.
Finally, it is important to note that the intraband diffusivities D1 and/or D2 may also determine
the slope of Hc2(T) at Tc, Hc2’ = dHc2/dT. This results from Eq. (7.3), which shows that for T ≈ Tc,
Hc2(T) and thus also Hc2’ depend on both diffusivities. For D1 much different than D2, the slope
Hc2’ is determined by the maximum diffusivity. Thus, for D2 ≠ D1, Eq. (7.3) yields the
approximate relation:
2'/1 cm HD ∝ , (7.12)
where Dm is the diffusivity which is a larger one. Due to the simple inverse relation between Hc2’
and the maximum diffusivity and Hc2(0) and the minimum diffusivity (see Eqs. (7.8) and (7.9)),
we may qualitatively determine the influence of various substitutions on the relevant intraband
scattering by measuring the Hc2(T) dependence in the temperature range from about 0 K to Tc.
Additional information on the intraband scattering may be obtained from the temperature
dependence of the Hc2 anisotropy, as shown in Fig. 7.10.
7.4. Discussion
Upper critical field
The model described above can be fully applied only in the dirty-limit case. That is, the
coherence length has to be comparable to or larger than the mean free path. The correct
evaluation of the mean free path in a multiband compound may be a difficult task, however it
was shown in many articles, that superconductivity in MgB2 single crystals may be considered in
the clean limit. On the other hand, when MgB2 is substituted or irradiated with neutrons or heavy
ions, the mean free path decreases. This requires the superconducting properties to be considered
in the dirty limit. For MgB2, the mean free path along the c-axis direction is sufficiently smaller
than in the ab-plane, due to the weak charge tunneling between adjacent boron layers.[7.2]
Therefore, the dirty limit can be easier obtained for superconductivity originated from the

70
electronic properties along the c-axis direction. Consequently, the relation between the mean free
path and the coherence length along the c-axis and the spacing between the boron layers seem to
be decisive. Table 7.2 shows the coherence lengths of the by-transport measured MgB2 single
crystals. Both, ξab(0) and ξc(0) have been estimated by using the extrapolated to 0 K upper
critical fields, Hc2(0)||ab and Hc2(0)||c (see Figure 7.7), and the formulas given by the anisotropic
G-L theory [7.8]:
)0(2/)0( 20
||2 abc
cH πξφ= , )0()0(2/)0( 0
||2 cabab
cH ξπξφ= . (7.15)
The coherence length along the c-axis is shorter than the coherence length in the ab-plane and longer
than the distance between boron planes, which is about 3.5 Å (see Table 2.2 in Chapter 2).
Therefore, the three dimensional anisotropic model proposed by Gurevich is strictly applicable to
the MgB2 compound.
Table 7.2. Superconducting transition temperature, upper critical fields, and coherence lengths, for H oriented parallel to the c-axis (||c) and to the ab-plane (||ab). The coherence lengths have been obtained within the anisotropic Ginsburg-Landau theory.
Composition Tc, K Hc2(0)||c, T Hc2(0)||ab, T ξab(0), Å ξc(0), Å
MgB2 38.4 6.44 22.3 72 20.1
Mg0.91Li0.09B2 36.2 5.26 21.4 79 19.5
Mg0.92Al0.08B2 33.0 5.14 13.0 80 31.7
Mg0.994Mn0.006B2 30.9 3.15 9.4 102 34.5
Mg0.81Al0.19B2 26.8 2.81 12.3 108 24.8
The temperature dependences of the upper critical fields of the MgB2 single crystals listed in
Table 7.2 are shown in Fig. 7.7. For all crystals, application of the Gurevich model to the Hc2(T)
results allow to conclude that the experimental dependences are very similar to the theoretical
curves with D2>>D1, for Hc2(0)||ab, and D2≥D1, for Hc2(0)||c (see Fig. 7.8). As we mentioned
above, the Mg-site substitutions may lead to the break-down of the pz boron out-of-plane orbitals
and result in a substantial increase of the disorder in the π-band. Consequently, diffusivity in the
π-band decreases and Hc2(T) additionally increases at low temperatures, as shown in Fig. 7.8(a).
Such the upturn of Hc2(T) has not been observed for our Mg-site substituted single crystals
suggestive that in this crystals D2 remains larger than D1.
The main influence of the Mg-site substitution on the Hc2(T) dependences (shown in Fig. 7.7)
is as follows. Close to Tc, the upward curvature of both Hc2(T)||ab and Hc2(T)||c decreases
revealing finally the linear Hc2(T) dependence, at least for the heavy Al-substituted single

71
crystals. For all substituted crystals, a reduction of Tc and the Hc2(T) values is observed. Detailed
analysis of the obtained results in the frame of the Gurevich model gives rise to the conclusion,
that the Mg-site substitutions increase charge carriers scattering mainly in the π-band and thus
decrease the diffusivity D2. However, for all substituted crystals, D2 remains larger than D1, thus
any unusual increase (upturn) of Hc2(T) has been observed at low temperatures. On the other
hand, an interesting behavior of the Hc2(T)||ab dependence has been revealed for the Al-
substituted crystal with Tc = 26.8 K. For this crystal, Hc2(T)||ab increases with lowering
temperature faster than expected from the Tc value (see Fig. 7.7). This feature can be interpreted
as a result of the significant increase of charge carriers scattering in the π-band and thus as a
result of the substantial decrease of D2 toward the relation D2 = D1. Shifting the superconducting
properties of the Al heavy-substituted crystal toward the case D2 ≥ D1 can be deduced from Fig.
7.8 (b) and (c), when we compare the results quantitatively.
Modification of the intra-band scattering, and thus diffusivities, due to substitutions may be
also determined by the analysis of the Hc2(T) slope at Tc, Hc2’(T) = dHc2/dT. The Hc2’(T) values
are listed in Table 7.3, for all single crystals we have studied in a magnetic field. The results
have been obtained for H parallel to the ab-plane or to the c-axis. It is clear that the Mg-site
substitutions may lead to the significant decrease of the Hc2’(T)||ab and Hc2’(T)||c close to Tc,
when only the substitution level is high enough. Thus, according to Eq. (7.3), we can assume that
in this case Hc2(T) is determined by changed maximum diffusivity, which is Dπ. Thus, for the
Mg-site substituted crystals, the σ-band is still dirtier than the π-band, even for the Al heavily-
substituted crystals.
Table 7.3. Derivative of the upper critical field, Hc2’(T) = dHc2/dT, close to Tc, for the single crystals measured in the field parallel to the ab-plane or parallel to the c-axis direction.
Composition Tc, K Hc2’(T)||ab, T/K Hc2’(T)||c, T/K
MgB2 38.4 -0.68 -0.19
Mg0.91Li0.09B2 36.2 -0.67 -0.18
Mg0.92Al0.08B2 33.0 -0.47 -0.19
Mg0.994Mn0.006B2 30.9 -0.39 -0.13
Mg0.81Al0.19B2 26.8 -0.32 -0.11
For the Mg-site substituted crystals, a substantial reduction of Tc has been revealed.
Considering that in MgB2 the interband scattering is weak, we conclude that the observed
changes of Tc have been caused by charge doping rather than by charge scattering. Thus the
systematic lowering of Hc2(0), which remains roughly proportional to Tc, seems also to be caused

72
by the charge doping rather than by the reduction of the diffusivity in the σ-band. Since for Mg-
site substituted crystals Dπ remains larger than Dσ, Hc2(0) is governed by Dσ only and, according
to Eq. (7.9), should increase when Dσ decreases. Thus, the observed reduction of Hc2(0) excludes
any substantial increase of the intraband scattering in the σ-band due to the Mg-site substitutions
at moderate level.
It seems to be clear that the small amount of the Mg-site substituted atoms doesn’t influence
significantly also the π-band scattering. As shown for weakly substituted crystals, e.g., with Li
(Tc = 36.2 K), no change of the Hc2(T) slope at Tc, Hc2’, has been observed (see Table 7.3). For
heavier substituted crystals, e.g., with Al (Tc = 26.8 K), both Hc2’||ab and Hc2’||c decrease but,
according to Eq. (7.12), an increase of Hc2’ is expected when the scattering in the π-band, which
is the band with maximum diffusivity, increases resulting in lower π-band diffusivity. Thus, for
the Mg-site non-magnetic substitutions, the main changes of the Hc2(T) dependences seems to be
caused by charge doping and less by weak interband scattering, which control Tc and thus also
the Hc2 properties. For the Mg-site substituted crystals, however, the intraband scattering has to
increase, since the resistivity systematically increases with the substitution level (see Fig. 7.3).
This seeming contradiction can be explain when we assume that the expected increase of Hc2’(T)
due to the increased intraband scattering is compensated by the lowering of Tc and thus Hc2(0)
due to the electron doping, which reduces the number of hole charge carriers. Similar
explanation of the Hc2’(T) behavior can be derived basing on the simple general formula (7.7).
The substitution of Li, which dopes MgB2 with holes, has been found to increase the number
of Mg vacancies which, in turn, leads to the additional rise of the amount of scattering centers.
Thus, studying the influence of the Li substitution on doping and scattering properties, the
number of introduced Li atoms and Mg vacancies should be known. Actually, there are only few
reports where the Li substitution effects were studied in MgB2 single crystals.[3.8, 6.6]
Generally, the main result of the Li substitution is a weak rise of the intraband scattering in the π-
band. Similar conclusion has been derived from our thermopower studies (see Chapter 6).
Formerly it was expected that the Li substitution might lead to the substantial increase of the
scattering in the π-band and also results in the hole doping. Such an influence should lead to the
domination of the σ-band diffusivity and, as a result, to the enhancement of Hc2(0), as was
predicted within the two-band model in the dirty limit. Analysis of Hc2(T) and Hc2’(T) showed
that Li substitution modifies the electronic structure and superconducting properties of MgB2
only very weakly, suppressing the critical temperature by 2 K, for the single crystal with 9% of
substituted Li. Since in MgB2 the major charge carriers are holes, the reduction of Tc due to the
Li substitution (hole doping) means that stoichiometric MgB2 is an optimally doped compound.

73
Substitution of Mn for Mg suppresses Tc and Hc2 due to the magnetic scattering of quasi-
particles by Mn ions. The Mn-substituted MgB2 single crystals were investigated in details by
magnetic measurements in Ref. 3.11. The authors did not found any significant influence of the
Mn substitution on the π- or σ-band diffusivities. Analysis of the Hc2(T) dependences of the Mn-
substituted single crystal measured by us shows that the Mn substitution affects the π-band and,
probably, also the σ-band diffusivities, since the uniform reduction of Hc2’(T)||ab and Hc2’(T)||c is
observed. The increased scattering in the π-band and, probably, also in the σ-band has been
evidenced as a substantial increase of the resistivity of Mg1-xMnxB2 single crystals with the
increasing Mn content (see Figs. 7.3 and 7.4). However, no upturn of the Hc2(T) dependence has
been revealed at low temperatures, thus we conclude that the π-band diffusivity still dominates in
the Mn-substituted single crystals. According to the formula (7.12), an increase of the scattering,
which reduces the diffusivity, should result in an increase of Hc2’(T), the slope of Hc2(T) at Tc. As
we observe the reduction of Hc2’(T), we claim that this formula doesn’t work for Mn-substituted
MgB2, as expected, since the Gurevich model considers the scattering effects due to non-
magnetic impurities.
Strong increase of the resistivity of Mn-substituted crystals is shown in Figs. 7.3 and 7.4.
Even 2% of substituted Mn destroys superconductivity completely. Moreover, for this single
crystal, ρ(T) shows the Kondo effect at low temperatures. The increase of ρ(T) with lowering
temperature is distinguishing showing the Kondo temperature equal to about 45 K. This effect is
interesting and will be studied separately.
There only substitution which increases Hc2(T) in MgB2 is the substitution of C for B. We
have not investigated by resistivity the C-substituted single crystals because such a substitution
was intensively studied by many groups.[3.4, 7.9-7.12]. An example of the temperature
dependence of Hc2 for the C-substituted single crystals is shown in Fig. 7.11, which has been
taken from Ref. 3.4. The data shows that the Hc2(T) slope increases and the Hc2 anisotropy
decreases with rising C content. The observed increase of Hc2’ and thus also Hc2(0) saturates at
about 4% of substituted C, and then the Hc2’ and Hc2(0) values begin to lower, for the C content
higher than about 10%.[7.9] The revealed reduction of the Hc2 anisotropy with the increasing C
content we discuss in the next subchapter.
As described in previous chapters, C which occupies the B site, dopes the σ-band with
electrons and increases the charge carriers (holes) scattering in this band. Thus, the reduction of
the mean free path, l, appears and the C-substituted MgB2 may be described in the frame of the
two-band model in the dirty limit. Indeed, strong reduction of l and the relaxation time, τ, has
been observed in all scattering channels, two intraband and one interband, as reported in
literature.[3.4, 7.9, 7.12]. However, even for single crystals with large C contents, the Hc2(T)

74
dependence doesn’t show the characteristic upward curvature at low temperatures, contrary to
the prediction of the Gurevich model, for the case when Dπ << Dσ (see Fig. 7.8a). Figure 7.12
shows the Hc2(T) dependences of the C-substituted polycrystalline samples, as reported in Ref.
7.9. More quantitative analysis of the Hc2(T) curves reveals properties which are characteristic
for the case Dπ > Dσ. Thus, taking into account that for unsubstituted MgB2 single crystals Dπ >>
Dσ, we conclude that the C substitution increases the charge carriers scattering in both bands,
however the scattering in the π-band is more effective, since in the unsubstituted compound this
band is much cleaner than the σ-band.
Figure 7.11. Phase diagram of the Mg(B1−xCx)2 single crystals with x=0.05 (circles) and 0.095 (triangles). The upper critical fields are derived using the “zero resistance” (solid symbols, solid lines) and the “onset” (open symbols, dashed lines) transition temperatures. The Figure has been taken from Ref. 3.4.
Figure 7.12. Superconducting upper critical field Hc2 as a function of temperature for polycrystalline Mg(B1-xCx)2 samples, 0 ≤ x ≤ 0.038. Inset: Hc2(T) close to Tc determined from temperature dependent resistivity (solid squares), field dependent resistivity (triangles), and field dependent magnetization (open squares). The Figure has been taken from Ref. 7.9.

75
Strong charge carriers scattering due to substituted C has been confirmed by systematic
resistivity measurements (Ref. 7.11) and our thermopower studies of the Mg(B1-xCx)2 single
crystals. Figure 7.13 shows the temperature dependence of the in-plane resistivity of the C-
substituted crystals, as taken from Ref. 7.11. A drastic increase of the residual resistivity is
observed with increasing C content. The values of ρn for the single crystal with x = 0.125 are 25
times larger than those for unsubstituted MgB2. Such a rise of the resistivity shows definitely the
substantial increase of the carrier scattering rate by introduced impurities and thus the decrease
of the mean free path and the coherence length.[7.11] The observed increase of Hc2(T) is a result
of the increased Dσ/Dπ ratio when the π-band became dirtier than the σ-band. Thus, we have
argued that the carbon substitution decreases the diffusivity in the π-band more rapidly than in
the σ-band. This conclusion has been confirmed in various experiments, such as point-contact
spectra, Hall coefficients, and the thermopower measurements.[7.11, 7.12]
Figure 7.13. Temperature dependence of the in-plane resistivity of Mg(B1−xCx)2 single crystals. The Tcs are 38, 35, 33, 30, 25, 10, and 2.0 K, for x = 0, 0.02, 0.035, 0.05, 0.075, 0.10, and 0.125, respectively. The Figure has been taken from Ref. 7.11.
Anisotropy of Hc2
The anisotropy of Hc2(T) can be successfully described by the two-band model in the clean
limit, for pure MgB2 (e.g., unsubstituted single crystals), and in the dirty limit, for the substituted
compound. Within the two-band model in the clean limit the behavior of the anisotropy of Hc2(T)
mostly depends on the interband coupling. In Ref. 7.13, the anisotropy γ = Hc2(T)||ab/Hc2(T)||c
was calculated as a function of temperature for different interband coupling strength. The results
show a weak γ(T) dependence for separated bands and a strong decrease of γ(T) with increasing
temperature, for compound with moderate interband coupling. Thus, the increase of the inter-

76
band coupling leads to changes of the Hc2(T) properties from characteristic for an isotropic
single-gap superconductor (zero interband coupling) to those which describe a two-gap
superconductor (finite interband coupling). Figure 7.14 shows the temperature dependence of the
high critical field anisotropy with different values of the interband coupling strength, η, and
dimensionless parameter, εc, which describes a small c-axis dispersion of the σ-band Fermi
surface cylinder.[7.13] Figure 7.14 reveals that both parameters, η and εc, are important for
determining the anisotropic properties of the upper critical field.
Figure 7.14. The anisotropy parameter γ = Hc2(T)||ab/Hc2(T)||c as a function of reduced temperature, for the various interband coupling strength, η, and the dimensionless parameter, εc, as taken from Ref. 7.13. The parameter εc describes a small c-axis dispersion of the σ-band Fermi surface. The closed circles correspond to results taken from Ref. 7.14.
The anisotropy of Hc2(T) for our MgB2 single crystals is shown in Fig. 7.15. To get the γ(T)
results for unsubstituted, and Li and Al substituted crystals, the Hc2(T) data (shown in Fig. 7.7)
was extrapolated to lower temperatures. Results for the C-substituted crystals were taken from
Ref. 7.11. For all single crystals, the anisotropy increases with decreasing temperature. Except of
the C-substituted crystals, the increase of γ(T) is rather small confirming a weak interband
coupling in the MgB2 compound (η = 0 in Fig. 7.14). According to Fig. 7.14, the stronger γ(T)
dependence observed for the C-substituted single crystals signifies a stronger interband coupling
in these crystals than in others. This is consistent with a general belief that the substitution of C
for B increases both the intraband and the interband scattering and may also result in larger
interband coupling.
The anisotropy for our unsubstituted MgB2 single crystal is lower than published in literature
(see, e.g., Refs. 3.2, 3.11). This could be ascribed to differences in the methods of the Hc2(T)
estimation. Indeed, the Hc2(T) values in Refs. 3.2 and 3.11 were obtained from magnetization
measurements, thus the different criterion to get the Hc2(T) results was applied. As the Hc2
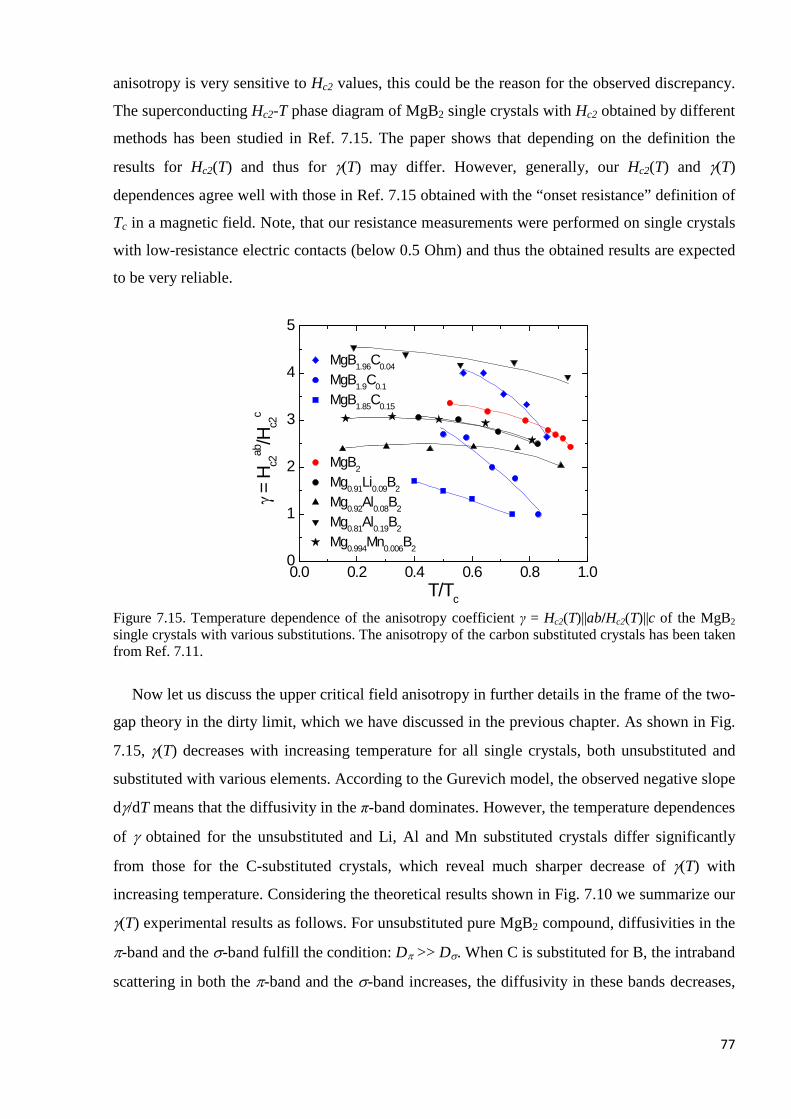
77
anisotropy is very sensitive to Hc2 values, this could be the reason for the observed discrepancy.
The superconducting Hc2-T phase diagram of MgB2 single crystals with Hc2 obtained by different
methods has been studied in Ref. 7.15. The paper shows that depending on the definition the
results for Hc2(T) and thus for γ(T) may differ. However, generally, our Hc2(T) and γ(T)
dependences agree well with those in Ref. 7.15 obtained with the “onset resistance” definition of
Tc in a magnetic field. Note, that our resistance measurements were performed on single crystals
with low-resistance electric contacts (below 0.5 Ohm) and thus the obtained results are expected
to be very reliable.
0.0 0.2 0.4 0.6 0.8 1.00
1
2
3
4
5
MgB1.96C0.04
MgB1.9C0.1
MgB1.85C0.15
MgB2
Mg0.91Li0.09B2
Mg0.92Al0.08B2
Mg0.81Al0.19B2
Mg0.994Mn0.006B2
γ = H
c2ab
/Hc2
c
T/Tc Figure 7.15. Temperature dependence of the anisotropy coefficient γ = Hc2(T)||ab/Hc2(T)||c of the MgB2 single crystals with various substitutions. The anisotropy of the carbon substituted crystals has been taken from Ref. 7.11.
Now let us discuss the upper critical field anisotropy in further details in the frame of the two-
gap theory in the dirty limit, which we have discussed in the previous chapter. As shown in Fig.
7.15, γ(T) decreases with increasing temperature for all single crystals, both unsubstituted and
substituted with various elements. According to the Gurevich model, the observed negative slope
dγ/dT means that the diffusivity in the π-band dominates. However, the temperature dependences
of γ obtained for the unsubstituted and Li, Al and Mn substituted crystals differ significantly
from those for the C-substituted crystals, which reveal much sharper decrease of γ(T) with
increasing temperature. Considering the theoretical results shown in Fig. 7.10 we summarize our
γ(T) experimental results as follows. For unsubstituted pure MgB2 compound, diffusivities in the
π-band and the σ-band fulfill the condition: Dπ >> Dσ. When C is substituted for B, the intraband
scattering in both the π-band and the σ-band increases, the diffusivity in these bands decreases,

78
however the relation between them becomes Dπ > Dσ (see Fig. 10c), since the scattering in much
cleaner π-band is more effective.
When Al is substituted for Mg, the intraband scattering in the π-band increases, the diffusivity
in this band decreases, and the electronic transport properties of MgB2 change toward the case
where Dπ ≥ Dσ (see Fig.10b). For the Al-substituted crystals, saturation of the γ(T) dependence is
observed at low temperatures. This tendency (lowering of dγ/dT), when keeping for increasing
amount of substituted Al, could lead to a positive slope of γ(T), which corresponds to the case
when diffusivity in the σ-band begins to dominate (see Fig. 7.10a). The γ(T) dependence cannot
be obtained at very low temperatures, because at these temperatures the Hc2 values are larger
than the magnetic field available in our experiment.
One striking feature of the Hc2 anisotropy is its reduction revealed for substituted single
crystals. This, we believe, is a result of increased interband scattering in crystals with introduced
scattering and doping centers. Due to the increased interband scattering and/or doping, the π and
σ bands can merge, as shown in Refs. 3.1 and 6.10, and explained in Ref. 6.2. The reduction of
the Hc2 anisotropy is much stronger in the C-substituted single crystals, since C introduced for B
provides the scattering centers into both the π-band and the σ-band and dopes with electrons the
σ-band, which is a crucial band for superconductivity. The non-monotonic change of γ with the
substitution level is observed for the Al-substituted crystals. This effect could be a result of the
combination of two mechanisms - scattering and doping. The main difference between the Al-
and C-substituted compound is that Al substitutes for Mg and thus introduces the scattering
centers mainly into the π-band. Moreover, substituted Al dopes with electron both the π-band
and the σ-band, as discussed many times in this work.
References:
[7.1] A. Gurevich, Phys. Rev. B 67, 184515 (2003).
[7.2] A. Gurevich, Physica C 456, 160 (2007).
[7.3] P. G. de Gennes, Phys. Kondens. Mater. 3, 79 (1964).
[7.4] N. R. Werthamer, E. Helfand, P.C. Hohenberg, Phys. Rev. 147, 295 (1966).
[7.5] K. Maki, ibid. 148, 362 (1966).
[7.6] L. P. Gor’kov, T. K. Melik-Barkhudarov, Zh. Eksp. Teor. Fiz. 45, 1493 (1963).
[7.7] A. V. Balatskii, L. I. Burlachkov, L. P. Gor’kov, ibid. 90, 1478 (1986) [63, 866 (1986)].
[7.8] L. P. Gor’kov, T. K. Melik-Barkhudarov, JETP 18, 1031 (1964).

79
[7.9] R. H. T. Wilke, S. L. Bud’ko, P. C. Canfield, D. K. Finnemore, Phys. Rev. Lett. 92, 217003 (2004).
[7.10] P. Samuely, P. Szabo, Z. Hol’anova, S. Bud’ko, P. Canfield, Physica C 435, 71 (2006).
[7.11] T. Matsui, S. Lee, S. Tajima, Phys. Rev. B 70, 024504 (2004).
[7.12] M. Matusiak, K. Rogacki, N. D. Zhigadlo, J. Karpinski, EPL, 90, 27009 (2010).
[7.13] T. Dahm, N. Schopohl, Phys. Rev. Lett. 91, 017001 (2003).
[7.14] L. Lyard et al., Phys. Rev. B 66, 180502(R) (2002).
[7.15] U. Welp, A. Rydh, G. Karepetov, W. K. Kwork, G. W. Crabtree, C. Marcenat, L. M. Paulius, L. Lyard, T. Klein, J. Markus, S. Blanchard, P. Samuely, P. Szabo, A. G. M. Jansen, K. H. P. Kim, C. U. Jung, H.-S. Lee, B. Kang, S.-I. Lee, Physica C 385, 154 (2003).

80
8. Conclusions
Availability of sizeable MgB2 single crystals doped with electrons and holes enabled us to
perform advanced studies of the anisotropic thermoelectric and superconducting properties of a
two-band superconductor. The thermopower of MgB2 single crystals substituted with C, Al, Li,
Mn, C-Li, and Al-Li has been investigated in the temperature range 10–300 K. Due to these
substitutions, MgB2 was doped with electrons (C, Al), holes (Li), electrons and holes
simultaneously, or it was substituted isovalently with magnetic element (Mn). Both the in-plane
(Sab) and the out-of-plane (Sc) thermopowers are positive for the non-substituted crystals and
both Sab and Sc change a sign for crystals doped with electrons, when C is substituted for B in the
amount larger than ~5 at% or when Al is substituted for Mg in the amount larger than 20 at%.
The observed substantial difference in the reaction of the thermopower on the substituted C and
Al has been associated with the fact that C introduces electrons mainly into the σ-band while Al
into both bands, mainly into the π-band, but also into the σ-band. When Li is substituted for Mg,
the π-band rather than the σ-band is doped with holes and the doping effect on the thermopower
is much more subtle. For the Li-substituted crystals, the intraband scattering seems to be
enhanced, while no evidence for the increased interband scattering has been found. When
magnetic Mn is substituted for Mg, it is substituted isovalently and thus the observed significant
increase of both Sab and Sc has been interpreted as a result of strong magnetic intraband
scattering.
The anisotropy of unsubstituted crystals, defined as a ration Sab/Sc, is slightly lower than 4,
and this anisotropy is reduced to about 2 by the substitution of C or Al. The reduction of Sab/Sc
due to substitution was interpreted as a result of both charge doping and interband scattering. A
lowering of the thermopower anisotropy with decreasing temperature has been observed for the
Li, Mn and C substituted single crystals, i.e., for crystals with enhanced intraband scattering. The
reduction has been explained as an effect of the gradual decrease of the more anisotropic phonon
interaction and thus an effective increase of the more isotropic scattering on impurities. The
phonon scattering seems to be anisotropic since the charge carriers strongly coupled to phonons
come from the quasi 2D σ-band which shows a substantial anisotropy.
The thermoelectric power and the resistance are both strongly influenced by doping when C is
substituted for B. This substitution results in a substantial decrease in both Sab and Sc, leading to
the change of their sign to negative for the C content equal to about 7% and 2%, respectively.
The observed decrease of the thermopower indicates more metallic and electron-conducting
character of the C-substituted crystals. The substitution of C reduces also the thermopower
anisotropy, most likely by increasing the interband scattering. The substitution of C, which

81
donates electrons mostly into the σ-band, strongly increases the Fermi energy of MgB2 and thus
results in the observed substantial changes of the thermoelectric properties.
For the Al-substituted MgB2 single crystals, when both π-band and σ-band are considered to
be doped with electrons, the doping changes the S(T) characteristics moderately and only for
heavily doped crystals more substantially. Comparing the results obtained for the C- and Al-
substituted crystals, we conclude that much larger influence of the electron doping on S(T) and
thus, we believe, on the electronic structure of MgB2 is observed when C is substituted for B.
This is the case when electrons are donated entirely to the σ-band. The hole doping, which
appears when Li is substituted for Mg and the π-band is mainly doped, has only very weak
influence on S(T) and thus on the Fermi surface sheets which contribute to conductivity. The
discussed results show that the σ-band rather than the π-band determines the transport properties
of MgB2 in the normal state. As widely known the σ-band is also more important for
superconductivity. In certain conditions, however, an influence of the π-band charge carriers
(holes or electrons) on the transport characteristics should also be taken into account.
When Li is additionally introduced into the crystal with substituted C, Sab practically does not
change, however Sc increases substantially. This effect suggests that holes, which go most likely
to the π-band, change the conducting features only in this band including an increase of the
intraband scattering and thus also the Sc values. Therefore, no (or very weak) electron-hole
compensation effect is observed for the C-Li co-substituted MgB2. The Al-Li co-substitution
results only in minor changes of the thermopower and thus this substitution can not cause any
significant modifications of the Fermi surface. We conclude that electrons coming from Al to the
π-band are compensated by holes coming from Li to the same band. The observed reduction of
Tc in co-substituted crystals may be explained as a result of uncompensated electrons coming
from Al to the σ-band, which is important for superconductivity. Generally, the electron and hole
doping effects seem to be asymmetric for the thermoelectric normal-state properties, similarly as
for the superconducting properties.
Superconducting properties of MgB2 has been studied by measuring the upper critical field of
the single crystals substituted with Li, Al, and Mn. The obtained results have been compared
with those for C-substituted crystals reported in literature. The most conclusive results have been
derived from the behavior of the upper critical field anisotropy, γ = Hc2(T)||ab/Hc2(T)||c. For the
Al-substituted single crystals, a non-monotonic change of the γ values with the substitution level
is observed. Small amount of Al leads to the decrease of γ but higher amount results in the
increase of γ in the whole temperature range from Tc to zero. Such a behavior of the Hc2
anisotropy has not been reported in literature. We believe it could be a results of the complex

82
effect of the electron doping of the both bands, π and σ, and of the increased scattering in the π-
band. Analyzing the behavior of γ(T) for the single crystals we have studied, we claim that the
results correspond to the case where the σ-band is dirtier than the π-band. The mutual relation
between the diffusivities in the π and σ bands, Dπ and Dσ, depends mainly on the intraband
scattering, which can be modified in different way by different kind of substitutions. For the Al-
substituted crystals, the effect of the by-doping changed density of states at the Fermi level has to
be taken into account to explain the observed results.
Reduction of the Hc2 anisotropy is smaller for the Li-substituted single crystal. This could be
understood if we consider that Li increases the intraband scattering (an increase of resistivity is
observed) in the π-band and dopes this band with holes. Thus, due to different doping, the Li
substitution works in different way than the Al substitution. The reduction of γ observed for Li-
substituted crystal can be small, because for this crystal, the interband scattering does not change
substantially. Similar conclusion has been derived from the thermopower results.
The anisotropy of Hc2 for the C-substituted crystals exhibits different behavior than observed
for other crystals. The values of γ(T) decrease with increasing temperature much faster. This has
been attributed to the increased intraband scattering in the σ-band and, consequently, different
diffusivities in both bands, i.e. Dπ > Dσ. The strong reduction of the Hc2 anisotropy with the C
content has been observed and related to the increased interband scattering, as also concluded
from the thermopower results.
Concerning the by-substitution-induced scattering, the following general conclusions can be
derived. For the MgB2 single crystals, the substitution with Li increases the intraband scattering
in the π-band moderately, without changing noticeably of the interband scattering. The
substitution with Al increases the intraband scattering also in the π-band, and in the similar scale,
however, most likely this substitution results also in the weak interband scattering. The most
interesting and important seems to the substitution of MgB2 with C. This substitution increases
the intraband scattering both in the σ-band and the π-band, and influences substantially the
interband scattering as well. As a result, the upper critical field significantly increases and its
anisotropy decreases. Substituted C reduces also the anisotropy of the normal state properties, as
showed our thermopower results. These knowledge, w believe, could help to modify the normal-
state and superconducting properties of the MgB2 compound to obtain material even more
interesting for small or large scale applications.

83
List of publications:
1) K. Oganisian, P. Gluchowski, W. Strek, Magnetic Studies of GaN Nanoceramics Doped with 1% of Cerium, Journal of Rare Earths 29, 1183 (2011).
2) M. Ciszek, K. Rogacki, K. Oganisian, N. D. Zhigadlo, J. Karpinski, Influence of the Carbon Substitution on the Critical Current Density and AC Losses in MgB2 Single Crystals, The European Physical Journal B 78, 359 (2010).
3) K. Rogacki, K. Oganisian, C. Sulkowski, N. D. Zhigadlo, S. Katrych and J. Karpinski, Transport Properties of MgB2 Single Crystals Doped with Electrons and Holes, Journal of Physics and Chemistry of Solids 69, 3202 (2008).
4) K. Oganisian, K. Rogacki, C. Sulkowski, N.D. Zhigadlo, S. Katrych and J. Karpinski, Thermoelectric Power of MgB2 Single Crystals Doped with Holes and Electrons, Acta Physica Polonica A 114, 191 (2008).
5) A. I. Gubin, N. T. Cherpak, A. A. Lavrinovich and K. Oganisian, Temperature Dependence of the Microwave Conductivity of YBCO Film in the Normal State, Low Temperature Physics 33, 818 (2007).
Attended Conferences:
1) The Second International Conference on Rare Earth Materials (REMAT), 13-15 June 2011, Wroclaw, Poland;
Magnetic studies of GaN nanoceramics doped with 1% of Ce.
2) Applied Superconductivity Conference, 1-6 August 2010, Washington, USA; Anisotropy of Li, Al, C and Mn substituted MgB2 single crystals studied by thermopower and upper critical field.
3) XIV Krajowa Szkoła Nadprzewodnictwa, Nadprzewodnictwo i niejednorodne układy skondensowane, 13-17 października 2009, Ostrów Wielkopolski, Poland; Anisotropy of Li, Al, and C substituted MgB2 single crystals studied by thermopower.
4) 9th European Conference on Applied Superconductivity (EUCAS'09), 13-17 September, 2009, Dresden, Germany; Anisotropy of Li, Al, and C substituted MgB2 single crystals studied by thermopower.
5) 13 Krajowa Szkoła Nadprzewodnictwa, Nadprzewodnictwo, uporządkowanie spinowe i ładunkowe, 6-10 listopada 2007, Lądek Zdrój, Poland; Thermoelectric power of MgB2 single crystals doped with holes and electrons.
6) 8 Seminar and Workshop, Applications of Superconductors, 17-20 June 2007, Nałęczów, Poland; uczestnictwo bez prezentacji.

84
Appendix A
As was mentioned in Chapter 5.2.3, for resistance and upper critical field measurements, a PPMS
sequence has been written, individually for every single crystal measured, considering the intrinsic
physical characteristics. In instance, following sequence has been used in Hc2||ab measurement of
Mg0.92Al0.08B2 single crystal.
ACT Append Datafile "C:\Documents and Settings\PPMS\Desktop\Users Data\ MgB2\Karen\MgB2-
Al_AN415-K2\2010-02-03_MgB2-Al_AN415-K2_RvT_HIIab.dat"
Set Temperature 300K at 12K/min. Fast Settle
Wait For Temperature, Delay 10 secs, No Action
Scan Temp from 300K to 40K at 10K/min, in 53 steps, Uniform, Fast
ACT Resistivity Ch.1 0.500mA 19.00Hz 2.00sec
End Scan
Scan Temp from 38K to 34K at 0.5K/min, in 9 steps, Uniform, Sweep
ACT Resistivity Ch.1 0.500mA 19.00Hz 2.00sec
End Scan
Scan Temp from 33.5K to 30K at 0.05K/min, in 71 steps, Uniform, Sweep
ACT Resistivity Ch.1 0.500mA 19.00Hz 2.00sec
End Scan
Set Temperature 35K at 10K/min. Fast Settle
Wait For Temperature, Delay 10 secs, No Action
Set Magnetic Field 10000.0Oe at 200.0Oe/sec, Linear, Persistent
Wait For Field, Delay 10 secs, No Action
Set Temperature 33K at 10K/min. Fast Settle
Wait For Temperature, Delay 10 secs, No Action
Scan Temp from 33K to 28K at 0.1K/min, in 34 steps, Uniform, Sweep
ACT Resistivity Ch.1 0.500mA 19.00Hz 2.00sec
End Scan
Set Temperature 35K at 10K/min. Fast Settle
Wait For Temperature, Delay 10 secs, No Action
Set Magnetic Field 30000.0Oe at 200.0Oe/sec, Linear, Persistent
Wait For Field, Delay 10 secs, No Action
Set Temperature 28K at 10K/min. Fast Settle
Wait For Temperature, Delay 10 secs, No Action
Scan Temp from 28K to 20K at 0.1K/min, in 41 steps, Uniform, Sweep
ACT Resistivity Ch.1 0.500mA 19.00Hz 2.00sec
End Scan
Set Temperature 35K at 10K/min. Fast Settle
Wait For Temperature, Delay 10 secs, No Action
Set Magnetic Field 30000.0Oe at 200.0Oe/sec, Linear, Persistent
Wait For Field, Delay 10 secs, No Action

85
Set Temperature 28K at 10K/min. Fast Settle
Wait For Temperature, Delay 10 secs, No Action
Scan Temp from 28K to 20K at 0.1K/min, in 41 steps, Uniform, Sweep
ACT Resistivity Ch.1 2.000mA 19.00Hz 2.00sec
End Scan
Set Temperature 35K at 10K/min. Fast Settle
Wait For Temperature, Delay 10 secs, No Action
Set Magnetic Field 60000.0Oe at 200.0Oe/sec, Linear, Persistent
Wait For Field, Delay 10 secs, No Action
Set Temperature 23K at 10K/min. Fast Settle
Wait For Temperature, Delay 10 secs, No Action
Scan Temp from 23K to 10K at 0.1K/min, in 66 steps, Uniform, Sweep
ACT Resistivity Ch.1 0.500mA 19.00Hz 2.00sec
End Scan
Set Temperature 40K at 10K/min. Fast Settle
Set Magnetic Field 0.0Oe at 200.0Oe/sec, Oscillate, Persistent
Wait For Temperature, Field, Delay 10 secs, No Action
Shutdown Temperature Controller