uncorrected mathematics and...
TRANSCRIPT

Mathematicsand resources
The main mathematical ideas investigated are:▶ interpreting information, making comparisons
and performing calculations in relation to requirements and data relevant to water availability and usage
▶ performing calculations involving length, area and volume in relation to land and catchment areas and water storage
▶ estimating methods for area and volume▶ calculating and comparing household electricity
consumption and costs▶ calculating and interpreting statistics related to
electricity consumption and cost.
FOCUS STUDYSyllabus references: FSRe1, FSRe2, FSRe3
Outcomes: MG2H-1, MG2H-2, MG2H-3, MG2H-4, MG2H-5, MG2H-7, MG2H-9, MG2H-10
14_LEY_IM12_HSC2_SB_23782_SI.indd 42914_LEY_IM12_HSC2_SB_23782_SI.indd 429 8/08/13 10:48 AM8/08/13 10:48 AM
UNCORRECTED PAGE PROOFS
FOC
US
STU
DY
Insight Mathematics General 12 HSC Course 2430
14A Water availability and usageWater availability and usage
EXERCISE 14A1 a Use the information in the sample water bill on the opposite page to answer the following questions.
i What is the supply period for this bill?
ii How many days is this?
b The fi xed charges are those payable for having water and sewerage available to your property. What is the
total of the fi xed charges for this account?
c i How much water did this household use for the period shown?
ii Using the answer to part a ii, calculate the average daily water usage.
d The usage charge is what you pay for the amount of water that you use.
i What is the cost per kilolitre of water?
ii What is the total cost (fi xed and usage) for this period?
iii Using the answer to part a ii, calculate the average daily cost.
e Assuming the same fi xed and usage charges, was this bill smaller or larger than:
i the last bill?
ii the bill for the same period last year?
f Assume the same fi xed and usage charges.
i Calculate the water usage charge for the last bill.
ii Calculate the total charges for the last bill.
g The water usage charge last year was $2.13 per kL. What is the diff erence between the water usage charge
for this bill and that for the bill for the same period last year?
h How did the average daily water consumption for this bill compare with the local area average?
i The table ‘Targets for water-effi cient households’ shown on the bill allows you to compare a household’s
water usage with the supplier’s targets for ideal water-effi cient households. This bill is for a medium-sized
property with fi ve occupants.
i Is this household’s usage smaller or larger than the ideal effi cient usage shown in the table?
ii By how much would this household have to change its daily usage to reach the ideal?
iii If a bucket can hold 12 L of water, how many buckets is this equivalent to?
2 Use the water-effi cient targets table to determine the ideal daily water consumption for these households.
a a large property with four people b a small property with two people
c a 600 m2 property with three people d an 18 m by 40 m property with six people
3 In 2013, residential properties in the region managed by Hunter Water were charged a water availability fee of
$18.92 p.a. and a water usage rate of $2.08/kL. Calculate the total annual cost for a property that uses 190 kL
of water.
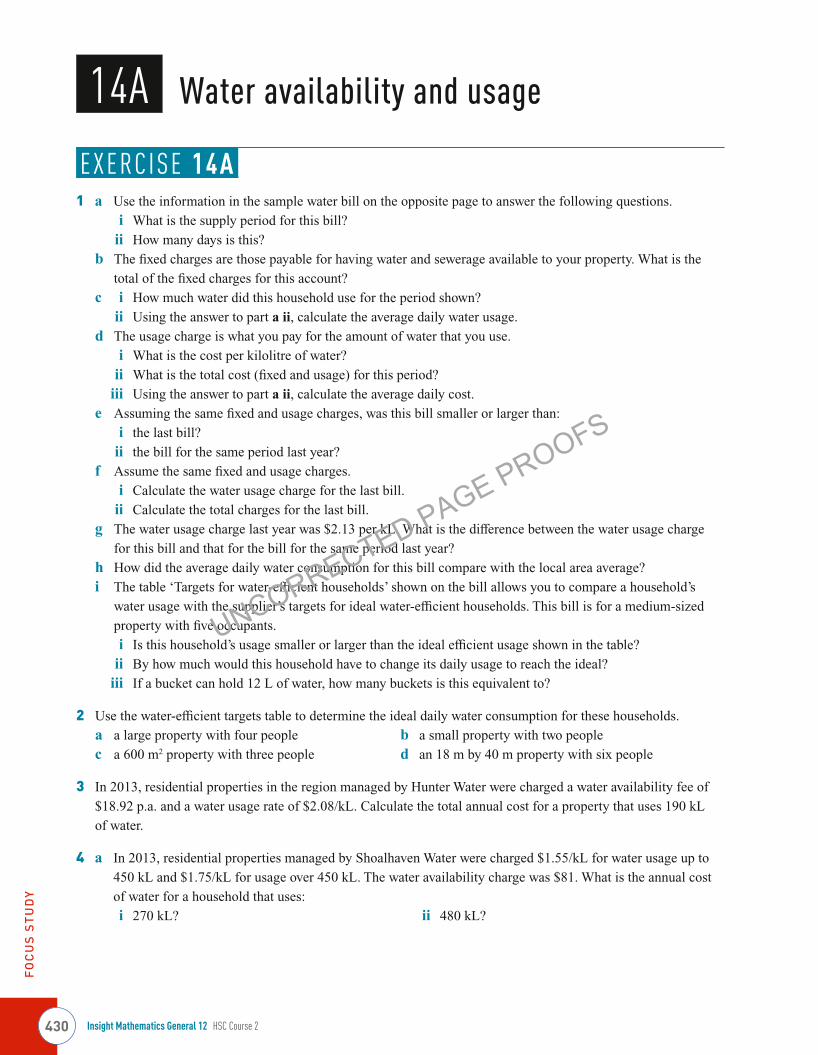
4 a In 2013, residential properties managed by Shoalhaven Water were charged $1.55/kL for water usage up to
450 kL and $1.75/kL for usage over 450 kL. The water availability charge was $81. What is the annual cost
of water for a household that uses:
i 270 kL? ii 480 kL?
14_LEY_IM12_HSC2_SB_23782_SI.indd 43014_LEY_IM12_HSC2_SB_23782_SI.indd 430 8/08/13 10:48 AM8/08/13 10:48 AM
UNCORRECTED PAGE PROOFS

FOC
US
STU
DY
431Chapter 14 Mathematics and resources
Property sizePeople per household Small Medium Large
247 L/day 249 L/day 267 L/day
367 L/day 375 L/day 396 L/day
463 L/day 477 L/day 498 L/day
546 L/day 565 L/day 587 L/day
621 L/day 645 L/day 666 L/day
689 L/day 718 L/day 739 L/day
Note: A small property has an area of <500 m2.A medium property has an area between 501 m2 and 700 m2.A large property has an area between 701 m2 and 900 m2.
Targets for water-efficient households
MONT BAY WATER
Mr S Ample12 Water StreetNORTH WATERVILLE
Account for residential property
Usage Charges (GST does not apply)For period 01/01/2013 to 31/03/2013 (90 days)
Water Usage68 kL @ $2.17 per kL = $147.56
Total Usage Charges $147.56
Service Charge Details (GST does not apply)Water Service Charge $47.68Sewerage Service Charge $153.75
Total Service Charges $201.43
Total Current Charges $348.99
ACCOUNT DETAILS
NOTICEBOARD
Customer Number
Due Date
Amount
22988701
23 April 2013
$348.99
YOUR CHARGES EXPLAINEDWater UsageRecorded by your water meter, this charge covers the amount of water used at your property. This charge is billed per kilolitre (kL) of water you use.
Service ChargesYour water and sewerage service charges are fixed charges for access to our water supply and sewerage systems. They also help us maintain, renew and expand these systems so we can continue to provide you with high quality drinking water and safe sewerage removal now and into the future.
Your average daily water usage comparison
Aver
age
litre
s pe
r day
0
200
400
600
800
1000
Same time last year
Last bill This bill Local area average
100
300
500
700
900
14_LEY_IM12_HSC2_SB_23782_SI.indd 43114_LEY_IM12_HSC2_SB_23782_SI.indd 431 8/08/13 10:48 AM8/08/13 10:48 AM
UNCORRECTED PAGE PROOFS
FOC
US
STU
DY
Insight Mathematics General 12 HSC Course 2432
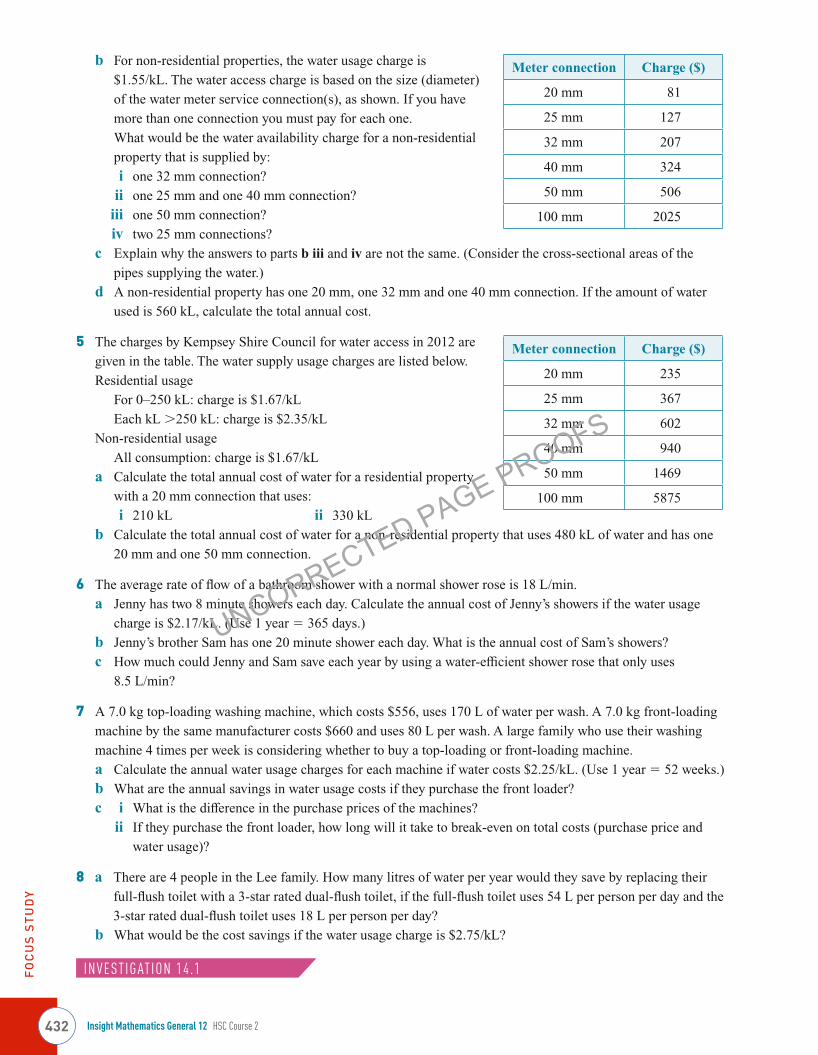
b For non-residential properties, the water usage charge is
$1.55/kL. The water access charge is based on the size (diameter)
of the water meter service connection(s), as shown. If you have
more than one connection you must pay for each one.
What would be the water availability charge for a non-residential
property that is supplied by:
i one 32 mm connection?
ii one 25 mm and one 40 mm connection?
iii one 50 mm connection?
iv two 25 mm connections?
c Explain why the answers to parts b iii and iv are not the same. (Consider the cross-sectional areas of the
pipes supplying the water.)
d A non-residential property has one 20 mm, one 32 mm and one 40 mm connection. If the amount of water
used is 560 kL, calculate the total annual cost.
5 The charges by Kempsey Shire Council for water access in 2012 are
given in the table. The water supply usage charges are listed below.
Residential usage
For 0–250 kL: charge is $1.67/kL
Each kL >250 kL: charge is $2.35/kL
Non-residential usage
All consumption: charge is $1.67/kL
a Calculate the total annual cost of water for a residential property
with a 20 mm connection that uses:
i 210 kL ii 330 kL
b Calculate the total annual cost of water for a non-residential property that uses 480 kL of water and has one
20 mm and one 50 mm connection.
6 The average rate of fl ow of a bathroom shower with a normal shower rose is 18 L/min.
a Jenny has two 8 minute showers each day. Calculate the annual cost of Jenny’s showers if the water usage
charge is $2.17/kL. (Use 1 year = 365 days.)
b Jenny’s brother Sam has one 20 minute shower each day. What is the annual cost of Sam’s showers?
c How much could Jenny and Sam save each year by using a water-effi cient shower rose that only uses
8.5 L/min?
7 A 7.0 kg top-loading washing machine, which costs $556, uses 170 L of water per wash. A 7.0 kg front-loading
machine by the same manufacturer costs $660 and uses 80 L per wash. A large family who use their washing
machine 4 times per week is considering whether to buy a top-loading or front-loading machine.
a Calculate the annual water usage charges for each machine if water costs $2.25/kL. (Use 1 year = 52 weeks.)
b What are the annual savings in water usage costs if they purchase the front loader?
c i What is the diff erence in the purchase prices of the machines?
ii If they purchase the front loader, how long will it take to break-even on total costs (purchase price and
water usage)?
8 a There are 4 people in the Lee family. How many litres of water per year would they save by replacing their
full-fl ush toilet with a 3-star rated dual-fl ush toilet, if the full-fl ush toilet uses 54 L per person per day and the
3-star rated dual-fl ush toilet uses 18 L per person per day?
b What would be the cost savings if the water usage charge is $2.75/kL?
INVESTIGATION 14.1
Meter connection Charge ($)
20 mm 81
25 mm 127
32 mm 207
40 mm 324
50 mm 506
100 mm 2025
Meter connection Charge ($)
20 mm 235
25 mm 367
32 mm 602
40 mm 940
50 mm 1469
100 mm 5875
14_LEY_IM12_HSC2_SB_23782_SI.indd 43214_LEY_IM12_HSC2_SB_23782_SI.indd 432 8/08/13 10:48 AM8/08/13 10:48 AM
UNCORRECTED PAGE PROOFS

FOC
US
STU
DY
433Chapter 14 Mathematics and resources
9 A rectangular backyard swimming pool is 10.3 m by 3.9 m and has an average depth of 1.4 m.
a How much water does it hold?
b What is the cost of fi lling the pool if the water usage charge is $1.98/kL?
The table below shows water usage data for the states and territories of Australia in 2010/11.
NSW VIC QLD SA WA TAS NT ACT AUS
Total water consumption (GL) 5041 2359 2964 1023 1369 371 167 43 13 337
Average price of water for
households ($/kL)
2.53 2.34 2.95 3.09 1.75 1.75 1.51 2.52 2.31
Household consumption (GL) 527 311 311 115 310 69 31 25 1699
Household use per capita (kL) 72 55 68 70 132 135 136 69 92
Re-use water consumed (GL) 161 78 56 25 18 7 1 4 351
a For which state or territory is the total water consumption:
i highest? ii lowest?
b What percentage of the total Australian consumption was the NSW consumption?
c Which state or territory paid more than the Australian average price for water?
d For which state or territory was the price of water:
i highest? ii lowest?
e What percentage was Victoria’s household consumption of its total water consumption?
f i Which state or territory was the highest consumer of re-use water?
ii What percentage was this state’s consumption of the total Australian consumption, for re-use water?
g For which state or territory was the household use per capita:
i highest? ii lowest?
h Calculate the total revenue from the sale of water for household consumption in Queensland.
i For which state or territory was household use per capita above the Australian average?
a Refer to the table, which shows water consumption by industry sector in Australia (GL) over diff erent
periods. For which industry sector was the water consumption:
i highest? ii lowest?
Industry sector 2000–01 2004–05 2008–09
Agriculture 14 989 12 191 6 996
Electricity and gas 255 271 328
Manufacturing 549 589 677
Forestry and fi shing 40 47 101
Household 2 278 2 108 1 768
Mining 321 413 508
Water supply 2 165 2 083 2 396
Other industries 1 106 1 063 1 327
Total 21 703 18 767 14 101
b In which sectors was there a decrease in consumption from 2000–01 to 2008–09?
c What was the percentage increase in consumption for the sector ‘Electricity and gas’ from:
i 2000–01 to 2004–05? ii 2004–05 to 2008–09?
d What percentage of Australia’s total water consumption in 2008–09 was in
i agriculture? ii mining? iii manufacturing? iv household?
10
11
14_LEY_IM12_HSC2_SB_23782_SI.indd 43314_LEY_IM12_HSC2_SB_23782_SI.indd 433 8/08/13 10:48 AM8/08/13 10:48 AM
UNCORRECTED PAGE PROOFS

FOC
US
STU
DY
Insight Mathematics General 12 HSC Course 2434
Using the data for water prices in the table,
calculate the percentage increase in the price
from 2009/10 to 2010/11 for:
a household usage
b agricultural usage
c total usage.
The graph shows the total water use per
person per year across 10 OECD countries.
(Total water use includes use for households,
agriculture, industry, etc.)
a What is the OECD average?
b For which country was the average
i highest? ii lowest?
c Which countries had water use above the
OECD average?
INVESTIGATION 14.2
The table below is a global comparison of water resources and use in 2000/01.
RegionAvailable water
per area(ML/ha)
Population density
(People/km2)
Available water per capita
(ML/person/year)
Water consumed
(1000 GL/year)
Australia 0.5 2.5 21.3 25
North America 2.8 20.7 13.4 603
Central America 11.2 115.7 9.6 23
Southern America 6.9 21.5 32.2 165
Western and Central Europe 4.3 107.1 4.0 265
Eastern Europe 2.5 11.5 21.4 110
Africa 1.3 32.7 4.0 215
Middle East 0.8 47.1 1.6 271
Central Asia 0.6 18.5 3.0 163
Southern and Eastern Asia 5.5 174.4 3.2 1991
Oceania and Pacifi c 1.1 3.3 33.0 26
World 3.2 50.4 6.4 3837
a i Which region of the world has the most available water per area?
ii Does this region consume the most water per year?
b i Which region of the world has the least available water per area?
ii Does this region consume the least water per year?
12 2009/10 2010/11
Household price ($/kL) 2.10 2.44
Agricultural price ($/kL) 0.11 0.14
Total price ($/kL) 0.82 1.03
13Australia
Denmark
France
Italy
Japan
New Zealand
Spain
Sweden
UK
USA
OECD average
Total water use per person in selected OECD countries
Total water used (kL)0 500 1000 1500250 750 1250 1750
14
14_LEY_IM12_HSC2_SB_23782_SI.indd 43414_LEY_IM12_HSC2_SB_23782_SI.indd 434 8/08/13 10:48 AM8/08/13 10:48 AM
UNCORRECTED PAGE PROOFS

FOC
US
STU
DY
435Chapter 14 Mathematics and resources
c Consider the data for ‘Available water per capita’.
i Draw a box-and-whisker plot for this data. ii What is the range of the data?
iii What is the interquartile range? iv Comment on the spread of the scores.
d Consider the data for ‘Population density’.
i Calculate the mean and standard deviation for this data.
ii Which region(s) have a population density that is more than one standard deviation above the mean?
The graph shows the average annual rainfall for Australia from 1990 to 2011.
a In which years, in this period, did the highest and lowest rainfalls occur?
b i In how many years in the decade 2000–2009 was the average rainfall below the median?
ii Comment on the weather for this decade.
The graph shows the mean and median
monthly rainfall in Tocal from 1965 to 2006.
a For which season of the year was the
rainfall:
i greatest? ii least?
b For each month the mean is greater
than the median. Explain what weather
conditions might have caused this to be so.
The table below shows the rainfall in mm over the summer months for Sydney for the decade 1990–1999.
Summer in 1990 is December 1989 to February 1990.
1990 1991 1992 1993 1994 1995 1996 1997 1998 1999
Dec 161 44 190 202 36 81 102 40 29 55
Jan 84 120 66 61 52 95 150 186 99 178
Feb 631 63 409 100 99 51 55 137 31 143
Total
a Complete the row for the total rainfall for each summer of this decade.
b Draw a column graph for the total rainfall data for part a.
15
Average annual rainfall in Australia, 1990–2011
Year1990 1992 1994 1996 1998 2000
Rai
nfal
l (m
m)
100
200
0
300
400
600
700
500
800
2002 2004 2006 2008 2010
Average rainfallMedian rainfall
16 Average and median monthly rainfall in Tocal, 1965–2006
MonthJ F M A M J J A S O N D
Rai
nfal
l (m
m)
20
40
0
60
80
120 Average rainfallMedian rainfall100
17
14_LEY_IM12_HSC2_SB_23782_SI.indd 43514_LEY_IM12_HSC2_SB_23782_SI.indd 435 8/08/13 10:48 AM8/08/13 10:48 AM
UNCORRECTED PAGE PROOFS

FOC
US
STU
DY
Insight Mathematics General 12 HSC Course 2436
c Calculate the mean and standard deviation of the total rainfall for each summer.
d Draw a box-and-whisker plot for the summer totals.
The table below shows the rainfall in mm over the summer months for Sydney for the decade 2000–2009.
2000 2001 2002 2003 2004 2005 2006 2007 2008 2009
Dec 82 46 40 75 60 76 25 74 123 54
Jan 56 186 98 14 51 68 121 45 57 25
Feb 19 109 348 59 129 125 51 108 258 128
Total
e Complete the row for the total rainfall for each summer of this decade.
f Draw a column graph for the data of part e.
g Calculate the mean and standard deviation of the total rainfall for each summer.
h Draw a box-and-whisker plot for the summer totals.
i Using the information above, compare the summer rainfall for these two decades in Sydney. Write a short
report and discuss your fi ndings with the class.
The tables below show the summer rainfall in mm in Melbourne and Brisbane for the decade 2000–2009.
a Summer in Melbourne (2000–2009)
2000 2001 2002 2003 2004 2005 2006 2007 2008 2009
Dec 94 35 49 12 71 59 82 18 71 77
Jan 38 12 38 11 63 24 54 33 33 1
Feb 33 12 68 20 13 167 72 13 25 3
Total
b Summer in Brisbane (2000–2009)
2000 2001 2002 2003 2004 2005 2006 2007 2008 2009
Dec 190 52 78 143 147 233 70 59 106 88
Jan 74 25 57 6 263 108 173 66 216 84
Feb 67 256 37 274 137 29 63 98 188 156
Total
i Complete the row for total rainfall in each city.
ii Draw a column graph for the data of part i. iii Calculate the mean and standard deviation of the total summer rainfall for each city.
iv Draw a box-and-whisker plot for the summer totals for each city.
c Compare the summer rainfall in each of these cities with the summer rainfall in Sydney for the decade
2000–2009.
The table shows the mean monthly rainfall in mm for Cairns and Alice Springs.
Month Jan Feb Mar Apr May Jun Jul Aug Sep Oct Nov Dec
Cairns 419 422 460 264 111 73 39 42 44 50 98 203
Alice Springs 43 41 33 16 16 15 14 10 9 20 25 36
a Draw a box-and-whisker plot for each city.
b Compare the weather in these two cities. Write a short report and discuss it with the class.
18
19
14_LEY_IM12_HSC2_SB_23782_SI.indd 43614_LEY_IM12_HSC2_SB_23782_SI.indd 436 8/08/13 10:48 AM8/08/13 10:48 AM
UNCORRECTED PAGE PROOFS

437
a This table gives the mean number of days of rain for each month for all years of record for Sydney.
Month Jan Feb Mar Apr May Jun Jul Aug Sep Oct Nov Dec
Number rainy days 12.2 12.5 13.6 12.8 13.1 12.5 11.2 10.4 10.6 11.7 11.7 11.5
i What is the mean number of days of rain for August?
ii Using this data, fi nd the probability that it will rain on any particular day in August.
ii What is the probability that it will rain on two consecutive days?
b This table gives the mean number of days of rain for each month for the years 1981–2010 for Sydney.
Month Jan Feb Mar Apr May Jun Jul Aug Sep Oct Nov Dec
Number rainy days 12.3 12.9 13.3 11.1 12.2 10.5 10.2 8.4 8.8 11.1 12.7 11.2
i Use this data to fi nd the mean number of days of rain for August.
ii What is the probability that it will rain on any particular day in August?
iii What is the probability that it will rain on two consecutive days?
c Which set of data do you think would be the most accurate in predicting the probability that it will rain on
any particular day in August next year? Discuss this with your class.
Go to the Bureau of Meteorology’s website www.bom.gov.au/nsw and fi nd the past weather data for your town.
Use this data to calculate the probability that it will rain on your birthday next year.
The graph shows the average rainfall for each month in London, UK, and the average number of days of rain for each month. a Does London have more rain in summer or winter?b Which month is the: i wettest? ii driest?c Find the mean and standard deviation of the: i average monthly rainfall ii average number of rainy days per month.d Comment on the pattern of rainfall in London.e Find the probability that it will rain next year on: i 5 August ii 5 January.
20
21
22 Average monthly rainfall and rainfall days in London
MonthJ F M A M J J A S O N D
Rai
nfal
l (m
m)
20
40
0
60
80Average rainfallAverage rainfall days
10
30
50
70
Num
ber of rainy days10
20
0
30
40
5
15
25
35
14_LEY_IM12_HSC2_SB_23782_SI.indd 43714_LEY_IM12_HSC2_SB_23782_SI.indd 437 8/08/13 10:48 AM8/08/13 10:48 AM
UNCORRECTED PAGE PROOFS

FOC
US
STU
DY
Insight Mathematics General 12 HSC Course 2438
The table shows the average rainfall and the average number of rainy days for each month in Tokyo, Japan.
Month Jan Feb Mar Apr May Jun Jul Aug Sep Oct Nov Dec
Average rainfall (mm) 62 61 125 139 151 169 183 186 215 235 108 45
Average rainy days 11 10 16 17 18 19 18 16 18 17 12 9
a Draw a column graph for average rainfall each month.b On the column graph draw a line graph for the number of rainy days.c Does Tokyo have more rain in summer or winter?d Which month is the: i wettest? ii driest?e Calculate the mean and standard deviation of the: i average monthly rainfall ii average number of rainy days each month.f Comment on the pattern of rainfall in Tokyo.g Compare the rainfall in London with that in Tokyo.h Find the probability that it will rain in Tokyo next year on: i 5 August ii 5 January.
INVESTIGATION 14.3
14B Volume and collection of waterVolume and collection of water
WORKED EXAMPLE 1The surface area of a lake is 460 000 m2. If an average of 6 mm of rain falls on the lake, what will be the
increase in the volume of water in the lake? Ignore any run-off from the surrounding area.
Solve Think Apply
V = 460 000 × 0.006
= 2760 m3
= 2 760 000 L or 2.76 ML
6 mm = 0.006 m
1 m3 holds 1000 L.
1 ML = 1 000 000 L
Use V = A × h.
EXERCISE 14B1 The surface area of a lake is 785 000 m2. If an average of 4 mm of rain falls on the lake, what will be the
increase in the volume of water in the lake? Ignore any runoff from the surrounding area.
2 The rainfall over a rectangular paddock that measures 280 m by 196 m is 8 mm.
a If all the rain fl ows into a dam on the property, what will be the increase in the volume of water in the dam?
b If 20% of the rain soaks into the ground before fl owing into the dam, what will be the increase in the volume
of the dam?
3 Lake Burragorang is formed by Warragamba dam, which supplies most of Sydney’s population with water.
a The area of Lake Burragorang is 75 km2. If an average of 3 mm of rain falls over the lake, what will be the
increase in the volume of water in the lake?
b The total catchment area for Lake Burragorang is 9051 km2. If an average of 1 mm of rain falls over the
catchment and 85% of this runs into the lake, what will be the increase in the volume of water in the dam?
23
14_LEY_IM12_HSC2_SB_23782_SI.indd 43814_LEY_IM12_HSC2_SB_23782_SI.indd 438 8/08/13 10:48 AM8/08/13 10:48 AM
UNCORRECTED PAGE PROOFS

FOC
US
STU
DY
439Chapter 14 Mathematics and resources
WORKED EXAMPLE 2a Calculate the plan-view area of the roof of the house shown.
b How much water could be collected from this roof if 6 mm of
rain fell on it, allowing 10% for wastage?
Solve Think Apply
a Area of roof = 5 × 9 + 4 × 3
= 57 m2
Divide the plan-view area into
rectangles.
Find the plan-view area of the roof
by dividing the shape of the roof
into rectangles.
b Volume of water collected= 0.9 × 57 × 0.006 m3
= 0.3078 m3
= 307.8 L= 308 L (to nearest L)
If all the rain is collected then V = 57 × 0.006 m3. However it is usual to allow 10% for wastage. So V = 90% of 57 × 0.006 (90% is known as the water runoff coeffi cient).
Volume of rain collected V (m3) = C × A × R where C = the water runoff coeffi cient, as a decimalA = roof area (m2) R = amount of rainfall (m)
Note: The plan-view area of the roof includes the width of the eaves and so, in general, is not the same as the fl oor
area. The plan-view area is sometimes referred to as the ‘footprint’ of the ‘drip line’ of the house.
4 a i Calculate the plan-view area of the roof of the house shown.
ii How much water could be collected from this roof if 4 mm
of rain fell on it, allowing 10% for wastage?
b i Calculate the plan-view area of the roof of the house shown.
ii This house is situated in Newcastle. The average rainfall
for Newcastle in January is 91.4 mm. How much water
could be expected to be collected from this roof in January
next year, allowing 10% for wastage?
c i Calculate the plan-view area of the roof of the house shown.
ii This house is situated in Wollongong. The average rainfall
for Wollongong in spring is 206.7 mm. How much water
could be expected to be collected from this roof in spring
next year, allowing 15% for wastage?
8 m
5 m
9 m
4 m
8 m
4 m
3 m
4 m
6600 mm
3600 mm 3600 mm
2800 mm
4800 mm
6400 mm
4900 mm
5600 mm
4800 mm
14_LEY_IM12_HSC2_SB_23782_SI.indd 43914_LEY_IM12_HSC2_SB_23782_SI.indd 439 8/08/13 10:48 AM8/08/13 10:48 AM
UNCORRECTED PAGE PROOFS

FOC
US
STU
DY
Insight Mathematics General 12 HSC Course 2440
d i Calculate the plan-view area of the roof
of the house shown.
ii This house is situated in Canberra. The
average annual rainfall for Canberra is
633.1 mm. How much water could be
expected to be collected from this roof
next year, allowing 15% for wastage?
e i Calculate the plan-view area of the roof of the house shown.
ii This house is situated in Bourke. The average annual
rainfall for Bourke is 354.7 mm. How much water could
be expected to be collected from this roof next year?
iii Because of pollution it is necessary to discard the fi rst 40 L each time there is a rain event (that is it
rains). Water tanks often have a fl ushing device fi tted to discard the fi rst water collected. The mean annual
number of rainy days in Bourke is 47. Treating each rainy day as a separate rain event, how much water
will be discarded each year.
v Calculate the amount of water that, on average, could actually be collected each year.
vi The cost of town water in Bourke is $1.86/kL. If all the water collected in the tank is used for household
consumption, how much could this household save each year?
5 Calculate the capacity of the following water tanks to the nearest kL.
a b
c
d
5600 mm
3900 mm
7500 mm 7500 mm
7500 mm
12 000 mm
7200 mm
1700 mm1700 mm
2422 mm
1050 mm
3000 mm
1900 mm
1750 mm
2700 mm
1430 mm
850 mm
1800 mm
14_LEY_IM12_HSC2_SB_23782_SI.indd 44014_LEY_IM12_HSC2_SB_23782_SI.indd 440 8/08/13 10:48 AM8/08/13 10:48 AM
UNCORRECTED PAGE PROOFS

FOC
US
STU
DY
441Chapter 14 Mathematics and resources
WORKED EXAMPLE 3If 308 L of rain is collected in the tank shown, what will be the
rise in the height of the water?
Solve Think Apply
Cross-sectional area of tank
= π × 0.452 m2
= 0.636 m2
Volume of water collected
= 0.308 m3
0.308 = 0.636 × h
h = 0.308
_____ 0.636
= 0.484 27… m
= 484 mm (to nearest mm)
The water will rise by 484 mm.
Cross-sectional area of tank
= π × r2, r = 450 mm = 0.45 m
Volume of water collected
= 308
_____ 1000
m3 (1 m3 = 1000 L)
Calculate the horizontal
cross-sectional area of the tank.
Convert the volume of water to
cubic metres.
Use volume of water
= cross-sectional area × height
6 a If 295 L of rain is collected in the tank shown, what will be
the rise in the height of the water?
b If 370 L of rain is collected in the tank shown, what will be
the rise in the height of the water?
c If 300 L of rain is collected in the tank shown, what will be
the rise in the height of the water?
900 mm
1200 mm
1500 mm
900 mm
1200 mm
14_LEY_IM12_HSC2_SB_23782_SI.indd 44114_LEY_IM12_HSC2_SB_23782_SI.indd 441 8/08/13 10:48 AM8/08/13 10:48 AM
UNCORRECTED PAGE PROOFS

FOC
US
STU
DY
Insight Mathematics General 12 HSC Course 2442
7 a Calculate the plan-view area of the roof of the house
shown. (All measurements are in mm.)
b How much water could be collected from this roof if
4 mm of rain fell on it, allowing 10% for wastage?
c If the water from the roof is collected in the water tank shown,
what will be the rise in the height of water in the tank?
14C ScaleScale
EXERCISE 14C1 Calculate the scale used in these diagrams.
a The straight track on the athletics fi eld is 100 m. b The swimming pool is 50 m long.
3600
13 600
4800
4800
6800
3400
3400
900 mm
14_LEY_IM12_HSC2_SB_23782_SI.indd 44214_LEY_IM12_HSC2_SB_23782_SI.indd 442 8/08/13 10:48 AM8/08/13 10:48 AM
UNCORRECTED PAGE PROOFS
FOC
US
STU
DY
443Chapter 14 Mathematics and resources
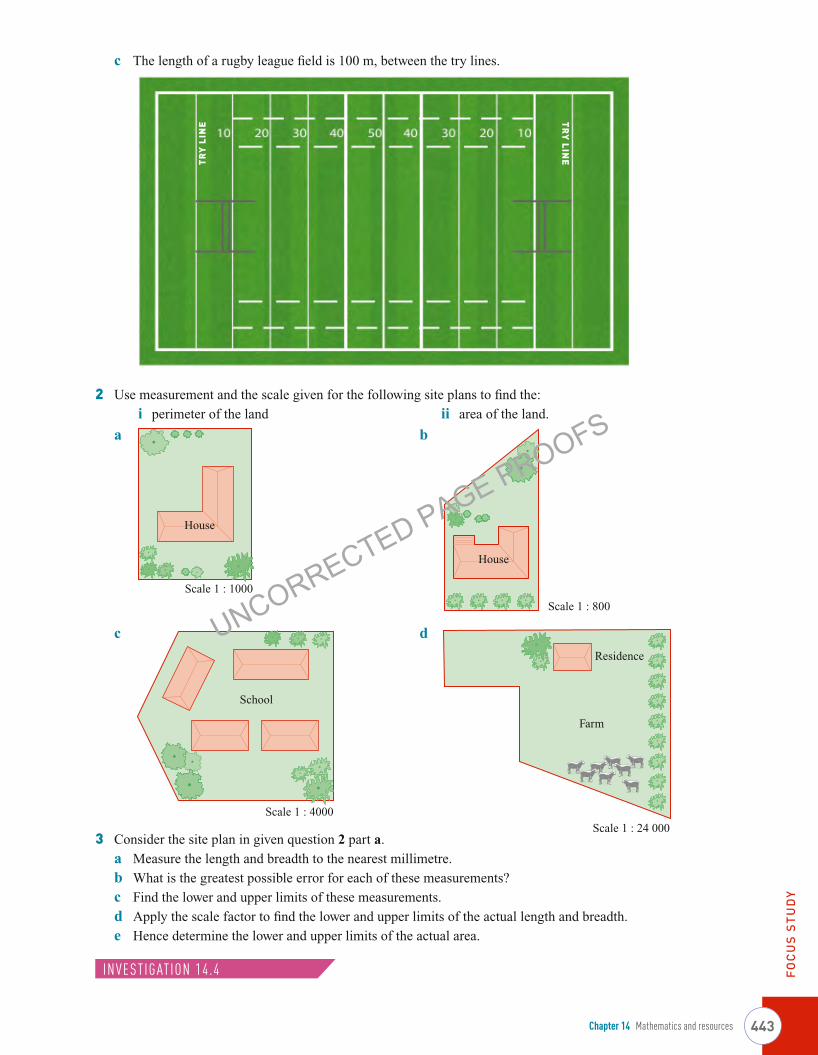
2 Use measurement and the scale given for the following site plans to fi nd the:
i perimeter of the land ii area of the land.
a b
c d
3 Consider the site plan in given question 2 part a.
a Measure the length and breadth to the nearest millimetre.
b What is the greatest possible error for each of these measurements?
c Find the lower and upper limits of these measurements.
d Apply the scale factor to fi nd the lower and upper limits of the actual length and breadth.
e Hence determine the lower and upper limits of the actual area.
INVESTIGATION 14.4
Scale 1 : 800
House
Scale 1 : 1000
House
Scale 1 : 24 000
Residence
Farm
Scale 1 : 4000
School
c The length of a rugby league fi eld is 100 m, between the try lines.
TRY LINETR
Y LI
NE
14_LEY_IM12_HSC2_SB_23782_SI.indd 44314_LEY_IM12_HSC2_SB_23782_SI.indd 443 8/08/13 10:48 AM8/08/13 10:48 AM
UNCORRECTED PAGE PROOFS
FOC
US
STU
DY
Insight Mathematics General 12 HSC Course 2444
14D Estimating area using grid squaresEstimating area using grid squares
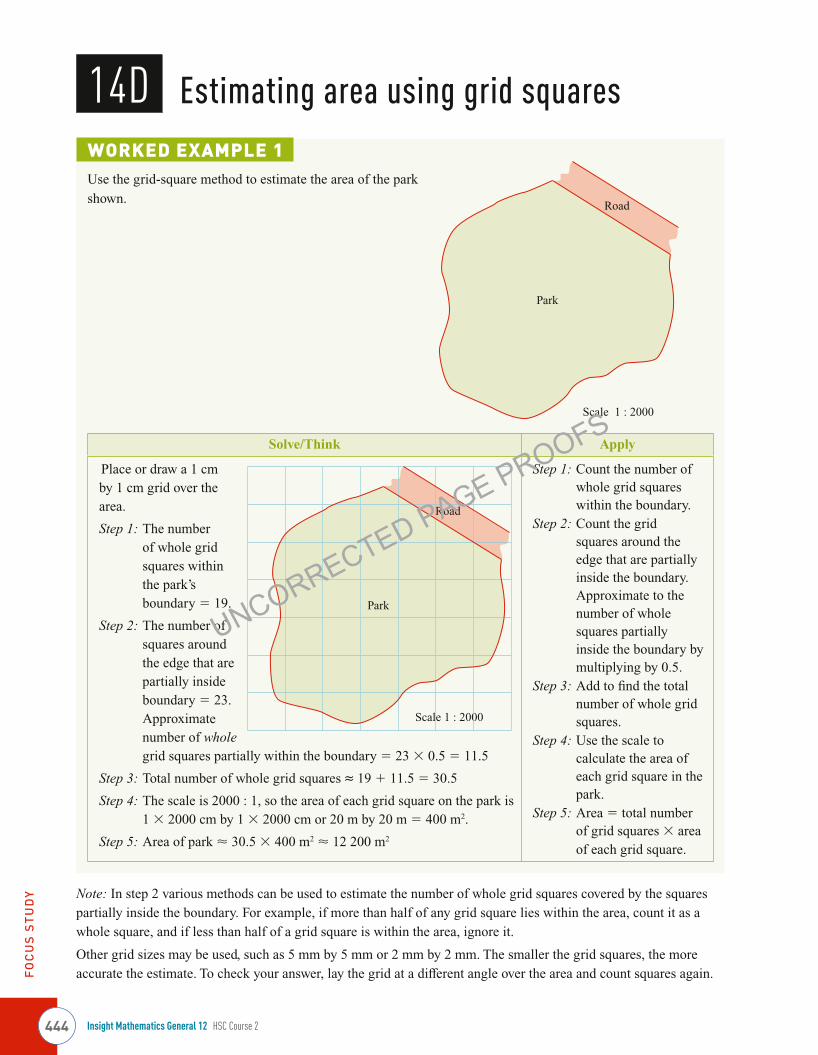
WORKED EXAMPLE 1Use the grid-square method to estimate the area of the park
shown.
Solve/Think Apply
Place or draw a 1 cm by 1 cm grid over the area.
Step 1: The number of whole grid squares within the park’s boundary = 19.
Step 2: The number of squares around the edge that are partially inside boundary = 23.
Approximate number of whole grid squares partially within the boundary = 23 × 0.5 = 11.5
Step 3: Total number of whole grid squares ≈ 19 + 11.5 = 30.5
Step 4: The scale is 2000 : 1, so the area of each grid square on the park is 1 × 2000 cm by 1 × 2000 cm or 20 m by 20 m = 400 m2.
Step 5: Area of park ≈ 30.5 × 400 m2 ≈ 12 200 m2
Step 1: Count the number of whole grid squares within the boundary.
Step 2: Count the grid squares around the edge that are partially inside the boundary. Approximate to the number of whole squares partially inside the boundary by multiplying by 0.5.
Step 3: Add to fi nd the total number of whole grid squares.
Step 4: Use the scale to calculate the area of each grid square in the park.
Step 5: Area = total number of grid squares × area of each grid square.
Note: In step 2 various methods can be used to estimate the number of whole grid squares covered by the squares partially inside the boundary. For example, if more than half of any grid square lies within the area, count it as a whole square, and if less than half of a grid square is within the area, ignore it.
Other grid sizes may be used, such as 5 mm by 5 mm or 2 mm by 2 mm. The smaller the grid squares, the more accurate the estimate. To check your answer, lay the grid at a diff erent angle over the area and count squares again.
Scale 1 : 2000
Road
Park
Scale 1 : 2000
Road
Park
14_LEY_IM12_HSC2_SB_23782_SI.indd 44414_LEY_IM12_HSC2_SB_23782_SI.indd 444 8/08/13 10:48 AM8/08/13 10:48 AM
UNCORRECTED PAGE PROOFS

FOC
US
STU
DY
445Chapter 14 Mathematics and resources
EXERCISE 14D1 Use the grid-square method to estimate the following areas.
a b
c d
14E The polygon methodThe polygon methodThe polygon method involves breaking up a polygon into simple plane shapes in order to fi nd its area. This can be
done using the measurements obtained from:
• a radial survey
• an off set (or traverse) survey.
WORKED EXAMPLE 1Find the area of the land in the diagram, using the
measurements obtained from a radial survey.
Scale 1 : 40 000
Farm
Scale 1 : 2000
Park
Scale 1 : 50 000
Reservoir
Scale 1 : 30 000
Golf course
152 m
127 m
102 m
86°
116 m
138 m
75°
E
B
DC
A
52°68°
79°P
14_LEY_IM12_HSC2_SB_23782_SI.indd 44514_LEY_IM12_HSC2_SB_23782_SI.indd 445 8/08/13 10:48 AM8/08/13 10:48 AM
UNCORRECTED PAGE PROOFS

FOC
US
STU
DY
Insight Mathematics General 12 HSC Course 2446
WORKED EXAMPLE 1 CONTINUED
Solve/Think Apply
Area △PAB = 1 _ 2 × 138 × 116 × sin 86° = 7984.5 m2
Area △PBC = 1 _ 2 × 116 × 152 × sin 75° = 8515.6 m2
Area △PCD = 1 _ 2 × 152 × 127 × sin 52° = 7605.9 m2
Area △PDE = 1 _ 2 × 127 × 102 × sin 68° = 6005.4 m2
Area △PEA = 1 _ 2 × 102 × 138 × sin 79° = 6908.7 m2
Total area = 37 020 m2
Find the area of each triangle using
A = 1 _ 2 ab sin C and sum these to
fi nd the total area.
EXERCISE 14E1 Find the area of the land in each diagram, using the measurements obtained from a radial survey.
a b
WORKED EXAMPLE 2Find the area of the land in the diagram, using the measurements
obtained from a traverse survey. (Lengths shown are in metres.)
Solve Think Apply
Area △ABX = 1 _ 2 × 15 × 74 = 555 m2
Area XBCZ = 1 _ 2 × (74 + 98) × 71 = 6106 m2
Area △ZCD = 1 _ 2 × 24 × 98 = 1176 m2
Area △ADE = 1 _ 2 × 110 × 81 = 4455 m2
Total area = 12 292 m2
Area of a triangle = 1 _ 2 bh
Area of a trapezium = 1 _ 2 (a + b)hIn trapezium XBCZ, XZ = 55 + 16 = 71 m.In △ADE,
AD = 15 + 55 + 16 + 24 = 110 m.
Find the area of
each plane shape
and sum these to
fi nd the total area.
148 m133 m
128 m
137 m
143 m
85°
76°52°
59°
P88°
106 m
95 m
71 m
93 m
84 m
P
96°48°
73°65°
78°
D
A
C
B
E
Z
Y
X
55
81
16 98
74
15
24
14_LEY_IM12_HSC2_SB_23782_SI.indd 44614_LEY_IM12_HSC2_SB_23782_SI.indd 446 8/08/13 10:48 AM8/08/13 10:48 AM
UNCORRECTED PAGE PROOFS

FOC
US
STU
DY
447Chapter 14 Mathematics and resources
2 Find the area of the land in these diagrams, using the measurements obtained from a traverse survey. (Lengths
shown are in metres.)
a b
WORKED EXAMPLE 3Find the area of the land shown in the scaled diagram, using
a radial survey.
Solve/Think Apply
Step 1: Choose a point, P,
inside the shape and
label the vertices of
the polygon.
Step 2: Draw and measure
the radial arms on
the diagram.
PA = 40 mm
PB = 38 mm
PC = 25 mm
PD = 35 mm
Use the scale to convert
these to the actual lengths.
PA = 40 × 10 000 mm = 400 000 mm or 400 m
PB = 38 × 10 000 mm = 380 000 mm or 380 m
PC = 25 × 10 000 mm = 250 000 mm or 250 m
PD = 35 × 10 000 mm = 350 000 mm or 350 m
Step 3: Measure the angles between the radial arms.
∠APB = 55°, ∠BPC = 70°
∠CPD = 125°, ∠DPA = 110°
Choose a point, P,
inside the shape.
Draw and measure
the radial arms on the
diagram. Use the scale
to convert these to the
actual lengths. Measure
the angles between the
radial arms.
22 m
32 m
41 m
25 m
33 m
27 m
39 m
19 m
57 m
36 m
78 m
42 m
55 m
28 m
15 m
62 m
Scale 1 : 10 000
C
B
A
D
P
Scale 1 : 10 000
14_LEY_IM12_HSC2_SB_23782_SI.indd 44714_LEY_IM12_HSC2_SB_23782_SI.indd 447 8/08/13 10:48 AM8/08/13 10:48 AM
UNCORRECTED PAGE PROOFS

FOC
US
STU
DY
Insight Mathematics General 12 HSC Course 2448
WORKED EXAMPLE 3 CONTINUED
Solve/Think Apply
Step 4: Calculate the area of each triangle and sum them to fi nd the total area.
Area △APB = 1 _ 2 × 400 × 380 × sin 55° = 62 255.6 m2
Area △BPC = 1 _ 2 × 380 × 250 × sin 70° = 44 635.4 m2
Area △CPD = 1 _ 2 × 250 × 350 × sin 125° = 35 837.9 m2
Area △DPA = 1 _ 2 × 350 × 400 × sin 110° = 65 778.5 m2
Total area = 208 507 m2
Calculate the area of each
triangle using
A = 1 _ 2 ab sin C and sum
them to fi nd the total area.
3 Find the area of the land shown in the scaled diagram
using a radial survey.
WORKED EXAMPLE 4Find the area of the land shown in the scaled diagram, using
an off set survey.
Solve/Think Apply
Step 1: Label the vertices of the
polygon and choose a
suitable diagonal.
Step 2: Draw and measure
the lengths of the
perpendicular off sets
from each vertex to the
diagonal.
PX = 22 mm
SY = 25 mm
RZ = 18 mm
Label the vertices of
the polygon and choose
a suitable diagonal.
Draw and measure
the lengths of the
perpendicular off sets
from each vertex to the
diagonal.
Scale 1 : 10 000
Scale 1 : 5000
T
R
Q
P
S
ZYX
Scale 1 : 5000
14_LEY_IM12_HSC2_SB_23782_SI.indd 44814_LEY_IM12_HSC2_SB_23782_SI.indd 448 8/08/13 10:48 AM8/08/13 10:48 AM
UNCORRECTED PAGE PROOFS

FOC
US
STU
DY
449Chapter 14 Mathematics and resources
WORKED EXAMPLE 4 CONTINUED
Solve/Think Apply
Step 3: Start at T, say, and measure the distances between the bases of each off set.
TX = 17 mm, XY = 8 mm, YZ = 20 mm, ZQ = 15 mm
Step 4: Use the scale to convert all measurements to actual lengths.
PX = 22 × 5000 = 110 000 mm = 110 m
SY = 25 × 5000 = 125 000 mm = 125 m
RZ = 18 × 5000 = 90 000 mm =90 m
TX = 17 × 5000 =85 000 mm = 85 m
XY = 8 × 5000 = 40 000 mm = 40 m
YZ = 20 × 5000 = 100 000 mm = 100 m
ZQ = 15 × 5000 = 75 000 mm = 75 m
Hence TQ = 300 m
Step 5: Calculate the areas of the triangles and trapezium and sum them to
fi nd the total area.
Area triangle TPQ = 1 _ 2 × 300 × 110 = 16 500 m2
Area triangle TYS = 1 _ 2 × 125 × 125 = 7812.5 m2
Area trapezium SYZR = 1 _ 2 × (125 + 90) × 100 = 10 750 m2
Area triangle RZQ = 1 _ 2 × 75 × 90 = 3375 m2
Total area = 38 437.5 m2
Start at one end
of the diagonal
and measure the
distances between
the bases of each
off set.
Use the scale
to convert all
measurements to
actual lengths.
Calculate the areas
of the triangles and
trapezium and sum
them to fi nd the total
area.
4 Find the area of the land shown in the scaled diagram,
using an off set survey.
5 Complete the following steps to estimate the area of this
irregular shape using a radial survey and a traverse survey.
Scale 1 : 5000
Scale 1 : 10 000
14_LEY_IM12_HSC2_SB_23782_SI.indd 44914_LEY_IM12_HSC2_SB_23782_SI.indd 449 8/08/13 10:48 AM8/08/13 10:48 AM
UNCORRECTED PAGE PROOFS

FOC
US
STU
DY
Insight Mathematics General 12 HSC Course 2450
Mark and label fi ve points on the boundary. Join these points
to form a polygon.
i Choose a point P inside the polygon and use a radial
survey to fi nd its area.
ii Draw a suitable diagonal and use a traverse survey to fi nd
the area of the polygon.
Note: Choose fi ve or six suitable points on the boundary
of the shape and determine the area of the polygon formed
by joining these points using a radial survey or a traverse
survey. The area of the polygon is then an approximation for
the area of the irregular shape. The more vertices you choose
the better the approximation.
6 Find estimates for the areas in Exercise 14D using a radial survey and a traverse survey. Compare methods and
discuss your answers.
14F Simpson’s rule for areaSimpson’s rule for areaAnother method of fi nding the area of shapes with curved boundaries is Simpson’s rule, which was discussed in
Chapter 2. This rule gives an estimate of the area.
Simpson’s rule for area is:
A ≈ h __
3 (df + 4dm + dl)
where h = the equal distance between off sets
df = the fi rst off set
dm = the middle off set
dl = the last off set
WORKED EXAMPLE 1Use Simpson’s rule to approximate the areas shown below.
a Use one application. b Use two applications.
Scale 1 : 10 000
48 m 48 m
36 m 42 m 40 m
26 m 26 m
59 m 75 m 86 m 83 m
26 m 26 m
dfdm
dl
h h
14_LEY_IM12_HSC2_SB_23782_SI.indd 45014_LEY_IM12_HSC2_SB_23782_SI.indd 450 12/08/13 8:15 AM12/08/13 8:15 AM
UNCORRECTED PAGE PROOFS

FOC
US
STU
DY
451Chapter 14 Mathematics and resources
WORKED EXAMPLE 1 CONTINUED
Solve Think Apply
a A ≈ 48
___ 3 (36 + 4 × 42 + 40)
= 3904 m2
h = 48 m, df = 36 m,
dm = 42 m, dl = 40 m
Substitute the
appropriate values
into Simpson’s rule.
b A ≈ 26
___ 3 (0 + 4 × 59 + 75)
+ 26
___ 3 (75 + 4 × 86 + 83)
= 7046 m2
h = 26 m
For the fi rst strip, df = 0 m,
dm = 59 m, dl = 75 m
For the second strip, df = 75 m,
dm = 86 m, dl = 83 m
EXERCISE 14F1 Use Simpson’s rule to approximate the areas shown below.
a Use one application. b Use two applications.
c Use one application. d Use two applications.
WORKED EXAMPLE 2Use two applications of Simpson’s rule to approximate the
area shown.
20 m 20 m
36 m 65 m 61 m 54 m
20 m 20 m60 m 60 m
58 m 65 m 81 m
25 m 25 m
42 m
76 m
59 m
25 m 25 m40 m 40 m
66 m
Scale 1 : 5000
14_LEY_IM12_HSC2_SB_23782_SI.indd 45114_LEY_IM12_HSC2_SB_23782_SI.indd 451 8/08/13 10:48 AM8/08/13 10:48 AM
UNCORRECTED PAGE PROOFS
FOC
US
STU
DY
Insight Mathematics General 12 HSC Course 2452
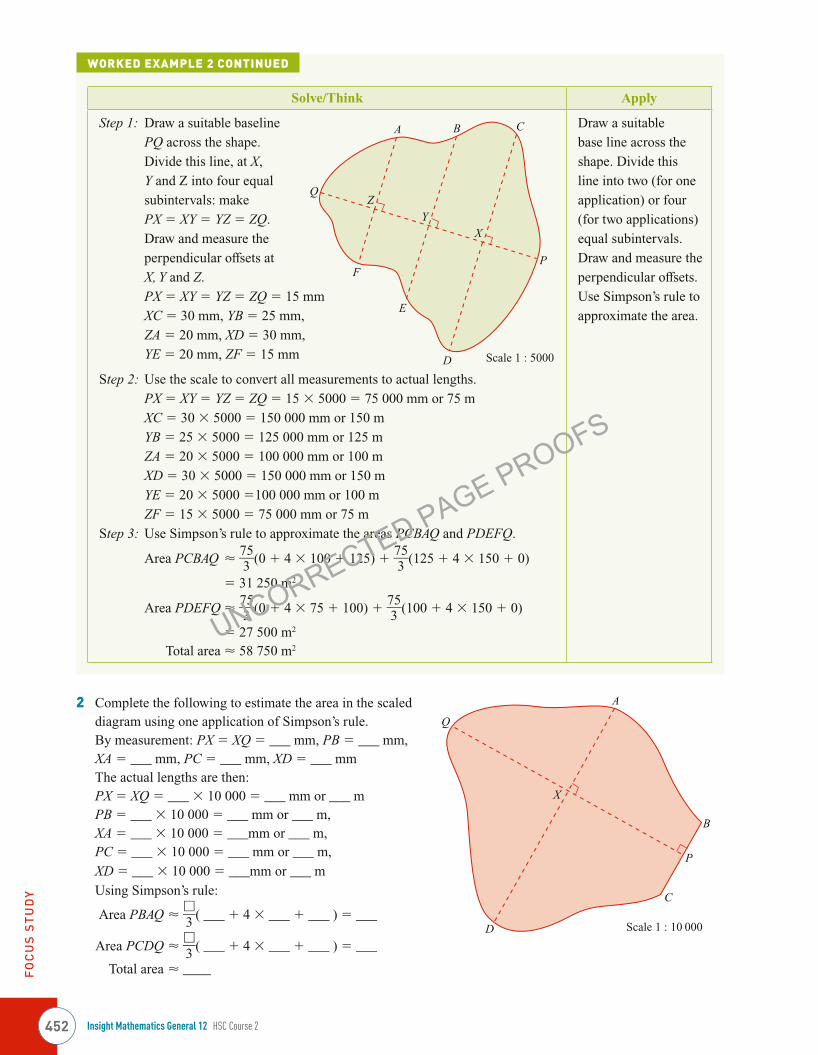
WORKED EXAMPLE 2 CONTINUED
Solve/Think Apply
Step 1: Draw a suitable baseline
PQ across the shape.
Divide this line, at X,
Y and Z into four equal
subintervals: make
PX = XY = YZ = ZQ.
Draw and measure the
perpendicular off sets at
X, Y and Z.
PX = XY = YZ = ZQ = 15 mm
XC = 30 mm, YB = 25 mm,
ZA = 20 mm, XD = 30 mm,
YE = 20 mm, ZF = 15 mm
Step 2: Use the scale to convert all measurements to actual lengths.
PX = XY = YZ = ZQ = 15 × 5000 = 75 000 mm or 75 m
XC = 30 × 5000 = 150 000 mm or 150 m
YB = 25 × 5000 = 125 000 mm or 125 m
ZA = 20 × 5000 = 100 000 mm or 100 m
XD = 30 × 5000 = 150 000 mm or 150 m
YE = 20 × 5000 =100 000 mm or 100 m
ZF = 15 × 5000 = 75 000 mm or 75 m
Step 3: Use Simpson’s rule to approximate the areas PCBAQ and PDEFQ.
Area PCBAQ ≈ 75
___ 3 (0 + 4 × 100 + 125) +
75 ___
3 (125 + 4 × 150 + 0)
= 31 250 m2
Area PDEFQ ≈ 75
___ 3 (0 + 4 × 75 + 100) +
75 ___
3 (100 + 4 × 150 + 0)
= 27 500 m2
Total area ≈ 58 750 m2
Draw a suitable
base line across the
shape. Divide this
line into two (for one
application) or four
(for two applications)
equal subintervals.
Draw and measure the
perpendicular off sets.
Use Simpson’s rule to
approximate the area.
2 Complete the following to estimate the area in the scaled diagram using one application of Simpson’s rule. By measurement: PX = XQ = ___ mm, PB = ___ mm,XA = ___ mm, PC = ___ mm, XD = ___ mmThe actual lengths are then: PX = XQ = ___ × 10 000 = ___ mm or ___ mPB = ___ × 10 000 = ___ mm or ___ m, XA = ___ × 10 000 = ___mm or ___ m, PC = ___ × 10 000 = ___ mm or ___ m,
XD = ___ × 10 000 = ___mm or ___ m
Using Simpson’s rule:
Area PBAQ ≈ □ __ 3 ( ___ + 4 × ___ + ___ ) = ___
Area PCDQ ≈ □ __ 3 ( ___ + 4 × ___ + ___ ) = ___
Total area ≈ ____
D
E
CB
FP
X
Q
A
Z
Y
Scale 1 : 5000
D
P
C
B
Q
X
A
Scale 1 : 10 000
14_LEY_IM12_HSC2_SB_23782_SI.indd 45214_LEY_IM12_HSC2_SB_23782_SI.indd 452 8/08/13 10:48 AM8/08/13 10:48 AM
UNCORRECTED PAGE PROOFS

FOC
US
STU
DY
453Chapter 14 Mathematics and resources
3 Use two applications of Simpson’ rule to estimate
the area shown in the scaled diagram.
14G Volume using Simpson’s ruleVolume using Simpson’s ruleSimpson’s rule was used in the Preliminary Mathematics General course to approximate areas. It can also be used
to estimate volumes, given the cross-sectional area at three equal intervals. The formula becomes:
Simpson’s rule for volume is:
V ≈ h __
3 (Af + 4Am + Al) where
h = the equal distance between the cross-sections
Af = area of fi rst cross-section
Am = area of middle cross-section
Al = area of last cross-section
WORKED EXAMPLE 1Find the approximate volume of the reservoir shown
in the diagram.
Solve Think Apply
V ≈ h __
3 (Af + 4 × Am + Al)
= 30
___ 3 (220 + 4 × 350 + 290)
= 19 100 m3
= 19 100 000 L
= 19.1 ML
h = 30, Af = 220, Am = 350, Al = 290
1 m3 = 1000 L, 1 ML = 1 000 000 L
Substitute the appropriate
values into the formula.
Scale 1 : 5000
Park Road
30 m
30 m350 m2
220 m2
290 m2
Am
Af
Al
h
h
14_LEY_IM12_HSC2_SB_23782_SI.indd 45314_LEY_IM12_HSC2_SB_23782_SI.indd 453 12/08/13 8:26 AM12/08/13 8:26 AM
UNCORRECTED PAGE PROOFS

FOC
US
STU
DY
Insight Mathematics General 12 HSC Course 2454
EXERCISE 14G1 Use Simpson’s rule to fi nd the approximate volume of the following.
a b
WORKED EXAMPLE 2Apply Simpson’s rule twice to fi nd the approximate
volume of the dam shown.
Solve Think Apply
V ≈ 15
___ 3 (270 + 4 × 220 + 190)
+ 15
___ 3 (190 + 4 × 170 + 150)
= 11 800 m3
= 11 800 000 L
= 11.8 ML
V = V1 + V2
V1 ≈ 15
___ 3 (270 + 4 × 220 + 190)
V2 ≈ 15
___ 3 (190 + 4 × 170 + 150)
Divide the volume into two equal
sub-volumes and use Simpson’s
rule to approximate each one.
Sum the two sub-volumes.
2 Use two applications of Simpson’s rule to fi nd
each volume.
a
b
30 m
30 m
198 m2
180 m2
156 m250 m
50 m
362 m2
315 m2
287 m2
15 m
15 m
220 m2
190 m2
150 m2
170 m2
270 m2
15 m
15 m
50 m
50 m
235 m2
210 m2
183 m2
194 m2
220 m2
50 m
50 m
20 m
20 m
180 m2
195 m2
120 m2
170 m2
189 m2
20 m
20 m
14_LEY_IM12_HSC2_SB_23782_SI.indd 45414_LEY_IM12_HSC2_SB_23782_SI.indd 454 8/08/13 10:48 AM8/08/13 10:48 AM
UNCORRECTED PAGE PROOFS
FOC
US
STU
DY
455Chapter 14 Mathematics and resources
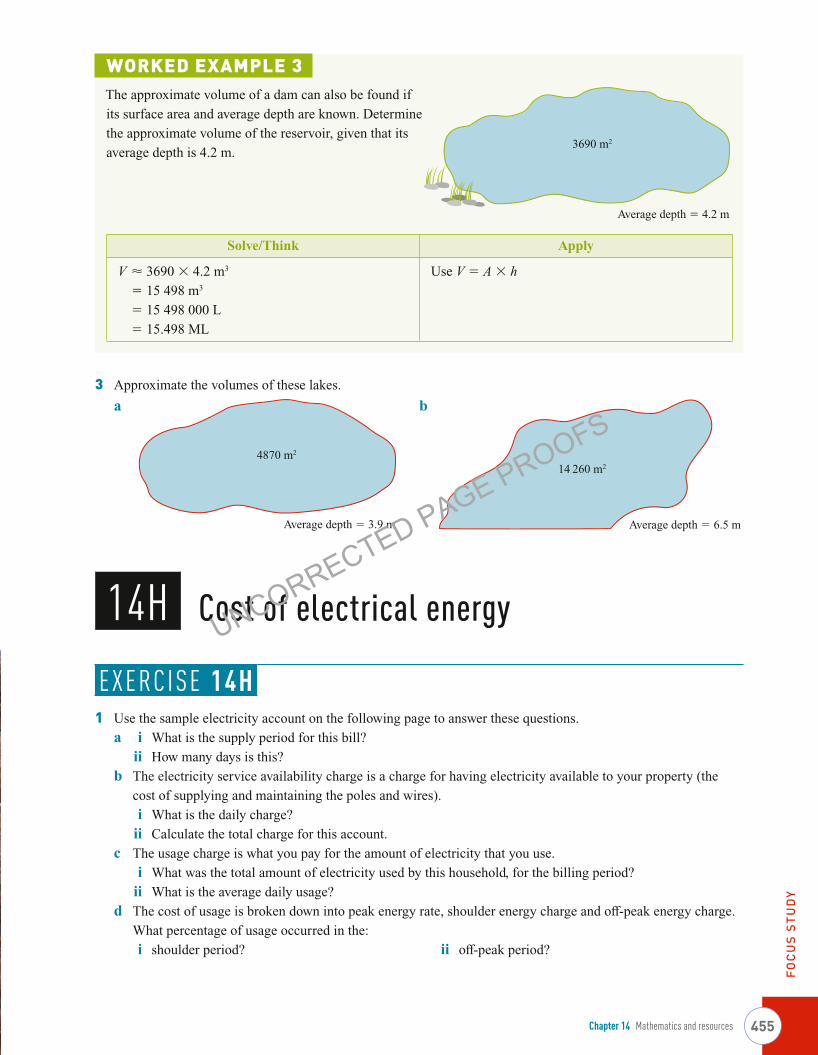
WORKED EXAMPLE 3The approximate volume of a dam can also be found if
its surface area and average depth are known. Determine
the approximate volume of the reservoir, given that its
average depth is 4.2 m.
Solve/Think Apply
V ≈ 3690 × 4.2 m3
= 15 498 m3
= 15 498 000 L
= 15.498 ML
Use V = A × h
3 Approximate the volumes of these lakes.
a b
14H Cost of electrical energyCost of electrical energy
EXERCISE 14H1 Use the sample electricity account on the following page to answer these questions.
a i What is the supply period for this bill?
ii How many days is this?
b The electricity service availability charge is a charge for having electricity available to your property (the
cost of supplying and maintaining the poles and wires).
i What is the daily charge?
ii Calculate the total charge for this account.
c The usage charge is what you pay for the amount of electricity that you use.
i What was the total amount of electricity used by this household, for the billing period?
ii What is the average daily usage?
d The cost of usage is broken down into peak energy rate, shoulder energy charge and off -peak energy charge.
What percentage of usage occurred in the:
i shoulder period? ii off -peak period?
Average depth = 4.2 m
3690 m2
Average depth = 6.5 m
14 260 m2
Average depth = 3.9 m
4870 m2
14_LEY_IM12_HSC2_SB_23782_SI.indd 45514_LEY_IM12_HSC2_SB_23782_SI.indd 455 8/08/13 10:48 AM8/08/13 10:48 AM
UNCORRECTED PAGE PROOFS

FOC
US
STU
DY
Insight Mathematics General 12 HSC Course 2456
FIRST COMBINATION energy
Mr P Smith71 Winter GroveSUMMERTON
Customer Number
Due Date
Amount Payable
0123456
18 March 2013
$621.41
Quarterly Electricity Account
LOCATION: 71 Winter Grove, SUMMERTON
Previous Amount Payable 529.44Payment Received — Thank You –529.44 Cr
Electricity (22/11/2012 to 22.02/2013) 594.65Electricity Discount 5% (22/11/2012 to 22/02/2013) –29.73 Cr
Subtotal of Charges before GST 564.92Total GST Payable 10% 56.49Total Charges including GST 621.41
Total Amount Payable $621.41
AVERAGE DAILY USAGE
Electricity
Last Bill Same PeriodLast Year
This Bill
20 k
Wh
13 k
Wh
20 k
Wh
Consider reducing your environmental impact. Greenhouse gas released to produce your electricity this period = 1973.1 kg of CO
2
Bill Days91 93 95
ELECTRICITY USAGE COMPARISON
Ener
gy C
onsu
mpt
ion
(kW
h)
500045004000350030002500200015001000
5000
Energy Used & Costs
METER ID THIS – LAST = ENERGY x RATE = COST READING READING USED
Peak Energy Rate — Contract (22/11/12 — 22/02/13)EDX009745/001 649.9 0.0 649.9 kWh 47.7700c $310.44Shoulder Energy Charge — Contract (22/11/12 — 22/02/13)EDX009745/002 940.8 0.0 940.8 kWh 19.4000c $182.52Off-Peak (Night Rate) Energy Rate — Contract (22/11/12 — 22/02/13)EDX009745/003 270.7 0.0 270.7 kWh 11.9000c $32.22Electricity Service Availability Charge 93 days 74.7000c/Day $69.47
Total Electricity Before GST 1861.4 kWh $594.65
May11
Aug11
Nov11
Feb12
May12
Aug12
Nov12
Feb13
PeakShoulderOff-Peak
PowerSmart Home Electricity Usage Summary
Supply Period: 22 November 2012 to 22 February 2013 — 93 days
USAGE BREAKDOWNPeak 650 kWh 34.91%Shoulder 941 kWh 50.54%Off-Peak 271 kWh 14.54%
TOTAL ENERGY 1,861 kWh
14_LEY_IM12_HSC2_SB_23782_SI.indd 45614_LEY_IM12_HSC2_SB_23782_SI.indd 456 8/08/13 10:48 AM8/08/13 10:48 AM
UNCORRECTED PAGE PROOFS
FOC
US
STU
DY
457Chapter 14 Mathematics and resources
e i What is the peak energy rate per kilowatt-hour?
ii What is the diff erence between the peak and off -peak rates per kilowatt-hour?
f i What is the total energy usage charge for this quarter?
ii What is the total cost (availability and usage) for this quarter, after GST?
iii What is the average daily cost?
g Assuming the same fi xed and usage charges, was this bill smaller or larger than:
i the last bill?
ii the bill for the same period last year?
Consider the bill for the same period last year.
h i What was the average daily usage?
ii Calculate the total amount of electricity used for this period.
i If the total electricity usage (calculated in part h ii) is broken down in the same proportion as the current bill,
what would have been the amount of electricity used in these periods?
i peak ii shoulder iii off -peak
j Using your answer for part i, calculate:
i the energy usage charge for the period (assume the same rates as the current bill)
ii the service availability charge (assume the same daily rate as this bill)
iii the total of the usage and availability charges for this period
iv the total charges after the discount is applied and the GST added.
k Consider the electricity usage comparison. In which month was the:
i most energy consumed?
ii least shoulder rate energy used?
iii most off -peak rate energy used?
INVESTIGATION 14.5
WORKED EXAMPLE 1An alternative unit for energy is the watt-hour. One watt-hour is the amount of energy used by a 1 watt load
for 1 hour. A more satisfactory unit to measure the amount of energy a household uses is the kilowatt-hour (kWh or kW∙h).
1 kWh is the energy used by a 1 kW appliance operating for 1 hour.
Hence: Energy (kWh) = power (kW) × time (h)
Calculate the cost of running a 300 W television set for 6 hours if the domestic rate is 47.77 cents/kWh.
Solve Think Apply
Energy used = 0.3 × 6
= 1.8 kWh
Cost = 1.8 × 0.4777
= $0.86
300 W = 0.3 kW
47.77 cents = $0.4777
Use
Energy (kWh) = Power (kW) × time (h)
and
Cost = energy used (kWh) × rate ($/kWh)
2 Calculate the cost of running each of the following appliances.
a An 8000 watt electric oven is used for 3 hours. The domestic rate is 47.77c /kWh.
b A 1500 watt hair dryer is used for 10 minutes every day for 30 days. The rate is 19.4 cents/kWh.
c A 1200 watt iron is used for 2 hours per day for 5 days. The rate is 12.6 cents/kWh.
d A 100 watt light bulb is left on for 5 hours per day for a year. The rate is 36.58 c/kWh.
14_LEY_IM12_HSC2_SB_23782_SI.indd 45714_LEY_IM12_HSC2_SB_23782_SI.indd 457 8/08/13 10:48 AM8/08/13 10:48 AM
UNCORRECTED PAGE PROOFS

FOC
US
STU
DY
Insight Mathematics General 12 HSC Course 2458
3 a Calculate the cost of running a 1400 watt pool fi lter for 2 hours per day for a year if the peak rate is
47.77 c/kWh.
b How much could be saved by programming the fi lter to come on in the off -peak period of the day when the
cost is 19.4 c/kWh?
INVESTIGATION 14.6
4 What is the diff erence in the annual running costs for each of these two models of dishwasher, given that the
energy rate is 39.65 c/kWh.
a Gold DL10: energy consumption of 230 kWh/year
Gold DL20: energy consumption of 275 kWh/year
b Speedy G123: energy consumption of 231 kWh/year
Speedy G456: energy consumption of 324 kWh/year
5 What is the diff erence in the annual running costs for the following models of television sets, given that the
energy rate is 42.84 c/kWh.
a Sonic LED 138.8 cm screen: energy consumption of 261 kWh/year
Sonic LED 98 cm screen: energy consumption of 141 kWh/year
b Yanso LCD 66 cm screen: energy consumption of 241 kWh/year
Yanso LCD 100 cm screen: energy consumption of 561 kWh/year
6 Many appliances consume electricity even when they are not operating. This is generally referred to as stand-
by power consumption. The table shows the average stand-by power consumption for some common household
appliances.
i Calculate the annual energy consumption for each appliance in kilowatt-hours if they are left on stand-by for
24 hours a day for a year.
ii Hence determine the annual cost of stand-by energy used for each, if the cost of electricity is 26 c/kWh.
Appliance Stand-by power (W)
a Cordless phone 3
b Television 10
c Computer monitor 5
d Clock radio 4
e Personal computer 2
Use this table of units to answer questions 7 to 10.
7 A new mobile phone charger has stand-by power of 96 mW.
a Express this in kilowatts, using scientifi c notation.
b What is the energy consumption in kilowatt-hours if the
charger is left on stand-by for a week?
8 NSW has an electricity generation capacity of approximately 18 000 MW of power. Convert this to:
a kW b GW
INVESTIGATION 14.7
Metric units
Multiple Name Symbol
10−3 milliwatt mW
100 watt W
103 kilowatt kW
106 megawatt MW
109 gigawatt GW
14_LEY_IM12_HSC2_SB_23782_SI.indd 45814_LEY_IM12_HSC2_SB_23782_SI.indd 458 8/08/13 10:48 AM8/08/13 10:48 AM
UNCORRECTED PAGE PROOFS

FOC
US
STU
DY
459Chapter 14 Mathematics and resources
9 The Capital Wind farm at Tarago, NSW, has an electricity generation capacity of 1.41 × 10⁸ W. Convert this to:
a GW b MW c kW d mW
The Murray Power Station in the Snowy Mountains has a generation capacity of 1500 MW of hydroelectricity.
Convert this to:
a W b kW c GW
Use the graph of household electricity prices in Australia
and projections compared to other major economies at
average 2011 exchange rates to answer these questions.
a In 2011/12 for which country was the average price:
i highest? ii lowest?
b What is the projected percentage increase in price for
Australia from 2011/12 to 2013/14?
c Complete the following statements:
i The price in Australia is ___ % higher than in Japan.
ii The price in Australia is ___ % higher than in the
European Union countries.
iii The price in Australia is ___ % higher than in the USA.
iv The price in Australia is ___ % higher than in Canada.
Use the graph of the household electricity
price index for 2002 to 2011 to answer the
following questions.
a In which countries has the price of
household electricity been relatively
stable over this time period?
b Describe the trend in prices in
Australia.
c i What was the percentage increase
in Australian household electricity
prices from 2007 to 2011?
ii What is the projected increase in
price from 2011 to 2014?
d In which countries was there a decrease
in price over the period shown?
10
11 Average household electricity prices in 2011/12 and Australian projections to 2013/14
Australia Japan EuropeanUnion
USA Canada
Cen
ts p
er k
Wh
8
16
0
24
32
4
12
20
28
Australian projections, 2013/142011/12 prices
12
Year2002 2004 2006 2008 2010 2012
Pri
ce in
dex
(%)
0
90
100
110
120
140
160
130
170
2014
150
Household electricity price index
180AustraliaAustralia projectionsJapanEuropean UnionUSACanada
14_LEY_IM12_HSC2_SB_23782_SI.indd 45914_LEY_IM12_HSC2_SB_23782_SI.indd 459 8/08/13 10:48 AM8/08/13 10:48 AM
UNCORRECTED PAGE PROOFS

FOC
US
STU
DY
Insight Mathematics General 12 HSC Course 2460
The table shows the approximate electricity consumption for the top 15 users in the world in 2012. The
population of each of these countries is also shown.
CountryElectricity consumption
(kWh × 109) Population × 106
Electricity consumption per capita (kWh/person, to nearest 100)
Australia 225 22
Brazil 456 193
Canada 550 34
China 4690 1340
France 461 65
Germany 545 82
India 601 1185
Italy 310 60
Japan 860 127
Korea, South 455 50
Russia 858 142
Spain 268 47
Taiwan 221 23
United Kingdom 345 62
USA 3741 310
a In which of these countries was the electricity consumption the:
i greatest ii least?
13
14_LEY_IM12_HSC2_SB_23782_SI.indd 46014_LEY_IM12_HSC2_SB_23782_SI.indd 460 8/08/13 10:48 AM8/08/13 10:48 AM
UNCORRECTED PAGE PROOFS

FOC
US
STU
DY
461Chapter 14 Mathematics and resources
b What is Australia’s rank compared with the rest of the world?
c Complete the following statements:
i China’s consumption is ___ kWh more than Australia’s consumption.
ii China’s consumption is ___ times more than Australia’s consumption.
iii The total consumption of China and the USA is ___ (< or >) the total consumption of the next
13 biggest users.
d i Complete the column for Energy consumption per capita in the table above.
ii Which of these countries has the highest electricity use per person?
iii Which of these countries has the lowest electricity use per person?
iv What is Australia’s rank in consumption per person?
e i Does the country with the highest consumption per person have the highest population?
ii Does the country with the lowest population have the lowest consumption per person?
14I The BASIX CertificateThe BASIX CertificateThe aim of the Building and Sustainability Index (BASIX) Certifi cate is to ensure the eff ective use of water and
energy in homes across NSW by including reduction targets in these areas for all development plans.
EXERCISE 14IImagine that you are about to build the house with the plans shown on the next page. Carry out the following
calculations and investigations in preparation for the completion of a BASIX certifi cate for this development
proposal. Then follow the instructions below.
1 Calculate the:
a site area b roof area c fl oor area
d ratio of fl oor area for which air-conditioning applies to fl oor area for which air-conditioning does not apply.
(You will need to decide which rooms you will have air-conditioned.)
2 Make a landscape design for the property and calculate the garden and lawn areas.
3 Assume that you will be installing a water tank and a swimming pool.
a Decide on the size of the tank and where it will be situated.
b Calculate the volume of the swimming pool you select. (Keep the design simple.)
4 What is the thickness of the internal and external walls of the house?
5 What is the width of the eaves on each side of the house?
6 Investigate and calculate the amount of roof insulation required for this house.
7 Determine the orientation of the windows.
8 Determine the breeze path and indicate it on the plan.
Instructions
Now go to the NSW Government BASIX website, www.basix.nsw.gov.au. Use the plans given and your answers to
the questions above to complete each section of the BASIX Certifi cate. You will need to modify your plans along
the way until you have passed.
14_LEY_IM12_HSC2_SB_23782_SI.indd 46114_LEY_IM12_HSC2_SB_23782_SI.indd 461 8/08/13 10:48 AM8/08/13 10:48 AM
UNCORRECTED PAGE PROOFS

FOC
US
STU
DY
Insight Mathematics General 12 HSC Course 2462
Step 1: On the home page go to the login box and click on ‘Register’ and then ‘next’. Select ‘Education’ as your
user type and click on ‘next’.
Step 2: Make up a username and password.
Step 3: Enter your name, school (institution) and email address. Click on ‘next’. An email is then sent to you with
your verifi cation code.
Step 4: Return to the home page. In the login box enter your username and password. Tick ‘… terms and
conditions’ and enter the verifi cation code sent to you by email. Submit.
Step 5: Select ‘New Dwellings’ and enter.
Step 6: Click on ‘Start a new project’.
Sample house plans
20 mHouse
30 m
Site plan
Scale 1 : 500
21002100
Scale 1 : 100
1800 1800
East elevation
Roof ridgelevel
Ceilinglevel
Floorl l
2700 mm
2000 mm
(1200 × 1200)(1800 × 1200) (1800 × 1200)
South elevation
14_LEY_IM12_HSC2_SB_23782_SI.indd 46214_LEY_IM12_HSC2_SB_23782_SI.indd 462 8/08/13 10:48 AM8/08/13 10:48 AM
UNCORRECTED PAGE PROOFS

FOC
US
STU
DY
463Chapter 14 Mathematics and resources
2100
Scale 1 : 100
1800
West elevation
North elevation
(1200 × 1200)(1200 × 1200)
(600 × 600) (600 × 600)
Slidingdoor
Eaves400 mm
(Exterior walls 200 mm)(Interior walls 100 mm)
N
Scale 1 : 200
Roof line
Eaves 400 mm
Bed 1(3.6 × 3.4)
Bath(3.6 × 3.0)
Bed 2(3.2 × 3.0)
Bed 3(3.6 × 3.0)
Laundry(3.6 × 1.6)
Kitchen(3.2 × 2.6)
Entry(1.3 × 5.6)
Living/Dining(6.9 × 4.5)
WC
14_LEY_IM12_HSC2_SB_23782_SI.indd 46314_LEY_IM12_HSC2_SB_23782_SI.indd 463 8/08/13 10:48 AM8/08/13 10:48 AM
UNCORRECTED PAGE PROOFS

FOC
US
STU
DY
Insight Mathematics General 12 HSC Course 2464
INVESTIGATION 14.1Water usage chart1 Use the information in the water usage chart to complete this investigation of the amount of water used by your
household over a week. (Show any calculations that you make.)
Number of people living in the house _____
In the bathroom
Shower
Average time for shower ___
Number of showers/day ___
Amount of water/day _____
Bath
Number of baths/day ___
Amount of water/day _____
Toilet
Amount of water/day _____
Hand basin (running tap for washing, shaving,
brushing teeth)
Average time/day/person ___
Amount of water/day _____
In the kitchen
Dishwashing by hand
Number of times/day ___
Amount of water/day _____
Dishwashing machine
Number of times/week ___
Amount of water/week _____
In the laundry
Washing machine
Number of washes/week ___
Amount of water/week _____
Hand washing
Number of times/week ___
Amount of water/week _____
Outdoors
Using a sprinkler/hose
Number of hours/week ___
Amount of water/week _____
Washing cars
Number of washes/week ___
Amount of water/week _____
Leaks (estimate if relevant)
Amount of water/week _____
Total amount of water used by your household in a year is ______.
(Use 1 year = 365 days = 52.14 weeks.)
Usage Litres used
Shower
Regular type 18 L/min
3-star rated shower head 9 L/min
Bath
Average bath 58 L
Toilet
11 L full fl ush 54 L /person/day
3-star rated dual fl ush 18 L/person/day
Hand basin
Running tap up to 18 L/min
Dishwashing
Washing by hand 18 L
3-star rated machine 18 L/cycle
Clothes washing
Average washing machine 99 L/load
4 1 _ 2 -star rated washing machine 41 L/load
Hand washing 20 L/wash
Garden
Filling swimming pool up to 54 000 L
Sprinkler or hand-held hose 15 L/min
Car washing
Hose washing 180 L/wash
Bucket washing 100 L/wash
Leaks (taps and pipes)
Dripping taps 30–200 L/day
Leaking pipe (1.5 mm hole) 99 L/day
Leaks (from toilet cisterns)
Slow, barely visible 9 L/day
Visible, just audible 144 L/day
Constant refi lling hiss 261 L/day
14_LEY_IM12_HSC2_SB_23782_SI.indd 46414_LEY_IM12_HSC2_SB_23782_SI.indd 464 8/08/13 10:48 AM8/08/13 10:48 AM
UNCORRECTED PAGE PROOFS

FOC
US
STU
DY
465Chapter 14 Mathematics and resources
2 a Find the water usage cost for your locality and calculate the total cost of water usage for a year.
b Calculate the average usage per person per year.
c Calculate the average cost per person per year.
3 Compare and discuss your household’s water usage with that of others in your class by listing the data on the board.
a Calculate the median usage for the class.
b Is your household’s usage higher or lower than the median for the class?
4 a How could you reduce the amount of water used in your household?
b How much per year could you save?
INVESTIGATION 14.2The water footprint conceptWrite a short report, using tables and graphs where relevant, to answer the following questions. Discuss your report
with the class. The UNSW website: National water footprints may be helpful.
• Explain what is meant by the terms water footprint and virtual water content.
• How is the water footprint calculated?
• What are the major factors that contribute to the global water footprint?
• List examples of the virtual water content of some common items (for example a slice of bread, a cotton T-shirt,
a hamburger, etc.)
• Which countries have the largest water footprint:
a per year? b per person per year?
• How does Australia’s water footprint compare with that of other countries?
• How can a country reduce its water footprint?
INVESTIGATION 14.3International weatherGo to www.worldweatheronline.com to fi nd weather summaries for other cities of the world.
Investigate and compare Australia’s weather with weather in other parts of the world.
INVESTIGATION 14.4Distance and areaTo calculate the distance between two points on a section of land using online tools, go to www.freemaptools.com.
1 Use the ‘Measure Distance’ tool to fi nd the distance between:
• Sydney and London • Sydney and Canberra
• Sydney(CBD) and Penrith • the ends of the street/road in which you live.
Try some of your own examples.
2 Use the ‘Area Calculator’ to estimate the area of:
• NSW • your school grounds.
Try some of your own examples.
Or you could use the appropriate tools in Google Earth to determine selected distances.
14_LEY_IM12_HSC2_SB_23782_SI.indd 46514_LEY_IM12_HSC2_SB_23782_SI.indd 465 8/08/13 10:48 AM8/08/13 10:48 AM
UNCORRECTED PAGE PROOFS

FOC
US
STU
DY
Insight Mathematics General 12 HSC Course 2466
INVESTIGATION 14.5Power ratingPower is the rate at which energy is used; that is, power =
energy ______
time .
The SI unit for power is the watt (W), which is defi ned as follows:
1 watt = 1 joule/second where the amount of energy is measured in joules (J)
Thus 1 kilowatt (kW) = 1000 W = 1000 J/s
Rank the rate of energy consumption (power rating) of the following common appliances and physical activities:
• an electric kettle • fast running
• an incandescent light bulb • playing tennis
• an electric room heater • doing aerobics
• a car engine • swimming or cycling
Hint: The power ratings of electrical appliances can be found directly from the appliance or from tables.
For the physical activities, convert the rate of energy use to joules/second (watts).
INVESTIGATION 14.6Energy rating labelsGo to the government website www.energyrating.gov.au to fi nd the answers to these questions.
1 What are the two main features of the energy
rating label?
2 How is the star rating determined?
3 What is the approximate diff erence in energy
consumption between 2-star and 3-star rated
appliances?
4 What other factors should be considered when
buying an appliance?
INVESTIGATION 14.7The price of household electricity in Australia1 Investigate the price of electricity in the various states and territories of Australia.
a Compare the cheapest and most expensive plans.
b What proportion of people switch plans each year?
c How much has the price increased over the last 1, 2 and 5 years?
2 Write a short report and discuss it with your class.
14_LEY_IM12_HSC2_SB_23782_SI.indd 46614_LEY_IM12_HSC2_SB_23782_SI.indd 466 8/08/13 10:48 AM8/08/13 10:48 AM
UNCORRECTED PAGE PROOFS

FIN
AN
CIA
L M
ATH
EMAT
ICS
Chapter 14 Mathematics and resources 467
FOC
US
STU
DY
REVIEW 14 MATHEMATICS AND RESOURCES
Language and terminologyHere is a list of terms used in this chapter. Explain each term in a sentence.
catchment area, energy, fi xed charges, grid-square method, joule, kilowatt, kilowatt-hour, off -peak rate,
peak rate, plan-view area, polygon method, power, radial survey, stand-by power, traverse survey, usage charges,
water-effi cient targets, water footprint, watt
Having completed this chapter you should be able to:• interpret information about a household water bill
• interpret data on household and personal water usage
• construct and interpret rainfall graphs
• calculate the probability of rainfall in a locality
• interpret data and calculate statistics on water availability and usage
• calculate the volume of water held by tanks of various shapes and sizes
• calculate the volume of water that can be collected from a roof
• calculate the scale used on a photograph, given that it contains a feature with a known dimension
• calculate the perimeter and area of a section of land using a scale diagram
• use online tools to calculate the distance between two points on a section of land
• estimate the area of land using the grid-square method or the polygon method
• calculate the volume of rainfall using V = Ah
• estimate volumes using Simpson’s rule
• interpret information about a household electricity bill
• rank common appliances and physical activities in terms of their energy consumption
• calculate the cost of operating household appliances
• calculate and interpret statistics for electricity costs, production and consumption
• identify the issues and make calculations for the issues addressed in the BASIX.
14 REVIEW TEST1 In Bangarra shire, the water usage charge for non-residential properties is $1.76/kL for the fi rst 250 kL and
$2.02/kL for any consumption over 250 kL. The water connection fees are $89 for a 20 mm meter connection
and $138 for a 25 mm connection. A non-residential property has one 20 mm and one 25 mm meter connection.
If the amount of water consumed is 490 kL, the total annual cost is:
A $924.80 B $1089.40 C $1151.80 D $1216.80
2 A front-loading washing machine uses 90 L per wash. A family uses the washing machine 5 times a week. Given
that water costs $2.26/kL, the annual water usage charge for this machine is (use 1 year = 52 weeks):
A $1.02 B $10.58 C $52.88 D $528.84
14_LEY_IM12_HSC2_SB_23782_SI.indd 46714_LEY_IM12_HSC2_SB_23782_SI.indd 467 8/08/13 10:48 AM8/08/13 10:48 AM
UNCORRECTED PAGE PROOFS
Insight Mathematics General 12 HSC Course 2
FOC
US
STU
DY
468
Use this diagram to answer questions 3 and 4.
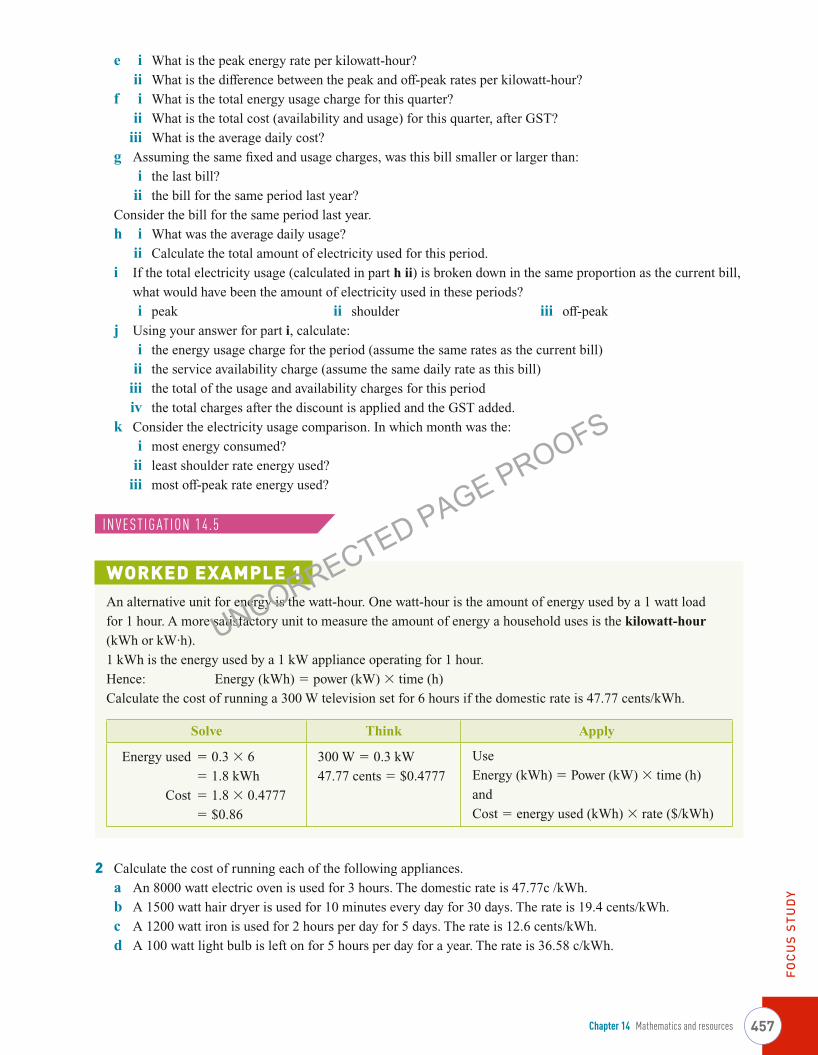
3 The volume of the swimming pool shown in the diagram is:
A 69.3 m3 B 89.25 m3
C 115.5 m3 D 178.5 m3
4 If the water usage charge is $2.34/kL, the cost to fi ll this
pool is:
A 162.16 B $208.85 C $270.27 D $417.69
5 The table gives the mean number of days of rain for each month of the year for Sydney (for all years of record).
Month Jan Feb Mar Apr May Jun Jul Aug Sep Oct Nov Dec
Number rainy days 12.2 12.5 13.6 12.8 13.1 12.5 11.2 10.4 10.6 11.7 11.7 11.5
Using this data, the probability that it will rain on the 19 June and 20 June next year is:
A 2 __ 25 B 4 ___ 625 C 5 __ 12 D 25
___ 144
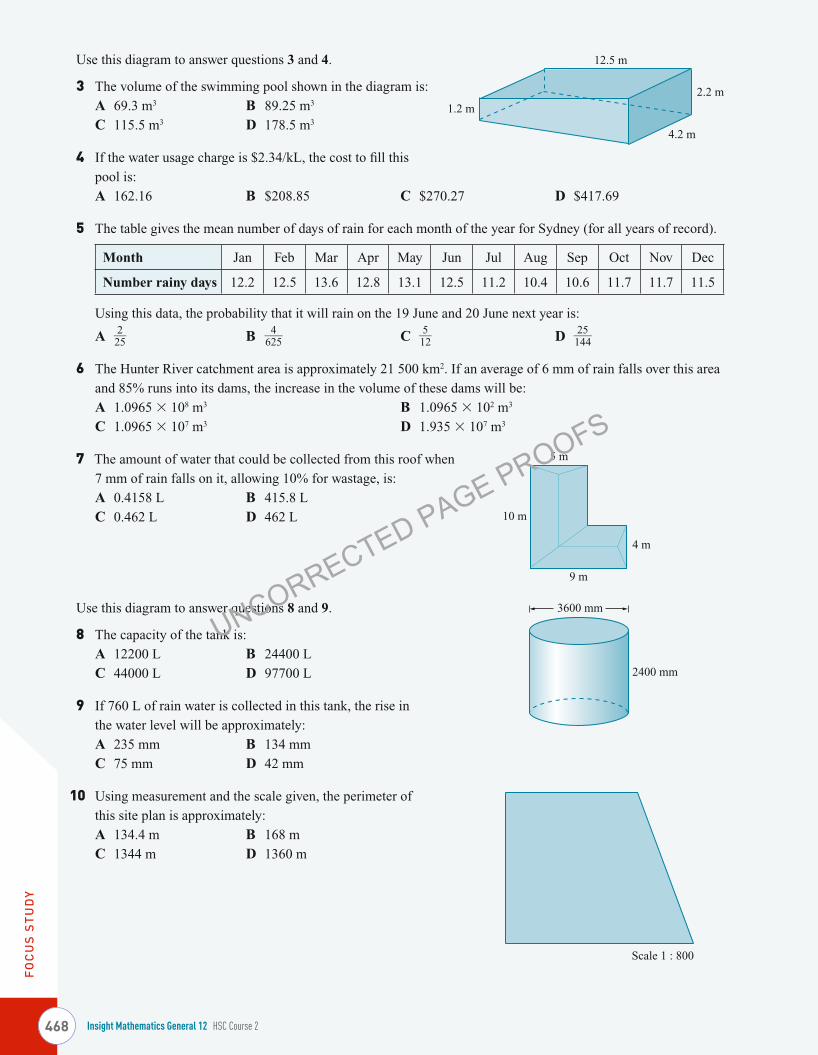
6 The Hunter River catchment area is approximately 21 500 km2. If an average of 6 mm of rain falls over this area
and 85% runs into its dams, the increase in the volume of these dams will be:
A 1.0965 × 10⁸ m3 B 1.0965 × 10² m3
C 1.0965 × 10⁷ m3 D 1.935 × 10⁷ m3
7 The amount of water that could be collected from this roof when
7 mm of rain falls on it, allowing 10% for wastage, is:
A 0.4158 L B 415.8 L
C 0.462 L D 462 L
Use this diagram to answer questions 8 and 9.
8 The capacity of the tank is:
A 12200 L B 24400 L
C 44000 L D 97700 L
9 If 760 L of rain water is collected in this tank, the rise in
the water level will be approximately:
A 235 mm B 134 mm
C 75 mm D 42 mm
Using measurement and the scale given, the perimeter of
this site plan is approximately:
A 134.4 m B 168 m
C 1344 m D 1360 m
1.2 m
2.2 m
12.5 m
4.2 m
9 m
5 m
10 m
4 m
2400 mm
3600 mm
10
Scale 1 : 800
14_LEY_IM12_HSC2_SB_23782_SI.indd 46814_LEY_IM12_HSC2_SB_23782_SI.indd 468 8/08/13 10:48 AM8/08/13 10:48 AM
UNCORRECTED PAGE PROOFS

FIN
AN
CIA
L M
ATH
EMAT
ICS
Chapter 14 Mathematics and resources 469
FOC
US
STU
DY
The diagram shows part of a 5 mm by 5 mm grid. The real
area of each grid square is:
A 25 m2 B 36 m2
C 60 m2 D 3600 m2
The area of triangle PAB in the diagram is:
A 1 _ 2 × 126 × 143
B 1 _ 2 × 126 × 143 × cos 98°
C 1 _ 2 × 126 × 143 × sin 98°
D 1 _ 2 × 126 × 143 × tan 98°
The area of ABCD is:
A 4053 m2 B 13132 m2
C 6566 m2 D 4305 m2
Using two applications of Simpson’s rule, the area in the
diagram is approximately:
A 420 m2 B 540 m2
C 870 m2 D 1080 m2
Using Simpson’s rule, the volume of this reservoir is
approximately:
A 120
____ 3 (370 +352 + 314)
B 60
___ 3 (370 + 352 + 314)
C 60
___ 3 (370 + 4 × 352 + 314)
D 60
___ 2 (370 + 4 × 352 + 314)
Given that the cost of electricity is 52.68 c/kWh, the cost of running a 2200 W electric heater for 5 hours a day
for 70 days is:
A $81.13 B $579.49 C $162.26 D $405.64
A wind farm generates 2400 megawatts of power. This is equivalent to:
A 2.4 gigawatts B 2.4 kilowatts
C 240 gigawatts D 240 kilowatts
11
Scale 1 : 12 000
12
P
B
A143 m
126 m98°
13
42 m
56 m
73 m35 m
26 m
D
C
B
A
14
15 m 15 m
18 m 27 m
12 m
15 m 15 m
1560 m
60 m
370 m2
352 m2
314 m2
16
17
14_LEY_IM12_HSC2_SB_23782_SI.indd 46914_LEY_IM12_HSC2_SB_23782_SI.indd 469 8/08/13 10:48 AM8/08/13 10:48 AM
UNCORRECTED PAGE PROOFS

Insight Mathematics General 12 HSC Course 2
FOC
US
STU
DY
470
If you have any diffi culty with these questions, refer to the examples and questions in the sections listed in the table.
Question 1–5 6–9 10 11 12, 13 14 15 16, 17
Section A B C D E F G H
14A REVIEW SET1 The charges for water access and supply of water by Kempsey Shire Council in 2012 are given below. Calculate
the annual cost of water to a residential property that has a 25 mm connection and uses 315 kL of water.
Meter connection
For 20 mm: charge is $235
For 25 mm: charge is $367
Water supply usage charges
For 0–250 kL: charge is $1.67/kL
Each kL > 250 kL: charge is $2.35/kL
2 a A 2-star washing machine uses 99 L of water per load. Calculate the cost of using the machine three times a
week for a year (52 weeks) if the cost of water is $2.08/kL.
b A 3-star washing machine is 20% more effi cient. Calculate the savings each year if the 2-star machine is
replaced by the 3-star machine.
3 The table shows the average monthly rainfall (mm) for Wagga Wagga and Grafton, in NSW.
Month Jan Feb Mar Apr May Jun Jul Aug Sep Oct Nov Dec
Wagga Wagga 42 39 41 46 55 49 60 54 54 61 43 41
Grafton 138 134 121 81 71 73 53 39 44 63 80 101
a Draw a side-by-side column graph to display this information.
b Draw a box-and-whisker plot for each city on the one set of axes.
c Compare the rainfall in each city. Write a short report.
4 The table shows the mean number of rainy days each month for a year in Wagga Wagga.
Month Jan Feb Mar Apr May Jun Jul Aug Sep Oct Nov Dec
Number rainy days 5 5 5 6 9 10 11 12 10 9 7 6
a What is the probability that next year in Wagga Wagga it will rain on:
i 1 April? ii 1 April and 2 April?
b For which season of the year was the number of rainy days:
i the most? ii the least?
5 a Calculate the plan-view area of the roof of this house.
b How much water could be collected from this roof when 5 mm
of rain falls on it, allowing 10% for wastage?
c The water is collected in a round tank of diameter 1300 mm.
By how much would the water level in the tank rise?
11 400 mm
8200 mm
12 900 mm
3600 mm
14_LEY_IM12_HSC2_SB_23782_SI.indd 47014_LEY_IM12_HSC2_SB_23782_SI.indd 470 8/08/13 10:48 AM8/08/13 10:48 AM
UNCORRECTED PAGE PROOFS

FIN
AN
CIA
L M
ATH
EMAT
ICS
Chapter 14 Mathematics and resources 471
FOC
US
STU
DY
Use this diagram of a park to answer
questions 6 and 7.
6 Use the grid-square method, with 1 cm by
1 cm squares, to estimate the area of the park.
7 Estimate the area of the park using a radial
survey.
8 Use Simpson’s rule to estimate the volume of the
reservoir shown.
9 Calculate the cost of running a 350 watt television set for 8 hours when the cost of electricity is 47.77 c/kWh.
Convert 3.2 MW into kW.
14B REVIEW SET1 For non-residential properties in Shoalhaven, the water usage charge is $1.55 per kL. The water availability
charge is based on the size (diameter) of the water meter service connection(s), as shown below. If you have
more than one connection you must pay for each one.
Meter connection
For 20 mm: charge is $81
For 40 mm: charge is $324
a What would be the water availability charge for a non-residential property that is supplied by:
i one 40 mm connection? ii two 20 mm connections?
b Explain why the answers to part a i and ii are not the same.
2 Bill washes his car every fortnight. Washing by hose uses 180 L/wash and washing by bucket uses 100 L/wash.
a How much does it cost each year if he uses a hose and water costs $2.18/kL?
b How much would he save each year if he used a bucket instead of a hose?
Park
Scale 1 : 4000
30 m
30 m
380 m2
270 m2
190 m2
10
14_LEY_IM12_HSC2_SB_23782_SI.indd 47114_LEY_IM12_HSC2_SB_23782_SI.indd 471 8/08/13 10:48 AM8/08/13 10:48 AM
UNCORRECTED PAGE PROOFS

Insight Mathematics General 12 HSC Course 2
FOC
US
STU
DY
472
3 The graph shows the average rainfall for each
month in New York (mm) and the average
number of days of rain for each month.
a Does New York have more rain in summer
or winter?
b Which month is the:
i wettest? ii driest?
c Find the mean and standard deviation
of the:
i average monthly rainfalls
ii average number of rainy days each
month.
d Comment on the pattern of rainfall in New York.e Find the probability that it will rain next year on: i 5 August ii 5 January.
4 Calculate the capacity of the water tank on the right.
5 a Calculate the plan-view area of the roof of this house.
b How much water could be collected from this roof if 3 mm
of rain were to fall on it, allowing 15% for wastage?
c The water is collected in a round tank of diameter 900 mm.
By how much would the water level in the tank rise?
6 Use the polygon method (off set
survey) to estimate the surface
area of the dam shown.
Average monthly rainfall and rainfall days in New York
MonthJ F M A M J J A S O N D
Rai
nfal
l (m
m)
20
40
0
60
80
120
140 Average rainfallAverage rainfall days
100
Num
ber of rainy days
8
16
0
24
4
12
20
28
1200 mm
1200 mm
8400 mm
10 600 mm
6200 mm
3600 mm
Dam
Scale 1 : 3000
14_LEY_IM12_HSC2_SB_23782_SI.indd 47214_LEY_IM12_HSC2_SB_23782_SI.indd 472 8/08/13 10:48 AM8/08/13 10:48 AM
UNCORRECTED PAGE PROOFS

FIN
AN
CIA
L M
ATH
EMAT
ICS
Chapter 14 Mathematics and resources 473
FOC
US
STU
DY
7 Use two applications of Simpson’ rule to estimate the
volume of the dam shown.
8 Calculate the cost of running a 175 watt ceiling fan for 4 hours a day for 60 days when the cost of electricity is
54.6c/kWh.
9 Convert 6.1 GW into:
a kW ii MW
The graph shows predicted household electricity prices.
a What was the percentage increase in price from
2006 to 2011?
b What percentage does the carbon tax contribute
to the price of electricity in 2013?
14C REVIEW SET1 Use the water bill on page 431 in Section 14A to answer the following questions.
a By how much did the daily consumption for this bill exceed the local area average?
b i How many days were in the billing period?
ii By how much did the total consumption on this bill exceed the local area average?
c Given that water costs $2.31/kL, how much more than the local average did this consumer pay?
2 The table shows mean rainfall data for Moree, NSW.
Month Jan Feb Mar Apr May Jun Jul Aug Sep Oct Nov Dec
Rainfall (mm) 77 69 47 37 46 27 46 37 32 45 57 64
Number rainy days 8 6 5 5 6 6 7 6 6 7 7 8
a Construct a rainfall graph.
b Draw a box-and-whisker plot for the rainfall data.
c Calculate the mean and standard deviation for the number of rainy days.
d Comment on the yearly weather pattern in Moree.
e What is the probability that it will rain on 5 September next year?
f What is the probability that it will rain on two consecutive days in September?
20 m
20 m
295 m2
280 m2
180 m2
250 m2
290 m2
20 m
20 m
10 Household electricity prices in 2012 dollars
Year2006 2011 2013–17 2018–22
Cos
t per
MW
/h (
$)
0
50
100
150
200
300
250
With carbon tax
14_LEY_IM12_HSC2_SB_23782_SI.indd 47314_LEY_IM12_HSC2_SB_23782_SI.indd 473 8/08/13 10:48 AM8/08/13 10:48 AM
UNCORRECTED PAGE PROOFS

Insight Mathematics General 12 HSC Course 2
FOC
US
STU
DY
474
3 a Calculate the plan-view area of the roof of this
house.
b How much water could be collected from this roof
if 6 mm of rain were to fall on it, allowing 15% for
wastage?
c The water is collected in a round tank of diameter
1100 mm. By how much would the water level in the
tank rise?
Use this diagram to answer questions 4 and 5.
4 Use the grid-square method, with 5 mm by
5 mm squares, to estimate the area of land
shown.
5 Estimate the area using the polygon method
(radial survey).
6 A small farm dam has a surface area of approximately 290 m2. If the average depth of the dam is 2.2 m,
calculate the volume of water in the dam.
7 Use Simpson’s rule to estimate the volume of this reservoir.
8 a Complete the table to fi nd the total usage charges for this electricity bill.
Energy used (kWh) Rate ($/kWh) Cost ($)
Peak 583.6 0.5144
Flexi 892.8 0.2136
Off -peak 291.7 0.139
Total
b The service availability charge is 78.67 c/day. If the billing period was 91 days, calculate the total availability
charge for this bill.
c Find the total amount payable for this bill if a 5.5% discount is applied and then GST added.
d Would it make any diff erence to the amount paid if the discount is applied after the GST is added?
3600 mm
2400 mm
8200 mm
3600 mm
3600 mm
Park
Scale 1 : 2000
20 m
20 m
170 m2
165 m2
140 m2
14_LEY_IM12_HSC2_SB_23782_SI.indd 47414_LEY_IM12_HSC2_SB_23782_SI.indd 474 8/08/13 10:48 AM8/08/13 10:48 AM
UNCORRECTED PAGE PROOFS

FIN
AN
CIA
L M
ATH
EMAT
ICS
Chapter 14 Mathematics and resources 475
FOC
US
STU
DY
9 a A computer monitor has a stand-by power usage of 4 watts. Calculate the annual energy consumption in
kilowatt-hours if it is left on stand-by for 20 hours a day for a year.
b Hence determine the cost of stand-by energy used, when the cost of electricity is 26.9 c/kWh.
A wind farm has an electricity generation capacity of 1.28 × 10⁸ watts. Convert this to:
a gigawatts b megawatts c kilowatts d milliwatts.
14D REVIEW SET1 The average rate of fl ow of a bathroom shower with a normal shower rose is 18 L/minute.
a Nora has two 10 minute showers each day. Calculate the annual cost of Nora’s showers given the water usage
charge is $2.17/kL. (Use 1 year = 365 days)
b How much could Nora save each year by using a water-effi cient shower rose that only uses 8.5 L/minute?
2 Use the water-effi ciency targets in the table below
to fi nd the ideal daily water consumption for these
households.
a a large property with 6 people
b a small property with 4 people
c a 650 m2 property with 3 people
d a 19 m by 40 m property with 5 people
3 The graph shows the average rainfall for
each month in Johannesburg and the average
number of days of rain for each month.
a Does Johannesburg have more rain in
summer or winter?
b Which month is the:
i wettest? ii driest?
c Find the mean and standard deviation
of the:
i average monthly rainfall
ii average number of rainy days each
month.
d Comment on the pattern of rainfall.e Find the probability that it will rain next year on: i 5 August ii 5 January.
f What is the probability that it will rain on two consecutive days in June next year?
10
Property sizePeople per household Small Medium Large
247 L/day 249 L/day 267 L/day
367 L/day 375 L/day 396 L/day
463 L/day 477 L/day 498 L/day
546 L/day 565 L/day 587 L/day
621 L/day 645 L/day 666 L/day
689 L/day 718 L/day 739 L/day
Note: A small property has an area of <500 m2.A medium property has an area between 501 m2 and 700 m2.A large property has an area between 701 m2 and 900 m2.
Targets for water-efficient households
Average monthly rainfall and rainfall days in Johannesburg
MonthJ F M A M J J A S O N D
Rai
nfal
l (m
m)
20
40
0
60
Average rainfallAverage rainfall days
80
120
140
100
160
Num
ber of rainy days10
20
0
30
40
5
15
25
35
14_LEY_IM12_HSC2_SB_23782_SI.indd 47514_LEY_IM12_HSC2_SB_23782_SI.indd 475 8/08/13 10:48 AM8/08/13 10:48 AM
UNCORRECTED PAGE PROOFS

Insight Mathematics General 12 HSC Course 2
FOC
US
STU
DY
476
4 Calculate the capacity of the water tank shown.
5 a Calculate the plan-view area of the roof of this house.
b How much water could be collected from this roof if 4 mm of
rain were to fall on it, allowing 12% for wastage?
c The water is collected in a round tank of diameter 1500 mm.
By how much would the water level in the tank rise?
6 a Find the actual perimeter and area of the section of farmland
shown in the scale diagram.
b If 2 mm of rain falls on this land and 85% of it fl ows into a
dam, by how much will the capacity of the dam be increased?
Use this diagram to answer
questions 7 and 8.
7 Use the grid-square method, with
1 cm by 1 cm squares, to estimate
the area of the park shown.
8 Estimate the area of the park in
question 7 using the polygon
method (traverse survey).
1200 mm
600 mm
2800 mm
6600 mm
3000 mm
3000 mm
3000 mm
Scale 1 : 5000
Park
Scale 1 : 2000
14_LEY_IM12_HSC2_SB_23782_SI.indd 47614_LEY_IM12_HSC2_SB_23782_SI.indd 476 8/08/13 10:48 AM8/08/13 10:48 AM
UNCORRECTED PAGE PROOFS
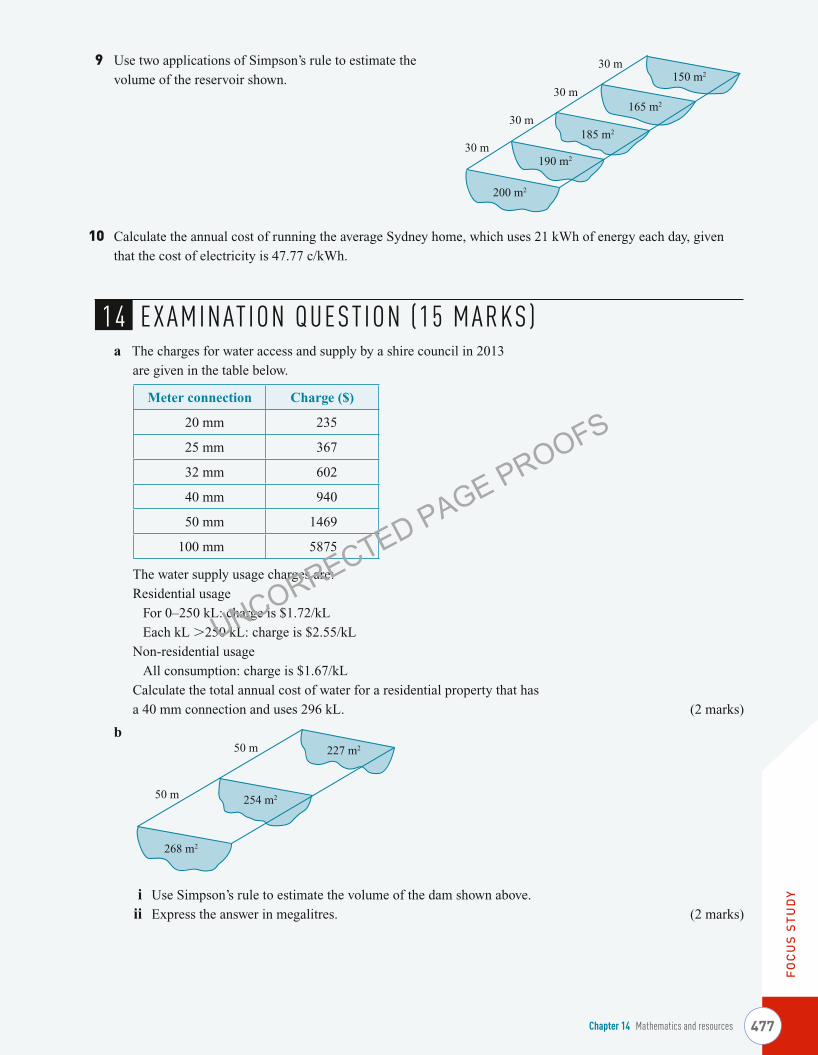
FIN
AN
CIA
L M
ATH
EMAT
ICS
Chapter 14 Mathematics and resources 477
FOC
US
STU
DY
9 Use two applications of Simpson’s rule to estimate the
volume of the reservoir shown.
Calculate the annual cost of running the average Sydney home, which uses 21 kWh of energy each day, given
that the cost of electricity is 47.77 c/kWh.
14 EXAMINAT ION QUEST ION (15 MARKS)a The charges for water access and supply by a shire council in 2013
are given in the table below.
The water supply usage charges are:
Residential usage
For 0–250 kL: charge is $1.72/kL
Each kL >250 kL: charge is $2.55/kL
Non-residential usage
All consumption: charge is $1.67/kL
Calculate the total annual cost of water for a residential property that has
a 40 mm connection and uses 296 kL. (2 marks)
b
i Use Simpson’s rule to estimate the volume of the dam shown above.
ii Express the answer in megalitres. (2 marks)
30 m
30 m
190 m2
185 m2
150 m2
165 m2
200 m2
30 m
30 m
10
Meter connection Charge ($)
20 mm 235
25 mm 367
32 mm 602
40 mm 940
50 mm 1469
100 mm 5875
50 m
50 m
268 m2
254 m2
227 m2
14_LEY_IM12_HSC2_SB_23782_SI.indd 47714_LEY_IM12_HSC2_SB_23782_SI.indd 477 8/08/13 10:48 AM8/08/13 10:48 AM
UNCORRECTED PAGE PROOFS

Insight Mathematics General 12 HSC Course 2
FOC
US
STU
DY
478
c i Calculate the plan-view area of the roof of the house shown.
ii This house is situated in Broken Hill. The average annual rainfall for
Broken Hill in January is 28.6 mm. How much water could be expected
to be collected from this roof next January, allowing 10% for wastage?
iii If the water is collected in a round tank of diameter 2400 mm, what
would be the rise in the height of the water in the tank? (3 marks)
d i Calculate the amount of energy needed to run a 2200 watt heater for
4 hours a day for 90 days.
ii How much could be saved in a year by only putting the heater on for
3 hours a day, given the price of electricity is 33.6 c/kWh? (2 marks)
e The table shows the mean number of rainy days each month of the year in Taree, NSW.
Month Jan Feb Mar Apr May Jun Jul Aug Sep Oct Nov Dec
Number rainy days 11 11 12 11 9 9 7 8 8 9 10 11
What is the probability that it will rain in Taree on:
i 1 April next year?
ii 1 April and 2 April next year? (2 marks)
f i Using EB as the baseline, estimate the area of the bushland reserve
shown below using a traverse survey.
ii Use one application of Simpson’s rule to estimate this area. (4 marks)
13 600 mm
10 000 mm
12 500 mm
4800 mm
Scale 1 : 2000
D
E
C
B
A
14_LEY_IM12_HSC2_SB_23782_SI.indd 47814_LEY_IM12_HSC2_SB_23782_SI.indd 478 8/08/13 10:48 AM8/08/13 10:48 AM
UNCORRECTED PAGE PROOFS