uncorrelated return
TRANSCRIPT

PRESENTED BY
)
U N -C O R R E L A T E D
R E T U R N
PRESENTED TO
Asst. Prof.Department of
Business Administration
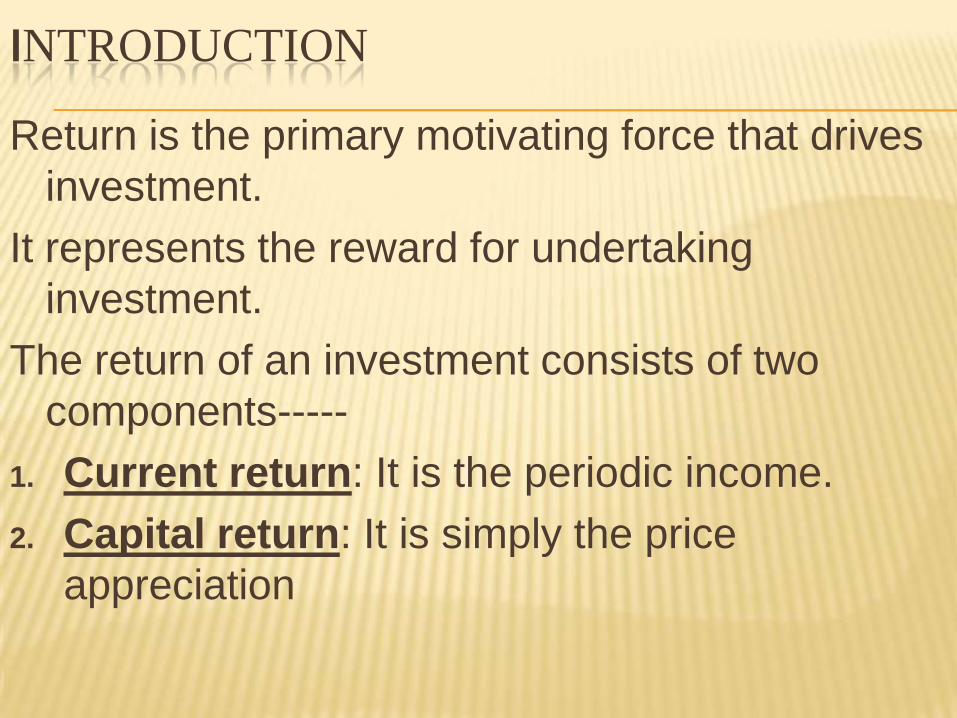
INTRODUCTION
Return is the primary motivating force that drives
investment.
It represents the reward for undertaking
investment.
The return of an investment consists of two
components-----
1. Current return: It is the periodic income.
2. Capital return: It is simply the price
appreciation
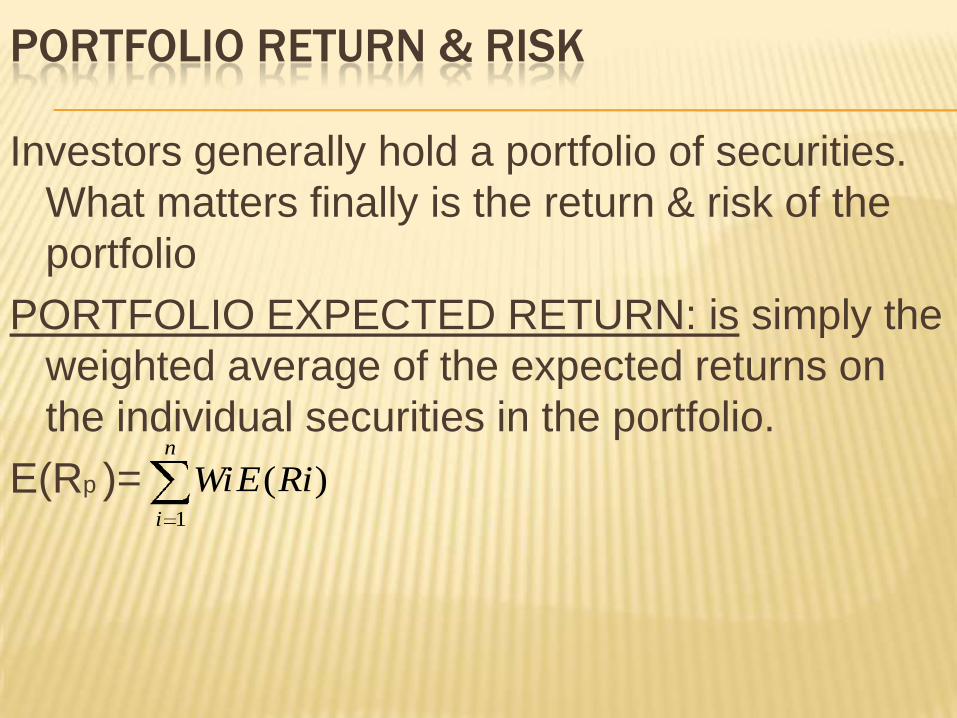
PORTFOLIO RETURN & RISK
Investors generally hold a portfolio of securities.
What matters finally is the return & risk of the
portfolio
PORTFOLIO EXPECTED RETURN: is simply the
weighted average of the expected returns on
the individual securities in the portfolio.
E(Rp )= )(1
RiEWin
i
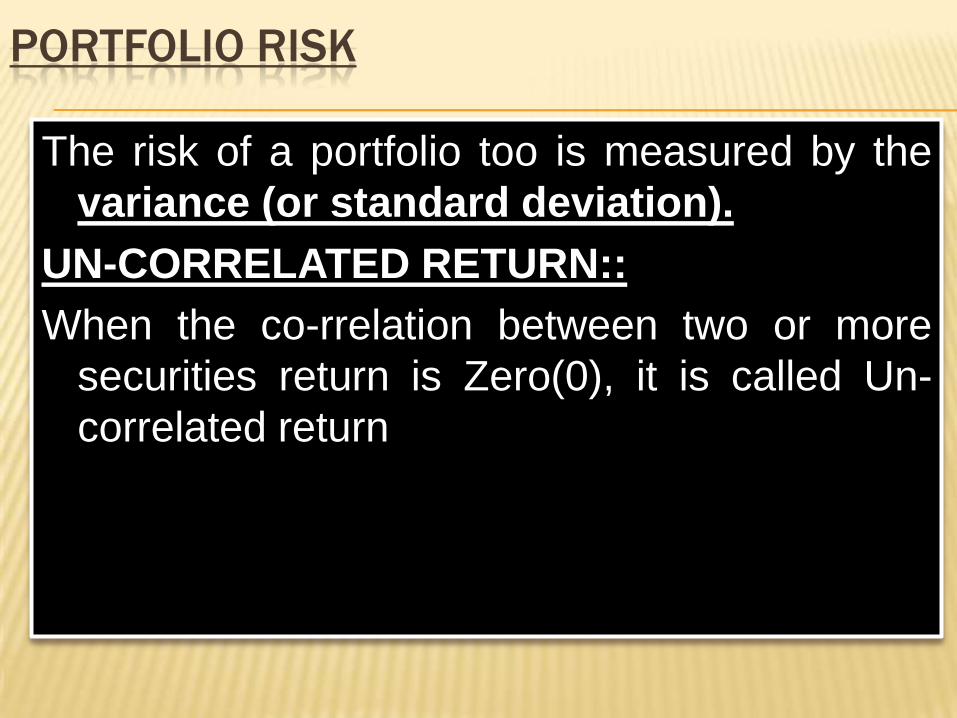
PORTFOLIO RISK
The risk of a portfolio too is measured by the
variance (or standard deviation).
UN-CORRELATED RETURN::
When the co-rrelation between two or more
securities return is Zero(0), it is called Un-
correlated return

M E A S U R E M E N T O F C O M O V E M E N T S I N
S E C U R I T Y R E T U R N S
Comovements between the returns of securities
are measured by Covariance & Coefficient of
Co-rrelation
Covariance essentially tells us whether or not two
securities returns are correlated.
Covariance is standardized by dividing with the
product of the standard deviation of two
individual securities, called as Correlation
Coefficient.
Cor(Ri, Rj)=rij= ji
RjRiCov
.
),(
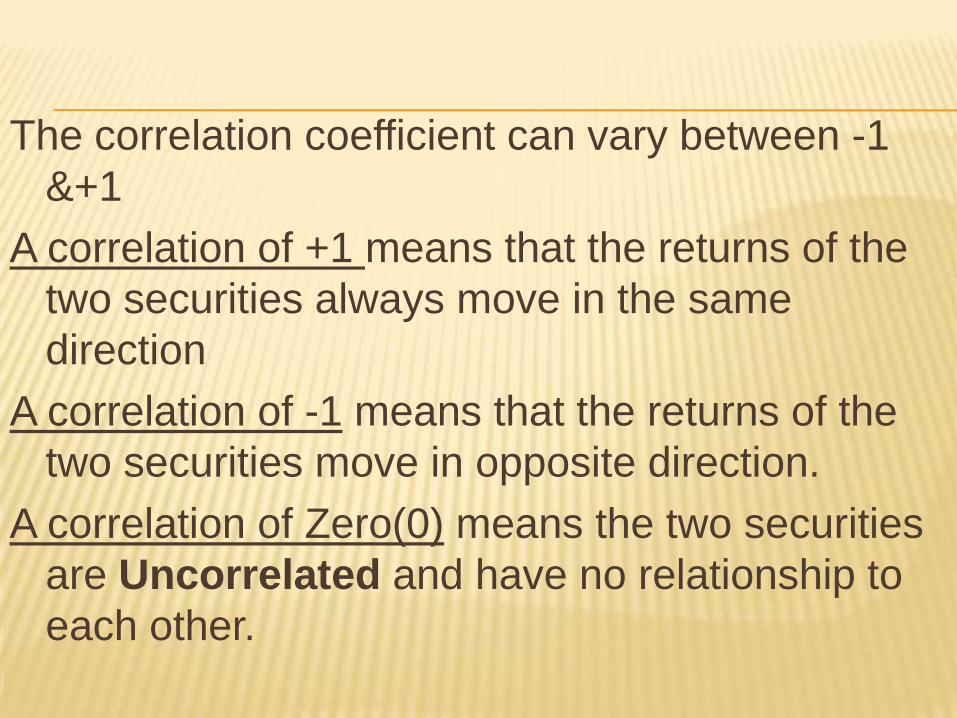
The correlation coefficient can vary between -1
&+1
A correlation of +1 means that the returns of the
two securities always move in the same
direction
A correlation of -1 means that the returns of the
two securities move in opposite direction.
A correlation of Zero(0) means the two securities
are Uncorrelated and have no relationship to
each other.
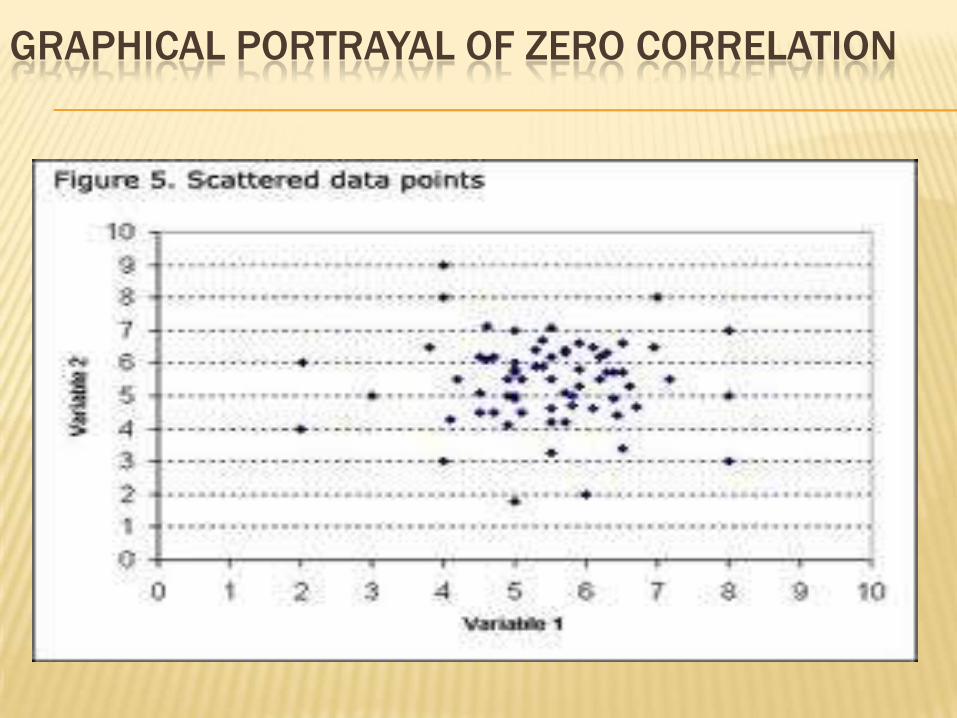
GRAPHICAL PORTRAYAL OF ZERO CORRELATION
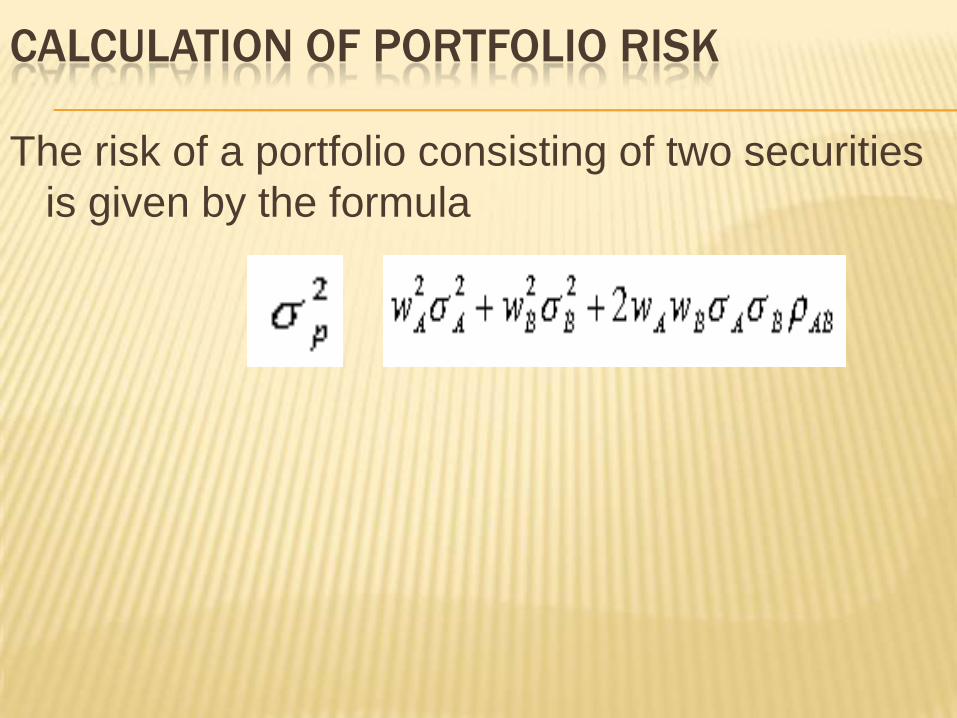
CALCULATION OF PORTFOLIO RISK
The risk of a portfolio consisting of two securities
is given by the formula
=
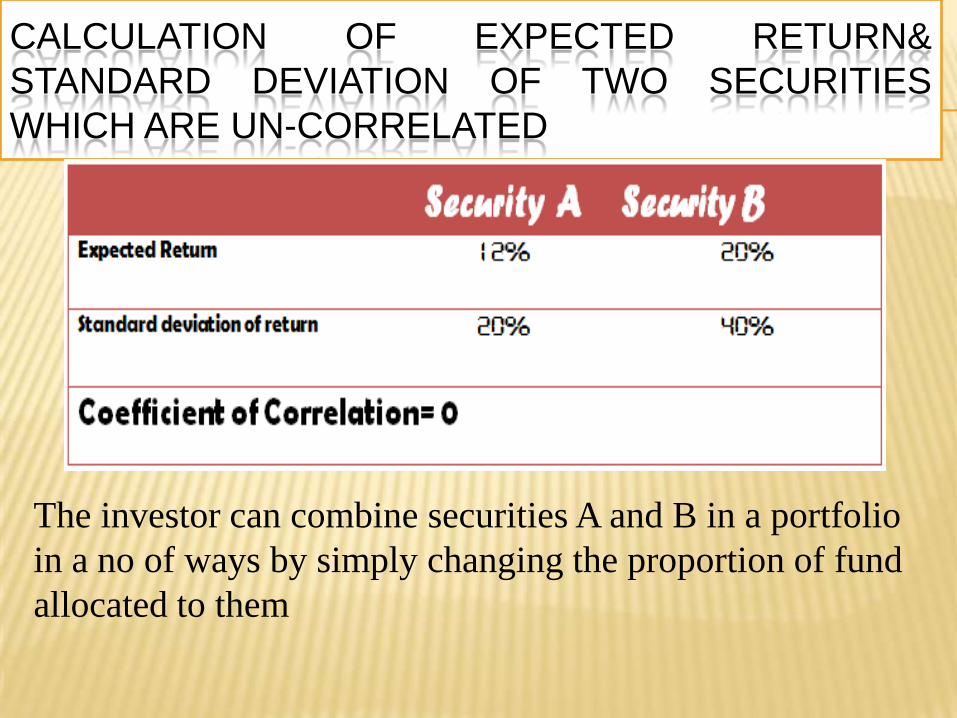
CALCULATION OF EXPECTED RETURN&
STANDARD DEVIATION OF TWO SECURITIES
WHICH ARE UN-CORRELATED
The investor can combine securities A and B in a portfolio
in a no of ways by simply changing the proportion of fund
allocated to them
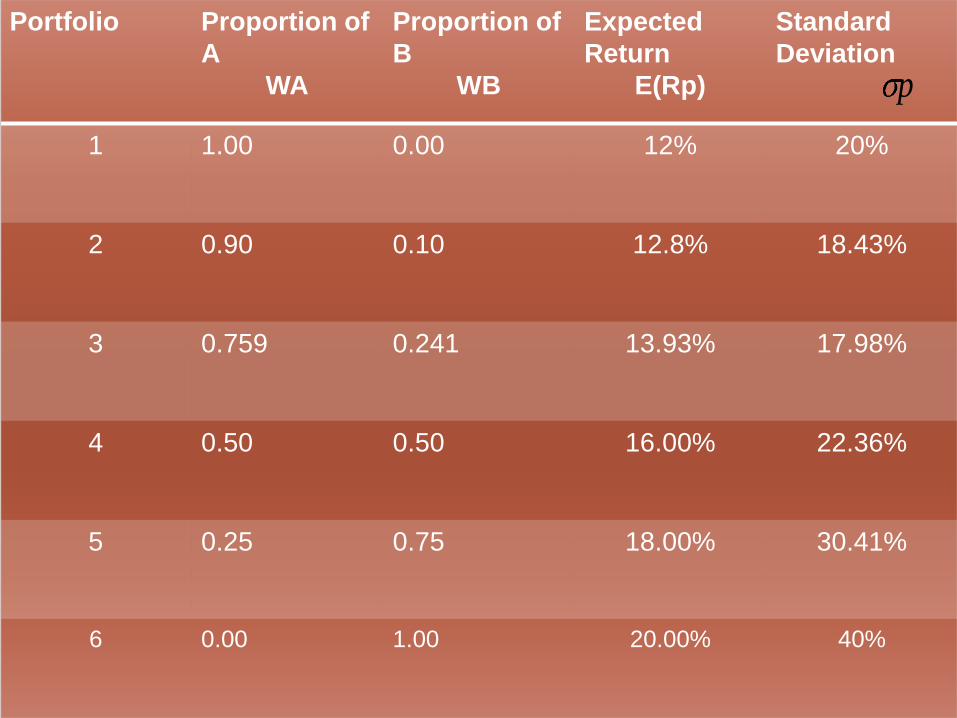
Portfolio Proportion of
A
WA
Proportion of
B
WB
Expected
Return
E(Rp)
Standard
Deviation
1 1.00 0.00 12% 20%
2 0.90 0.10 12.8% 18.43%
3 0.759 0.241 13.93% 17.98%
4 0.50 0.50 16.00% 22.36%
5 0.25 0.75 18.00% 30.41%
6 0.00 1.00 20.00% 40%
p
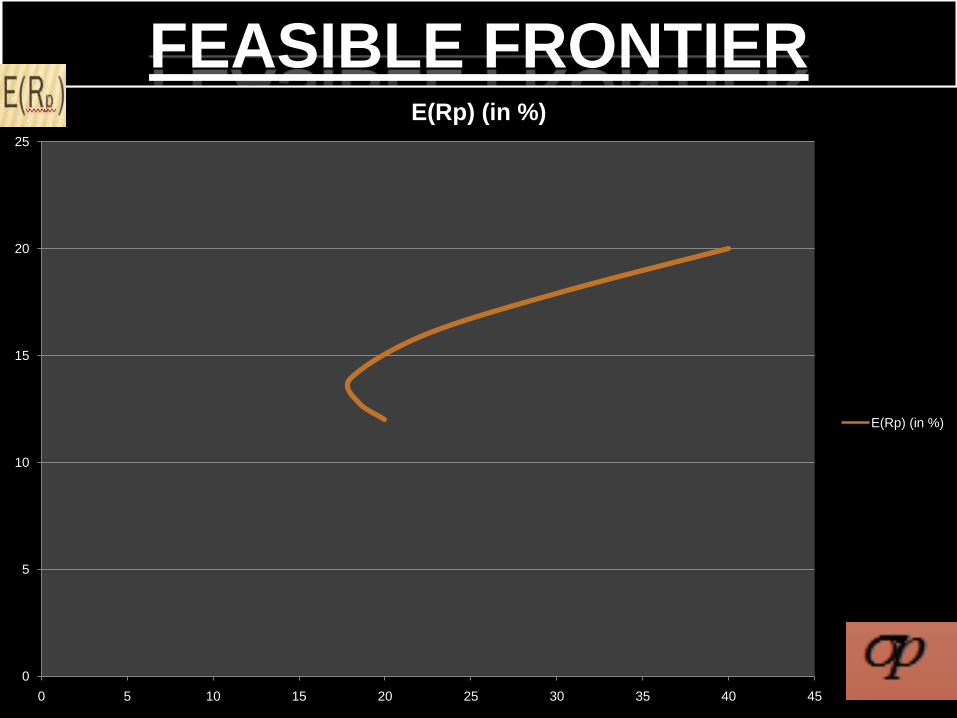
FEASIBLE FRONTIER
0
5
10
15
20
25
0 5 10 15 20 25 30 35 40 45
E(Rp) (in %)
E(Rp) (in %)
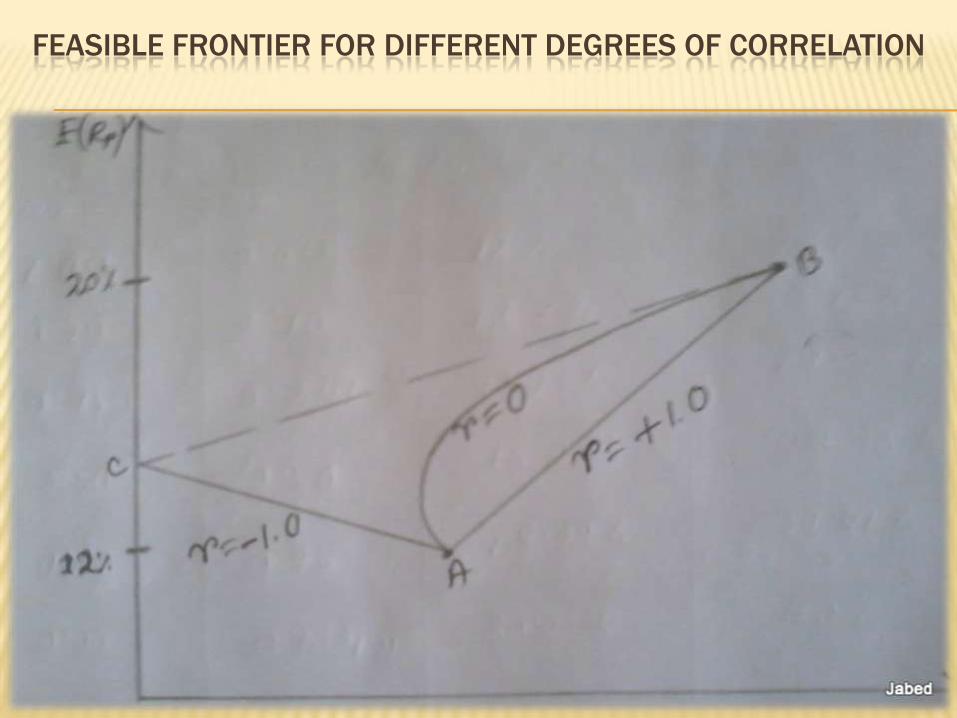
FEASIBLE FRONTIER FOR DIFFERENT DEGREES OF CORRELATION
For r=+1, diversification does not reduce risk.
For r=-1, diversification leads to reduction of risk
For r=0, i.e., when securities are un-
correlated, it indicates that they have no
measurable correlation in their price
movements.
C O N C L U S I O N
In practice, since no company is perfectly
isolated and independent from the global
economy, most companies stock prices are
some what correlated with the general
movement of the market