uncovering international migration flow data: insights ... · working papers paper 88, march 2014...
TRANSCRIPT

Working Papers
Paper 88, March 2014
Uncovering international migration flow data
Insights from the DEMIG databases
Simona Vezzoli, María Villares-Varela and Hein de Haas
DEMIG project paper 17
The research leading to these results is part of the
DEMIG project and has received funding from the
European Research Council under the European
Community’s Seventh Framework Programme
(FP7/2007-2013)/ERC Grant Agreement 240940.
www.migrationdeterminants.eu
This paper is published by the International Migration Institute (IMI), Oxford Department of International Development
(QEH), University of Oxford, 3 Mansfield Road, Oxford OX1 3TB, UK (www.imi.ox.ac.uk). IMI does not have an institutional
view and does not aim to present one. The views expressed in this document are those of its independent authors.
The IMI Working Papers Series
The International Migration Institute (IMI) has been publishing working papers since its foundation in
2006. The series presents current research in the field of international migration. The papers in this
series:
analyse migration as part of broader global change;
contribute to new theoretical approaches; and
advance understanding of the multi-level forces driving migration.
Abstract
This paper presents the features and potential uses of two new migration flow databases that were
compiled as part of the DEMIG (Determinants of International Migration) project from a wide range
of primary archival and digital sources. While DEMIG TOTAL reports total immigration, emigration
and net migration for up to 163 countries extending back from several decades to over one century;
DEMIG C2C (‘country-to-country’) covers bilateral migration flow data for 34 countries over the 1946-
2011 period. The paper also discusses the methodological considerations behind decisions on the
selection, compilation and categorisation of migration data in constructing the database. These
databases provide unprecedented coverage and detail in terms of flow data with historical depth, the
inclusion of several countries outside Europe and North America and gender breakdown. The paper
argues that, despite inevitable imperfections and inconsistencies, existing migration flow data is less
scarce and low-quality than is commonly assumed in the research literature, and that these databases
have considerable potential to contribute to a better understanding of the nature, determinants and
impacts of migration processes.
Keywords: migration data, data collection, data quality, international migration, DEMIG
Author: Simona Vezzoli, María Villares-Varela and Hein de Haas: International Migration Institute,
University of Oxford, [email protected]

Contents
1 Introduction ................................................................................................................ 4
2 Rationale and aims of the DEMIG migration databases ............................................... 6
2.1 Existing migration flow databases .............................................................................................................. 9
2.2 Aims of the DEMIG databases.................................................................................................................. 10
2.3 Availability of immigration and emigration data .................................................................................. 10
2.4 Disaggregation of the DEMIG data ......................................................................................................... 11
3 Accuracy and coherence of the data ......................................................................... 12
3.1 Variance in definitions and changing measurements .......................................................................... 12
3.2 Cross-country comparability .................................................................................................................... 14
3.3 Data accuracy and verification ................................................................................................................. 14
4 DEMIG Migration Flow Databases ............................................................................. 15
4.1 DEMIG total flows ....................................................................................................................................... 15
4.2 DEMIG C2C Flows ....................................................................................................................................... 16
5 The analytical potential of the DEMIG databases ...................................................... 23
5.1 Analysing historical migration trends ...................................................................................................... 23
5.2 Migration in non-OECD countries ........................................................................................................... 24
5.3 Gender ............................................................................................................................................................ 26
5.4 Constructing migration data using reverse flow data ........................................................................ 27
6 Conclusion ................................................................................................................. 28
References ................................................................................................................ 30
Appendix A ................................................................................................................ 32
Appendix B ................................................................................................................ 33
4 IMI Working Papers Series 2014, No. 88
1 Introduction
As part of the DEMIG (Determinants of International Migration) project two new migration flow
databases were developed from a wide range of primary archival and digital sources. This paper presents
the features and potential uses of these migration flow databases: DEMIG TOTAL, which reports total
immigration, emigration and net migration for up to 163 countries for long time periods; and DEMIG
C2C (‘country-to-country’), which covers bilateral migration flow data for 34 countries over the 1946-
2011 period. These databases have unprecedented detailed data with historical depth, the inclusion of
several non-OECD countries, and a gender breakdown.
The main reason for compiling these databases was to answer the central research questions of
the DEMIG project, although we argue that the data also has considerable potential for migration
research more generally. The DEMIG project aims to generate new theoretical and empirical insights
into the role of states and policies in migration processes, and their interaction with other receiving and
sending country migration determinants (see de Haas 2011). The effectiveness of migration policies has
remained a highly contested issue in policy and research, from those arguing that borders are largely
‘beyond control’ (Bhagwati 2003) to others stating that state policies have been largely effective.
However, as a consequence of conceptual and methodological shortcomings and data limitations, most
evidence has remained largely descriptive and biased. The DEMIG project aims to fill part of this gap
by addressing the following research question: how do states and migration policies of destination and
origin states affect the size, timing, duration, direction and composition of international migration?
DEMIG answers this question by embedding the systematic empirical analysis of policy effects
into a theoretical framework that conceptualises migration as an intrinsic part of broader processes of
development in destination and origin societies, which affect people’s capabilities and aspirations to
migrate in complex, non-linear ways. In order to guide the empirical analysis of policy effects, the
project hypothesised four ‘substitution effects’ that can limit or even undermine the effectiveness of
immigration restrictions:
1. spatial substitution through the diversion of migration to or via other countries;
2. categorical substitution through a reorientation towards other legal or illegal migration channels;
3. inter-temporal substitution affecting the timing of migration, such as ‘now or never migration’ and
‘beat-the-ban’ rushes in anticipation of future tightening of policies; and
4. reverse flow substitution if immigration restrictions reduce not only inflows but also return
migration, which can push migrants into permanent settlement and make the effects on net
immigration rather ambiguous (de Haas 2011).
The testing of these hypotheses requires a longitudinal, ‘double comparative’ approach. This
involves studying annual migration flows from multiple origin countries to multiple destination
countries over longer time periods. In doing so, this overcomes the single comparative bias of prior
research, which tends to study either the migration of several origin countries to one destination country,
or less frequently, the migration of one origin country to several destinations. The resulting lack of
‘cross-sectional’ variation across either origin or destination countries means that we are unable to
analyse simultaneously the effect of origin and destination factors on migration between countries (see
de Haas 2011). This requires the availability of bilateral (county-to-country) migration flow data
spanning several decades. Due to the limitations of existing databases in terms of historical coverage
(‘depth’) and country-coverage (‘breadth’), and the conviction that more migration data is available
than is commonly assumed, the DEMIG project compiled two new migration database from primary
sources.
IMI Working Papers Series 2014, No. 88 5
DEMIG C2C is a new bilateral (country-to-country) migration flow database compiled from a
wide range of archival and digital sources.1 The construction of this database took three years (2010-
2013) and involved a team of four people,2 who carried out activities ranging from extensive data
collection, documentation of data definitions, data digitalisation, various phases of data formatting and
verification, and additional archival collection to fill data gaps. The DEMIG C2C database contains
bilateral migration flow data from 1946 to 2011 mainly, for 29 OECD countries (with the exclusion of
Estonia, Ireland, Japan, Korea and Turkey), and the non-OECD countries of Argentina, Brazil,
Czechoslovakia (1950-1992), South Africa and Uruguay. Depending on the country and period, this
data is reported by country of birth, and residence and/or citizenship. Whenever available, the compiled
data has been disaggregated by gender, which is a unique feature of this database.
The DEMIG team also collected data on total immigration and emigration (DEMIG TOTAL),
because this data was readily available for several countries over long periods of time. Furthermore, the
compilation of this database would enable the analysis of country-level determinants of long-term
changes in immigration and emigration. The DEMIG TOTAL database compiles total immigration,
emigration and net migration for up to 163 countries covering various periods of time from the early
1800s to the present, disaggregating total flows of citizens and foreigners whenever possible.
To our knowledge, these two databases represent the most comprehensive collection of
international migration flow data to date. They have been compiled to be as comprehensive, internally
consistent, and comparable as possible so as to be valuable sources to advance analyses of migration
processes. In selecting and compiling the data, we used six data collection priorities:
1. To compile long-term series of migration flows, based on the assumption that the analysis of the
evolution of migration processes requires data spanning at least one to two generations
2. To gather data that follows the United Nations (UN) definition of long-term migration (12 months
or longer) as much as possible
3. To collect immigration and emigration data, to enable the analysis of separate effects of policies
on inflows and outflows, which are typically concealed in net flow data
4. To compile series for all available criteria (country of residence (COR), country of birth (COB)
and country of citizenship (COC)) to maximise transparency and flexibility of use
5. To collect data disaggregated by citizens and foreigners and by gender when available
6. To compile data by calendar year rather than fiscal year, which required the transformation of data
that was collected by fiscal year, as for Australia and New Zealand
In addition to migration data, testing the hypotheses on the effects of migration policies required
data on migration policies (Czaika and de Haas 2013). The DEMIG team therefore also compiled a
policy database (DEMIG POLICY) covering 45 countries (de Haas, Natter and Vezzoli 2014). This
database tracks significant migration policy changes, coding whether changes are in a more or less
restrictive direction, and differentiates between different policy areas, policy instruments and target
1 We thank Bart Loman, who explored migration data in a preparatory phase of this project. We also extent our appreciation
to Mr Ondrej Kosata at the Information Service Department of the Czech Statistical Office, Dr Robert Didham, Senior
Demographer at Statistics New Zealand, Dr Attila Melegh at The Institute for Advanced Study at the Central European
University in Hungary, and Ms Béatrice Tardif du Pouget at the Bibliothèque de l'Hôtel de Ville in France, who went above
and beyond their call of duty to provide extensive historical data, by taking time to look for data in old statistical yearbooks,
scanning large numbers of tables or even digitalizing the data themselves, or by digging into boxes buried under earthquake
rubble.
2 The team was led by Simona Vezzoli and María Villares-Varela and complemented by Olinka Caunerová and Anais
Resseguïer, to whom we are indebted for their committed work in the collection, digitization, formatting and verification of
data. We also extend our gratitude to Laura Wright-Robbins and Anne-Marie Jeannet for their valuable support in data
formatting and verification.
6 IMI Working Papers Series 2014, No. 88
groups covering the 1950-2010 period. In addition, the DEMIG team compiled a visa database (DEMIG
VISA), which is a global panel of bilateral travel visa requirements covering the 1973-2013 period (de
Haas and Villares-Varela forthcoming).
This paper presents the methodological considerations that supported the decisions on the
selection, compilation and categorisation of migration data included in DEMIG C2C and DEMIG
TOTAL. In brief, our experience has taught us that ‘data availability’ is a relative concept. Data often
exists in obscure and unknown locations or may be scattered over several locations globally (e.g. South
African yearbooks are found partially online, at the University of Oxford and at Stanford University in
California), making knowledge of and access to data largely dependent on the amount of financial and
human resources invested in its collection and compilation. This paper also illustrates the analytical
potential of the DEMIG databases, such as the ability to ‘reconstruct’ emigration from countries lacking
outflow data based on immigration data. This paper argues that, despite various imperfections and
inconsistencies, existing migration flow data is less scarce and low-quality than is commonly assumed
in the research literature, and that the DEMIG data has considerable potential to contribute to a better
understanding of the nature, determinants and impacts of migration processes.
The paper first explores the background and rationale behind the data collection process and
then turns to explore the availability, quality and accuracy of the collected data. Thirdly, the paper
presents the key features of the DEMIG TOTAL and DEMIG C2C databases. The final section of the
paper presents the analytical potential of these historical datasets with regards to their historical depth,
the inclusion of non-OECD countries, gender breakdown, and possibilities of constructing emigration
flows from immigration data.
2 Rationale and aims of the DEMIG migration databases
A common complaint in the migration research literature is that migration data is scarce and of low
quality. The scarcity argument generally concerns the lack of historical data and limited levels of
disaggregation along dimensions such as gender, age and education. The quality argument generally
refers to variations across countries in definitions of migrant categories, and measurement and data
collection methods, which limits the scope of international comparisons. There is a substantial literature
that reviews existing databases, their manifold inconsistencies, and suggests ways to increase coherence
of definitions and measurement to enhance international comparability of migration data (Center for
Global Develpment 2009; Gamlen 2010; Salt and Singleton 1994; Simmons 1987; UN DESA Statistics
Division 1998; UN DESA Statistics Division 2004; Zlotnik 1987).
In recent years, progress has been made improving stock data, particularly through the Sussex
Bilateral Migration Database, which covers global bilateral (country-to-country) migrant stock data for
the 2000 census round (Parsons et al. 2005); and the Global Bilateral Migration Database (GBMD) that
extended this database with data from the 1960, 1970, 1980 and 1990 census rounds (Özden et al. 2011).
This has radically increased our ability to understand global migration trends and patterns. There has
however, been less progress with regards to migration flow data.
The United Nations (UN) has put considerable effort into the harmonisation of migrant
definitions and the standardization of collection methods, such as by proposing a standard definition of
international migration and recommendations for data collection (Simmons 1987). Since 1953, the UN
Population Division has led in updating definitions and developing international standards for the
collection and the compilation of international migration statistics (UN DESA Statistics Division 1998).
In 2007, the Organization for Economic Co-operation and Development (OECD) proposed the
harmonisation of immigration data by utilising residence permit data rather population register data.

IMI Working Papers Series 2014, No. 88 7
Residence permits reduce discrepancies resulting from diverse durations of stay (since they tend to
apply for stays over a year), and have a lower tendency towards over-counting, which is characteristic
of data from population registers used in countries such as Germany and the Netherlands. However, the
use of residence permit data precludes the measurement of emigration. Moreover, since residence
permit data often include post-entry changes of status, these data may not accurately represent
movements (Kupiszewska and Kupiszewski 2011).
In Europe, efforts to either coordinate data standards or harmonise existing data have occurred
under the framework of projects such as PROMINSTAT (Promoting Comparative Quantitative
Research in the Field of Migration and Integration in Europe) (Kraler and Rachel 2010), ILMAS
(Implementation of Legislation of migration and asylum statistics) and THESIM (Towards Harmonized
Statistics on International Migration) (Poulain and Singleton 2006). These projects assess data
availability and identify the steps needed to meet the standards set by the European Union such as the
2007 EC regulation, which requires each EU Member State provide data on migration inflows and
outflow by citizenship and country of birth, and defines migration as the establishment of residence for
at least 12 months (Center for Global Development 2009).3
In practice however, it has proven very difficult to improve the availability, quality,
standardisation and harmonisation of migration flow data. This is particularly related to the difficulties
in introducing institutional and bureaucratic changes in established data collection systems (Herrera and
Kapur 2007). Data collection is not a neutral exercise, but reflects national ideology, policy priorities,
limited institutional capacities and bureaucratic traditions, which are often resistant to changes imposed
by international bodies such as the UN, OECD or EUROSTAT. While it is commendable to continue
trying to improve comparability of international migration data, it seems unlikely that total
standardisation and harmonisation will ever be achieved. Nevertheless, Skeldon (2012) argues that
efforts should to improve data collection systems should continue, particularly population censuses. By
including questions on last place of permanent residence, international migration data could see
improvements as significant as those for internal migration data in some countries since the 1960s.
Because no ‘one-size-fits-all’ collection method is likely to emerge in the foreseeable future (if ever),
it seems wise to follow the ‘second best’ strategy by making the best use of available data (Skeldon
2012).
These obstacles have caused some researchers and institutions to concentrate on improving the
comparability and standardisation of existing data (Kelly 1987; Kupiszewska and Nowok 2005;
Lemaitre 2005; Lemaitre et al. 2007). The MIMOSA project (Migration Modelling for Statistical
Analyses) (Raymer and Abel 2008) funded by Eurostat, aimed at producing comparable estimates of
European migration flows and migrants populations (‘stocks’) by adjusting national data to meet the
common definitions contained in the new European regulation on migration statistics, and to estimate
missing data by combining data from different sources and using expert opinion. MIMOSA generated
estimates for the years 2002-2007 for flows (by origin/destination, citizenship, country of birth as well
as by sex and age) and stocks (by citizenship, country of birth as well as sex and age).4
Following a similar logic, the Integrated Modelling of European Migration (IMEM) project
aimed to harmonise international migration data collected by countries using different collection
systems and designs that resulted in the undercount and inaccuracy of data. In order to overcome this,
IMEM applied a Bayesian statistical model to statistically estimate international migration flows among
3 Regulation (EC) No 862/2008 of the European Parliament and the Council of 11 July 2007, available at http://eur-
lex.europa.eu/LexUriServ/LexUriServ.do?uri=OJ:L:2007:199:0023:0029:EN:PDF, retrieved on 15 November 2013.
4 See http://mimosa.gedap.be/, retrieved on 8 December 2013.

8 IMI Working Papers Series 2014, No. 88
31 European countries from 2002 to 2008 using Eurostat data (Raymer et al. 2013). Such statistical
methods to harmonise existing data have considerable potential, although they have so far covered only
European countries and time periods too short to investigate the long-term evolution of migration
processes. Moreover, the outcomes are obviously sensitive to the assumptions embedded in the
parameter specification of the estimation models (Kupiszewska and Kupiszewski 2011). Particularly
with regards to estimates of missing data, this can raise doubts about their usefulness to measure the
effects of migration policies, as such analyses require an accurate view in year-to-year changes.
These valuable efforts at harmonizing existing databases should not divert attention from
compiling comprehensive migration flow databases with the sufficient historical ‘depth’ and cross-
country ‘breadth’ necessary for a better understanding of migration processes. Unfortunately, the
awareness of, and debate around, the limited availability and quality of migration data seems to have
stunted efforts to compile migration flow data, particularly more historic flows. Based on our experience
compiling the DEMIG databases, we argue that migration scholarship has overstated this point. Despite
the existence of considerable data gaps and valid quality concerns, there is more data available than is
commonly thought. While the quality varies, we argue that much data is reliable and consistent enough
to render it suitable for descriptive and inferential analyses of international migration patterns.
Our position is that the awareness of data limitations should not deter researchers from making
the best use of existing data. The approach taken in DEMIG has been to critically assess the quality of
existing subsets of historical data, and include the best available data in an effort to construct a large
historical (‘longitudinal’) database. The DEMIG rationale echoes calls by Salt and Singleton (1994)
and more recently by Skeldon (2012) that researchers not use data comparability problems as a reason
‘to throw in the towel’ and not use data at all. In many ways, it seems an illusion that perfectly
comparable migration data will ever emerge because of structural and persistent cross-country
differences in collection methods, definition and data priorities. Furthermore, historic data will not
change. So, in many ways, the ‘second-best’ strategy is to collect as much of the migration data that has
been compiled by various national statistical offices over the years as possible, and increase our
understanding about the way they were collected, so we can deal with any imperfections in the best
possible way.
Within DEMIG, we have therefore made a conscious decision to include data as reported by
the national sources, and not adjusted or altered it – with the exception of converting data into calendar
years if the original data was reported by fiscal year. We only included data as reported by national
statistical offices and refrained from any calculations to fill gaps or make it more comparable. With this
approach, we aim to maximise transparency and allow for any later harmonisation and gap filling using
statistical techniques at the discretion of researchers, without us making a priori choices about which
data is the most suitable. Through this data collection effort we have uncovered large amounts of
immigration, emigration and net migration data for a range of countries covering time periods going
back several decades (sometimes to 1946) that have remained unpublished or inaccessible thus far. We
also carefully recorded data sources, specificities and data quality issues in individual country notes
included in the DEMIG C2C Metadata document.5 This document also reports definitions over the
years, changes in data collection methods, coverage of foreigners and/or citizens and other relevant
details. The information provided serves to make users aware of what the data represents and whether
there are any potential comparability problems.
5 This document accompanies the release of the DEMIG C2C database and will be available online at
www.migrationdeterminants.eu in mid-2014.

IMI Working Papers Series 2014, No. 88 9
Notwithstanding this ‘eclectic’ nature of the DEMIG databases, we have put considerable effort
into maximising data quality in the construction of the databases. In this context, data quality is
conceived not solely as data accuracy, such as minimising the number of errors (e.g., typos) in the data
that we digitalised, but also includes careful considerations of quality along the following dimensions:
variance in definitions; changing measurements; accuracy of the data; comprehensiveness; and cross-
country comparability. The following sections further discuss data availability and data quality.
2.1 Existing migration flow databases
The aim of DEMIG is to compile bilateral and total migration flow data for periods spanning over
several decades to enable long-term analysis of the role of states and policies in migration processes
and their interaction with other migration determinants. For total migration flows, we collected data for
the longest possible time frame, with some data going back to the 1800s. We limited the bilateral data
collection to the post-WWII period for pragmatic and more substantive reasons. First, the 1950-2010
period is the primary focus of the DEMIG project. Second, WWII marked a structural break in terms of
population movements due to war displacement and post-war reconstruction, but also heralded a new
era of European decolonisation, the gradual end of large-scale European migrations to the Americas,
Australia, New Zealand, South Africa and elsewhere, and increasing migration towards Europe. This
period also coincided with an increased interest among states to record emigration and, particularly,
immigration.
Existing databases that report migration for OECD countries have some limitations. The
Population Division of the United Nations (UNPD), Department of Economic and Social Affairs,
estimates net migration rates for 1950-2010 in its World Population Prospects: The 2012 Revision for
each five-year period.6 These estimates have been calculated using a range of data and methods, from
net migration estimates derived from population growth, birth and mortality rates (the demographic
‘residual method’) to the use of survey data and migration data from border statistics and other sources.
This information is available for each country in the meta-information section.7
The UNPD also compiled the International Migration Flows to and from Selected Countries
database in three versions released in 2005, 2008 and 2010.8 The 2010 version contains data for 43
countries, including Baltic countries and some Commonwealth of Independent States (CIS) countries.
The 2010 version breaksdown migration data using country of birth, country of citizenship and country
of residence criteria (when available) for citizens and foreigners (when available). The data however,
is not broken down by gender and the historical depth for most countries is limited. The data series
starts between 1946 and 1969 for 8 countries, between 1970 and 1989 for 9 countries, but for 26 out of
the 43 countries, the data series only starts in the 1990s and 2000s.
The OECD also publishes migration flow data as part of their ‘International Migration Data’ in
OECD.StaExtract Database and migration flow data for the 34 OECD countries using statistics reported
by national correspondents. These data however, only cover movement of foreigners (and not citizens)
for the 2000-2011 period. EUROSTAT9 compiles total flow data for EU member states from 1998, and
does not manipulate or harmonise the data. EUROSTAT only compiles data member states provide
6 Available at http://esa.un.org/unpd/wpp/Excel-Data/migration.htm, retrieved on 30 January 2014.
7 Metadata file and Interactive on-line web query available at http://esa.un.org/wpp/Excel-Data/data-sources.htm, retrieved on
November 18, 2013. 8 The 2010 version is available online at http://esa.un.org/MigFlows/MigrationFlows.aspx, retrieved on July 15, 2012.
9 Data for Eurostat are available at http://epp.eurostat.ec.europa.eu/portal/page/portal/population/data/database; retrieved 1
December 2013.
10 IMI Working Papers Series 2014, No. 88
through their national statistical offices. Despite the value of this database containing raw data for all
EU member states broken down by gender, the historical depth of this data is limited.
2.2 Aims of the DEMIG databases
As part of its ambition to extend the country and historical coverage of existing migration databases,
DEMIG aims to bring together data from a wide variety of primary national sources to achieve longer
time series, a wider country coverage and breakdown by gender, as well as series by country of
residence (COR), citizenship (COC) and birth (COB). A pilot study in 2005 by one of the authors at the
Radboud University Nijmegen, the Netherlands,10 identified the existence of detailed historical flow
data for several European countries, and found that historical data is not generally available digitally,
except in a few countries.
Most historical migration flow data is only accessible from dispersed resources such as
yearbooks and archival records of statistical bureaus and ministries, or scattered, often unofficial,
publications such as theses and reports. Another obstacle in uncovering data is the limited ‘institutional
memory’ of statistical offices: sometimes data turns out to be available in the form of old reports and
papers, of which people working for statistical offices are unaware. In brief, although historical
migration data does exist, it became clear that significant resources are required to discover, uncover
and compile such data. The compilation of a comprehensive database with pre-1980 migration data for
a large number of countries requires an extensive data collection, processing and verification strategy,
with a long time frame for completion. Moreover, this approach cannot limit itself to countries with
historical statistical tables in English and French, and requires the interpretation of data available in
languages such as Czech, Italian, Polish, Spanish and Portuguese. DEMIG provided the necessary
resources to conduct such exercise.
A major decision of DEMIG was to build a database from scratch by drawing on primary
national data sources. An initial review of the existing OECD and UN Population Division databases
revealed discrepancies between data they reported and the official national statistical office figures. In
some instances, even if the description of the data was very similar for both databases, the figures did
not bear any resemblance. The inability to explain these differences and lack of clarity on any data
transformations or adaptations that may have been made in compiling those databases, meant we
decided to collect data directly from primary sources published by and on behalf of national statistical
offices in the form of annual statistical, demographic and migration yearbooks located in libraries and
international institutions. This exercise showed that often data availability was not a problem per se as
we found more data than expected throughout the process. In fact, the deeper we dug the more data we
found, suggesting that the main barriers remain human resources and time.
2.3 Availability of immigration and emigration data
Accessing data from national statistical offices and archives required considerable human resources to
develop personal contacts, locate dispersed data sources, identify complete series, and clarify
definitions. Nevertheless, these primary sources were considered the ‘safest’ for two reasons. First, they
have been subjected to less adjustment than existing databases, where entries often deviate from the
data reported by national sources. Such adjustments may have been done to harmonise data or
10 This pilot project was part of a postdoctoral grant by the Netherlands Foundation for the Advancement of Tropical Research
(WOTRO) of the Netherlands Organisation for Scientific Research (NWO) (grant number W 53-331) awarded to Hein de
Haas for the project “Migration and Development Revisited.: The impact of international migration on development in migrant
sending areas of the southern and eastern Mediterranean (Morocco, Tunisia, Egypt, Turkey): A comparative study.
IMI Working Papers Series 2014, No. 88 11
definitions, but a lack of transparency in the methods used for making such adjustments was found.
Second, primary national sources frequently provide information on definitions and data collection
methods, which we recorded in detail for each country and period in the DEMIG C2C metadata
document. This enabled us to track any data adjustments in subsequent yearbooks through the data
collection process.
Our experience also challenged common ideas that data are only available for wealthy,
democratic countries, or that their data quality is superior to data from so-called ‘developing’ countries.
On the one hand, governments of poorer countries often have weaker institutions and limited capacities
to collect extensive migration data however, other factors such as the levels of professionalism in
statistical offices (Herrera and Kapur 2007), institutional traditions, and the importance governments
attach to migration also affect the availability and quality of immigration and emigration data. For
instance, ‘developing countries’ such as South Africa and Brazil have detailed immigration and
emigration records dating back to the 1960s and 1940s, respectively. This institutional capacity possibly
reflects their colonial history and the continuation of institutional traditions. In spite of their wealth and
governmental capacity, the United States and Canada do not record immigration of citizens. The US,
Canada and France do not record emigration records at all. This may reflect their tradition as
immigration countries and the concomitant lack of interest in who is leaving.
Strong registration of emigration seems a particular feature of authoritarian states (Vezzoli and
Villares-Varela, forthcoming). Countries that experienced fascist regimes, such as Italy and Spain, had
strong emigration records (Ipsen, 1993). This reflects the preoccupation with controlling people leaving
the country and the level of emigration needed by the state. For instance, Spanish emigration
measurement between the 1940s to the 1980s is very detailed both in terms of volumes and levels of
disaggregation (gender, age, region of origin, marital status, level of education, occupation), but poorly
tracked between democracy in 1975 and modernisation of the system in the early 2000s. Greek data
between the early 1930s and 1977 provided great detail, including professions of emigrants and
immigrants. The restoration of democracy in 1974 along with decreased volume and importance of
emigration may explain its poor tracking in later years. While the Spanish and Greek data was publicly
released in annual statistical yearbooks, some autocratic states, such as in the Gulf region, may collect
detailed information on emigration and immigration but hold the data as confidential within the state
apparatus, never publically releasing it.
2.4 Disaggregation of the DEMIG data
Given the variability of and changes in the type of data reported by the different countries over time,
DEMIG aimed to achieve the highest level of comprehensiveness according to criterion and coverage.
We compiled bilateral migration flow data by country of residence (COR); citizenship (COC); and birth
(COB) (criterion), as well as flows of both citizens and foreigners (coverage) for each reporting country.
Not all countries disaggregate data along these dimensions, but when available, this allows the user to
analyse the mobility patterns of citizens separately from those of foreign citizens, to study return
patterns of citizens, as well as step-wise migration of foreign citizens. The DEMIG C2C database
includes a comprehensive gender disaggregation as this was frequently reported in historical statistical
yearbooks.
Bilateral migration flow data differ considerably in terms of the number of countries (of
origin/destination, birth and citizenship) they include in their breakdowns. Some countries, like the UK,
hardly register migration flows according to origin and destination country; while other countries, such
as Germany, report full breakdowns by all countries in the world over several decades. Most reporting
countries are situated somewhere in-between these two extremes, and the level of breakdown has
12 IMI Working Papers Series 2014, No. 88
generally improved in recent decades. Reporting countries tend to specify bilateral migration flows to
and from major destination and origin countries, such as Algerians to France, Congolese to Belgium,
or Turks to the Netherlands, but lump together smaller flows into regional or sub-regional categories.
Sometimes, very small flows are not published as they may violate the privacy of the migrants
concerned. This grouping results in residual regional categories such as ‘other Africa’ or ‘other Asia’.
Finally, some countries publish residual categories for political entities that are meaningful only in
specific contexts, such as ‘Other Commonwealth’ used by the UK and Australia.
Most reporting countries provide regional aggregates on a continental level over long time
periods. These regional aggregates are included in the DEMIG C2C database. However, regional
aggregates should only be used when country-level breakdowns are unavailable, as regional and sub-
regional definitions may reflect political, historical and ideological positions of the reporting state. For
example, whether countries such as USSR, Turkey or Cyprus are included in Europe or in Asia varies
across countries and may change over time. Moreover, it is not always possible to identify the countries
included in the regional aggregates or to ensure these categories are constant over time. To maximise
comparability, the DEMIG C2C reports each country individually, by region and sub-region in a
standardised manner. Through this consistent regional coding, the data provides valuable insights into
regional compositions of immigration and emigration flows. For instance, the data can show how many
immigrants came to and from European countries were born in, citizens of, or migrating from or to
Europe, Africa, Asia and the Americas. This provides a valuable intermediate level of analysis between
the national and the global level.
Most reporting countries provide migration data for locations that do not or no longer constitute
an administrative entity included in the UN list of recognised countries. Thus, Madeira, the Canary
Islands, Gdansk, Curaçao and the Ryukyu Islands, among many others, are reported in the DEMIG C2C
database as residuals (coded as ‘other’), and are included in the flows of the larger state entity to which
they belong. For instance, the Azores and Madeira were included in Portugal. The historical coverage
of the DEMIG databases also required reporting data for major countries that no longer exist, such as
the German Democratic Republic, the German Federal Republic, Czechoslovakia, Serbia and
Montenegro, Yugoslavia, USSR, and South and North Yemen, which are included in our country list.
3 Accuracy and coherence of the data
Ambiguity of definitions and measurement changes of categories, methods of collection, coverage of
citizens and foreigners, and type of migration by duration-of-stay can cause inconsistencies and errors,
even for data of the same reporting country. While this does not necessarily make this data unsuitable
for analysis of long-term patterns and trends of migration within and across countries, it does show the
importance of caution when using and interpreting such data. Understanding the accuracy,
(in)consistency and coherence of migration data across countries allows informed decisions on which
data are best suited for particular cross-country analyses.
3.1 Variance in definitions and changing measurements
While compiling the DEMIG databases, we identified four types of inconsistencies that may adversely
affect migration data: shifts in data collection methods; changing definitions; unclear metadata
information; and artificial variations in immigration numbers as a result of exceptional policy
interventions such as regularisations or amnesties.
An example of shifts in data collection methods, is the switch from border statistics recording
the entry of people intending to immigrate to population registers that count people staying over certain
IMI Working Papers Series 2014, No. 88 13
time period as immigrants. Such a shift usually results in sudden shifts in numbers and trend breaches,
and is a potential source of internal inconsistency within longitudinal series for one country. Argentina
and Brazil for instance, shifted from border crossing statistics to resident permit statistics as the basis
of measuring immigration.
When countries change definitions and reporting criteria, it may also create artificial
changes in migrant numbers (Herrera and Kapur 2007). Luxembourg for instance, switched from
measuring migration flows based on country of residence to country of citizenship in 1987. This
produces internal inconsistencies when the ‘old’ collection method and reporting data is typically
abandoned. This cannot easily be solved, but if data users are aware they can account for such changes
when analysing and interpreting data.11
Thirdly, challenges occur when official government statistics fail to detail collection methods,
definitions of migrant categories and which migrant groups are included in their data. This includes not
specifying the duration-of-stay benchmark used to define who is considered a migrant, or whether
groups such as citizens, asylum seekers and/or refugees are included in the data. This may reflect a lack
of interest, insufficient resources, or limited technical capability to collect and store certain data (Salt
and Singleton 1994, citing UNHCR 1992).
The final source of inconsistency is introduced by large-scale regularisation programmes such
as the United States’ 1986 Immigration Reform and Control Act (IRCA) and for recently regularised
populations in countries such as Argentina, Brazil, and Italy. Amnesties and regularisation programmes
present a problem as they tend to break the continuity of data (Salt and Singleton 1994), and generate
sudden immigration peaks that reflect the shift from unauthorised to legal migration status, rather than
the actual movement of people. Thus, data that include regularisations should be used with caution, and
such information should be carefully recorded so that researchers can take account of this in their
analysis and interpretation of data.
It is important to note that inconsistency issues are not unique to migration data. Migration data
is commonly assumed to be low-quality, but it is questionable whether it is of any lower quality than
many economic data, which are widely used in longitudinal and cross-country analyses. Attempts to
standardise collection methods and definitions of economic data have also been problematic. Srinivasan
(1994) identified anomalies that arise because data must be calculated from indirect estimations (e.g.
national direct gross investment) and as part of the process of computing comparable statistics such as
GNP and other development indicators published by UNDP and the World Bank. Chamie (1994)
demonstrated that even demographic data, which seem relatively unambiguous, such as population size,
life expectancy at birth and infant mortality, also suffer from inconsistent definitions and diverse
collection methods. This is not to say that concerns about migration data are invalid, but these problems
apply to virtually all macro-level data.
Data collection practices often differ across countries, making changes difficult to implement
because of institutional traditions and governments perceiving that their methods function appropriately
and meet national interests (Lemaitre 2005). National statistical offices may also lack budget or
institutional capacity, and have few incentives to sustain and improve data collection and publication
(Chamie 1994; Herrera and Kapur 2007).
Such problems cannot easily be overcome, making it critical to maintain detailed records of the
differences and changes in definitions and data collection methods. Furthermore, to carefully track
11 For instance, in statistical analyses, this could be a reason to include particular dummy variables that capture
such shifts in measurement methods.
14 IMI Working Papers Series 2014, No. 88
potential sources of internal consistency and limited comparability instead of concealing them. During
DEMIG data collection, definitions and data characteristics were carefully tracked, recorded and made
available to the users in the DEMIG C2C metadata document to help data users understand sudden and
unattended changes in trends. Whenever possible, we consulted multiple data sources published by
national statistical offices to uncover definitions, criteria (birth, citizenship and/or residence), coverage
(citizens/foreigners), method of collection, and evaluate data consistency.
3.2 Cross-country comparability
Instead of adjusting data in an effort to harmonise data across countries (which would involve using
rather arbitrary criteria), we compiled data as reported, and provided the full details on measurement,
definitions and groups included to allow researchers to assess the cross-country comparability of data
and make their own decisions on what to use.
Comparability problems also arise from inconsistencies between the number of international
migrants measured by country of origin and destination, which is analogous to problems with trade and
other bilateral flow data. Countries tend to report immigration data more consistently than emigration
data, which is often underestimated depending on the collection method. For example, for population
registers the incentives to de-register are much lower than to register, which is usually a requirement to
access labour markets and public services such as health care and education. Those who left may have
an incentive to stay registered to preserve their residence and other rights.
To test the comparability of immigration data reported by destination countries and emigration
data reported by origin countries, Kelly (1987) compared figures of inflows with outflows between pairs
of countries. He found that when national statistical offices were able to adjust the measurement of
migration flow data to fit the UN definition of long-term immigrants and emigrations (12 months), the
gaps between reported inflows and outflows were reduced. The results of this adjustment process by
the statistical offices were promising as data improvement was achieved without making any changes
to data collection systems.
By comparing immigration data reported by destination countries and the corresponding
emigration data reported by the origin country for five European countries that use population registers
to collect their data (see Appendix A), we observe persistent gaps between of inflows reported by
destination countries and outflows from origin countries. While we confirm the advice to data users that
immigration data are generally more reliable, this should not be done blindly, and decisions on data
should be based on the specific countries and periods analysed.
3.3 Data accuracy and verification
Accuracy is avoiding errors in the process of data collecting, categorising, and the digitalisation of data.
Errors include typos and incorrect placement of values in tables (Batini and Scannapieca 2006; Herrera
and Kapur 2007). We uncovered and noted typos and calculation errors made by historical tables
through spotting mismatches between totals reported on paper and our calculations. Moreover, we were
aware that the digitalisation process (scanning of tables and converting into software such as Microsoft
Excel) may generate typos or misplacement of values. The accuracy of data in the DEMIG databases
was closely monitored through a set of procedures to guarantee systematic data examination, data entry,
formatting and several verification rounds as specified in this section. These verification rounds have
been implemented regardless of whether data originated from historical tables on paper, national micro-
fiches of individual movements, or electronic files.

IMI Working Papers Series 2014, No. 88 15
For historical data from sources such as statistical yearbooks, data entry was followed by an
initial verification, which reviewed the type of data reported, compared it with previous series, and
ensured consistency in definitions. Once this was completed, the data was formatted to fit country-based
longitudinal spreadsheets that listed the DEMIG standard list of origin and destination countries. Any
country not recognised in this list was moved to a residual category. Residuals were coded according
to regional and sub-regional membership. After this, a second round of data verification took place,
which included several steps:
Verification of several complete years (verification of all individual cells) for manually entered
data, and random checking (one every two years of data for electronic data) of the data by
comparing reported totals and calculated totals.
Verification of the calculation of the totals (male + female data) to ensure that male plus female
was equal to the reported total. Any diversions were investigated.
Verification of the total immigration and emigration for each year (total by year in the columns),
by adding all origin and destination country-level data plus any residuals and investigating any
discrepancies found between the calculated and reported totals.
Verification of the total immigration and emigration by country of origin and destination for all
years (totals by country by rows) by adding all origin and destination country-level data and
investigating any discrepancies found between the calculated and reported totals.
Elaboration of graphs to plot the immigration and emigration trends to ensure that any gap in data
and sudden shifts in patterns were actual and not due to data entry and formatting errors.
Verification that if data was broken down by citizens and foreigners (when available), the
aggregation of these two databases would equal the reported total flows.
Verification that reported net migration equalled calculated net migration.
Verification that the total immigration, emigration and net migration matched across data reported,
whether by country-of-residence, country-of-birth or country-of-citizenship.
The process of comparing totals, aggregates and gender breakdowns allowed us to spot
inaccuracies in calculations by the statistical offices (for example, if reported totals did not equal the
sum of flows from/to all individual origins/destinations). In this way, we were often able to correct
errors of problematic reported values that would otherwise have decreased the consistency of the data.
This process was almost always carried out by a team of two people to enhance the likelihood that errors
would be identified.
4 DEMIG Migration Flow Databases
This section describes the reporting country coverage and historical depth of the DEMIG C2C and
DEMIG TOTAL databases. This is followed by a more detailed description of the contents of the
DEMIG C2C database with regards to criterion (country of residence, citizenship and/or birth);
coverage (foreigners, citizens or both); collection methods; length of stay; and gender.
4.1 DEMIG total flows12
Total migration flows have been collected and published since the early 1800s, particularly in countries
where immigration and emigration have occupied an important political and economic space. This
includes classical countries of European settlement such as Brazil (1820–), Canada (1827–), New
12 This description refers to DEMIG TOTAL version 1.4 and DEMIG C2C version 1.0, as of December 2013.

16 IMI Working Papers Series 2014, No. 88
Zealand (1853–), the United States (1820–) and Uruguay (1867–), as well as countries with historically
important emigration traditions such as Germany (1820–), Greece (1824–), Italy (1869–), the
Netherlands (1843–), Norway (1836–), Spain (1900–) and the UK (1815–). In its current version,
DEMIG TOTAL includes total flow data for 163 countries, although each individual year has less than
163 countries as many series are not continuous.
Figure 1 shows the number of reporting countries in DEMIG TOTAL that collected and
published total migration flow data augment over time with a first gradual increase in the 1910s and
then a rapid growth in the post-World War II period. The increase in countries reporting immigration
between 1914 and 1940 seems to reflect the growing political salience of immigration and the
concomitant introduction of modern immigration and passport regimes. This also coincided with an
overall trend toward protectionism after the end of the ‘first era of globalisation’ between 1880 and
1914, during which more liberal attitudes towards migration prevailed. Another interesting observation
is that in the period from 1814–1940, the number of countries reporting emigration data was always
higher than the number of countries reporting immigration data. Although the difference is minor, it
may reflect the preoccupation of states with emigration in a period when European countries were
mainly countries of emigration and often involved in planned and ‘assisted’ emigration programmes.
Figure 1 also shows that availability of total immigration and emigration numbers vary
considerably through time. Reporting of net migration13 was high between the 1960s and 1990s, when
several countries made these numbers available in the UN Demographic Yearbooks and in the
demographic reports of the Council of Europe.14
Figure 1 Number of countries reporting total flows by type of flow, 1815-2011
Source: DEMIG TOTAL database
4.2 DEMIG C2C Flows
4.2.1 Reporting countries and historical depth
The DEMIG C2C database includes 34 reporting countries, predominantly OECD countries with a
limited number of non-OECD countries such as South Africa and South American countries. Bilateral
13 Net migration is either calculated from the difference between total emigration and total immigration data or
calculated based on demographic residuals from demographic accounting through the use of birth and death rates
and population growth data.
14 Council of Europe, Recent demographic developments in Europe 1996 and 1997. The spikes registered for net
migration flows between 1960 and 1980 are the result of 5-year interval data for a number of countries.
0
10
20
30
40
50
60
70
18
15
18
23
18
31
18
39
18
47
18
55
18
63
18
71
18
79
18
87
18
95
19
03
19
11
19
19
19
27
19
35
19
43
19
51
19
59
19
67
19
75
19
83
19
91
19
99
20
07
Inflows
Outflows
Net Flows
IMI Working Papers Series 2014, No. 88 17
migration flow data are available for the majority of the reporting countries from the 1940s or the 1950s
(see Table 1). This enables longitudinal analyses and cross-country comparisons with an average of 90
countries of origin/destination/citizenship/birth times 50 years. Series are not always continuous as
there are occasional gaps in the reported years: see appendix B for further details.
Table 1 Reporting countries and earliest decade of data availability
1940s 1950s 1960s 1970s and 1980s 1990s 2000s
Argentina
Australia
Belgium
Brazil
Denmark
Greece
Netherlands
Portugal
South Africa
Spain
United States
Canada
Czechoslovakia
Czech Republic
Germany
Israel
Italy
Luxembourg
Mexico
New Zealand
Norway
Slovakia
Sweden
Finland
France
Iceland
Poland
United Kingdom
Hungary
Slovenia
Austria
Chile
Uruguay
Republic of Korea
4.2.2 Reporting criterion: citizenship, birth and residency
The reporting criterion describes whether bilateral migration data reports migrants’ previous or future
country of residence, their country of birth, or their country of citizenship. There is no agreement on
which of these criteria is most suitable, with arguments made for and against each of them.
Although the country of birth (COB) may seem the most straightforward reporting criterion,
it does not specify whether the move has been made by a citizen or a foreigner, and where migrants go
to or come from. Statistics by country of birth may include information on citizens and foreigners or
they may just reflect non-citizens for countries, such as the USA, that do not register international
migration of their citizens.
The country of citizenship (COC) reporting criterion is often praised as citizenship is an
unambiguous concept (Zlotnik 1987), but the increasing number of people holding dual citizenship is
problematic (Simmons 1987). There is also a tendency to conflate the related, but distinct terms of
citizenship and nationality. Both terms have been used rather interchangeably in migration statistics,
although citizenship is more common recently. Some historical statistics use nationality to indicate the
presumed ethnic origin of immigrant groups. For instance Greek data report on ‘Arabs’ as a category
of nationality. Nationality can also refer to a particular legal status associated to a specific ethnic origin
rather than citizenship per se. An example is the Greek use of Hellenics in reference to immigrants and
emigrants of Greek ethnic origin who are not necessarily Greek citizens (Statistique Générale de la
Grèce, "Annuaire Statistique de la Grèce", years 1933-1939).
Reporting bilateral migration flows by the country of residence (COR) can also be
problematic as there are multiple definitions: legal residence and actual residence (Zlotnik 1987). In
some countries, citizens may be entitled to legal residence and thus count as legal residents, regardless
of their actual physical presence in the country. For example, Australian citizens returning after a stay
abroad may still indicate that their country of last residence was Australia as they never stopped being
legal residents. Yet residence has most commonly been linked to actual residence, based on common
definitions that make residence dependent on the length of stay. Simmons (1987) argued country of
residence is the most suitable for analyses of migration flow. Particularly when such data are broken
18 IMI Working Papers Series 2014, No. 88
down by citizens and foreigners, they are useful for the analysis of migration to and from countries with
high volumes of past emigration and return. This is particularly relevant for countries with a long
emigration traditions such as Spain, where a considerable part of the immigration data tracks
movements of second and third generation Spaniards from Latin American countries.
For analytical purposes, particular reporting criteria may be more useful than others depending
on the research question. For instance, country of residence may be the most useful criterion for
researchers interested in how economic and political change affects the timing and direction of
migration between large numbers of countries over extended time periods. However, researchers
interested in the movement of people originating from a particular group of migrants may prefer
migration flow data by country of citizenship, or alternatively by country of birth.
The usefulness of reporting criteria for different analyses, meant we did not ‘prioritise’ one
criteria in DEMIG C2C. Furthermore, most countries only report on one or two criteria, which would
have forced us to combine data based on different criteria in one single database, thereby creating a
large degree of built-in incoherence. Instead, DEMIG C2C includes data on all reporting criteria
whenever available to allow data users to explore the best choices for their own research, and possibly
combine data from different sources. Appendix B provides further details on the availability of the data
by each reporting criterion.
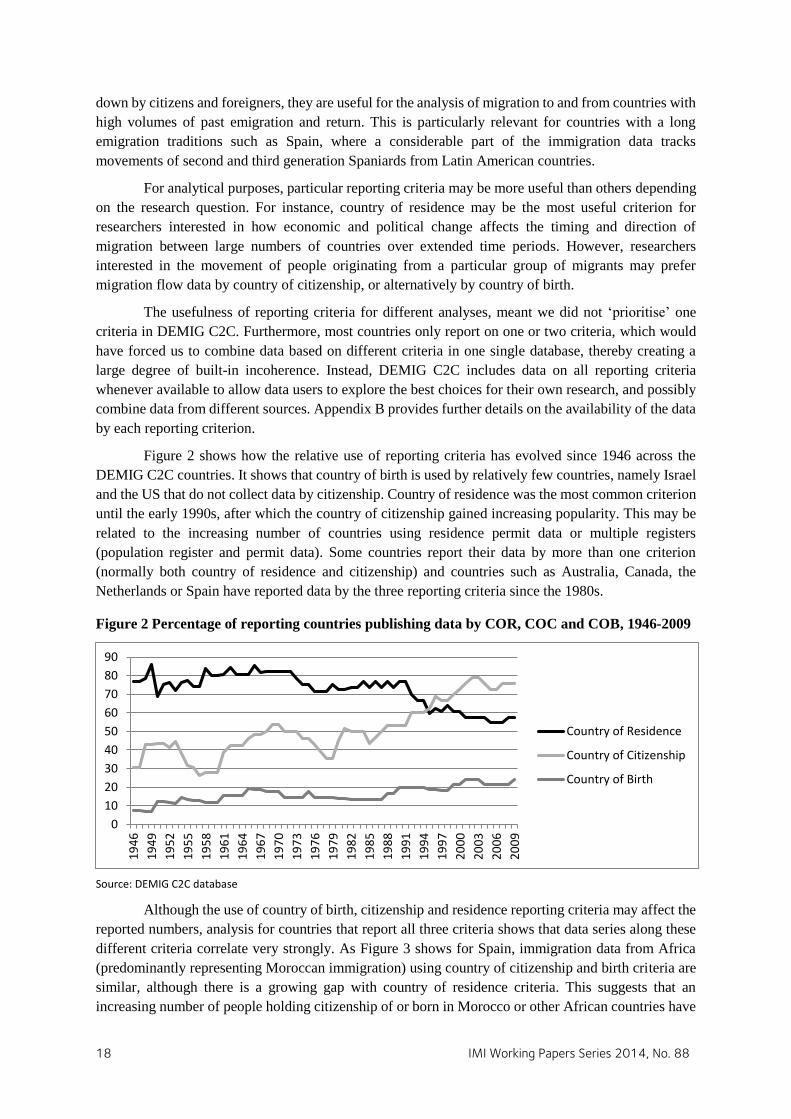
Figure 2 shows how the relative use of reporting criteria has evolved since 1946 across the
DEMIG C2C countries. It shows that country of birth is used by relatively few countries, namely Israel
and the US that do not collect data by citizenship. Country of residence was the most common criterion
until the early 1990s, after which the country of citizenship gained increasing popularity. This may be
related to the increasing number of countries using residence permit data or multiple registers
(population register and permit data). Some countries report their data by more than one criterion
(normally both country of residence and citizenship) and countries such as Australia, Canada, the
Netherlands or Spain have reported data by the three reporting criteria since the 1980s.
Figure 2 Percentage of reporting countries publishing data by COR, COC and COB, 1946-2009
Source: DEMIG C2C database
Although the use of country of birth, citizenship and residence reporting criteria may affect the
reported numbers, analysis for countries that report all three criteria shows that data series along these
different criteria correlate very strongly. As Figure 3 shows for Spain, immigration data from Africa
(predominantly representing Moroccan immigration) using country of citizenship and birth criteria are
similar, although there is a growing gap with country of residence criteria. This suggests that an
increasing number of people holding citizenship of or born in Morocco or other African countries have
0
10
20
30
40
50
60
70
80
90
19
46
19
49
19
52
19
55
19
58
19
61
19
64
19
67
19
70
19
73
19
76
19
79
19
82
19
85
19
88
19
91
19
94
19
97
20
00
20
03
20
06
20
09
Country of Residence
Country of Citizenship
Country of Birth

IMI Working Papers Series 2014, No. 88 19
come to Spain via other countries. Immigration from the Americas shows consistent differences by
reporting criterion, with country of birth data being the highest, followed by country of citizenship. This
is likely to reflect the migration of people of Spanish ancestry born in South America. As with African
immigration, the country of residence criterion yields the lowest figures, probably reflecting the fact
that not all American immigrants have directly migrated to Spain. This shows the value of the
simultaneous tracking of flows using different criteria. On the other hand, it also shows that although
these data cannot be used interchangeably, they tend to correlate strongly. This creates considerable
potential to pool data using different reporting criteria to create longer time series.
Figure 3. Immigration to Spain by country of birth, citizenship and previous residence criteria
according to major regions
Source: DEMIG C2C Database
4.2.3 Coverage: foreigners and citizens
States’ objectives and priorities clearly shape migration statistics by determining whose movements are
observed. In general, states have primarily been interested in the immigration of foreigners and the
emigration of citizens, and relatively less interested in the emigration of foreigners and immigration of
citizens. Modern nation states show a desire to control who resides on their sovereign territory, partly
to determine access to public services and welfare provisions. The tracking of the immigration of
foreigners assumes great importance. Many states have also been interested in recording emigration of
citizens out of the desire control or protect them while abroad (UN DESA Statistics Division 1998:9).
The degree to which movements of citizens and foreigners are tracked changes across countries and
over time. For instance, states with strategic interests in tracking the movements of their citizens,
0
50,000
100,000
150,000
200,000
250,000
300,000
350,000
Africa -COB
Africa- COC
Africa -COR
0
100,000
200,000
300,000
400,000
500,000
600,000
700,000
800,000
Americas- COB
Americas -COC
Americas -COR

20 IMI Working Papers Series 2014, No. 88
particularly authoritarian states, tend to have more accurate data. Other countries, such as France, have
never collected data on emigration or immigration of its citizens, a trend that may be traceable to a firm
belief in the principle of freedom of movement (Weil 2007).
DEMIG TOTAL data supports these observations. Figure 4 shows a consistently more
countries recording immigration compared to emigration of foreigners, and Figure 5 suggests that until
the twentieth century, few states recorded the immigration of citizens in contrast with the emigration of
citizens. This gap has been largely closed in the first half of the twentieth century, which partly reflects
the growing interest of origin countries, such as in southern Europe, in monitoring the return of their
citizens. Until the 1980s, emigration countries in southern Europe closely tracked numbers and socio-
demographic characteristics (e.g., gender, occupation, municipality of origin, length of stay abroad, and
occupation upon return) of citizens returning from abroad.
Figure 4 Number of countries reporting total flows for foreigners, 1815-201015
Source: DEMIG TOTAL database
Figure 5 Number of countries reporting total flows for citizens, 1815-2010
Source: DEMIG TOTAL database
In contrast to the data for citizens, the gap between the number of countries reporting the
immigration and emigration of foreigners has never been closed, and will likely persist in the future as
countries that only record migration of foreigners usually do not record emigration, such as Canada,
15 The decline in the 1960s and 1970s and the upward trend in the 1990s is primarily related to the availability of
published sources of such data that we were able to access.
0
5
10
15
20
25
30
18
15
18
24
18
33
18
42
18
51
18
60
18
69
18
78
18
87
18
96
19
05
19
14
19
23
19
32
19
41
19
50
19
59
19
68
19
77
19
86
19
95
20
04
Inflows Foreigners
Outflows Foreigners
0
2
4
6
8
10
12
14
16
18
20
18
15
18
23
18
31
18
39
18
47
18
55
18
63
18
71
18
79
18
87
18
95
19
03
19
11
19
19
19
27
19
35
19
43
19
51
19
59
19
67
19
75
19
83
19
91
19
99
20
07
Inflows Citizens
Outflows Citizens

IMI Working Papers Series 2014, No. 88 21
France, Israel and the US. This gap is also likely to increase if more countries decide to measure
migration using residence permits. Several South American states for instance have changed the way
they report migration data after the end of military rule. They have shifted from recording border
statistics and population registers for national security reasons to residence permits granted to regulate
the entry of foreigners.
4.2.4 Collection methods
Migration flow data are gathered through various collection methods due to past decisions that created
hard-to-change bureaucratic practices, institutional constraints and national priorities. The most popular
collection method is population registers, followed by permits (residence and/or work) and multiple
registrations (see Figure 5). Population registers are common in many European countries, such as
Belgium, Germany, Netherlands, Italy, and Spain. Taiwan is the only non-European country in our
database using population registers as a source of migration data. Registers of residence permits are the
conventional method of migration data collection in traditional immigration countries such as Canada
and the United States, Argentina, Brazil, Uruguay but also Mexico.
Migration statistics are sometimes collected through border crossing statistics, such as in
Australia, New Zealand and developing countries like Kenya and Zimbabwe. Some countries use
multiple methods to compile their migration statistics, including combinations of population registers
and foreigner registers kept at police stations or centres for application of residence permits, and used
to record the arrival, residence and departure of foreign citizens, as done in the Czech Republic,
Slovakia and Slovenia. Foreigner registers are often combined with or used to adjust the population
registers. Other countries, like Israel, use population registers and residence permits registers.
Figure 6 shows that data collection methods also change over time, which can create internal
consistency problems. This graph is compiled using DEMIG C2C data on collection methods from 1945
to 2010. For example, Finland and Italy initially measured emigration through passport issuance data,
until they changed to using population registers in 1968 and 1955 respectively. An additional
complication is that data sources do not always specify the collection method. While national statistical
yearbooks usually mention the collection method and duration-of-stay, historical statistical yearbooks
such as Mitchell’s three volumes of International Historical Statistics (2007a; 2007b; 2007c) and some
issues of the UN Demographic Yearbooks published between 1945 and 1996 do not specify this.
Figure 6 Method of migration data collection across reporting countries, 1945-2010
Source: DEMIG C2C database
0.0
10.0
20.0
30.0
40.0
50.0
19
46
19
50
19
54
19
58
19
62
19
66
19
70
19
74
19
78
19
82
19
86
19
90
19
94
19
98
20
02
20
06
Pe
rce
nta
ge
Population Register
Residence/Work Permit
Multiple Registers
Border statistics
Passenger Survey

22 IMI Working Papers Series 2014, No. 88
4.2.5 Length of stay
Caution with regards to the duration-of-stay used to define which movements are recorded as
international migration should be taken. Different definitions that may also vary over time are used,
which can create problems of internal consistency (over time) and cross-country comparability. The
UN definition stipulates that ‘a long-term migrant should be defined as a person who moves to a country
other than that of his or her usual residence for a period of at least a year (12 months), so that the
country of destination effectively becomes his or her new country of usual residence’ [italics in original
text] (UN DESA Statistics Division 1998:18). Nonetheless, national data collection agencies use
different duration-of-stay benchmarks. For instance, population registers use minimum duration-of-stay
criteria varying from 3 to 12 months, or sometimes unspecified. It is also common for the duration-of-
stay to be different for immigration and emigration, or for citizens and foreigners as is the case for the
Netherlands (applies to foreigners and citizens) and Belgium (for foreigners). So, there is no uniform
definition of residence across countries and for different migrant categories (cf. Zlotnik 1987).
We also found inconsistencies with duration-of-stay of the movements tracked in the UN
Demographic Yearbook data. As a consequence, forms of migration that earlier issues defined as long-
term migration were defined as short-term in later issues and vice versa. Data that showed
inconsistencies over time was clearly identified and notes were appended for the user’s convenience.16
4.2.6 Gender
A unique feature of the DEMIG C2C database is that immigration and emigration include data for men
and women for 26 countries. The majority of reporting countries report male and female immigration
and emigration separately and this number has been consistently increasing in recent decades (see table
2). Already in the 1940s, Australia, Belgium, Denmark, the Netherlands, Portugal and Argentina
provided gender disaggregation in their migration data. While prior international migration databases
have not included a gender specification, DEMIG C2C opens new opportunities for exploring the
gender dimension of international migration from a historical perspective. For instance, it enables a
critical examination of the common idea that international migration has ‘feminized’ and research into
the determinants of the gender composition of migration flows.
Table 2 Reporting countries and decade of gender data availability
1940s 1950s 1960s 1970s and 1980s 1990s 2000s
Australia
Belgium
Denmark
Netherlands
Portugal
Argentina
Czech Republic
Germany
Italy
Luxembourg
New Zealand
Norway
Slovakia
Spain
Brazil
Canada
Finland
France (partial)
Greece
Iceland
Sweden
Hungary
Slovenia
Mexico
South Africa
Uruguay
Austria
Korea, Republic of
Poland
Source: DEMIG C2C database
16 These changes do not appear to follow any particular pattern or be due to national statistical offices altering
the way their data was reported (issues such as different personnel, different categorisation of data per different
years). Overall, there was a growth of sophistication of reported migration data from arrival and departure to the
division of migration between long- and short-term; this might also reflect attempts by reporters of national
statistics to implement the changes of UN definitions over the years.
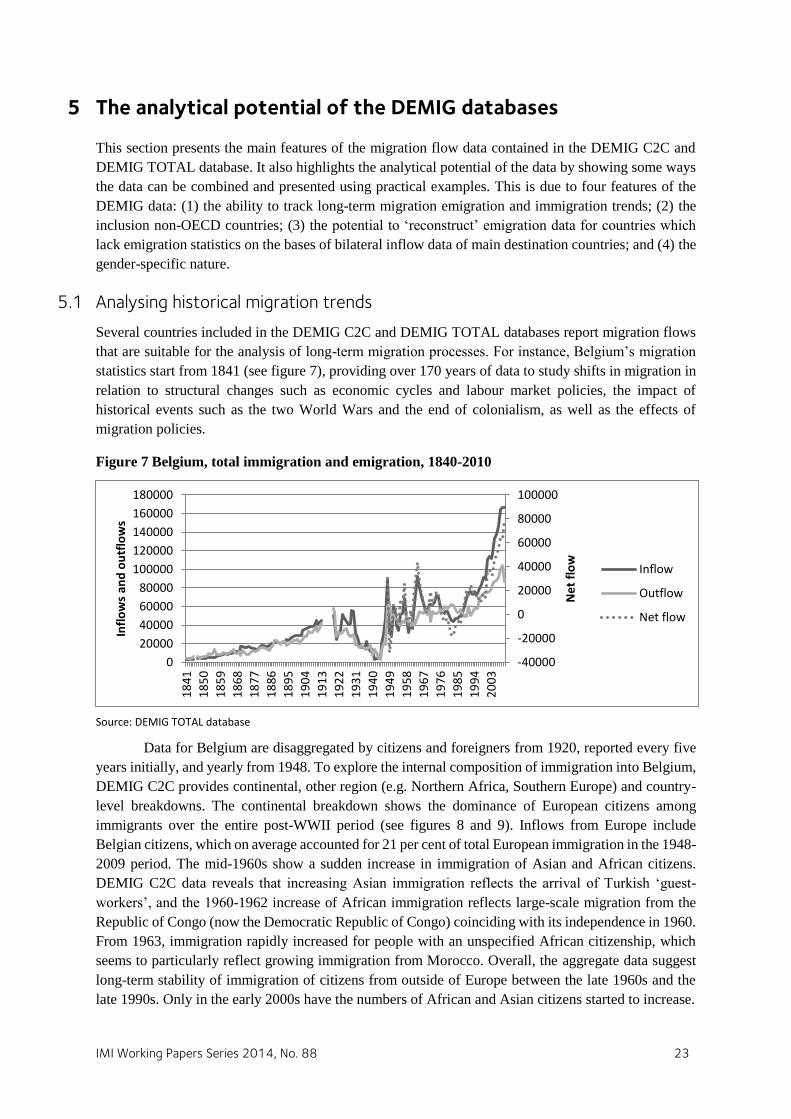
IMI Working Papers Series 2014, No. 88 23
5 The analytical potential of the DEMIG databases
This section presents the main features of the migration flow data contained in the DEMIG C2C and
DEMIG TOTAL database. It also highlights the analytical potential of the data by showing some ways
the data can be combined and presented using practical examples. This is due to four features of the
DEMIG data: (1) the ability to track long-term migration emigration and immigration trends; (2) the
inclusion non-OECD countries; (3) the potential to ‘reconstruct’ emigration data for countries which
lack emigration statistics on the bases of bilateral inflow data of main destination countries; and (4) the
gender-specific nature.
5.1 Analysing historical migration trends
Several countries included in the DEMIG C2C and DEMIG TOTAL databases report migration flows
that are suitable for the analysis of long-term migration processes. For instance, Belgium’s migration
statistics start from 1841 (see figure 7), providing over 170 years of data to study shifts in migration in
relation to structural changes such as economic cycles and labour market policies, the impact of
historical events such as the two World Wars and the end of colonialism, as well as the effects of
migration policies.
Figure 7 Belgium, total immigration and emigration, 1840-2010
Source: DEMIG TOTAL database
Data for Belgium are disaggregated by citizens and foreigners from 1920, reported every five
years initially, and yearly from 1948. To explore the internal composition of immigration into Belgium,
DEMIG C2C provides continental, other region (e.g. Northern Africa, Southern Europe) and country-
level breakdowns. The continental breakdown shows the dominance of European citizens among
immigrants over the entire post-WWII period (see figures 8 and 9). Inflows from Europe include
Belgian citizens, which on average accounted for 21 per cent of total European immigration in the 1948-
2009 period. The mid-1960s show a sudden increase in immigration of Asian and African citizens.
DEMIG C2C data reveals that increasing Asian immigration reflects the arrival of Turkish ‘guest-
workers’, and the 1960-1962 increase of African immigration reflects large-scale migration from the
Republic of Congo (now the Democratic Republic of Congo) coinciding with its independence in 1960.
From 1963, immigration rapidly increased for people with an unspecified African citizenship, which
seems to particularly reflect growing immigration from Morocco. Overall, the aggregate data suggest
long-term stability of immigration of citizens from outside of Europe between the late 1960s and the
late 1990s. Only in the early 2000s have the numbers of African and Asian citizens started to increase.
-40000
-20000
0
20000
40000
60000
80000
100000
0
20000
40000
60000
80000
100000
120000
140000
160000
180000
18
41
18
50
18
59
18
68
18
77
18
86
18
95
19
04
19
13
19
22
19
31
19
40
19
49
19
58
19
67
19
76
19
85
19
94
20
03
Ne
t fl
ow
Infl
ow
s an
d o
utf
low
s
Inflow
Outflow
Net flow
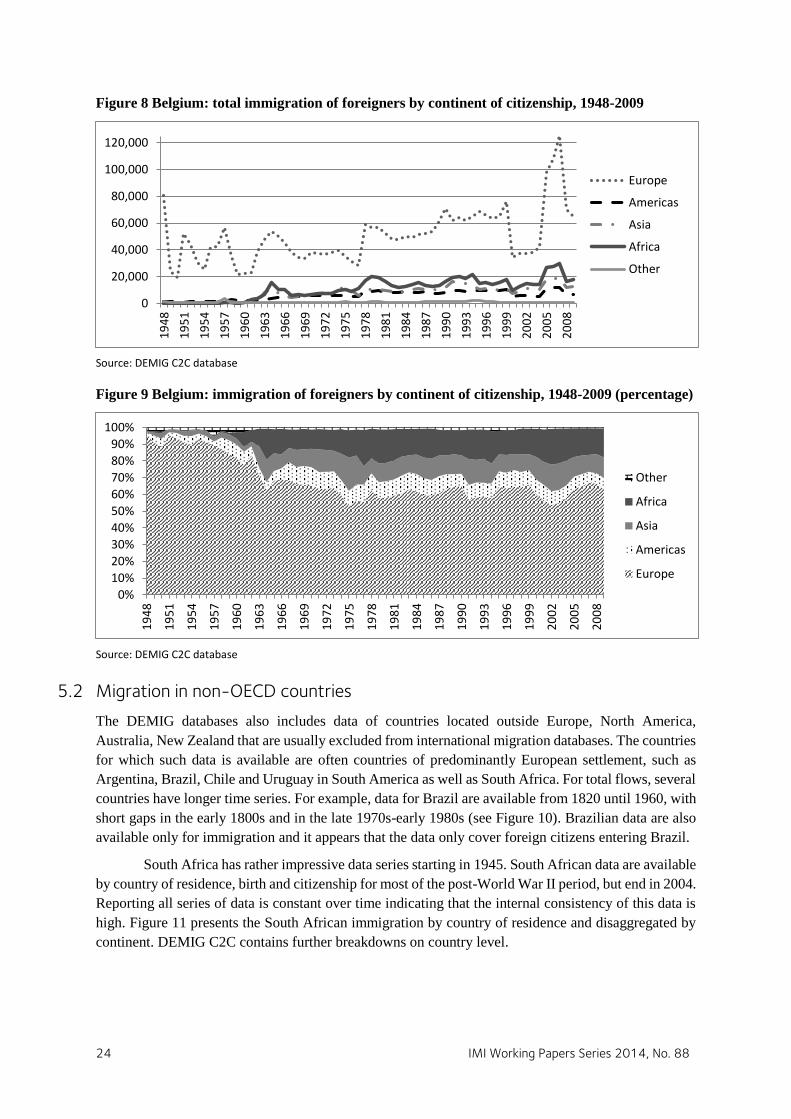
24 IMI Working Papers Series 2014, No. 88
Figure 8 Belgium: total immigration of foreigners by continent of citizenship, 1948-2009
Source: DEMIG C2C database
Figure 9 Belgium: immigration of foreigners by continent of citizenship, 1948-2009 (percentage)
Source: DEMIG C2C database
5.2 Migration in non-OECD countries
The DEMIG databases also includes data of countries located outside Europe, North America,
Australia, New Zealand that are usually excluded from international migration databases. The countries
for which such data is available are often countries of predominantly European settlement, such as
Argentina, Brazil, Chile and Uruguay in South America as well as South Africa. For total flows, several
countries have longer time series. For example, data for Brazil are available from 1820 until 1960, with
short gaps in the early 1800s and in the late 1970s-early 1980s (see Figure 10). Brazilian data are also
available only for immigration and it appears that the data only cover foreign citizens entering Brazil.
South Africa has rather impressive data series starting in 1945. South African data are available
by country of residence, birth and citizenship for most of the post-World War II period, but end in 2004.
Reporting all series of data is constant over time indicating that the internal consistency of this data is
high. Figure 11 presents the South African immigration by country of residence and disaggregated by
continent. DEMIG C2C contains further breakdowns on country level.
0
20,000
40,000
60,000
80,000
100,000
120,000
19
48
19
51
19
54
19
57
19
60
19
63
19
66
19
69
19
72
19
75
19
78
19
81
19
84
19
87
19
90
19
93
19
96
19
99
20
02
20
05
20
08
Europe
Americas
Asia
Africa
Other
0%
10%
20%
30%
40%
50%
60%
70%
80%
90%
100%
19
48
19
51
19
54
19
57
19
60
19
63
19
66
19
69
19
72
19
75
19
78
19
81
19
84
19
87
19
90
19
93
19
96
19
99
20
02
20
05
20
08
Other
Africa
Asia
Americas
Europe
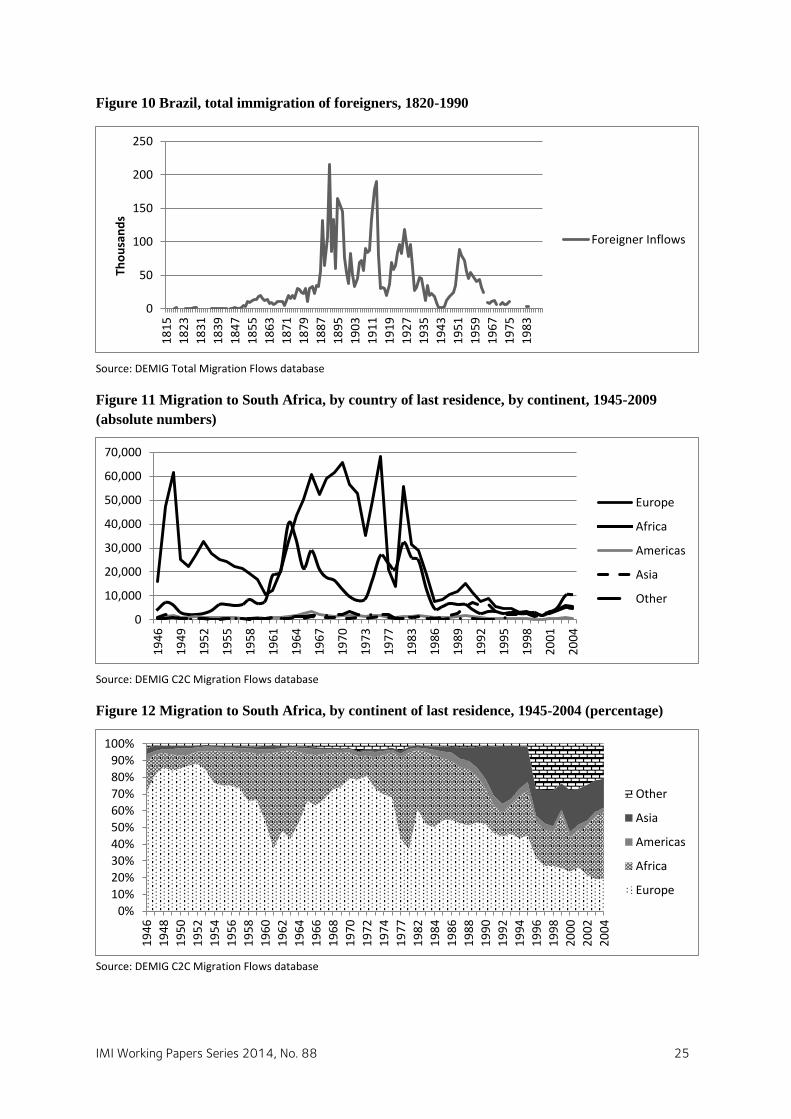
IMI Working Papers Series 2014, No. 88 25
Figure 10 Brazil, total immigration of foreigners, 1820-1990
Source: DEMIG Total Migration Flows database
Figure 11 Migration to South Africa, by country of last residence, by continent, 1945-2009
(absolute numbers)
Source: DEMIG C2C Migration Flows database
Figure 12 Migration to South Africa, by continent of last residence, 1945-2004 (percentage)
Source: DEMIG C2C Migration Flows database
0
50
100
150
200
250
18
15
18
23
18
31
18
39
18
47
18
55
18
63
18
71
18
79
18
87
18
95
19
03
19
11
19
19
19
27
19
35
19
43
19
51
19
59
19
67
19
75
19
83
Tho
usa
nd
s
Foreigner Inflows
0
10,000
20,000
30,000
40,000
50,000
60,000
70,000
19
46
19
49
19
52
19
55
19
58
19
61
19
64
19
67
19
70
19
73
19
77
19
83
19
86
19
89
19
92
19
95
19
98
20
01
20
04
Europe
Africa
Americas
Asia
Other
0%
10%
20%
30%
40%
50%
60%
70%
80%
90%
100%
19
46
19
48
19
50
19
52
19
54
19
56
19
58
19
60
19
62
19
64
19
66
19
68
19
70
19
72
19
74
19
77
19
82
19
84
19
86
19
88
19
90
19
92
19
94
19
96
19
98
20
00
20
02
20
04
Other
Asia
Americas
Africa
Europe
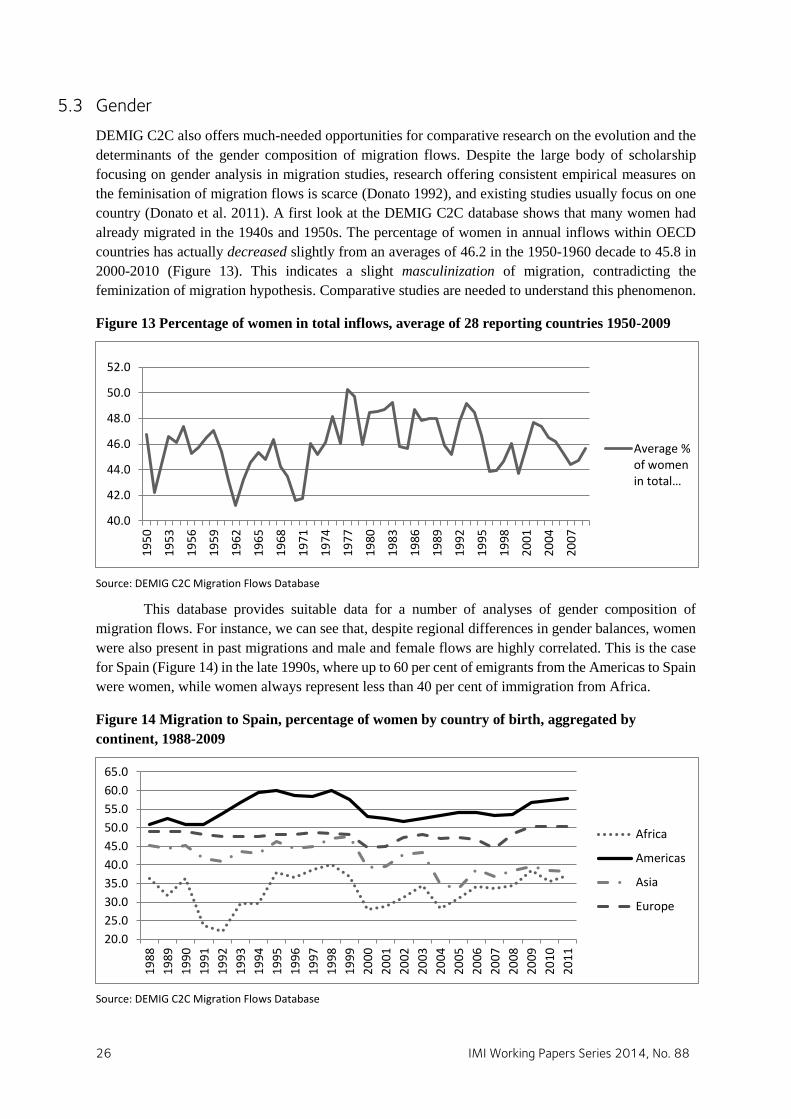
26 IMI Working Papers Series 2014, No. 88
5.3 Gender
DEMIG C2C also offers much-needed opportunities for comparative research on the evolution and the
determinants of the gender composition of migration flows. Despite the large body of scholarship
focusing on gender analysis in migration studies, research offering consistent empirical measures on
the feminisation of migration flows is scarce (Donato 1992), and existing studies usually focus on one
country (Donato et al. 2011). A first look at the DEMIG C2C database shows that many women had
already migrated in the 1940s and 1950s. The percentage of women in annual inflows within OECD
countries has actually decreased slightly from an averages of 46.2 in the 1950-1960 decade to 45.8 in
2000-2010 (Figure 13). This indicates a slight masculinization of migration, contradicting the
feminization of migration hypothesis. Comparative studies are needed to understand this phenomenon.
Figure 13 Percentage of women in total inflows, average of 28 reporting countries 1950-2009
Source: DEMIG C2C Migration Flows Database
This database provides suitable data for a number of analyses of gender composition of
migration flows. For instance, we can see that, despite regional differences in gender balances, women
were also present in past migrations and male and female flows are highly correlated. This is the case
for Spain (Figure 14) in the late 1990s, where up to 60 per cent of emigrants from the Americas to Spain
were women, while women always represent less than 40 per cent of immigration from Africa.
Figure 14 Migration to Spain, percentage of women by country of birth, aggregated by
continent, 1988-2009
Source: DEMIG C2C Migration Flows Database
40.0
42.0
44.0
46.0
48.0
50.0
52.0
19
50
19
53
19
56
19
59
19
62
19
65
19
68
19
71
19
74
19
77
19
80
19
83
19
86
19
89
19
92
19
95
19
98
20
01
20
04
20
07
Average %of womenin total…
20.0
25.0
30.0
35.0
40.0
45.0
50.0
55.0
60.0
65.0
19
88
19
89
19
90
19
91
19
92
19
93
19
94
19
95
19
96
19
97
19
98
19
99
20
00
20
01
20
02
20
03
20
04
20
05
20
06
20
07
20
08
20
09
20
10
20
11
Africa
Americas
Asia
Europe

IMI Working Papers Series 2014, No. 88 27
5.4 Constructing migration data using reverse flow data
While we found that many countries have better-than-expected migration flow data, they are mainly in
Europe and the Americas. Many countries, particularly in Africa and Asia, do have poor migration
statistics, either because registration systems are absent or most migration goes unrecorded. More
generally, many countries – including many OECD countries – do a particularly poor job in registering
emigration of their own citizens.
The bilateral data in DEMIG C2C addresses this to an extent by providing an opportunity to
construct data from and to countries that do not report total or bilateral migration data. We have termed
this data ‘constructed flows’ as they are calculated from immigration data by reporting countries, but
they represent emigration for the reported country. This provides an opportunity to assess destination-
specific out-migration, and tentative total out-migration, particularly for countries in which the bulk of
emigration is directed towards OECD and South American countries. This makes it possible to estimate
bilateral and total longitudinal emigration data for prominent emigration countries such as Mexico,
Morocco and Turkey. As well as to estimate emigration patterns and trends from countries such as the
USA, France and the UK that do not register emigration of their own citizens.
Figures 15 and 16 provide an example of Turkish emigration, constructed from country of
citizenship data from 30 reporting countries that included flows from Turkey.17 Similarly, immigration
to Turkey can be constructed from emigration figures of these reporting countries, although the quality
of emigration data is generally lower. Limitations are acknowledged, including the possibility that
changes in flows can reflect the addition of new reporting countries rather than a real increase of inflows
of Turkish citizens. On the other hand, the most important destination countries such as Germany, the
Netherlands and Belgium are included in the entire series, which makes it credible that the constructed
emigration figures give a reasonably good approximation of outflow dynamics.
Figure 15 Estimated Turkish emigration, constructed from inflows of 30 reporting countries,
1960-2009 (absolute numbers)
Source: DEMIG C2C Migration Flows database
17 The reporting countries with low levels of immigration of Turkish citizens have been aggregated in Other
Europe, Americas and Oceania to ensure legibility of the graph.
0
50,000
100,000
150,000
200,000
250,000
19
60
19
64
19
67
19
70
19
73
19
76
19
79
19
82
19
85
19
88
19
91
19
94
19
97
20
00
20
03
20
06
20
09
Germany
Netherlands
France
Belgium
Sweden
Australia
Other
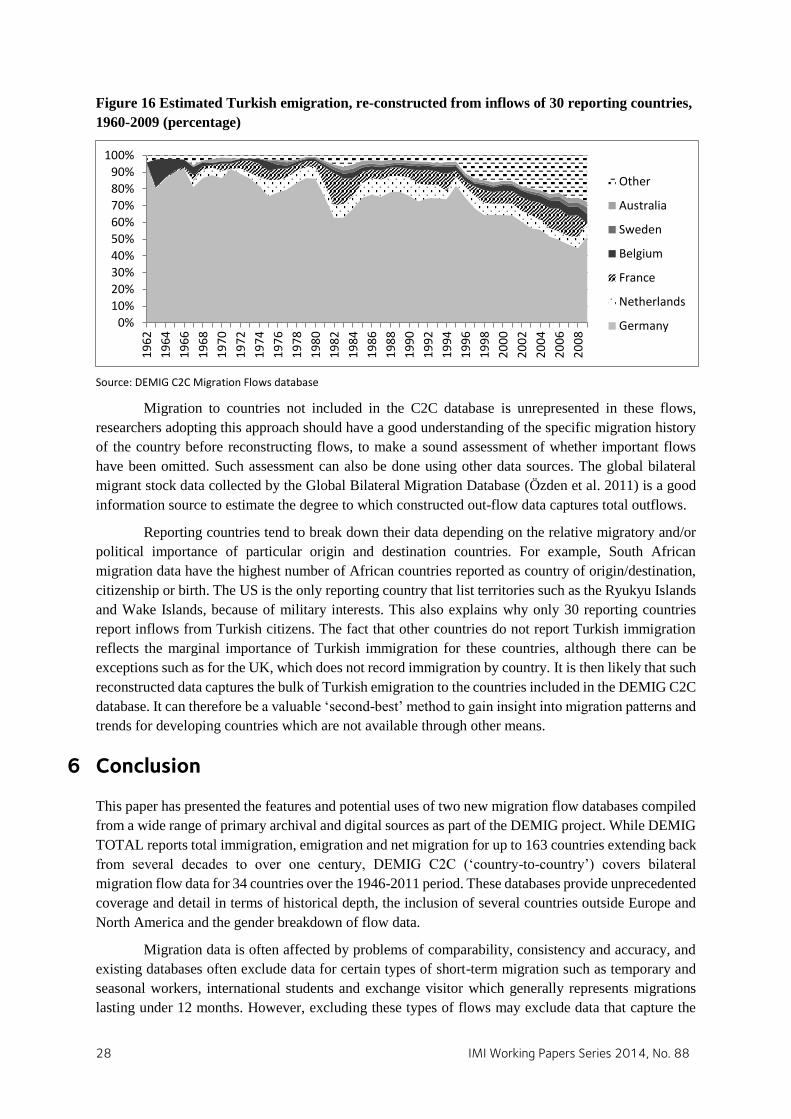
28 IMI Working Papers Series 2014, No. 88
Figure 16 Estimated Turkish emigration, re-constructed from inflows of 30 reporting countries,
1960-2009 (percentage)
Source: DEMIG C2C Migration Flows database
Migration to countries not included in the C2C database is unrepresented in these flows,
researchers adopting this approach should have a good understanding of the specific migration history
of the country before reconstructing flows, to make a sound assessment of whether important flows
have been omitted. Such assessment can also be done using other data sources. The global bilateral
migrant stock data collected by the Global Bilateral Migration Database (Özden et al. 2011) is a good
information source to estimate the degree to which constructed out-flow data captures total outflows.
Reporting countries tend to break down their data depending on the relative migratory and/or
political importance of particular origin and destination countries. For example, South African
migration data have the highest number of African countries reported as country of origin/destination,
citizenship or birth. The US is the only reporting country that list territories such as the Ryukyu Islands
and Wake Islands, because of military interests. This also explains why only 30 reporting countries
report inflows from Turkish citizens. The fact that other countries do not report Turkish immigration
reflects the marginal importance of Turkish immigration for these countries, although there can be
exceptions such as for the UK, which does not record immigration by country. It is then likely that such
reconstructed data captures the bulk of Turkish emigration to the countries included in the DEMIG C2C
database. It can therefore be a valuable ‘second-best’ method to gain insight into migration patterns and
trends for developing countries which are not available through other means.
6 Conclusion
This paper has presented the features and potential uses of two new migration flow databases compiled
from a wide range of primary archival and digital sources as part of the DEMIG project. While DEMIG
TOTAL reports total immigration, emigration and net migration for up to 163 countries extending back
from several decades to over one century, DEMIG C2C (‘country-to-country’) covers bilateral
migration flow data for 34 countries over the 1946-2011 period. These databases provide unprecedented
coverage and detail in terms of historical depth, the inclusion of several countries outside Europe and
North America and the gender breakdown of flow data.
Migration data is often affected by problems of comparability, consistency and accuracy, and
existing databases often exclude data for certain types of short-term migration such as temporary and
seasonal workers, international students and exchange visitor which generally represents migrations
lasting under 12 months. However, excluding these types of flows may exclude data that capture the
0%
10%
20%
30%
40%
50%
60%
70%
80%
90%
100%1
96
2
19
64
19
66
19
68
19
70
19
72
19
74
19
76
19
78
19
80
19
82
19
84
19
86
19
88
19
90
19
92
19
94
19
96
19
98
20
00
20
02
20
04
20
06
20
08
Other
Australia
Sweden
Belgium
France
Netherlands
Germany
IMI Working Papers Series 2014, No. 88 29
renewals of temporary or student permits over a number of years. Moreover, existing databases do not
generally include any information on irregular migration. This paper argued that such problems and
limitations are not unique to migration statistics as they also affect other socio-economic and
demographic data, and that the literature has therefore tended to portray migration data in an unduly
harsh light. The paper discussed ways in which we have aimed to maximise consistency, transparency
and maximum flexibility for data users. We have chosen to uncover and include original data as
reported by data providers instead of manipulating the data in an attempt to create a harmonised
database. Sufficient information has been provided for the users to make informed decisions on the
selection of data and to make informed judgements about the comparability of data. This has enhanced
the flexibility for users to select, disaggregate or aggregate data according to their particular needs.
The paper has given insights into the methodological considerations behind decisions on the
selection, compilation and categorisation of the migration data and illustrates the analytical potential of
the DEMIG databases. The DEMIG data collection experience has exemplified that data availability
and data quality are relative concepts. First, this experience showed that migration flow data are not as
scarce as is often assumed by migration scholarship, although older data may only be accessible through
archival, non-electronic sources. This highlights the relative meaning of the concept of ‘data
availability’: it often depends on how deep one can dig and how many resources are available. The
uncovering and collection of data requires significant effort, because data are dispersed over many
locations, come from a variety of sources, and exist in different formats. Sometimes, it is even difficult
to establish whether data exists at all, as much older data is buried in archives.
Second, the DEMIG data compilation experience revealed that data quality has not necessarily
increased over time. In fact, historical data often contains impressive levels of detail on definitions and
collection methods and provide detailed category breakdowns of migration flows which are difficult to
match even by current standards. The types of flows (e.g., immigration and emigration) and categories
measured (e.g., occupational groups, family migrants, high-skilled, students) often change over time,
which regularly reflects changing priorities of states. Data collection practices generally reflect
(changing) political priorities. It is therefore highly unlikely that entirely compatible or ‘perfect’
international migration statistics will ever be available.
The collected data in the DEMIG databases has considerable potential to contribute to a better
understanding of the nature, determinants and impacts of migration processes. It is our hope that these
databases can serve as a basis which can be expanded in the future in terms of historical depth and
cross-sectional breadth and will thus become a lasting valuable resource for the improvement of the
historical understanding of migration flows and processes. Expansion towards new countries,
particularly non-OECD countries; extension back in time, including additional breakdowns, such as age
or professional categories; and the possibility of compiling data cross-tabulated by the different criteria
(country of birth, citizenship and residence) would allow for more sophisticated analyses.
30 IMI Working Papers Series 2014, No. 88
References
Batini, Carlo, and Monica Scannapieca. 2006. Data Quality: Concepts, Methodologies and Techniques.
Berlin Heidelberg New York: Springer.
Bhagwati, Jagdish. 2003. "Borders Beyond Control." Foreign Affairs 82(1):98-104.
Center for Global Development. 2009. "Migrants Count: Five Steps Toward Better Migration Data ",
edited by Patricia A. Santo Tomas and Lawrence H. Summers. Washington, DC: Center for Global
Develpment.
Center for Global Develpment. 2009. "Migrants Count: Five Steps Toward Better Migration Data ",
edited by Patricia A. Santo Tomas and Lawrence H. Summers. Washington, DC: Center for Global
Develpment.
Chamie, Joseph. 1994. "Population databases in development analysis." Journal of Development
Economics 44(1):131-46.
Czaika, Mathias, and Hein de Haas. 2013. "The Effectiveness of Immigration Policies." Population and
Development Review 39(3):487-508.
de Haas, Hein. 2011. "The determinants of international migration: conceptualizing policy, origin and
destination effects." in IMI Working Papers. Oxford: International Migration Institute.
de Haas, Hein, Katharina Natter, and Simona Vezzoli. 2014. "Compiling and coding migration policies:
Insights from the DEMIG POLICY database."
Donato, K. M., J. T. Alexander, D. R. Gabaccia, and J. Leinonen. 2011. "Variations in the gender
composition of immigrant populations: how they matter." Int Migr Rev 45(3):495-526.
Donato, Katharine M. 1992. "Understanding U.S. Immigration: Why Some Countries Send Women and
Others Send Men." in Seeking Common Ground: Multidisciplinary Studies of Immigrant Women in
the United States, edited by Donna Gabbaccia. Westport, Connecticut; London: Greenwood Press.
Gamlen, Alan. 2010. "International Migration Data and the Study of Super-Diversity." in MMG
Working Papers, edited by Max Planck Institute for the Study of Religious and Ethnic Diversity.
Göttingen: Max Planck Institute for the Study of Religious and Ethnic Diversity.
Herrera, Yoshiko M., and Devesh Kapur. 2007. "Improving Data Quality: Actors, Incentives, and
Capabilities." Political Analysis 15(4):365-86.
Kelly, John J. 1987. "improving the Comparability of International Migration Statistics: Contributions
by the Conference of European Statisticians from 1971 to Date." International Migration Review
21(4):1017-37.
Kupiszewska, Dorota, and Marek Kupiszewski. 2011. "Harmonization of international migration data."
in CARIM East - Consortium for Applied Research on International Migration: Methodological
Workshop II, edited by Robert Schuman Centre for Advanced Studies. Warsaw.
Kupiszewska, Dorota, and Beata Nowok. 2005. "Comparability of Statistics on International Migration
Flows in the European Union." in CEFMR Working Paper, edited by Central European Forum for
Migration Research. Warsaw: Central European Forum for Migration Research.
Lemaitre, Georges. 2005. "The Comparability of International Migration Statistics: Problems and
Prospects." in Statistics Brief, edited by OECD. Paris: OECD.
Lemaitre, Georges, Thomas Liebig, Cecile Thoreau, and Pauline Fron. 2007. "Standardised statistics
on immigrant inflows: results, sources and methods." edited by OECD. Paris: OECD.
Mitchell, B.R. 2007a. International Historical Statistics: Africa, Asia, and Oceania, 1750-2005.
London: Palgrave MacMillan.
—. 2007b. International Historical Statistics: Europe , 1750-2005. London: Palgrave MacMillan.
IMI Working Papers Series 2014, No. 88 31
—. 2007c. International Historical Statistics: The Americas, 1750-2005. London: Palgrave MacMillan.
Özden, Çağlar, Christopher R. Parsons, Maurice Schiff, and Terrie L. Walmsley. 2011. "Where on Earth
is Everybody? The Evolution of Global Bilateral Migration 1960–2000." The World Bank Economic
Review 25(1):12-56.
Parsons, Christopher R, Ronald Skeldon, Terrie L Walmsley, and Alan L Winters. 2005. "Quantifying
the International Bilateral Movements of Migrants." in DRC Working Paper T13: Development
Research Centre on Migration, Globalisation and Poverty.
Raymer, J., and G. Abel. 2008. "The MIMOSA model for estimating international migration flows in
the European Union." Pp. 13 in UNECE/Eurostat work session onmigration statistics Working
Papers. Geneva, Switzerland: UNECE/Eurostat.
Salt, John, and Ann Singleton. 1994. "International Migration: Data Availability." in Eurostat: causes
of international migration. Luxembourg.
Simmons, Alan B. 1987. "The United Nations Recommendations and Data Efforts: International
Migration Statistics." International Migration Review 21(4):996-1016.
Skeldon, Ronald. 2012. "Migration and its Measurement: Towards a More Robust Map of Bilateral
Flows." Pp. 229-48 in Handbook Of Research Methods In Migration, edited by Carlos Vargas-Silva.
Cheltenham: Edward Elgar Publishing Ltd.
Srinivasan, T. N. 1994. "Data base for development analysis Data base for development analysis: An
overview." Journal of Development Economics 44(1):3-27.
UN DESA Statistics Division. 1998. "Recommendations on Statistics of International Migration,
Revision 1." edited by United Nations. New York: United Nations Department of Economic and
Social Affairs Statistics Division.
—. 2004. "United Nations Demographic Yearbook review: National reporting of international
migration data, Implications for international recommendations." edited by United Nations. New
York: United Nations Department of Economic and Social Affairs Statistics Division.
Weil, François. 2007. "The French State and Transoceanic Emigration." in Citizenship and Those Who
Leave: The Politics of Emigration and Expatriation, edited by Nancy Green and François Weil.
Urbana and Chicago: University of Illinois Press.
Zlotnik, Hania. 1987. "The Concept of International Migration as Reflected in Data Collection
Systems." International Migration Review 21(4):925-46.
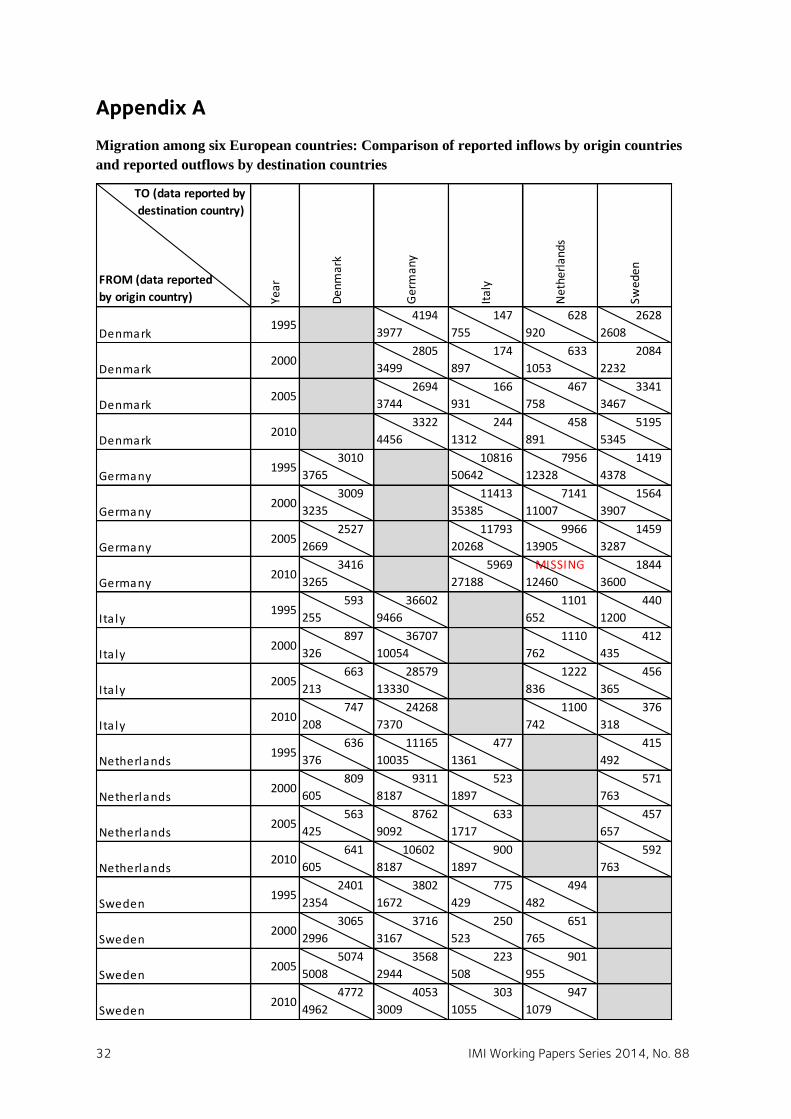
32 IMI Working Papers Series 2014, No. 88
Appendix A
Migration among six European countries: Comparison of reported inflows by origin countries
and reported outflows by destination countries
TO (data reported by
destination country)
FROM (data reported
by origin country) Year
Den
mar
k
Ger
man
y
Ital
y
Net
herl
ands
Swed
en
Denmark1995
4194
3977
147
755
628
920
2628
2608
Denmark2000
2805
3499
174
897
633
1053
2084
2232
Denmark2005
2694
3744
166
931
467
758
3341
3467
Denmark2010
3322
4456
244
1312
458
891
5195
5345
Germany 1995
3010
3765
10816
50642
7956
12328
1419
4378
Germany 2000
3009
3235
11413
35385
7141
11007
1564
3907
Germany 2005
2527
2669
11793
20268
9966
13905
1459
3287
Germany 2010
3416
3265
5969
27188
MISSING
12460
1844
3600
Ita ly1995
593
255
36602
9466
1101
652
440
1200
Ita ly2000
897
326
36707
10054
1110
762
412
435
Ita ly2005
663
213
28579
13330
1222
836
456
365
Ita ly2010
747
208
24268
7370
1100
742
376
318
Netherlands1995
636
376
11165
10035
477
1361
415
492
Netherlands2000
809
605
9311
8187
523
1897
571
763
Netherlands2005
563
425
8762
9092
633
1717
457
657
Netherlands2010
641
605
10602
8187
900
1897
592
763
Sweden1995
2401
2354
3802
1672
775
429
494
482
Sweden2000
3065
2996
3716
3167
250
523
651
765
Sweden2005
5074
5008
3568
2944
223
508
901
955
Sweden2010
4772
4962
4053
3009
303
1055
947
1079

IMI Working Papers Series 2014, No. 88 33
Appendix B
Contents and coverage of the DEMIG C2C database
Coverage: C = Citizens; F = Foreigners; B = Both (citizens and foreigners combined)
By country of residence By citizenship By country of birth
Country/Database Immigrants Emigrants Net
migration Coverage Immigrants Emigrants
Net
migration Coverage Immigrants Emigrants
Net
migration Coverage
Argentina
C2C 1949-55,
1958-73 - - - 1946-1976
1946-
1976
1946-
1976
F,
inflows - - - -
C2C - - - - 1980-1994, 00-11 F, res
perm - - - -
C2C gender - - - - - - - - - - - -
Australia
C2C 1946-2010 1946-
2010
1946-
2010 B 1948-2010
1948-
2010
1948-
2010 F, C
1959-
71&75/10
1959-
71&75/10
1959-
71&75/10 B
C2C gender 1946-2010 1946-
2010
1946-
2010 B 1948-2010
1948-
2010
1948-
2010 F, C
1959-
71&75/10
1959-
71&75/10
1959-
71&75/10 B
Austria
C2C 1996-2011 1996-
2011
1996-
2011 F, C, B 1996-2011
1996-
2011
1996-
2011 F, C
C2C gender 2002-2011 2002-
2011
2002-
2011 F, C, B 2002-2011
2002-
2011
2002-
2011 F, C
Belgium
C2C 1948-1991 1948-
1991
1948-
1991 B 1948-2009
1948-
2009
1948-
2009 F, C - - - -
C2C gender 1948-54 &
76-91
1948-54
& 76-91
1948-54
& 76-91 B 1948-54 & 74-09
1948-54
& 74-09
1948-54
& 74-09 F, C - - - -
Brazil
C2C 2005-2008 F, work
per 1946-1975
F,
inflows - - - -
C2C 2009-2012 F, permits 1965-1984, 98-04 F, res
perm
Canada
C2C 1956-2010 - - F 1964-2010 - - F 1961-2010 - - F
C2C gender 1966-2010 - - F 1980-2010 - - F 1980-2010 - - F
Chile
C2C - - - - 1995-2011 - - F, res
perm - - - -
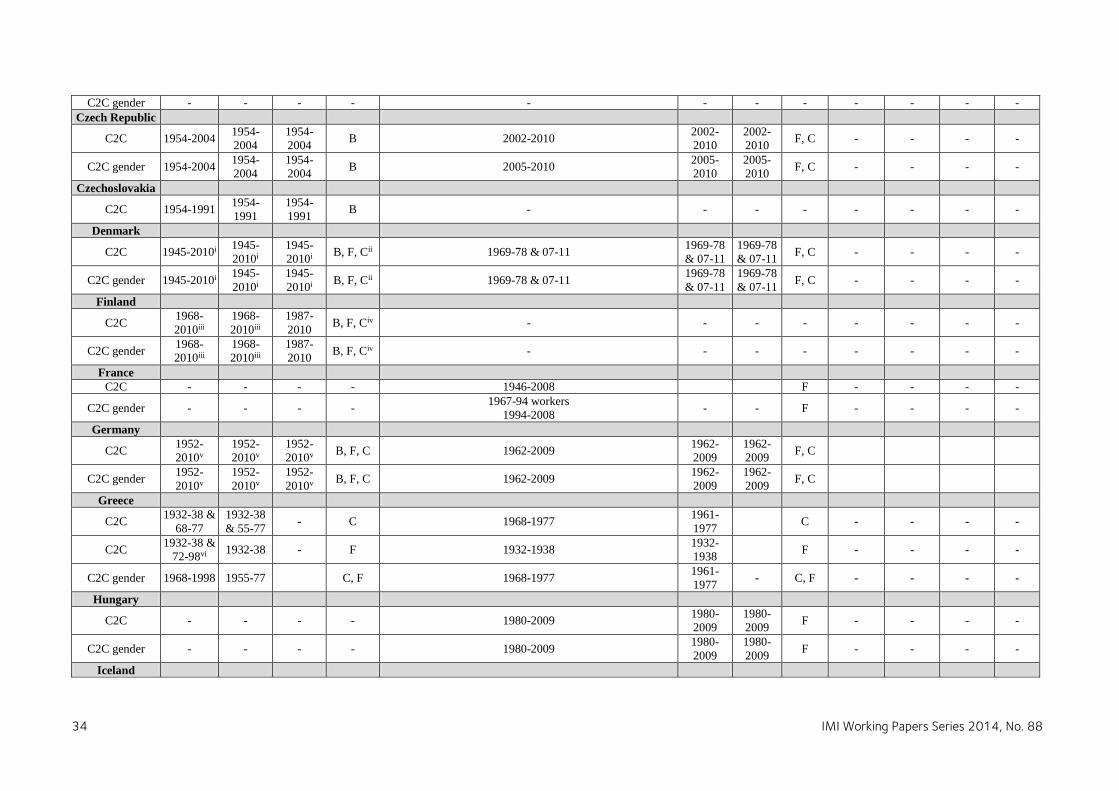
34 IMI Working Papers Series 2014, No. 88
C2C gender - - - - - - - - - - - -
Czech Republic
C2C 1954-2004 1954-
2004
1954-
2004 B 2002-2010
2002-
2010
2002-
2010 F, C - - - -
C2C gender 1954-2004 1954-
2004
1954-
2004 B 2005-2010
2005-
2010
2005-
2010 F, C - - - -
Czechoslovakia
C2C 1954-1991 1954-
1991
1954-
1991 B - - - - - - - -
Denmark
C2C 1945-2010i 1945-
2010i
1945-
2010i B, F, Cii 1969-78 & 07-11
1969-78
& 07-11
1969-78
& 07-11 F, C - - - -
C2C gender 1945-2010i 1945-
2010i
1945-
2010i B, F, Cii 1969-78 & 07-11
1969-78
& 07-11
1969-78
& 07-11 F, C - - - -
Finland
C2C 1968-
2010iii
1968-
2010iii
1987-
2010 B, F, Civ - - - - - - - -
C2C gender 1968-
2010iii
1968-
2010iii
1987-
2010 B, F, Civ - - - - - - - -
France
C2C - - - - 1946-2008 F - - - -
C2C gender - - - - 1967-94 workers
1994-2008 - - F - - - -
Germany
C2C 1952-
2010v
1952-
2010v
1952-
2010v B, F, C 1962-2009
1962-
2009
1962-
2009 F, C
C2C gender 1952-
2010v
1952-
2010v
1952-
2010v B, F, C 1962-2009
1962-
2009
1962-
2009 F, C
Greece
C2C 1932-38 &
68-77
1932-38
& 55-77 - C 1968-1977
1961-
1977 C - - - -
C2C 1932-38 &
72-98vi 1932-38 - F 1932-1938
1932-
1938 F - - - -
C2C gender 1968-1998 1955-77 C, F 1968-1977 1961-
1977 - C, F - - - -
Hungary
C2C - - - - 1980-2009 1980-
2009
1980-
2009 F - - - -
C2C gender - - - - 1980-2009 1980-
2009
1980-
2009 F - - - -
Iceland
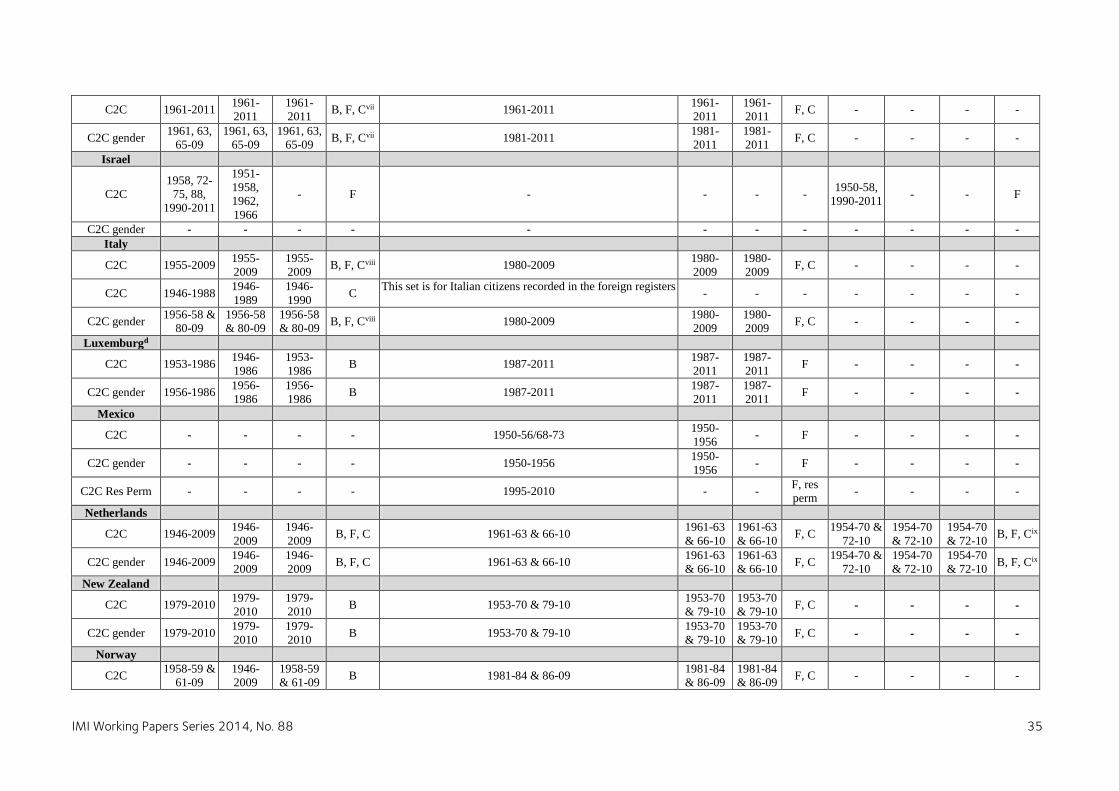
IMI Working Papers Series 2014, No. 88 35
C2C 1961-2011 1961-
2011
1961-
2011 B, F, Cvii 1961-2011
1961-
2011
1961-
2011 F, C - - - -
C2C gender 1961, 63,
65-09
1961, 63,
65-09
1961, 63,
65-09 B, F, Cvii 1981-2011
1981-
2011
1981-
2011 F, C - - - -
Israel
C2C
1958, 72-
75, 88,
1990-2011
1951-
1958,
1962,
1966
- F - - - - 1950-58,
1990-2011 - - F
C2C gender - - - - - - - - - - - -
Italy
C2C 1955-2009 1955-
2009
1955-
2009 B, F, Cviii 1980-2009
1980-
2009
1980-
2009 F, C - - - -
C2C 1946-1988 1946-
1989
1946-
1990 C
This set is for Italian citizens recorded in the foreign registers - - - - - - -
C2C gender 1956-58 &
80-09
1956-58
& 80-09
1956-58
& 80-09 B, F, Cviii 1980-2009
1980-
2009
1980-
2009 F, C - - - -
Luxemburgd
C2C 1953-1986 1946-
1986
1953-
1986 B 1987-2011
1987-
2011
1987-
2011 F - - - -
C2C gender 1956-1986 1956-
1986
1956-
1986 B 1987-2011
1987-
2011
1987-
2011 F - - - -
Mexico
C2C - - - - 1950-56/68-73 1950-
1956 - F - - - -
C2C gender - - - - 1950-1956 1950-
1956 - F - - - -
C2C Res Perm - - - - 1995-2010 - - F, res
perm - - - -
Netherlands
C2C 1946-2009 1946-
2009
1946-
2009 B, F, C 1961-63 & 66-10
1961-63
& 66-10
1961-63
& 66-10 F, C
1954-70 &
72-10
1954-70
& 72-10
1954-70
& 72-10 B, F, Cix
C2C gender 1946-2009 1946-
2009
1946-
2009 B, F, C 1961-63 & 66-10
1961-63
& 66-10
1961-63
& 66-10 F, C
1954-70 &
72-10
1954-70
& 72-10
1954-70
& 72-10 B, F, Cix
New Zealand
C2C 1979-2010 1979-
2010
1979-
2010 B 1953-70 & 79-10
1953-70
& 79-10
1953-70
& 79-10 F, C - - - -
C2C gender 1979-2010 1979-
2010
1979-
2010 B 1953-70 & 79-10
1953-70
& 79-10
1953-70
& 79-10 F, C - - - -
Norway
C2C 1958-59 &
61-09
1946-
2009
1958-59
& 61-09 B 1981-84 & 86-09
1981-84
& 86-09
1981-84
& 86-09 F, C - - - -

36 IMI Working Papers Series 2014, No. 88
C2C gender 58-59, 60-
84, 86-09x
58-59, 60-
84, 86-09x
1958-59
& 61-09 B 1981-84 & 86-09
1981-84
& 86-09
1981-84
& 86-09 F, C - - - -
Poland
C2C 1966-2011 1966-
2011
1966-
2011 B 2009-2011
2009-
2011 - F, C 2009-2011 - - F, C
C2C, COR Non
Perm Residence 2008-2011
2008-
2011
2008-
2011 B - - - - - - - -
C2C gender 2006-2011 2006-
2011
2006-
2011 B 2009-2011
2009-
2011 - F, C 2009-2011 - - F, C
Portugal
C2C
1946-72,
irreg
countries
1946-
2000,
patchy
- C 1946-54, 92-97, 08-10 1947-54 1947-54 F, C - - - -
C2C gender 1946-72,
excl 69
irreg,
more reg
from 1969
- C 1992-97, 08-10 - - F, C - - - -
Slovakia
C2C 1954-2010 1954-
2010
1954-
2010 B 1992-2010
1992-
2010
1992-
2010 F, Cxi - - - -
C2C gender 1954-2010 1954-
2010
1954-
2010 B 1992-2010
1992-
2010
1992-
2010 F, C - - - -
Slovenia
C2C
1982-
1994, 08-
09
1982-
1994, 08-
09
1982-
1994, 08-
09
B 1996-2009 1996-
2010
1996-
2011 F, C - - - -
C2C
1982-
1994, 08-
09
1982-
1994, 08-
09
1982-
1994, 08-
09
B 1996-2009 1996-
2010
1996-
2011 F, C - - - -
South Africa
C2C 1945-2003 1945-
2003
1945-
2003
B (F only
outflows) 1965-75, 99, 01-03
1965-75,
89-92, 99,
01-03
1965-75,
99, 01-03 F, C
1965-75,
99, 01-03
1965-
1975
1965-
1975 F, C
C2C gender 1999,
2001-2003
1999,
2001-
2003
1999,
2001-
2003
B 1999, 2001-2003
1999,
2001-
2003
1999,
2001-
2003
F, C 1999,
2001-2003
1999,
2001-
2003
1999,
2001-
2003
F, C
Spain
C2C 1946-58;
84-11
1946-58;
02-11
1946-58;
02-11 B 1988-2011
1988-
2011
1988-
2011 F, C 1988-2011
1988-
2011
1988-
2011 F, C, B
C2C 1946-71;
84-11
1945-60,
62-87, 02-
11
1945-60,
62-71,
84-87,
02-11
C - - - - - - - -
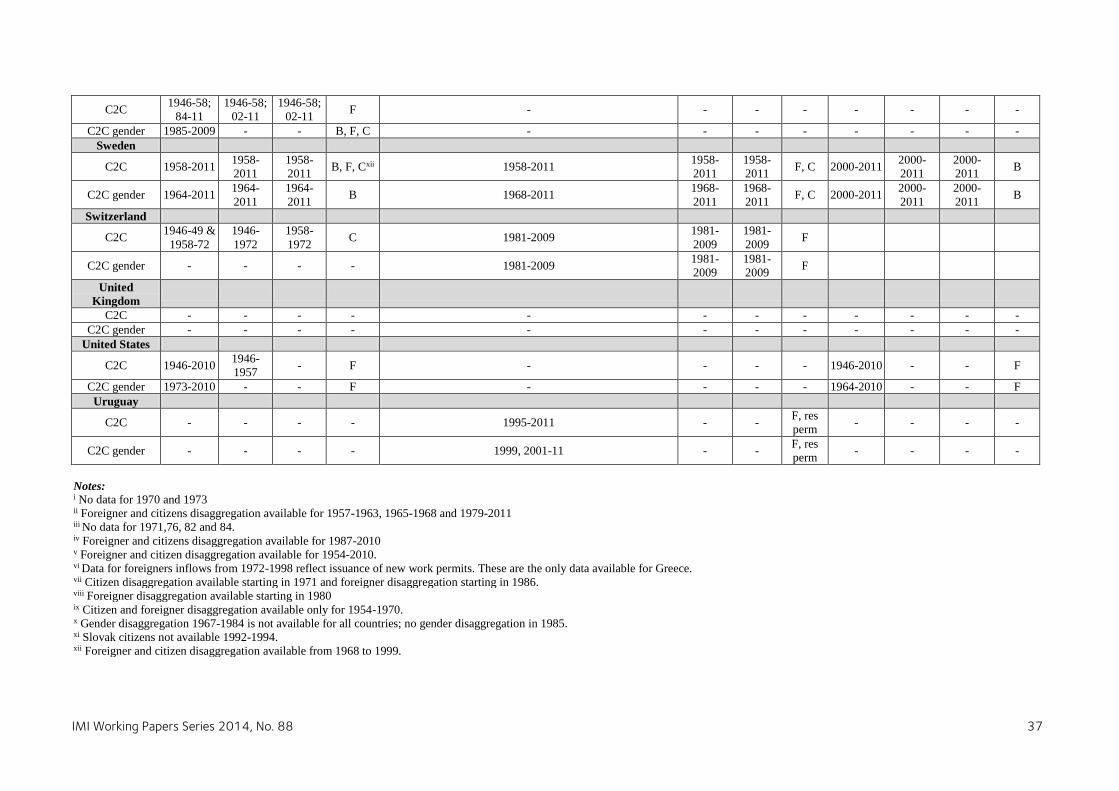
IMI Working Papers Series 2014, No. 88 37
C2C 1946-58;
84-11
1946-58;
02-11
1946-58;
02-11 F - - - - - - - -
C2C gender 1985-2009 - - B, F, C - - - - - - - -
Sweden
C2C 1958-2011 1958-
2011
1958-
2011 B, F, Cxii 1958-2011
1958-
2011
1958-
2011 F, C 2000-2011
2000-
2011
2000-
2011 B
C2C gender 1964-2011 1964-
2011
1964-
2011 B 1968-2011
1968-
2011
1968-
2011 F, C 2000-2011
2000-
2011
2000-
2011 B
Switzerland
C2C 1946-49 &
1958-72
1946-
1972
1958-
1972 C 1981-2009
1981-
2009
1981-
2009 F
C2C gender - - - - 1981-2009 1981-
2009
1981-
2009 F
United
Kingdom
C2C - - - - - - - - - - - -
C2C gender - - - - - - - - - - - -
United States
C2C 1946-2010 1946-
1957 - F - - - - 1946-2010 - - F
C2C gender 1973-2010 - - F - - - - 1964-2010 - - F
Uruguay
C2C - - - - 1995-2011 - - F, res
perm - - - -
C2C gender - - - - 1999, 2001-11 - - F, res
perm - - - -
Notes: i No data for 1970 and 1973 ii Foreigner and citizens disaggregation available for 1957-1963, 1965-1968 and 1979-2011 iii No data for 1971,76, 82 and 84. iv Foreigner and citizens disaggregation available for 1987-2010 v Foreigner and citizen disaggregation available for 1954-2010. vi Data for foreigners inflows from 1972-1998 reflect issuance of new work permits. These are the only data available for Greece. vii Citizen disaggregation available starting in 1971 and foreigner disaggregation starting in 1986. viii Foreigner disaggregation available starting in 1980 ix Citizen and foreigner disaggregation available only for 1954-1970. x Gender disaggregation 1967-1984 is not available for all countries; no gender disaggregation in 1985. xi Slovak citizens not available 1992-1994. xii Foreigner and citizen disaggregation available from 1968 to 1999.