unctad/dite/wid country profile - egyptunctad.org/sections/dite_fdistat/docs/wid_cp_eg_en.pdf ·...
TRANSCRIPT

Egypt A. Definitions and sources of data The Egyptian Investment Code (Investment Law No. 230/1989) does not provide an explicit definition of foreign direct investment (FDI). The code, however, defines foreign capital as the invested funds owned by a natural person enjoying the nationality of a foreign country other than the Arab countries, or by a juridical person of which the majority of the capital is owned by persons enjoying the nationality of a foreign country. The Central Bank of Egypt provides data on FDI in the country. The International Monetary Fund also provides FDI data in its balance-of-payment statistics. Historically petroleum has received the bulk of FDI into Egypt, although privatization and liberalization that picked up in the 1990s has prompted FDI in a range of industries, in particular cement, telecommunications and tourism. By 2002 the Government Egypt completed the sale of the majority of the public enterprises slated for privatization, garnering a large amount of revenues. However, the privatization programme is still on-going and some sales took place in 2005. The Government plans to accelerate the programme in the "strategic" areas, including telecommunications and other utilities (e.g. the Egyptian Electricity Authority). The Investment Code amended in 1995 has eliminated pre-incorporation approval and replaced it with a notification requirement for investment, facilitating investment to targeted economic sectors and promoting decentralization of industry from the crowded geographical areas. The law allows full foreign ownership and guarantees the right to remit income earned in Egypt and to repatriate capital. Other key provisions include: the guarantee against confiscation, sequestration and nationalization; the right to own land; the right to maintain foreign currency bank accounts; freedom from administrative attachment; the right to repatriate capital and profits; and equal treatment regardless of nationality. Under this law, approval is nearly automatic for specified sectors. The Egyptian legal system provides protection for real and personal property, but laws on real estate ownership are complex and titles to real property may be difficult to establish and trace. Egypt has signed quite a number of association agreements with a large number of countries and regional groupings. It has signed the Euro-Mediterranean Association Agreement with the European Union (EU). This agreement will improve bilateral relations with its largest trading partner, raise Egyptian exports to EU and encourage EU investment into Egypt. The progressive elimination of all tariffs on over one-third of Egypt’s imports will significantly increase competition in domestic markets, resulting in lower costs and promoting productivity gains in local industries. Egypt has bilateral treaties with Albania, Argentina, Belgium-Luxembourg, China, Czech Republic, Finland, France, Germany, Greece, Hungary, Indonesia, Italy, Japan, Kazakstan, Republic of Korea, Morocco, Netherlands, Poland, Romania, Spain, Sri Lanka, Sudan, Sweden, Switzerland, Tunisia, Turkmenistan, Uganda, Ukraine, United Kingdom, United States, Uzbekistan and Federal Republic of Yugoslavia. The country is a member of the Arab Maghreb Union, African Union, New Partnership for Africa's Development, Multilateral Investment Guarantee Agency and the World Trade Organization.
Posted November 2006
B. Statistics on FDI and the operations of TNCs

Table 1. Summary of FDI(Millions of dollars)
Variable Inward Outward1. FDI flows, 2002-2005 (annual average) 2 104.3 74.92. FDI flows as a percentage of GFCF, 2002-2005 (annual average) 15.2 0.53. FDI stock, 2005 28 881.9 967.34. FDI stock as a percentage of GDP, 2005 31.0 1.0Source: Based on tables 3a, 4 and UNCTAD, FDI/TNC database.
UNCTAD WID Country Profile: EGYPT Page 3 of 19

Table 3a. FDI flows, by type of investment, 1980-2005
(Millions of dollars)
Inward investment Outward investment
Year
1980 .. .. 548.3 548.3 .. .. 7.0 7.01981 .. .. 752.6 752.6 .. .. 6.0 6.01982 .. .. 293.6 293.6 .. .. 8.0 8.01983 .. .. 490.0 490.0 .. .. 19.0 19.01984 .. .. 729.1 729.1 .. .. 16.0 16.01985 .. .. 1 177.6 1 177.6 .. .. 3.0 3.01986 .. .. 1 217.4 1 217.4 .. .. 6.0 6.01987 .. .. 947.7 947.7 .. .. 19.0 19.01988 .. .. 1 190.0 1 190.0 .. .. 12.0 12.01989 .. .. 1 250.2 1 250.2 .. .. 22.6 22.61990 .. .. .. 734.0 .. .. .. 12.01991 .. .. .. 253.0 .. .. .. 62.01992 .. .. .. 459.0 .. .. .. 4.01993 .. .. .. 1 206.5 .. .. .. 25.01994 .. .. .. 1 133.4 .. .. .. 62.31995 .. .. .. 595.2 .. .. .. 34.21996 .. .. .. 636.4 .. .. .. 4.91997 .. .. .. 886.9 .. .. .. 165.91998 .. .. .. 1 075.5 .. .. .. 45.51999 .. .. .. 1 065.3 .. .. .. 37.52000 .. .. .. 1 235.4 .. .. .. 51.22001 .. .. .. 509.9 .. .. .. 12.42002 .. .. .. 646.9 .. .. .. 27.82003 .. .. .. 237.4 .. .. .. 20.72004 .. .. .. 2 157.4 .. .. .. 158.92005 .. .. .. 5 375.6 .. .. .. 92.0
Source : UNCTAD, FDI/TNC database. Note : FDI flows: IMF for 1980-1989 and Central bank of Egypt for 1990-2005. FDI inflows started to include investment inthe petroleum sector in the third quarter of 2004.
Equity Reinvested earnings
Intra-company
loansTotalEquity Reinvested
earnings
Intra-company
loansTotal
UNCTAD WID Country Profile: EGYPT Page 4 of 19

Table 4. FDI stock, by type of investment, 1980-2005
(Millions of dollars)
Inward Investment Outward Investment
Year1980 .. .. .. 2 260.4 .. .. .. 39.01981 .. .. .. 3 013.0 .. .. .. 45.01982 .. .. .. 3 306.5 .. .. .. 53.01983 .. .. .. 3 796.5 .. .. .. 72.01984 .. .. .. 4 525.7 .. .. .. 88.01985 .. .. .. 5 703.2 .. .. .. 91.01986 .. .. .. 6 920.7 .. .. .. 97.01987 .. .. .. 7 868.4 .. .. .. 116.01988 .. .. .. 9 058.4 .. .. .. 128.01989 .. .. .. 10 308.6 .. .. .. 150.61990 .. .. .. 11 042.6 .. .. .. 162.61991 .. .. .. 11 295.6 .. .. .. 224.61992 .. .. .. 11 754.6 .. .. .. 228.61993 .. .. .. 12 961.1 .. .. .. 253.61994 .. .. .. 14 094.5 .. .. .. 315.91995 .. .. .. 13 354.6 .. .. .. 350.11996 .. .. .. 13 991.0 .. .. .. 355.01997 .. .. .. 14 877.9 .. .. .. 520.91998 .. .. .. 15 953.4 .. .. .. 566.41999 .. .. .. 17 018.7 .. .. .. 603.92000 .. .. .. 18 254.1 .. .. .. 655.12001 .. .. .. 18 764.0 .. .. .. 667.52002 .. .. .. 21 111.5 .. .. .. 695.72003 .. .. .. 21 348.9 .. .. .. 716.42004 .. .. .. 23 506.3 .. .. .. 875.32005 .. .. .. 28 881.9 .. .. .. 967.3
Source : UNCTAD, FDI/TNC database. Note : FDI inward stock: Data prior to 1995 are estimated by accumulating inflows since 1970, 1996-2001are estimated by adding inflows to the stock of 1995, 1995 and 2002-2005 are based on Central bank ofEgypt. FDI outward stock: Data prior to 2002 are estimated by accumulating outflows since 1977, 2002-2004 are based on Central bank of Egypt, 2005 is estimated by adding flows to the 2004 stock.
Equity Reinvested earnings
Intra-company
loansTotal Equity Reinvested
earnings
Intra-company
loansTotal
UNCTAD WID Country Profile: EGYPT Page 5 of 19

Sector/industry 2001 2002 2003 2004Total 1 215 1 847 2 114 2 869
Primary 167 225 66 161Agriculture, hunting, forestry and fishing 63 175 38 131Mining, quarrying and petroleum 104 50 28 30
Secondary 624 542 842 1 493Food, beverages and tobacco 142 148 168 534Textiles, clothing and leather 15 131 208 225Wood and wood products 5 2 3 2Chemicals and chemical products 462 261 463 732
Tertiary 424 1 080 1 206 1 215Finance 424 1 080 1 206 1 215
Source: Central Bank of Egypt, unpublished.
Region/economy 2001 2002 2003World 509.9 646.9 237.4Unspecified - 95.1 - 131.9 - 73.7
Developed economies 599.6 774.6 249.7Western Europe 393.0 544.4 85.2
European Union 387.6 539.7 82.5France 207.6 60.9 1.1Germany 18.2 23.9 15.7Greece .. 1.2 0.2Italy 1.2 2.2 0.5Netherlands .. 285.4 3.2Portugal 38.8 .. ..Spain 83.0 133.3 45.0United Kingdom 38.8 32.8 16.8
Other Western Europe 5.4 4.7 2.7Switzerland 5.4 4.7 2.7
North America 206.6 230.1 162.3United States .. 1.2 0.3Canada 206.6 228.9 162.0
Other developed economies .. 0.1 2.2Japan .. 0.1 2.2
Developing economies 5.4 4.2 61.4Africa .. 0.2 0.2
North Africa .. 0.2 0.2Libyan Arab Jamahiriya .. 0.2 ..Tunisia .. .. 0.2
Latin America and the Caribbean 0.1 .. ..Mexico 0.1 .. ..
Asia and the Pacific 5.3 4.0 61.2West Asia 5.3 4.0 61.2
Bahrain 0.4 0.5 9.5Jordan .. 0.9 1.5Kuwait 2.4 2.0 26.1Lebanon .. .. 15.0Saudi Arabia 2.4 0.6 5.6United Arab Emirates 0.1 .. 3.5
Source: Central Bank of Egypt, unpublished.a Total in this table differ from the totals in table 3a because not all countries are reported. The balance of all countries will normally equal the total in table 3a.
Table 5. FDI flows in the host economy, by industry, 2001-2004 (Millions of Egyptian pounds)
Table 6. FDI flows in host economy, by geographical origin, 2001-2003a
(Millions of dollars)
UNCTAD WID Country Profile: EGYPT Page 6 of 19

Economy 1990 1991 1992 1993 1994 1995 1996 1997 1998 1999 2000 2001 2002 2003 2004Algeria .. .. .. .. .. .. .. .. 0.1 0.0 0.1 363.0 .. .. ..Armenia .. .. .. .. .. .. .. .. 0.1 .. .. .. .. .. ..Austria .. .. .. .. .. 0.5 0.3 - 0.2 .. .. .. .. .. .. ..Bangladesh .. .. .. .. .. .. .. .. .. .. .. .. .. .. 20.0Belgium / Luxembourg .. - 3.5 0.2 0.2 0.1 .. 2.1 - 0.6 - 3.3 1.1 .. .. .. .. ..Chile .. .. 0.0 0.0 .. .. .. .. .. .. .. .. .. .. ..China .. .. .. 0.1 0.4 0.1 .. .. 0.1 0.2 0.7 .. .. .. ..Cyprus .. .. .. .. .. .. .. 2.5 2.7 .. 0.9 6.6 8.7 1.5 ..Czech Republic .. .. .. .. .. .. .. .. .. .. .. 0.0 .. .. ..Denmark .. .. .. .. 0.3 .. .. .. .. .. .. .. .. .. ..France .. 17.5 - 0.2 0.2 18.4 2.6 1.8 4.3 .. .. .. .. .. .. ..Germany - 1.2 1.2 .. .. 1.2 .. - 2.6 - 2.3 .. 1.1 12.0 6.3 - 14.1 16.9 9.9Hungary .. .. .. .. .. .. .. .. .. 0.0 0.0 0.4 0.2 - 0.1 ..Lithuania .. .. .. .. .. .. .. .. .. .. .. .. .. 0.0 ..Malaysia .. .. .. .. 1.1 .. .. .. .. .. .. .. 0.1 .. ..Philippines .. .. .. .. .. .. .. .. .. .. .. .. .. .. ..Poland .. .. .. .. .. .. .. .. - 0.1 - 0.4 .. .. .. .. ..Portugal .. .. .. .. .. .. .. .. 0.0 .. .. .. .. .. ..Russian Federation .. .. .. .. .. .. .. .. .. .. .. .. 38.0 .. ..Saudi Arabia 1.0 2.0 1.0 3.0 .. .. .. .. 1.0 .. .. 10.0 29.0 25.9 16.6Sweden .. .. .. .. .. .. .. .. .. .. .. .. 2.5 .. ..Tunisia .. 0.1 .. .. .. .. .. .. .. .. .. .. .. .. ..United States 9.0 - 4.0 1.0 - 4.0 - 59.0 - 7.0 - 1.0 - 1.0 - 19.0 3.0 - 17.0 16.0 - 14.0 - 18.0 - 41.0Source : UNCTAD, FDI/TNC database.Note: Data are based on information reported by the economies listed above.
Table 9. FDI flows abroad, by geographical destination, 1990-2004
(Millions of dollars)
UNCTAD WID Country Profile: EGYPT Page 7 of 19

Sector/industry 1995Total 45 272
Primary 1 833Agriculture, hunting, forestry and fishing 1 833
Secondary 21 475Tertiary 21 964
Construction 1 916Transport, storage and communications 5 703Finance 11 771Other services 2 574
Source: Central Bank of Egypt, unpublished.
Region/economy 1995Total 15 780.2
Developed economies 11 355.2North America 2 672.9
Canada 32.4United States 2 640.4
Other Developed Countries 769.3Australia 42.8Japan 726.5
Europe 7 913.0European Union 6 443.1
Austria 152.5Belgium 51.3Cyprus 14.5Czech Republic 6.8Denmark 128.0Finland 24.2France 943.7Germany 705.9Greece 25.4Ireland 641.9Italy 919.2Luxembourg 800.9Netherlands 441.9Poland 52.2Spain 64.6Sweden 96.8United Kingdom 1 373.5
Other developed Europe 1 469.9Norway 66.1Switzerland 1 403.8
Developing economies 1 432.7Latin America and the Caribbean 918.6
Panama 918.6Asia and Oceania 514.2
Asia 514.2West Asia 164.9
Iran, Islamic Republic of 150.7Turkey 14.2
South, East and South-east Asia 349.3China 64.6Hong Kong, China 48.1Korea, Republic of 57.2Taiwan Province of China 26.3India 84.7Malaysia 37.2Singapore 31.3
South-East Europe and the Commonwealth of Independent States 159.9Romania 142.2Russian Federation 11.5Ukraine 6.2
Source: Central Bank of Egypt.Note: Data are based on approvals.
Table 11. FDI stock in the host economy, by industry, 1995
(Millions of Egyptian pounds)
Table 12b. FDI stock in the host economy, by geographical origin, 1995
(Millions of dollars)
UNCTAD WID Country Profile: EGYPT Page 8 of 19

Economy 1990 1991 1992 1993 1994 1995 1996 1997 1998 1999 2000 2001 2002 2003 2004Austria .. .. .. .. .. .. .. .. 0.1 3.1 3.3 2.5 0.8 .. ..Brazil .. .. .. .. .. .. .. .. .. .. .. .. .. .. ..Canada 35 15 9 7 .. .. 29 19 21 33 26 23 .. .. ..Cyprus .. .. .. .. .. .. .. .. .. .. .. .. 11 .. ..Denmark .. .. .. .. 18 .. 17 .. .. .. .. .. .. .. ..France .. .. .. .. .. .. .. .. 250 .. .. .. .. .. ..Germany 153 140 97 77 104 102 89 140 203 229 286 330 386 455 ..Malaysia .. .. 7 9 9 9 9 7 11 11 15 15 22 .. ..Netherlands 653 651 622 584 453 483 482 577 784 854 1 099 958 1 034 1 476 ..New Zealand .. .. .. .. .. .. .. .. .. 2 2 .. .. .. ..Poland .. .. .. .. .. .. 4 4 4 .. .. .. .. .. ..Portugal .. .. .. .. .. .. .. .. .. .. 458 433 .. .. ..Switzerland .. .. .. 77 106 136 143 224 257 295 370 359 298 273 ..United Kingdom 141 99 17 71 81 115 102 228 255 837 1 142 .. .. .. ..United States 1 231 1 246 1 334 1 510 1 090 1 093 1 366 1 603 1 963 2 210 1 998 2 557 2 682 3 518 4 240Source : UNCTAD, FDI/TNC database.Note: Data are based on information reported by the economies listed above.
Economy 1990 1991 1992 1993 1994 1995 1996 1997 1998 1999 2000 2001 2002 2003 2004Armenia .. .. .. .. .. .. .. .. 0.1 0.1 0.1 0.1 0.1 0.1 ..Austria .. .. .. .. .. .. .. .. 0.2 0.2 0.2 0.2 0.2 .. ..Brazil .. .. .. .. .. .. .. .. .. .. .. .. .. .. ..Cyprus .. .. .. .. .. .. .. .. .. .. .. .. 25.2 .. ..Denmark .. .. .. .. -0.5 .. .. .. .. .. .. .. .. .. ..Germany .. .. 15.5 14.5 16.1 18.8 17.4 15.1 16.7 .. .. .. .. .. ..Hungary .. .. .. .. .. .. .. .. 0.6 0.6 .. 5.1 6.6 7.1 ..Lithuania .. .. .. .. .. .. .. .. .. .. .. .. .. 0.7 ..Poland .. .. .. .. .. .. .. .. 0.1 0.4 .. .. .. .. ..Portugal .. .. .. .. .. .. 0.1 0.1 0.1 0.1 0.1 0.1 0.1 0.1 ..Russian Federation .. .. .. .. .. .. .. .. .. .. .. .. 38 .. ..Saudi Arabia .. .. .. .. .. .. .. .. .. .. .. .. .. .. 100Syrian Arab Republic .. .. .. .. .. .. .. .. .. .. .. .. .. 3 ..Turkey .. .. .. .. .. .. .. .. .. .. .. 18 .. .. ..United Rep of Tanzania .. .. .. .. .. .. .. .. 3 .. .. .. .. .. ..United States 1 8 42 37 6 -1 31 44 16 8 -4 12 1 -16 -58Source : UNCTAD, FDI/TNC database.Note: Data are based on information reported by the economies listed above.
Table 12a. FDI stock in the host economy, by geographical origin, 1990-2004(Millions of dollars)
Table 15. FDI stock abroad, by geographical destination, 1990-2004
(Millions of dollars)
UNCTAD WID Country Profile: EGYPT Page 9 of 19
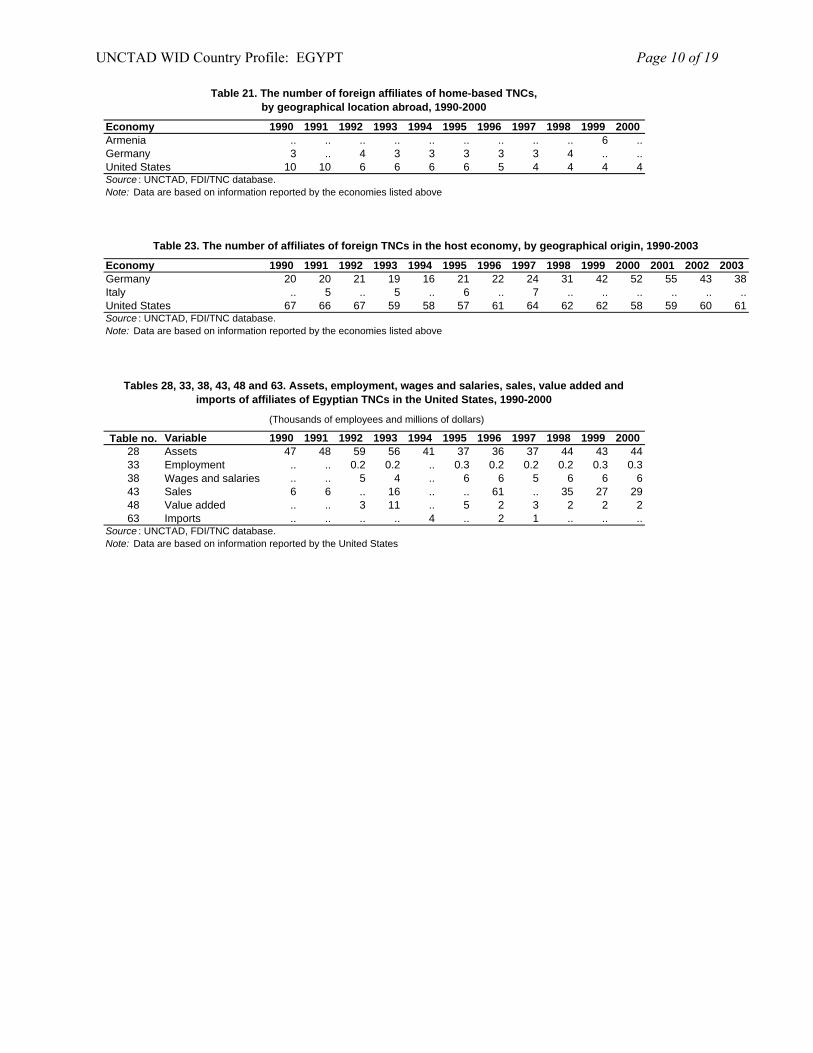
Economy 1990 1991 1992 1993 1994 1995 1996 1997 1998 1999 2000Armenia .. .. .. .. .. .. .. .. .. 6 ..Germany 3 .. 4 3 3 3 3 3 4 .. ..United States 10 10 6 6 6 6 5 4 4 4 4Source : UNCTAD, FDI/TNC database.Note: Data are based on information reported by the economies listed above
Economy 1990 1991 1992 1993 1994 1995 1996 1997 1998 1999 2000 2001 2002 2003Germany 20 20 21 19 16 21 22 24 31 42 52 55 43 38Italy .. 5 .. 5 .. 6 .. 7 .. .. .. .. .. ..United States 67 66 67 59 58 57 61 64 62 62 58 59 60 61Source : UNCTAD, FDI/TNC database.Note: Data are based on information reported by the economies listed above
Table no. Variable 1990 1991 1992 1993 1994 1995 1996 1997 1998 1999 200028 Assets 47 48 59 56 41 37 36 37 44 43 4433 Employment .. .. 0.2 0.2 .. 0.3 0.2 0.2 0.2 0.3 0.338 Wages and salaries .. .. 5 4 .. 6 6 5 6 6 643 Sales 6 6 .. 16 .. .. 61 .. 35 27 2948 Value added .. .. 3 11 .. 5 2 3 2 2 263 Imports .. .. .. .. 4 .. 2 1 .. .. ..
Source : UNCTAD, FDI/TNC database.Note: Data are based on information reported by the United States
Tables 28, 33, 38, 43, 48 and 63. Assets, employment, wages and salaries, sales, value added and imports of affiliates of Egyptian TNCs in the United States, 1990-2000
Table 21. The number of foreign affiliates of home-based TNCs, by geographical location abroad, 1990-2000
Table 23. The number of affiliates of foreign TNCs in the host economy, by geographical origin, 1990-2003
(Thousands of employees and millions of dollars)
UNCTAD WID Country Profile: EGYPT Page 10 of 19

Economy 1990 1991 1992 1993 1994 1995 1996 1997 1998 1999 2000 2001 2002 2003Germany 335 330 248 174 194 279 257 391 777 804 837 793 .. ..United States 3 146 2 705 2 555 2 666 2 723 2 893 3 621 3 828 5 063 5 672 6 314 6 951 7 109 8 109Source : UNCTAD, FDI/TNC database.Note: Data are based on information reported by the economies listed above.
Economy 1990 1991 1992 1993 1994 1995 1996 1997 1998 1999 2000 2001 2002 2003Belgium .. .. .. .. .. .. .. .. .. .. .. 0.1 .. ..Germany 4.0 4.0 3.0 3.0 3.0 4.0 4.0 4.0 4.0 6.0 8.0 8.0 8.0 7.0Italy .. 3.4 .. 3.5 .. 4.3 .. 4.9 .. .. .. .. .. ..Switzerland .. .. .. 8.1 5.6 6.3 6.0 8.2 9.8 8.4 8.5 8.3 8.0 7.8United States 13.0 14.0 14.0 15.8 16.2 15.5 12.5 24.5 26.5 25.3 30.0 31.6 30.8 29.7Source : UNCTAD, FDI/TNC database.Note: Data are based on information reported by the economies listed above.
Table no. Variable 1990 1991 1992 1993 1994 1995 1996 1997 1998 1999 2000 2001 2002 200340 Wages and salaries 102 91 103 115 122 147 145 214 228 251 248 247 245 24250 Value added a .. .. .. .. 699 840 930 921 668 1 090 1 162 1 395 1 474 1 624
Source : UNCTAD, FDI/TNC database.Note: Data are based on information reported by the economies listed above.a Majority-owned affiliates of United States TNCs.
Economy 1990 1991 1992 1993 1994 1995 1996 1997 1998 1999 2000 2001 2002 2003Germany 248 181 192 181 246 279 332 346 511 639 737 716 753 1 467Italy .. 736.1 .. 528.8 .. 536.6 .. 633.2 .. .. .. .. .. ..United States 2 512 2 375 2 524 2 495 2 632 3 011 3 258 3 565 3 387 4 352 5 245 5 304 5 117 5 680Source : UNCTAD, FDI/TNC database.Note: Data are based on information reported by the economies listed above.
Table 30. Assets of affiliates of foreign TNCs in the host economy, by geographical origin, 1990-2003 (Millions of dollars)
Table 35. Employment of affiliates of foreign TNCs in the host economy, by geographical origin, 1990-2003
(Millions of dollars)
(Thousands of employees)
Tables 40 and 50. Wages and salaries and value added of affiliates of United States TNCs in Egypt, 1990-2003 (Millions of dollars)
Table 45. Sales of affiliates of foreign TNCs in the host economy, by geographical origin, 1990-2003
UNCTAD WID Country Profile: EGYPT Page 11 of 19
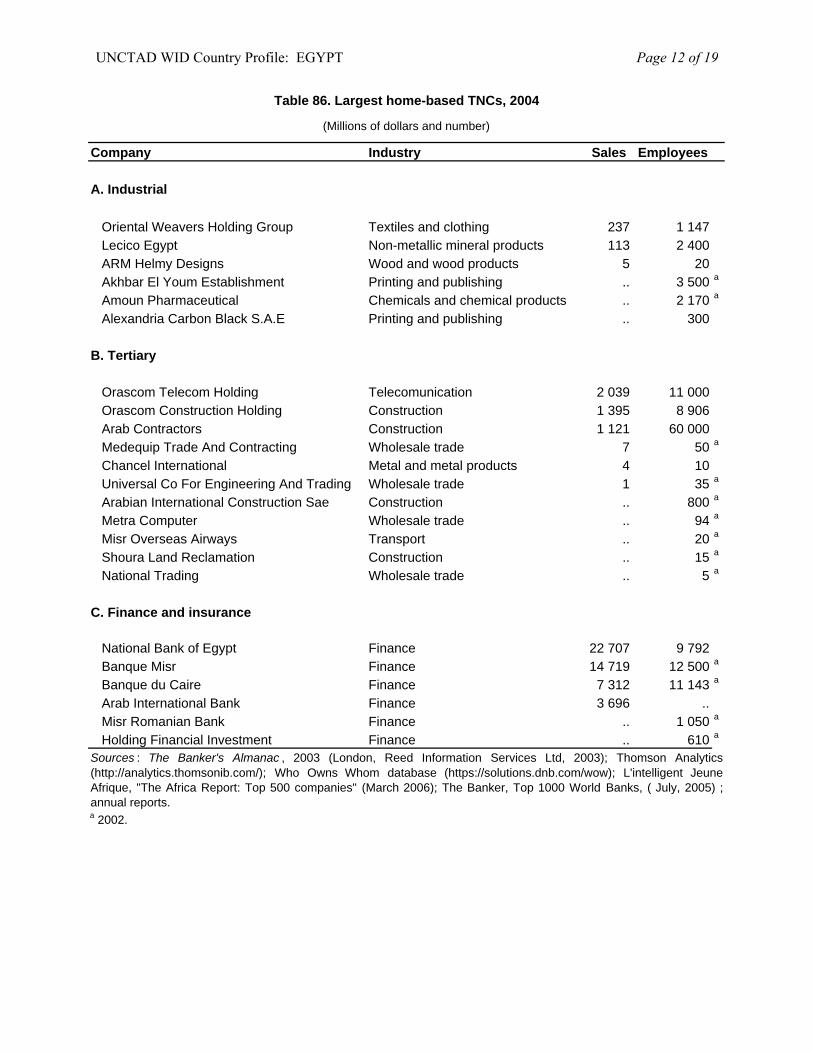
Table 86. Largest home-based TNCs, 2004
(Millions of dollars and number)
Company Industry Sales Employees
A. Industrial
Oriental Weavers Holding Group Textiles and clothing 237 1 147Lecico Egypt Non-metallic mineral products 113 2 400ARM Helmy Designs Wood and wood products 5 20Akhbar El Youm Establishment Printing and publishing .. 3 500 a
Amoun Pharmaceutical Chemicals and chemical products .. 2 170 a
Alexandria Carbon Black S.A.E Printing and publishing .. 300
B. Tertiary
Orascom Telecom Holding Telecomunication 2 039 11 000Orascom Construction Holding Construction 1 395 8 906Arab Contractors Construction 1 121 60 000Medequip Trade And Contracting Wholesale trade 7 50 a
Chancel International Metal and metal products 4 10Universal Co For Engineering And Trading Wholesale trade 1 35 a
Arabian International Construction Sae Construction .. 800 a
Metra Computer Wholesale trade .. 94 a
Misr Overseas Airways Transport .. 20 a
Shoura Land Reclamation Construction .. 15 a
National Trading Wholesale trade .. 5 a
C. Finance and insurance
National Bank of Egypt Finance 22 707 9 792Banque Misr Finance 14 719 12 500 a
Banque du Caire Finance 7 312 11 143 a
Arab International Bank Finance 3 696 ..Misr Romanian Bank Finance .. 1 050 a
Holding Financial Investment Finance .. 610 a
a 2002.
Sources : The Banker's Almanac , 2003 (London, Reed Information Services Ltd, 2003); Thomson Analytics(http://analytics.thomsonib.com/); Who Owns Whom database (https://solutions.dnb.com/wow); L'intelligent JeuneAfrique, "The Africa Report: Top 500 companies" (March 2006); The Banker, Top 1000 World Banks, ( July, 2005) ;annual reports.
UNCTAD WID Country Profile: EGYPT Page 12 of 19

Table 87. Largest affiliates of home-based TNCs, 2004
(Millions of dollars and number)
Company Host economy Industry Sales Employees
A. Industrial
Oriental Weavers Rug Manufacturing United States Textiles and clothing 57 460 a
Oriental Weavers United Kingdom Textiles and clothing 10 15
B. Tertiary
Dynatrade Switzerland Wholesale trade 50 10T & H Gulf Distribution Fzco United Arab Emirates Wholesale trade 25 6 a
Lecico United Kingdom Wholesale trade 22 10Libertis Telecom SA Congo Telecomunication 17 138A Hak Middle East Services Cyprus Construction 4 ..Apic USA United States Wholesale trade 3 18 a
Multilateral Trade France France Wholesale trade 3 5Amitrade United States Other business services 1 7 a
A C B (UK) United Kingdom Wholesale trade .. 9Ariana Afghan Airlines United Kingdom Transport .. 5 a
Elnasr France SARL France Wholesale trade .. 4MS Universal United States Wholesale trade .. 3 a
Medequip France France Wholesale trade .. 3 a
Holland, Hannen & Cubitts United Kingdom Construction .. ..
C. Finance and insurance
Misr Romanian Bank Cairo Sucursala Bucuresti Romania Finance .. 47 a
Misr Bank Europe Germany Finance .. 17 a
a 2002.
Sources: The Banker's Almanac , 2003 (London, Reed Information Services Ltd, 2003); Thomson Analytics(http://analytics.thomsonib.com/); Who Owns Whom database (https://solutions.dnb.com/wow).
UNCTAD WID Country Profile: EGYPT Page 13 of 19

Table 88. Largest affiliates of foreign TNCs in the host economy, 2004
(Millions of dollars and number)
Company Home economy Industry Sales Employees
A. Industrial
Exxon Mobil Egypt United States Petroleum 718 ..Assiut Cement Mexico Non-metallic mineral products 137 3 550Ahram Beverages Company Switzerland Food products, beverages and tabacco 99 3 100Unilever Mashreq United Kingdom Chemicals and chemical products 72 3 000Transport & Engineering France Rubber and plastic products 64 3 700Dsm Anti Infectives Netherlands Chemicals and chemical products 29 35Fayoum Gas United Kingdom Petroleum 27 100ABB High Voltage Switzerland Electrical and electronic equipments 24 150Nissan Motor Egypt Japan Motor vehicles and trailers 19 300Dow Mideast Systems United States Chemicals and chemical products 15 100Pharma Swede-Egypt Sweden Chemicals and chemical products 14 40Duravit Egypt Germany Non-metallic mineral products 13 50Egyptian German Telecommunication Industry Germany Electrical and electronic equipments 8 120Gianaclis Vineyards for Beverages Switzerland Food products, beverages and tabacco 8 100Energizer Egypt United States Chemicals and chemical products 8 314
B. Tertiary
Egyptian Mobile Services France Telecommunications 727 1000Vodafone Egypt Telecommunications United Kingdom Telecommunications 718 1 600Bauer Egypt Soil Engineering & Foundations Germany Construction 64 200Toyota Egypt United Arab Emirates Wholesale trade 32 80Alkan Establishment India Wholesale trade 19 850Astrazeneca Egypt United Kingdom Wholesale trade 16 160General Electric International United States Wholesale trade 13 60Henkel Trading Egypt Germany Research and development 13 510Port Said Detergents & Chemical Industries Germany Distributive trade 12 510Va Tech Transmission & Distribution France Wholesale trade 12 500Bardissy Import United States Wholesale trade 11 156PGS Data Processing United States Other business activities 8 70Ferrostaal Egypt Germany Wholesale trade 8 ..Pepperl & Fuchs Egypt Germany Wholesale trade 6 20Egytrade Import and Export Germany Wholesale trade 5 65
C. Finance and insurance Assets Employees
Commercial International Bank United States Finance 4 268 1 613Suez Canal Bank Libya Finance 2 405 984Egyptian American Bank United States Finance 1 763 3 700National Societe Generale Bank France Finance 1 459 721HSBC Bank Egypt United Kingdom Finance 986 888Cairo Barclays Bank United Kingdom Finance 832 318Egyptian Saudi Finance Bank Saudi Arabia Finance 500 568Arab Banking Corporation-Egypt Kuwait Finance 468 392
a 2003. b 2001. c 2002. d 2000.
Sources: The Banker's Almanac, 2003 (London, Reed Information Services, 2003); Thomson Analytics (http://analytics.thomsonib.com/);WhOwns Whom database (https://solutions.dnb.com/wow); L'intelligent Jeune Afrique, "The Africa Report: Top 500 companies" (March 2006).
UNCTAD WID Country Profile: EGYPT Page 14 of 19

C. Legal frameworks for transnational corporations Egypt had adopted a number of legal instruments for regulating the activities of transnational corporations and foreign investors. The key among these instruments include: I. National framework Law No. 230 of 20 July 1989 promulgating the Investment Code, effective: 21 July 1989. Source: Al Jaridah al Rasmiyah, Official Gazette No. 29 of 20 July 1989, and International Center for Settlement of Investment Disputes (ICSID), Investment Laws of the World, Release 90-2, June 1990, p. 1 (English Translation), and Official Publication - A.R Egypt. General Authority for Investment (Cairo) - "Investment Law No. 230/1989." As amended by Decree No. 9 of 23 March 1995. Source: Official Publication - A.R Egypt. General Authority for Investment, Cairo. Privileges and Exemptions Granted by Investment Law No. 230/1989. Source: Official Publication - A.R. Egypt. General Authority for Investment, "Privileges and Exemptions Granted by Investment Law No. 230/1989", Cairo. Executive Regulations concerning Investment Law No. 230/1989. Decree of the Prime Minister No. 363 of 31 January 1995. Amends and replaces Decree No. 1531 of 1989. Source: General Authority for Investment, 8 Adly Street, Cairo. Decree issued by the General Authority for Investment and Free Zones of April 1992- to streamline investment procedures. Source: General Authority for Investment, "Egypt's Free Zones", Cairo. Banking Law No. 37 and 95/1992 of 1 June 1992. Source: Capital Market Authority, Cairo. Law No. 203 on Public-Sector Business Enterprises of 1991. Source: World Bank, Technical Paper No. 186, "Divestiture of State Enterprises". An overviews of the legal framework. Prime Minister Decree No. 1590/1991 on the implementing regulations for law No. 203/1991 of 1991. Source: World Bank,_ Technical Paper No. 186, "Divestiture of State Enterprises". An overviews of the legal framework. Decree No. 27 of 1986 concerning Industrial Investment in New Cities. Source: International Bureau of Fiscal Documentation ATS, suppl. No. 91/92 of July 1994. Decision No. 7 of 1982 by the Minister of Investment Affairs and International Co-operation. Source: Official Gazette, No. 214, 16 September 1982. Law No. 56 off 17 November 1979 regulating ownership of real estate property by non-Egyptians Source: Official Gazette, No. 48 of 29 November 1979, and Graham & Trotman Ltd., (ed.), Business Laws of Egypt (BLE), vol. III, 1985, p. 3.7-1 - 3.8-23 (loose-leaf edition, English translation). Law No. 120 of 1982 regulating Activities of Commercial Agents and Certain Activities of Commercial Intermediaries, effective on 4 May 1983. Source: Official Gazette, No. 31 of 5 August 1982, and Business Laws of Egypt, vol. I, pp. 1.4-1 - 1.4-24 (English translation). Decision No. 342 of 1982, Ministry of Economy and Foreign Trade Implementing Law No. 120 of 1982, effective on 5 August 1983. Source: Official Gazette, May 1983.
UNCTAD WID Country Profile: EGYPT Page 15 of 19

Company Law No. 159 of 1981. Source: Business Laws of Egypt, vol. I, pp. 1.2-1 - 1.2-74 (English translation). Ministerial Decision No. 96 of 1982 regarding Executive Regulations to Company Law No. 159 of 1981 Source: Business Laws of Egypt, vol. I, pp. 1.2-75 - 1.2-226 (English translation). Income Tax Law No. 157 of 1981. Source: Official Gazette, No. 37, Supplement, and Business Laws of Egypt, vol. III, 10 September 1981, pp. 3.3-1 - 3.3-120, (English translation). Executive Regulations No. 164 of 1982 to Income Tax Law No. 157 of 1981. Source: Official Gazette, No. 186 (supplement) and Business Laws of Egypt, vol. 11, 15 August 1982, pp. 2.4-1 - 2.4-54, (English translation). Decree No. 3 of 9 February 1976 Instituting an Agency for the Development of Innovations and Inventions. Source: World Intellectual Property Organisation, Industrial Property Laws and Treaties, No. 12. December !976 (English translation). Labor Law No. 137 of 1981. Source: Official Gazette, No. 33, 13 August 1981 (supplement). Law No. 82 of 2002 Pertaining to the Protection of Intellectual Property Rights, repealing the following legislations: Patents: Patent and Industrial Models Act No. 132 of 1949. Ministerial Decree No. 132 of 1949, as amended by Ministerial Decrees Nos. 271 of 1953, 39 of 1955, and 49 of 1958. Trade Marks: Act No. 57 of 1939, as amended by Acts Nos. 143 of 1949, 353 and 531 of 1953, 569 of 1954, 205 of 1956 and 59 of 1969.Copyright: Law No. 354 of 1954, as amended by laws Nos. 14 of 1968, 34 of 1975 and 38 of 1992. Source: Abu-Ghazaleh Intellectual Property, (http://www.agip.com). Law on special economic Zones, May 2002. Source: The Economist Intelligence Unit (http://db.eiu.com). Prime Ministerial Decree 506 on foreign exchange from exports, passed in March 2003. Source: The Economist Intelligence Unit (http://db.eiu.com). II. International Framework A. Egypt is a party to the following multilateral and regional instruments: Paris Convention for the Protection of Industrial Property of 1883 (Revised at Brussels in 1900, Washington in 1911, The Hague in 1925, London in 1934, Lisbon in 1958 and Stockholm in 1967, and as amended in 1979). Signed in 1994. Convention on the Settlement of Investment Disputes between States and Nationals of other States of 1965. Entered into force on 14 October 1966 Convention on the Recognition and Enforcement of Foreign Arbitral Awards of 1958, which entered into force on 7 June 1959. Convention Establishing the Multilateral Investment Guarantee Agency of 1985, entered into force on 12 April 1988. Marrakesh Agreement Establishing the World Trade Organisation of 15 April 1994. Entered into force on 1 January 1995. Agreement on Trade-Related Investment Measures.
UNCTAD WID Country Profile: EGYPT Page 16 of 19

General Agreement on Trade in Services. Agreement on Trade Related Aspects of Intellectual Property Rights. Unified Agreement for the Investment of Arab Capital in the Arab States of 1982. Agreement for the Promotion, Protection and Guarantee of Investment Among Member States of the Organisation of Islamic Conference of t June 1981, entered into force on 23 September 1986. Articles of Agreement of the Islamic Corporation for the Insurance of Investment and Export Credit of 19 February 1992, entered into force on 1 August 1994. Convention Establishing the Inter-Arab Investment Guarantee Corporation of May 1971. Entered into force in April 1974. B. Bilateral treaties 1. Bilateral investment treaties for the protection and promotion of investments: Kuwait 1966, Switzerland 1973, France 1974, Germany 1974, United Kingdom 1975, Morocco 1976, Netherlands 1976, Belgium/Luxembourg 1977, Japan 1977, Sudan 1977, Serbia and Montenegro 1977, Sweden 1978, Finland 1980, Oman 1985, United States 1986, United Arab Emirates 1988, Yemen 1988, Italy 1989, Libyan Arab Jamahiriya 1990, Saudi Arabia 1990, Tunisia 1990, Argentina 1992, Ecuador 1992, Spain 1992, Ukraine 1992, Uzbekistan 1992, Albania 1993, Czech Republic 1993, Greece 1993, Kazakhstan 1993, China 1994, Comoros 1994, Indonesia 1994, Romania 1994, Armenia 1995, Hungary 1995, Poland 1995, Turkmenistan 1995, Uganda 1995, Canada 1996, Jordan 1996, Korea, Republic of 1996, Lebanon 1996, Netherlands 1996, Sri Lanka 1996, Turkey 1996, Algeria 1997, Bahrain 1997, Belarus 1997, Croatia 1997, Gabon 1997, India 1997, Latvia 1997, Malaysia 1997, Morocco 1997, Russian Federation 1997, Singapore 1997, Slovakia 1997, Syrian Arab Republic 1997, Tanzania, United Republic of 1997, Viet Nam 1997, Bosnia and Herzegovina 1998, Bulgaria 1998, Chad 1998, Congo, Democratic Republic of the 1998, Cyprus 1998, Djibouti 1998, Ghana 1998, Guinea 1998, Mali 1998, Mozambique 1998, Niger 1998, Oman 1998, Palestine Authority 1998, Senegal 1998, Slovenia 1998, South Africa 1998, Belgium/Luxembourg 1999, Denmark 1999, Georgia 1999, Jamaica 1999, Malta 1999, Portugal 1999, Zimbabwe 1999, Thailand 2000, Australia 2001, Austria 2001. 2. Bilateral treaties for the avoidance of double taxation: Sweden 1958, Germany 1959, Austria 1962, Norway 1964, Finland 1965, Iraq 1968, Japan 1968, India 1969, Sudan 1970, United Kingdom 1977, Italy 1979, Romania 1979, France 1980, United States 1980, Canada 1983, Germany 1987, Switzerland 1987, Serbia and Montenegro 1987, Denmark 1989, Morocco 1989, Tunisia 1989, Belgium 1991, Hungary 1991, Syrian Arab Republic 1991, Korea, Republic of 1992, Cyprus 1993, Turkey 1993, Sweden 1994, Czech Republic 1995, Lebanon 1996, Poland 1996, China 1997, Malaysia 1997, Armenia 1998, Indonesia 1998, Macedonia, the Former Yugoslav Republic of 1999, Malta 1999, Netherlands 1999, Uzbekistan 1999, Korea, Democratic People's Republic of 2000, Senegal 2001.
UNCTAD WID Country Profile: EGYPT Page 17 of 19

D. Sources of information Official Ministry of Economy and Foreign Trade. General Authority for Investment and Free Zones http://www.gafi.gov.eg/. Secondary Africa Development Bank (ADB) (2005). "Egypt: 2000 - 2002 Country Strategy Paper, 2005 Update." Country
Operations Department - ADB, July 2005.
Amin, Galal (2000). Whatever Happened to the Egyptians? (Cairo:American University in Cairo Press).
Commander, Simon (2003). "What explains the growth of a software industry in some emerging markets", Development Research Center (DRC) working paper No. 22 (London: DRC).
Dong-Joo Joo (1996). "An assessment of the foreign direct investment environment of Egypt in a Korean perspective". Paper presented at the International Seminar between Korea and Egypt, Port Said, October.
Economist Intelligence Unit (EIU) (2002a). Country Profile: Egypt (London: EIU Ltd.).
___________________(2002b). Country Report: Egypt (London: EIU Ltd.) September.
___________________(2005a). Country Profile: Egypt (London: EIU Ltd.).
___________________(2005b). Country Report: Egypt (London: EIU Ltd.) September.
El – Shinnawy, Azza and Handoussa, Hebba (2003). "Case studies of foreign direct investment in Egypt", Development Research Center (DRC) working paper No. 2. (London: DRC).
Estrin, Saul (2003). "Foreign direct investment in Egypt, India, South Africa and Vietnam: an overview", Development Research Center (DRC) working paper No. 17 (London: DRC).
Guabr, Ahmed Ali (1997). "A survey of public opinion", Kitab Al-Aktisadi, Ah-Ahram Institution, No. 116, September.
Handoussa, Heba (2003). "Survey of foreign investment firms in Egypt", Development Research Center (DRC) working paper No. 3 (London: DRC).
Kamar, Bassem and Bakardzhieva, Damyana (2002). "The reforms needed to attract more FDI in Egypt: Lessons from the CEEC experience", communication presented at the Ninth Annual Conference of the Economic Research Forum for Arab countries, Turkey and Iran, 26 – 28 October.
Louis, Maryse, K and Handoussa, Heba (2003). "Brownfield investment in emerging markets: the case of Egypt", Development Research Center (DRC) working paper No.1 (London: DRC).
Mahboub, Abdelhamid (1997). "Foreign direct investment in Egypt: How to encourage and maximize the benefits" (Zagzig University Department of Economics).
Rodenbeck, Max (1998). Cairo: The City Victorious (Picador).
Sobhi, Yasser (2003). "Casualities of conflict", Al-Ahram Weekly on-line, No. 630, March.
Soderbom, M. and F. Teal (2004). "Size and Efficiency in Africa Manufacturing firms: Evidence from Firm-Level Panel Data." Journal of Development Economics, 73. pp 369 - 394.
UNCTAD WID Country Profile: EGYPT Page 18 of 19

United Nations Conference on Trade and Development (UNCTAD) (1999). Investment Policy Review Egypt (Geneva and New York: United Nations), United Nations publication, Sales No. E.03.II.D.20.
___________________(2005a). Investor-Disputes Arising from Investment Treaties: A Review. UNCTAD Series of International Investment Policies for Development (UNCTAD/ITE/IIT/2005/4).
___________________(2005b). A Survey of Support by Investment Promotion Agencies to Linkages. Advisory
Studies No. 18 (UNCTAD/ITE/IPC/2005/12). United States Commercial Service (2006). Doing Business in Egypt: A country Commercial Guide for US
Companies. (Washington D.C.: US Government).
US–Egypt Business Council (2000). "Trade and investment resources: overview of US investment in Egypt, 2000" (US-Egypt Business Council).
UNCTAD WID Country Profile: EGYPT Page 19 of 19