under-reporting of adverse drug reactions to the food
TRANSCRIPT

Walden UniversityScholarWorks
Walden Dissertations and Doctoral Studies Walden Dissertations and Doctoral StudiesCollection
2018
Under-reporting of Adverse Drug Reactions to theFood & Drug AdministrationJames Alexander LambWalden University
Follow this and additional works at: https://scholarworks.waldenu.edu/dissertations
Part of the Pharmacy and Pharmaceutical Sciences Commons
This Dissertation is brought to you for free and open access by the Walden Dissertations and Doctoral Studies Collection at ScholarWorks. It has beenaccepted for inclusion in Walden Dissertations and Doctoral Studies by an authorized administrator of ScholarWorks. For more information, pleasecontact [email protected].

Walden University
College of Health Sciences
This is to certify that the doctoral dissertation by
James A. Lamb
has been found to be complete and satisfactory in all respects, and that any and all revisions required by the review committee have been made.
Review Committee Dr. Howell Sasser, Committee Chairperson, Public Health Faculty
Dr. Vasileios Margaritis, Committee Member, Public Health Faculty Dr. Egondu Onyejekwe, University Reviewer, Public Health Faculty
Chief Academic Officer Eric Riedel, Ph.D.
Walden University 2018

Abstract
Under-reporting of Adverse Drug Reactions to the Food & Drug Administration
by
James A. Lamb
MPH, West Chester University of Pennsylvania, 2009
BS, West Chester University of Pennsylvania, 2006
Dissertation Submitted in Partial Fulfillment
of the Requirements for the Degree of
Doctor of Philosophy
Public Health Epidemiology
Walden University
November 2018

Abstract
This study examined the potential significant differences in the distribution of adverse drug
reactions (ADRs) by reporter (consumer versus physician) and patient outcome at case and event
level. This study also contains exploratory questions to evaluate reporting of ADRs by consumers
versus physician by system organ class (SOC) and reporter demographics within the United
States Food & Drug Administration Adverse Event Reporting System (FAERS). The theoretical
foundation applied in this quantitative study was the social amplification of risk framework. Data
from the second quarter of 2016 were obtained from FAERS, and a total of 87,807 ADR reports
corresponding to 143,399 ADRs were analyzed by utilizing the chi-square test, the odds ratio, and
logistic regression. Cross-sectional design was employed to compare reporting of ADRs at the
case and event level (case-based and event-based analyses, respectively) between reporters
(consumer versus physician), specifically, for patient outcome, as well as SOC and reporter
demographics. For both the case-based and event-based analyses, findings revealed that
consumers reported more serious ADRs in comparison to physicians. Furthermore, findings
confirmed a difference in ADR reporting between consumers and physicians depending on SOC
groups. Additionally, consumers reported more nonserious ADRs in comparison to physicians.
The results from this study may have implications for positive social change by augmenting
pharmacovigilance systems at a national and international level to identify risks and risk factors
spontaneously reported after drugs have been on the market.

Under-reporting of Adverse Drug Reactions to the Food & Drug Administration
by
James A. Lamb
MPH, West Chester University of Pennsylvania, 2009
BS, West Chester University of Pennsylvania, 2006
Dissertation Submitted in Partial Fulfillment
of the Requirements for the Degree of
Doctor of Philosophy
Public Health Epidemiology
Walden University
November 2018

Dedication
I would like to dedicate this dissertation to the love of my life, Oksana. I could not
have done this without you being so supportive. As my wife and my rock, I want you to
know that this PhD is for us and our future together. Thank you for everything. I love you
with all my heart and soul!

i
Table of Contents
List of Tables ..................................................................................................................... iv
Chapter 1: Introduction to the Study ....................................................................................1
Introduction ....................................................................................................................1
Background ....................................................................................................................2
Problem Statement .........................................................................................................9
Purpose of the Study ....................................................................................................10
Research Questions and Hypothesis ............................................................................11
Primary Research Questions ................................................................................. 11
Exploratory Research Questions ........................................................................... 11
Theoretical Foundation ................................................................................................12
Nature of the Study ......................................................................................................13
Definitions....................................................................................................................14
Assumptions .................................................................................................................16
Scope and Delimitations ..............................................................................................16
Limitations ...................................................................................................................17
Significance of the Study .............................................................................................19
Summary ......................................................................................................................20
Chapter 2: Literature Review .............................................................................................22
Introduction ..................................................................................................................22
Literature Search Strategy............................................................................................23
History of ADR Reporting in the US and Overview of FAERS SRS .........................24

ii
European Union Countries in Which Direct ADR Reporting Is Accepted .................27
Medical Dictionary for Regulatory Activities Overview .............................................30
Theoretical Foundation ................................................................................................32
Literature Review of Consumer Versus Healthcare Professional ADR
Reporting..........................................................................................................36
Summary and Conclusions ..........................................................................................49
Chapter 3: Research Method ..............................................................................................52
Introduction ..................................................................................................................52
Research Design and Rationale ...................................................................................52
Methodology ................................................................................................................55
Population ............................................................................................................. 55
Sampling and Sampling Procedures ..................................................................... 55
Data Collection Procedures ................................................................................... 56
Instrumentation and Operationalization of Constructs ......................................... 58
Data Analysis Plan ................................................................................................ 59
Primary Research Questions ................................................................................. 60
Exploratory Research Questions ........................................................................... 61
Threats to Validity .......................................................................................................64
Ethical Procedures .......................................................................................................66
Summary ......................................................................................................................68
Chapter 4: Results ..............................................................................................................70
Introduction ..................................................................................................................70

iii
Primary Research Questions ................................................................................. 70
Exploratory Research Questions ........................................................................... 71
Data Collection ............................................................................................................71
Results 74
Research Question 1A........................................................................................... 74
Research Question 1B ........................................................................................... 79
Research Question 2 ............................................................................................. 93
Research Question 3 ............................................................................................. 97
Summary ......................................................................................................................99
Chapter 5: Discussion, Conclusions, and Recommendations ..........................................101
Introduction ................................................................................................................101
Interpretation of Findings ..........................................................................................102
Limitations of the Study.............................................................................................122
Recommendations ......................................................................................................125
Implications................................................................................................................136
Conclusion .................................................................................................................140
References ........................................................................................................................142

iv
List of Tables
Table 1 Distribution of Adverse Drug Reactions (ADRs) Reports in the US (01 April
2016 through 30 June 2016) by Reporter and Patient Outcome ............................... 77
Table 2 Distribution of Adverse Drug Reactions (ADRs) in the US (01 April 2016
through 30 June 2016) by Reporter and Patient Outcome ........................................ 79
Table 3 Distribution of Adverse Drug Reactions (ADRs) Reports in the US (01 April
2016 through 30 June 2016) by Reporter and Patient Outcome Severity ................. 81
Table 4 Distribution of Adverse Drug Reactions (ADRs) in the US (01 April 2016
through 30 June 2016) by Reporter and Patient Outcome Severity.......................... 82
Table 5 Logistic Regression Predicting Reporting Cases of Patient Outcome of Fatal
versus Non-Fatal ....................................................................................................... 83
Table 6 Logistic Regression Predicting Reporting ADRs Resulting in Patient Outcome of
Fatal versus Non-fatal ............................................................................................... 84
Table 7 Logistic Regression Predicting Reporting Cases of Patient Outcome of Life-
Threatening versus Non-Life-Threatening ............................................................... 85
Table 8 Logistic Regression Predicting Reporting ADRs Resulting in Patient Outcome of
Life-Threatening versus Non-Life-Threatening ....................................................... 85
Table 9 Logistic Regression Predicting Reporting ADR Cases of Patient Outcome of
Hospitalization versus Non-Hospitalization ............................................................. 86
Table 10 Logistic Regression Predicting Reporting ADRs Resulting in Patient Outcome
of Hospitalization versus Non-Hospitalization ......................................................... 87

v
Table 11 Logistic Regression Predicting Reporting ADR Cases of Patient Outcome of
Disability versus Non-Disability............................................................................... 88
Table 12 Logistic Regression Predicting Reporting ADRs Resulting in Patient Outcome
of Disability versus Non-Disability .......................................................................... 88
Table 13 Logistic Regression Predicting Reporting ADR Cases of Patient Outcome of
Congenital versus Non-Congenital ........................................................................... 89
Table 14 Logistic Regression Predicting Reporting ADRs Resulting in Patient Outcome
of Congenital versus Non-Congenital ....................................................................... 90
Table 15 Logistic Regression Predicting Reporting ADR Cases of Patient Outcome of
Intervention versus Non-Intervention ....................................................................... 91
Table 16 Logistic Regression Predicting Reporting ADRs Resulting in Patient Outcome
of Intervention versus Non-Intervention ................................................................... 91
Table 17 Logistic Regression Predicting Reporting ADR Cases of Patient Outcome of
OME versus Non-OME ............................................................................................ 92
Table 18 Logistic Regression Predicting Reporting ADRs Resulting in Patient Outcome
of OME versus Non-OME ........................................................................................ 93
Table 19 Analysis of Adverse Drug Reactions in the United States (01 April to 30 April
2016) by System Organ Class (SOC) and Reporter.................................................. 96
Table 20 Distribution of Adverse Drug Reactions (ADRs) Reports in the US (01 April
2016 through 30 June 2016) by Reporter and Gender .............................................. 98
Table 21 Distribution of Adverse Drug Reactions (ADRs) in the US (01 April 2016
through 30 June 2016) by Reporter and Gender ....................................................... 99

1
Chapter 1: Introduction to the Study
Introduction
In this study, I examined the differences in reporting adverse drug reactions
(ADRs) to the Food & Drug Administration (FDA) between consumers and physicians in
the United States (US) at case and event level. ADRs are considered harmful effects
arising from the use of medications (Abraham, & Ballinger, 2012). However, reporting
differences may exist between consumers and physicians for different reporting
categories resulting in a potential public health issue (Alatawi & Hansen, 2017). I
addressed, in this study, those reporting differences between reporters (specifically,
physicians and consumers) and the severity of ADRs based on patient outcome.
Additionally, I evaluated the reporting of ADRs within different system organ classes
(SOCs) and demographics.
The under-reporting of ADRs is a limitation of current Pharmacovigilance (PV)
systems within the US, thereby leading to the inability of regulators to estimate total
safety risk (Alatawi & Hansen, 2017). The findings from this study determined whether
consumer reporting was an important factor in ADR reporting, and if these reports (also
used interchangeably referred to as “cases”) added value to the safety profile of a
product. In addition, the results from this study have implications for positive social
change in that may potentially be able to augment PV systems at a national and
international level to identify risks and risk factors spontaneously reported after such
drugs have been on the market (Pal, Duncombe, Falzon, & Olsson, 2013).

2
In this chapter, I first provide a background and the purpose of the study. Then, I
identify the problem examined in the study, provide the theoretical framework of the
study, describe the nature of the study and state the research questions and hypotheses.
Last, I list the key definitions of terms used in the study, discuss the study assumptions,
scope, delimitations, and limitations, and describe the significance of the study.
Background
PV is the science that serves as a crucial component in detecting, evaluating, and
inhibiting ADRs or any other drug-related issues and/or effects (World Health
Organization [WHO], 2017). The objective of PV is to facilitate the intake of medicines
in a safe manner, evaluate and convey the risks and benefits of medicines on the market,
and to disseminate information and educate consumers about drugs and other medicines
(WHO, 2012). ADRs, which can be defined as harmful and involuntary responses
resulting from doses used in humans, are deemed a limiting factor that arises from issues
with patient compliance and medication adherence (Tadesse, Mekonnen, Tesfaye, &
Tadesse, 2014). Researchers have discovered that nonadherence to medication stems
from the following: patients (i.e., failure to comprehend essential health information
regarding their own health); physicians (i.e., lack of communication with patients with
regards to prescription of complex drug regimens); and, healthcare systems (i.e., office
visit time limitations, limited access to care, and shortage of health information
technology) (Brown & Bussell, 2011).
Additionally, ADRs have continued to persist as a concern and public health
issue, especially within underdeveloped countries in which sufficient drug toxicity

3
monitoring and reporting systems are virtually nonexistent (Sen, 2016). Researchers have
revealed findings suggesting that, on national and international scales, more than 5% of
hospital admissions were related to ADRs (Sultana, Cutroneo, & Trifirò, 2013), thereby
responsible for nearly 20% of deaths annually among hospitalized patients (FDA, 2016a).
Due to the nature of ADRs, public health agencies are faced with substantial
economic consequences namely, on average, the medical expenditures of a hospital
admission associated with an ADR ranges from circa $10,000 to $13,000 per
person (Pillans, 2008). The US spends more than 30 billion dollars per year in managing
ADRs, and these expenditures may be further magnified as a result of increased
hospitalization, prolongation of hospital stay, and further clinical investigations in more
serious cases (Sultana et al. 2013). Hence, ADRs have deleterious effects on the clinical,
social, and economic aspects of society (Inácio, Cavaco, & Airaksinen, 2016). Therefore,
to counteract the negative impact of ADRs, it is of paramount importance for regulatory
agencies, such as the US FDA, to work in tandem with healthcare systems and
pharmaceutical industries to constantly detect any drug safety issues and ensure a
product’s label is current (Leroy, Dauxois, Théophile Haramburu, Tubert-Bitter, 2014).
To scrutinize and effectively manage the risks and adverse reactions related to
drugs to which the public has access, regulatory agencies should enhance their
postmarketing surveillance of drugs by implementing an efficient spontaneous reporting
system (SRS) (Inácio et al., 2016). The objective of SRS during the postmarketing phase
is the identification of new ADRs that may have otherwise gone undetected during
clinical trials Phases I-III (WHO, 2012). The US FDA Adverse Event (AE) Reporting

4
System (FAERS), as a type of SRS, is a national postmarketing surveillance database that
gathers data on ADRs, medication error reports, and product quality complaints leading
to AEs submitted to the FDA by reporters, including consumers and physicians (FDA,
2017). The FDA employs the FAERS database (the major postmarketing surveillance
database used by the FDA for collecting ADRs reported by reporters) to detect safety
signals (a new, potential causal association or a new aspect of a previously known
relationship between an ADR and a drug or intervention) relating to ADRs and further
assess additional potential safety concerns once they are discovered (Hauben & Aronson,
2009). Hence, upon scrutinizing potential safety concerns from the FAERS system, the
FDA can subsequently make informed regulatory decisions in an effort to ameliorate
product safety and safeguard the health and well-being of the public, including, but not
limited to, the following: updating the labeling information of a drug or product; limiting
drug consumption or product usage; disseminating new safety information to the public;
or, removing a product from the market (also known as product recall) (FDA, 2017).
Healthcare systems need a system of spontaneous reporting of ADRs by
consumers and physicians (and other healthcare professionals) to determine new
reactions, record the rate of ADR occurrence, and present this information to prescribers
to inhibit subsequent ADRs (Alatawi & Hansen, 2017; Pillans, 2008). Spontaneous
reporting of ADRs during postmarketing (Phase IV) and approval by the FDA is a crucial
strategy of ADR detection, thereby allowing the identification of serious, unpredicted,
and uncommon ADRs that may not have been observed during clinical trials Phases I-III
(Alatawi & Hansen, 2017; Pillans, 2008). Although one of the advantages of SRS, such

5
as FAERS, is its ability to detect ADRs in an economic manner, the major disadvantage
of SRS is under-reporting of ADRs, which impedes the successful detection of signals
and proper identification of safety issues and concerns (Sakaeda, Tamon, Kadoyama, &
Okuno, 2013). Hence, given the significance of the reporting of ADRs, the under-
reporting of ADRs to the FDA by consumers and physicians is an impediment to
ensuring the completeness of the safety profile of product.
Researchers have estimated that more than 1 million serious ADRs are reported in
the US on an annual basis (Maciejewski et al, 2017). Of these, 5 to 10% are fatal, while
others lead to patient suffering, hospitalization, and increased health system burden
(Lazarou, Pomeranz, & Corey, 1998). Furthermore, ADRs are one of the leading causes
of mortality within the US, thereby comprising more than 40,000 deaths on an annual
basis (Hoyert & Xu, 2012). Researchers have also estimated that only 6% of all ADRs
are reported in the US (Alatawi & Hansen, 2017). This rather high rate of under-reporting
hinders signal detection, which can be defined as the process of identifying a new,
potential causal association (or a new aspect of a previously known relationship) between
an ADR and a drug or intervention (Hauben & Aronson, 2009). Consequently, the failure
to establish an association between an ADR and a drug can lead to more individuals at
risk of developing an AE that results in potential patient outcomes like (a) death, (b) life-
threatening (LT) situations, (c) initial or prolonged existing inpatient hospitalization, (d)
persistent or significant disability or incapacity, (e) a congenital anomaly or birth defect,
(f) necessary intervention to inhibit permanent damage, or (g) other (important) medical
outcome, event, or reaction (FDA, 2016b). Hence, the under-reporting of ADRs has a

6
negative effect on public health due to the inability for healthcare professionals (HCPs)
(particularly physicians) to detect and approximate the magnitude of drug risks, verify
actionable issues, and ascertain potential action from regulatory agencies (Sen, 2016;
Inácio et al., 2016).
Typically, physicians have been almost entirely responsible for spontaneous
reports of ADRs (WHO, 2012). However, the rather high rate of under-reporting has
made it challenging for health authorities to protect the health and well-being of the
public (Inácio et al., 2016). Researchers have discovered that insufficient knowledge
about PV and ADR reporting, as well as apathetic attitudes on the part of HCPs are
among the factors associated with under-reporting (Sen, 2016; Pillans, 2008).
Furthermore, published findings suggest that the following factors may contribute to
under-reporting by HCPs: reactions after drug consumption that are either unknown or
well-known; an uncertainty regarding a causal association; lack of awareness of reporting
requirements; lack of comprehension of the objective of spontaneous reporting schemes
and the aim of SRSs; challenges in accessing report forms; and, an inadequate amount of
reporting time (Biagi et al., 2013; Pillans, 2008). Moreover, results from qualitative
research studies have suggested that the knowledge and attitudes of HCPs with regards to
ADR reporting may be impacting under-reporting based on the survey responses of
HCPs, who rationalized their lack of reporting ADRs via the following beliefs: serious
adverse reactions will be extensively recorded when the medicine or product reaches the
market; only safe medications or products may be related to ADR reporting; or, one case
reported by a single physician will not contribute to medical knowledge (Herdeiro,

7
Figueiras, Polónia, & Gestal-Otero, 2005). Hence, researchers have concluded that it is
essential to improve these factors to positively influence the quality and quantity of
postmarketing surveillance data (Inácio et al., 2016; Sen, 2016; Biagi et al., 2013; Pillans,
2008).
In an effort to ameliorate the rate of under-reporting, public health authorities and
PV centers require complete, accurate, and quality spontaneous reports. However, given
the challenge of under-reporting of ADRs by physicians, public health authorities and PV
centers have been recently relying upon consumer reporting, which is the reporting of
suspected side effects of a drug by a consumer and not the HCP (WHO, 2012).
Consumer reporting is a wider term that encompasses not only patients, but
consumers as well (WHO, 2012). A patient may be defined as an individual who is
receiving or is registered to receive medical treatment from physicians or other HCPs.
The patient who was prescribed an analgesic from his/her physician, and the individual
who purchases over-the-counter drugs at the pharmacy without a prescription are both
consumers of a medicinal product (WHO, 2012). Hence, not all individuals who consume
medicines are patients, but all patients are consumers.
Although ADR reporting to national databases has typically been performed by
HCPs, researchers have resorted to direct consumer reporting of ADRs to combat the
persistent and negative consequences of ADRs, as well as to bolster the SRS (Aagaard &
Hansen, 2013). Furthermore, although consumer reporting is not universally recognized
in PV, it has been integrated within the PV systems in a select few countries, such as the
US, Canada, the United Kingdom (UK), Australia, New Zealand, Sweden, Denmark, and

8
the Netherlands, which accept this form of reporting (Pillans, 2008). Moreover, there is
scant evidence of the significance of spontaneous reporting by consumers. Consumers are
being motivated to report ADRs to a SRS, and such organizations as the FDA, the WHO,
and the European Commission, recognize the significance of the consumer in
spontaneous reporting (European Medicines Agency, 2010). Hence, consumer reporting
is gradually becoming more of a part of the PV process, especially concerning the relay
of risk information (Sen, 2016; Van Grootheest, & de Graaf, 2003).
Researchers have discovered that consumer reports are more comprehensive and
specific than physicians’ reports, thereby detailing certain symptoms in a lucid manner
(Sen, 2016). Consumer reports typically contain a detailed, direct, and personal account
of the effects of ADRs from drug consumption in comparison to reports from physicians.
Furthermore, consumer reporting possesses several advantages, including, but not limited
to, the following: an increase in ADRs reported, especially new and previously
unreported ADRs; early signal detection of ADRs; and, a potential strategy to prevent
medication errors (Sen, 2016). Consumer reports describe the prevention of medication
errors by identifying and describing new reactions to medications, as well as detailing
patients’ reporting of their symptoms to their HCPs or to regulatory agencies (Britten,
2009). According to Robertson and Newby (2003), direct and spontaneous consumer
reporting provides greater insight for PV by facilitating the comprehension of ADRs,
thereby potentially serving as a missing link for the issue of under-reporting of ADRs by
physicians. Hence, researchers have determined the significance of the role of the
consumer in spontaneous ADRs.

9
In this study, I evaluated the FAERS database in an effort to compare the
differences between consumers and physicians in reporting ADRs to the FDA in the US
at case and event level. Based on the research and analyses that was conducted, it was
determined whether consumer reporting needed to be bolstered within PV in the US. A
SRS that includes both consumer and HCP reporters has an increased chance of
identifying ADRs at an early stage (Health Action International, 2015; Mitchell, Henry,
Hennrikus, & O’Connell, 1994). Positive social change in overall patient safety was a
major outcome of this study. For example, the combination of consumer reports with
reports from HCPs yielded an increase in signal detection, which stimulated a more
successful way to detect ADRs. Furthermore, it was determined that an increase in
physician reporting, in combination with consumer reporting, reduced the rate of under-
reporting and this serves as a crucial factor in overall PV and drug safety (Health Action
International, 2015). Hence, it was also determined that the combination of reports from
both HCPs and consumers fostered the growth and progression of PV systems within the
US and other countries as well.
Problem Statement
The problem I addressed in this study is the lack of reporting from different
categories of reporters (consumer versus physician). The lack of reporting is a limitation
of current PV systems within the US, thereby hindering regulators’ ability to quantify risk
of under-reporting of ADRs (Alatawi & Hansen, 2017). In this study, I addressed the
aforementioned problem by examining the potential significant difference in the
distribution of ADRs by reporter (consumer versus physician) and patient outcome at

10
case and event level. I also evaluated the reporting of ADRs by consumers versus
physician by SOC and demographics.
Purpose of the Study
In this quantitative study, I examined the statistical significance in the distribution
of ADRs within the FAERS database by reporter (consumer versus physician) and patient
outcome, and I also evaluated reporter differences in SOC and demographics. The factors
explored and compared included the differences in under-reporting of consumer versus
physician, thereby elucidating whether consumer reporting plays a pivotal role in AE
reporting. It was anticipated that the outcome would have some bearing on the frequency
of physician and consumer reporting and on differences in reporting rates between them.
The reporter (consumer versus physician) was the independent variable, thereby
consisting of two levels: consumer and physician. Patient outcome, SOC, and reporter
demographics were the dependent variables. The unit of analysis was the total number of
ADR cases and reported ADRs. In the severity of patient outcome analysis, I grouped
patient outcomes into a dichotomous variable by severity and tested this first. Since the
results turned out to be significant, I then went on to test specific dyads (e.g. fatal vs non-
fatal, LT vs non-LT, etc.) to further characterize the relationship. Within the exploratory
research questions, I also evaluated the total number of ADR cases and reported ADRs of
reporters (consumer and physician; independent variable) versus patient outcome
(dependent variable) and SOC (dependent variable), and I also evaluated the total number
of cases and reported ADRs of reporters (consumer and physician) versus reporter
demographics.

11
Research Questions and Hypothesis
Primary Research Questions
Research Question 1A: Is there a statistically significant difference in the
distribution of ADRs by reporter (consumer versus physician) and patient outcome?
H01A: There is no statistically significant difference in the distribution of ADRs
by reporter (consumer versus physician) and patient outcome.
Ha1A: There is a statistically significant difference in the distribution of ADRs by
reporter (consumer versus physician) and patient outcome.
Research Question 1B: Is there a statistically significant difference in the
distribution of ADRs by reporter when comparing by severity of outcome?
H01B: There is no statistically significant difference in the distribution of ADRs
by reporter when comparing by severity of outcome.
Ha1B: There is a statistically significant difference in the distribution of ADRs by
reporter when comparing by severity of outcome.
Exploratory Research Questions
Research Question 2: Is there a statistically significant difference in the
distribution of ADRs by reporter (consumer versus physician) and SOC?
H02: There is no statistically significant difference in the distribution of ADRs by
reporter (consumer versus physician) and SOC.
Ha2: There is a statistically significant difference in the distribution of ADRs by
reporter (consumer versus physician) and SOC.

12
Research Question 3: Is there a statistically significant difference in the
distribution of ADRs by reporter (consumer and physician) and demographics?
H03: There is no statistically significant difference in the distribution of ADRs by
reporter (consumer versus physician) and demographics.
Ha3: There is a statistically significant difference in the distribution of ADRs by
reporter (consumer versus physician) and demographics.
Theoretical Foundation
The theoretical foundation most applicable to this study is known as social
amplification of risk framework (SARF), which stems from the perception of risk
framework. Risk comprises the likelihood and repercussions of the occurrence of an
event (Adams, 1995). The theory holds that risk interrelates with the psychological,
social, institutional, and cultural perceptions of individuals in a manner that may magnify
or diminish individuals’ responses to the risk or risk event (Kasperson & Ratick, 1988).
These changes in the perception of risk elicit behavioral responses from individuals that
alter the social and economic aspects of society, thereby increasing or decreasing the
actual physical risk (Kasperson & Ratick, 1988). The perception of risk as it applies to
the present issue involves the premise that different groups (HCPs and non-HCPs,
researchers and the public, or HCPs and consumers) hold different views on the possible
risks associated with ADR reporting as described earlier. The results from Bongard et al.
(2002), which will be given in greater detail in Chapter 2, bolstered the claim that risk
perception of ADRs varies between consumers and healthcare professionals, which was
crucial for this study and addressed the issue of under-reporting of ADRs by consumers

13
versus HCPS. Therefore, with respect to ADR reporting, consumers frequently have
contrasting views in their perception of risk versus HCPs (Sen, 2016; Aronson, 2006).
Nature of the Study
This study was quantitative in nature, and secondary analysis of these data were
performed by utilizing the chi-square test and the odds ratio (OR). This study was cross-
sectional and descriptive. The non-experimental research design (known as the cross-
sectional design) was employed to compare reporting of ADRs at case and event level
between reporters (consumer versus physician), specifically, for patient outcome, as well
as SOC and demographics. The independent variable was the reporter (consumer versus
physician), whereas patient outcome, SOC and reporter demographics were the
dependent variables. The unit of analysis was the total number of ADR cases and
reported ADRs. The analysis focused on describing statistical relationships between the
variables that were chosen for examination. This particular design enabled data collection
without manipulating the independent variables (Field, 2013). Hence, the cross-sectional
design enabled the examination of associations or relationships among variables by using
statistical data analysis techniques (Frankfort-Nachmias, 2014).
In this study, I analyzed secondary data (see Aagaard, Nielsen, & Hansen, 2009),
specifically, ADRs that were submitted by consumers and physicians to the FDA, from
the FAERS database, which contained quarterly data files that were extracted for analysis
(FDA, 2016b). The data containing the spontaneous ADR reports from the FAERS
database were accessed and downloaded from the quarterly data file data selection time
period containing a quarter’s worth (3 months) of data: 01 April 2016 through 30 June

14
2016. Each quarterly data file within FAERS had variations in data due to the number of
ADRs reported in the interval (3 months). Each data file was not representative of all four
quarters for the year. In this study, my justification for selecting three-month’s worth of
data was to provide a more specific perspective of AE reports received by the FDA and to
be in alignment with the FDA website (Institute for Safe Medication Practices, 2015). In
addition, without access to some licensed software tools, such as Empirica Signal®, more
than 3 months would have been very cumbersome. Once the ADR data was collected,
spontaneous reports from consumers and physicians were subsequently assessed for
ADRs.
Definitions
According to WHO (2012), the following is a brief listing of key terms and
phrases that were considered ambiguous, controversial, or operational terms used
throughout this study:
Adherence: The degree to which an individual’s behavior (consumption of
medication, adherence to a diet and exercise regimen, and/or implementation of changes
in lifestyle) is in conformity with the recommendations from a healthcare provider.
Adverse drug reaction: Harmful and involuntary responses resulting from doses
used in humans for preventive treatment, diagnosis, or for diseases and therapy.
Adverse event: An unwanted outcome related to the consumption of any
substance or combination of substances used for treating or preventing diseases in
humans.

15
Anatomical Therapeutic Chemical Classification System: is used for the
classification of active ingredients of drugs according to the organ or system on which
they act and their therapeutic, pharmacological and chemical properties.
"Direct" Case/Report: cases/reports voluntarily submitted to the FDA by non-
manufacturers.
Expedited Case/Report: case/report expedited to the FDA within 15 days.
FAERS: The US FAERS database is a national postmarketing surveillance
database that gathers data on ADRs, medication error reports, and product quality
complaints leading to AEs submitted to the FDA by reporters, including consumers and
physicians.
Periodic Case/Report: Non-Expedited cases/reports from manufacturers to the
FDA.
Pharmacovigilance: PV is the science that serves as a crucial component in
detecting, evaluating, and inhibiting ADRs or any other drug-related issues and/or effects.
Serious adverse event or serious suspected adverse reaction: An AE or suspected
adverse reaction that is deemed “serious” if, from the perspective of the investigator or
sponsor, it may result in any of the following patient outcomes: death; LT; persistent or
significant disability or incapacity; a congenital anomaly or birth defect; initial or
prolonged existing inpatient hospitalization; or, a medically significant outcome, event,
or reaction.
Side effect: any undesirable effect or problem resulting from medicinal product
that occurs in addition to a desired therapeutic effect.

16
Signal: A new, potential causal association or a new aspect of a previously known
relationship between an ADR and a drug or intervention.
Spontaneous reporting: A voluntary submission of ADR reports by different types
of reporters, including, HCPs, consumers, pharmacists, and lawyers, as well as
pharmaceutical companies to national regulatory authority agencies.
Spontaneous Reporting System: A SRS is a system that is employed during the
postmarketing phase to identify new ADRs that may have otherwise gone undetected
during clinical trials.
Under-reporting: Under-reporting of ADRs is the reporting of less than the actual
amount of ADRs that are being reported.
Assumptions
It was assumed that the collection and synthesis of data from FAERS over the
specified timeframe was adequate to conduct this study. Furthermore, it was also
assumed that the FAERS database was sufficient to provide the appropriate amount of
data. Moreover, in terms of quality, it was further assumed that the types of reports
received from consumers were similar in content and presumed accuracy to those of
physician reports (Blenkinsopp, Wilkie, Wang, & Routledge, 2007). Additionally, it was
assumed that consumer reports yielded information on patient outcome, drug therapy and
demographics in comparison to physician reports.
Scope and Delimitations
This quantitative study covered the potential significant difference in the
distribution of ADRs by reporter (consumer versus physician) and patient outcome, as
17
well as SOC, and reporter demographics within the FDA FAERS database at case and
event level. There were not any studies in which the FAERS database was employed to
compare under-reporting of ADRs between consumers and physicians specifically with
the aforementioned methods used in this study (Sakaeda et al., 2013). This particular
focus was chosen due to the fact that there is a gap in the literature of the under-reporting
of ADRs by consumers versus physicians in the FAERS safety database.
This quantitative study did not cover the under-reporting of ADRs to the FDA by
consumers and physicians since the data are limited to only ADRs that were actually
reported. Moreover, since this study employed secondary data analysis, recruitment of the
participants was not made, especially those in vulnerable populations, including, but not
limited to the following: minors (age 17 and under); adult students of the researcher;
subordinates of the researcher; patients of the researcher; nursing home residents;
prisoners; mentally impaired or disabled individuals; emotionally impaired or disabled
individuals; physically impaired or disabled individuals; individuals residing within the
US who may not be fluent in English; undocumented immigrants; victims/witnesses of
violent crime or other trauma (e.g. natural disasters); active duty military personnel; and,
any other individuals who may not be able to protect their own rights or interest (Walden
University, n.d.).
Limitations
Some anticipated limitations of the FAERS data, as well as the secondary data
analysis in this study, must be acknowledged. For example, not all reports for every AE
or medication error that occurred with a product were submitted to the FDA. Moreover,

18
duplicate reports existed in which the same report was submitted by a consumer and by
another reporter (the physician). Hence, neither incidence rates nor an estimation of drug
risk could be calculated from the FAERS data (FDA, 2017).
Given that quantitative methods were employed, consumer perception of ADRs
were not assessed, since the latter requires qualitative methods. Since the correlational
cross-sectional research design was utilized, the secondary data led to under-reporting
and recall bias, which yielded misclassification or information bias (Gualano, Gili,
Scaioli, Bert, & Siliquini, 2015). Furthermore, the use of this particular design provided a
rather limited amount of information of the sample (Gualano et al., 2015). The
correlational cross-sectional research design presented challenges regarding the
determination of causal relationships between the distribution of ADRs by reporter
(consumer versus physician) and patient outcome, as well as SOC and reporter
demographics. The correlational cross-sectional design contained several limitations that
were significant to examine, including internal validity, which is only germane to such a
design as experimental that attempts to establish a causal relationship (Frankfort-
Nachmias, 2014). Since researchers do not alter the independent variables, they must
render logical or theoretical inferences in terms of the direction of the causation by taking
into account that correlation between variables does not imply causation (Field, 2013).
Hence, it is challenging for researchers to make causal inferences.
To overcome several methodological limitations of correlational cross-sectional
designs, researchers frequently employ statistical analyses, including cross-tabulation, for
the purpose of organizing, describing, and summarizing their observations, as well

19
approximating some of the processes inherent within experimental designs (Frankfort-
Nachmias, 2014). When the data are categorized, researchers are able to make contrasts
between the categorical groups (Frankfort-Nachmias, 2014).
Significance of the Study
To date, there have not been any studies within the US in which the FDA FAERS
database was used to compare under-reporting of ADRs by reporter (consumers and
physicians) and patient outcome, as well as SOC and reporter demographics at case
and/or event level (see Sakaeda et al., 2013). Therefore, I examined in this study the
statistical significance in the distribution of case and event level ADRs within the FAERS
database by reporter (consumer versus physician) and patient outcome, as well as SOC
and reporter demographics. This research fills a gap in the literature by focusing on
whether consumers may report ADRs to the FDA more frequently than physicians may,
and whether these differences may be tied in some way to the severity of the ADRs,
especially within SOC (Blenkinsopp et al., 2007). This, in turn, enables greater
comprehension of consumer and physician perceptions, as well as determine if there was
a need for a better safety reporting system in the US (Blenkinsopp et al., 2007).
Consumer reports could enhance the overall drug safety system by providing additional
information not reported by HCPs or other professional reporters (Health Action
International, 2015). A SRS that can divulge the proportion of reports that arise from both
consumers and physicians has a greater likelihood of early signal detection of ADRs that
were not observed and reported in premarketing clinical trials (Health Action
International, 2015; Mitchell et al., 1994).

20
By integrating consumer reports within HCP reports, signal detection may
considerably increase, thereby yielding a more comprehensive ADR detection strategy.
Based on the results from this study, my findings identified areas where reporting by one
kind of reporter or the other is less meaningful, and these findings identified situations
where efforts to increase education and awareness might be especially helpful to the
public health community. The findings from this study will lead to recommendations for
future research, including ameliorating existing PV systems to employ methods that
detect and measure medicine safety, recognize certain risk factors and high-risk groups,
classify ADRs linked to certain drugs or medications and in certain groups or
communities, and pinpoint issues stemming from medication errors and medications
with low or suboptimal quality (Pal et al., 2013). Hence, the results from this study have
implications for positive social change surely enhance PV systems at the national and
global scales to detect risks and risk factors in a rapid fashion after medications or drugs
have been marketed to potentially inhibit ADRs, thus ultimately enabling patients to
receive optimal treatment and quality of care at a fraction of the cost to the healthcare
system (Pal et al., 2013).
Summary
In essence, given the relatively high rate of under-reporting by physicians, an
urgent need exists to revolutionize the surveillance system for pharmaceutical drugs
during the postmarketing phase, as evidenced by the amount of ADRs that were
experienced by consumers (Lazarou et al., 1998). The inclusion of consumer reports to an
SRS influences the validity of safety surveillance systems, thereby potentially yielding

21
considerable amelioration of the existing PV surveillance system (Jarernsiripornkul,
Krska, Capps, Richards, & Lee, A. 2002). As a crucial component in PV, consumers may
contribute to new and serious ADRs that can be identified in an expeditious manner via
consumer reporting in comparison to physician reporting (Jarernsiripornkul et al., 2002).
Furthermore, consumers may also report unforeseen or unanticipated benefits. This new
additional information may lead to the enhancement of safety signals, as well as influence
the awareness and implications of ADRs (Hammond, Rich, & Gibbs, 2007). Although
consumer reports should never be deemed as a substitute for HCP reports, consumer
reports may nonetheless serve as a counterpart to HCP reports. Hence, by obtaining
reports on ADRs directly from consumers, the issue of under-reporting may ultimately be
diminished.
In Chapter 2, I provide a literature review of consumer versus physician reporting,
identify the existing gap in the literature, and discuss the theoretical framework most
applicable to this study. In Chapter 3, I provide a review of the research methods that
were employed for performing the secondary data analysis of the data in the FAERS
database. In Chapter 4, I provide the results of the study. Lastly, in Chapter 5, I provide a
discussion of the results, study limitations, recommendations for future research, and the
implications for social change.
22
Chapter 2: Literature Review
Introduction
ADRs are a grave issue to the health and well-being of the public, particularly in
less developed nations in which adequate drug toxicity monitoring and reporting systems
are often lacking (Sen, 2016). Researchers have shown that, on a national and global
level, greater than 5% of hospital admissions resulted from ADRs (Sultana et al., 2013),
thereby responsible for close to 20% of deaths per year among patients who are
hospitalized (FDA, 2016a). Consequently, a considerable economic burden is placed on
the health of the public, as evidenced by public health costs of a hospital admission
ranging from roughly $10,000 to $13,000 per hospitalized patient (Pillans, 2008). The US
spends more than 30 billion dollars per year in managing ADRs, and these expenditures
may be further magnified as a result of increased hospitalization, prolongation of hospital
stay, and further clinical investigations in more serious cases (Sultana et al., 2013).
Therefore, ADRs have a negative influence on the clinical, social, and economic aspects
of society (Inácio et al., 2016). Therefore, to counteract the negative impact of ADRs, it
is of paramount importance for regulatory agencies to work with marketing authorization
holders to ensure a product’s safety profile is current (Leroy et al., 2014).
The problem that I addressed in this study was the differences in the proportion of
case and event level ADR reporting, from different reporting categories with a focus on
patient outcome, as well as SOC, and reporter demographics within the US. The potential
statistical significance in the distribution of case and event level ADRs within the FAERS
database by reporter (consumer versus physician) and patient outcome, as well as SOC,

23
and reporter demographics, was examined. I anticipated that the findings of this study
could provide information regarding variability in the proportions of ADR reporting
between consumers and physicians and that the outcome might be further balanced in
ADR reporting.
In the previous chapter, ADRs were discussed as a common problem within
society. First, I addressed the under-reporting of ADRs by consumers and physicians as a
recurring issue that continues to plague the well-being of the public. Second, I discussed
the necessity of integrating consumer reporting alongside physician reporting as
necessary to transform the surveillance system. In this chapter, I provide a history of
ADR reporting in the US and the relevant SRS (FAERS), a history of ADR reporting in
international countries and a literature review of consumer versus physician reporting. In
doing so, I identified an existing gap in the literature, and discuss the theoretical
framework most applicable to this study. The following literature review shows evidence
that consumers may report some ADRs more frequently than physicians, and these
differences may be tied in some way to the severity of the ADRs (Blenkinsopp et al.,
2007).
Literature Search Strategy
The databases of MEDLINE and Google Scholar were reviewed. ADRs, under-
reporting of ADRs by consumers versus HCPs, and related terms as keywords were
searched. The following key search terms were employed: ADRs; direct consumer
reporting; direct patient reporting; under-reporting of ADRs; under-reporting of ADRs
by consumers, patients, physicians, HCPs; PV; drug safety; spontaneous, healthcare

24
professional, patient, and physician. The date range of reviewed published literature falls
within the years of 2004 to 2017, inclusive.
History of ADR Reporting in the US and Overview of FAERS SRS
Circa the end of the 19th century and beginning of the 20th century, the mandate
for the safety and efficacy of medicines and drugs was not implemented and enforced,
thereby precluding the FDA from maintaining and exercising any official control or
power to render legal decisions and judgments (Cobert, 2011). Consequently, unsafe or
hazardous products infiltrated the US market, claiming hundreds of fatalities.
The number of mass poisonings is exemplified by the release of an elixir of
sulfanilamide in 1937 by a company within the US (Cobert, 2011). Given that the
mandate for drug safety testing was nonexistent during that time, the company failed to
conduct any safety and efficacy testing of this product. The following year, the Federal
Food, Drug and Cosmetic Act was enacted, thus prompting the safety testing of drugs and
products to the FDA via a New Drug Application to protect the public’s health (Cobert,
2011).
In the early 1960s, more than 20 years after the Federal Food, Drug and Cosmetic
Act, the thalidomide disaster occurred during which thousands of infants all over the
world were born with malformed limbs after the thalidomide drug was internationally
marketed as a sleeping pill safe for pregnant women (Science Museum, n.d.). While this
drug was never released on the market within the US, due to the opposition of the FDA’s
drug examiner Dr. Frances Kelsey, thalidomide was nonetheless used in clinical trials in
the US. During the late 1950s, GlaxoSmithKline had conducted clinical trials with

25
thalidomide involving more than 800 study participants, including pregnant women
(Bren, 2001). Consequently, 17 babies were born in the US with severely deformed arms
and legs as a result of thalidomide (Bren, 2001). Due to this worldwide recognition of the
lack of safety when using thalidomide, in 1962 the Kefauver-Harris Amendment was
legislated, marking the advent of a new age of drug regulation. Hence, pharmaceutical
companies were obligated to prove to the FDA the safety and efficacy of a new drug prior
to its inception on the market (Cobert, 2011).
For the purpose of collecting information about the safety and efficacy of new
drugs, in 1969, a SRS of suspected ADRs, now known as FAERS, was launched. This
system was created as a repository of drug surveillance data for more than 6,000
marketed drugs, thereby enabling the FDA to render regulatory decisions regarding the
safety and efficacy of these drugs. Since 1993, the FDA has been accepting direct
consumer ADR reports electronically, by phone, or mail (FDA, 2015). Between the late
1990s to the mid-2000s, the number of ADRs reported to the FDA increased from
approximately 100,000 per quarter to 300,000 per quarter in 2015 (Mezher, 2017).
Presently, FAERS contains more than 8 million reported ADRs, thereby showing its
exponential growth rate (Mezher, 2017). In 2016, the FDA has received more than 1.6
million ADR reports directly from consumers, physicians, manufacturers, and other
reporter types (FDA, n.d.).
Despite the strengths inherent within the FAERS database, the limitations are also
worthy to describe. The correct assessment of FAERS data are complicated by the fact
that multiple drug compositions bear different names and various drug substances, as

26
exemplified by the active ingredient fluoxetine found in the drug Prozac for which
researchers (Maciejewski et al., 2017) discovered nearly 400 “synonyms” (Mezher,
2017). The ability for researchers to make correlations between drugs and their adverse
effects and render causal associations can be obfuscated by numerous drug synonyms
associated with each drug in FAERS. On average, researchers determined 16 synonyms
per one active ingredient within the FAERS database (Mezher, 2017), thereby impeding
the ability to cluster ADRs to determine whether ADR reporting patterns differed across
anatomical therapeutic classes (ATC) (Maciejewski et al., 2017). To correct this
shortcoming, researchers suggested to consolidate drugs by their active component,
which may enable easier detection of drug-ADR signals versus combining drugs based
solely on synonym grouping (Mezher, 2017).
The researchers discovered an additional limitation within the FAERS database,
namely, reporters misinterpreting adverse reactions as an indication of a drug (Mezher,
2017). The researchers stated that nearly 5% of all reports describe a drug’s indication as
an AE. According to the researchers, some reports classified diabetes as a side effect for
the drug rosiglitazone used to treat type 2 diabetes. To ameliorate the FAERS system, the
researchers encouraged proper reporter education for the purpose of minimizing the
number of reports in which misinterpretations between indication and side effect occur
(Mezher, 2017).
Despite the limitations of the FAERS SRS, submitted ADR reports assist in the
detection of serious AE (SAE)s that are subsequently included in the labeling information

27
of a drug. However, additional regulations, such as removing the product from the
market, can be imposed in extreme circumstances.
European Union Countries in Which Direct ADR Reporting Is Accepted
ADRs are considered a serious issue to the health of the public not only on the
terrain of the US, but on the international arena as well. Researchers have conjectured
that ADRs are responsible for circa 5% of all hospitalizations in the European Union
(EU) countries (Van-Lierop & Bunyan, 2008). Furthermore, ADRs are the fifth leading
cause of mortality in a hospital setting, thereby comprising almost 200,000 mortalities on
an annual basis (Van-Lierop & Bunyan, 2008). Researchers have stated that between 1%
to 10% of serious ADRs are reported in EU countries, thereby defining under-reporting to
be prevalent not only in the US, but internationally as well (Prescrire International, 2015).
The history of ADR reporting in the EU is newer in comparison to that of the US.
Denmark and the Netherlands were among the pioneering nations that began to accept
ADR reporting by patients and consumers circa 2003. Italy, the UK, and Sweden
followed their lead in 2004, 2005, and 2008, respectively (Herxheimer, Crombag, &
Alves, 2010). Although many other countries have been currently accepting direct
consumer ADR reporting, including, but not limited to, Bulgaria, France, Portugal,
Romania, and Norway, this literature review will only discuss Denmark, the Netherlands,
and Sweden, which are the most experienced countries in consumer reporting (Health
Action International, 2015).
Since 2003, Denmark has been accepting consumer reporting directly to the
Danish Health and Medicines Authority (Danish Medicines Agency [DHMA],
28
Sundhedsstyrelsen). Given that under-reporting is a considerable issue in Denmark, the
DHMA has implemented and launched several information campaigns for the purpose of
promoting spontaneous ADR reporting. In 2007, pharmacies and healthcare providers
were issued brochures containing information on how to better consumer reporting
electronically. Analogously, in 2010, the DHMA organized programs for health
institutions’ phone counseling services in an effort to provide additional information on
ADRs and direct consumer ADR reporting (Blenkinsopp et al., 2007). In 2013, the
DHMA initiated an awareness-raising campaign entitled “Not everybody reacts the
same” in which pharmacies and health centers partnered with patient organizations in an
effort to further stimulate consumer reporting (Blenkinsopp et al., 2007). Thanks to the
efforts of DHMA initiatives and awareness-raising campaigns, the surveillance system
used in Denmark has markedly improved, as evidenced by an increase in the number of
ADR reports submitted to the DHMA. In 2013, the DHMA received 6,681 reports of
suspected ADRs, which indicated an increase of 35% versus those in 2012 (Blenkinsopp
et al., 2007). Additionally, in 2014, the DHMA directed its attention to increasing ADR
reporting not only among consumers, but also among family members and physicians
within the mental health sector.
Similar to Denmark, the Netherlands established its direct consumer reporting to
regulatory authorities in April 2003 via the Lareb Center, which is a specialized national
center and an independent source of SRS in the Netherlands (WHO, 2002). Lareb accepts
ADR reports directly submitted by patients, consumers, HCPs, and other reporter types
and subsequently examines reports to determine the impact of patient reports on PV.

29
Since 2013, Lareb has been appointed by the WHO Collaborating Center for PV in
Education and Patient Reporting to aid WHO providing training workshops to Member
Countries on the process of managing consumer reports (WHO, 2002). Analogous to the
DHMA in Denmark, Lareb in the Netherlands has also been actively involved in
launching awareness campaigns designed to provide education to consumers regarding
submitting ADR reports electronically. Consequently, direct consumer reporting in the
Netherlands has been enhanced, as evidenced by the number of total ADR reports
submitted. In 2013 and 2014, Lareb collected more than 17,000 reports, and circa one-
fourth of them were submitted by patients/consumers. Moreover, according to the 2014
data from Lareb, 95% of direct ADR reports were submitted electronically (Health
Action International, 2015).
In 2008, Sweden has implemented direct patient reporting to the Swedish Medical
Product Agency (Medical Products Agency [MPA], Läkemedelsverket), which, similar to
Denmark and the Netherlands, has launched campaigns and information sessions
designed to raise awareness on consumer reporting and educate consumers on directly
submitting ADR reports electronically. As a result, direct consumer reporting in Sweden
(in addition to improvements in online reporting mechanisms) has been heightened, as
exemplified by the increase in the total number of ADR reports submitted to the MPA. In
2013, more than 6,000 ADR reports were submitted to the MPA, and circa 18% and 83%
of those reports were directly submitted by consumers and HCPs, respectively.
Furthermore, in 2014, nearly 7,000 ADR reports were received by the MPA, and nearly a
30
quarter of those reports were submitted electronically by consumers (Health Action
International, 2015).
Medical Dictionary for Regulatory Activities Overview
In an effort to further safeguard the health and well-being of patients and
consumers on a global scale, a set of standardized, harmonized, and universal medical
terminology was needed to enable the electronic dissemination of medical information
and suspected ADRs among regulatory officials and agencies, pharmaceutical companies,
clinical research organizations, biotechnology firms, HCPs, academics, and other
researchers on an international level (International Council for Harmonisation [ICH],
2013). Circa March 1999, the International Council for Harmonisation of Technical
Requirements for Pharmaceuticals for Human Use (ICH) created an international,
clinically validated medical dictionary, known as The Medical Dictionary for Regulatory
Activities (MedDRA), which contains a standardized set of terms pertaining to medical
conditions, medical products and devices, and medicines that can be transmitted to
regulatory agencies and pharmaceutical companies (ICH, 2013).
MedDRA can be employed for signal monitoring and detection, data input,
coding, and retrieval, and assessment of products. Furthermore, MedDRA is crucial
during the pre- and postmarketing phase of products, including, but not limited to,
pharmaceuticals, biologics, vaccines, and drug-device combination products (ICH, 2013).
MedDRA also contains standardized terminology for the classification and
characterization of AEs, as well as the following medical information: symptoms, signs,
diseases, syndromes and diagnoses; problems with a system, organ, or etiology (i.e.,

31
Infections); errors and failures in medical devices and products; medication errors;
medical, social, and family history information; application, implant, and injection sites;
medical and surgical procedures; approved uses for medications and medical devices;
and, types of investigations (i.e., liver function analyses, metabolism tests) (ICH, 2013).
One of the chief advantages of MedDRA is its ability to group and analyze AEs
according to its own hierarchical structure (ICH, 2013). MedDRA is organized into five
levels ranging from very specific to very general (ICH, 2013). The most specific level is
known as the “Lowest Level Terms” (LLTs), which contain greater than 70,000 terms
that describe medical information. These LLTs depict the manner in which an
observation or case can be reported (ICH, 2013). The next level, known as “Preferred
Terms” (PTs), contains more than 20,000 terms, which are single medical concepts that
characterize a symptom, sign, disease diagnosis, therapeutic indication, investigation,
surgical or medical procedure, and medical social or family history characteristic (ICH,
2013). Each LLT is linked to only one PT, while each PT has at least one LLT (itself) in
addition to synonyms (different terms for the same concept) and lexical variants (i.e.,
abbreviations, different word forms for the same expression). Related PTs are combined
into more than 1,700 “High Level Terms” (HLTs) on the basis of anatomy, pathology,
physiology, etiology, or function (ICH, 2013). Subsequently, HLTs are linked to 330
“High Level Group Terms”, which are finally grouped into 26 “SOCs”, which form the
most general level of the MedDRA hierarchy. SOCs are groupings by etiology
(e.g. Infections and infestations), manifestation site (e.g. Gastrointestinal disorders) or
purpose (e.g. Surgical and medical procedures). In addition, there is a SOC relating to

32
products and one to contain social circumstances. SOCs are comprised of more specific
subgroups that combine single medical concepts and equal terms used for codifying
clinical information associated with AEs and ADRs (ICH, 2013).
Given the significance of MedDRA in the coding of AEs and ADRs based on its
five-level hierarchical structure, especially SOC, MedDRA will be employed for coding
ADRs reported by consumers and physicians in this study. Hence, SOCs will be
identified via this method and compared according to reporter.
Theoretical Foundation
The theoretical foundation that is the most applicable to this study is known as
SARF, which stems from the perception of risk framework. Risk comprises the likelihood
and repercussions of the occurrence of an event (Adams, 1995). Researchers have
theorized that individuals tend to differ between their attitude toward a likelihood or
repercussion (Drottz-Sjöberg, 1991). A majority of definitions of risk include a
probability estimate for the occurrence of a negative event (Brun, 1994). Adams (1995)
explained risk (as per the definitions contained within medical and drug safety literature)
as the likelihood that an AE occurring in the future is multiplied by its magnitude
(Adams, 1995).
The theory holds that risk interrelates with the psychological, social, institutional,
and cultural perceptions of individuals in a manner that may magnify or diminish
individuals’ responses to the risk or risk event (Kasperson & Ratick, 1988). These
changes in the perception of risk elicit behavioral responses from individuals that alter
the social and economic aspects of society, thereby increasing or decreasing the actual
33
physical risk (Kasperson & Ratick, 1988). Researchers have identified variations between
HCPs and consumers in terms of reporting ADRs (Aagaard et al., 2009). SARF may be
employed to elucidate the differences between HCPs and consumers’ reporting of ADRs.
The perception of risk as it applies to the present issue involves the premise that different
groups (HCPs and non-HCPs, researchers and the public, or HCPs and consumers) hold
different views on the possible risks associated with some action or environment.
Researchers have discovered that several factors contribute to the perception of risk,
including factors related to the individual, the presentation of the risk, and the attributes
of the risk (Association of Reproductive Health Professionals, 2006). Hence, with respect
to ADR reporting and drug therapy, consumers frequently have contrasting views in their
perception of risk versus HCPs (Aronson, 2006). Therefore, the SARF framework is
appropriate for this study with regards to identifying under-reporting of ADRs since it is
assumed that the consumer’s perception of risk differs from that of the physician.
The studies conducted by Bongard et al. (2002) and Durrie, Hurault, Damase-
Michel, & Montastruc (2009) employ a similar theoretical foundation in relation to this
study. The results from these studies have revealed how consumer’s perception of risk
differs from that of the physician, thereby justifying the use of the SARF framework. To
determine whether perceived risk differs between HCPs and non-HCPs (consumers),
researchers Bongard et al. (2002) conducted a study on 400 HCPs (consisting of general
practitioners, pharmacists, and PV professionals) and 153 non-HCPs. To comprehend the
risk perception of ADRs within the medical arena in comparison to the public, the
researchers requested study participants to evaluate their risk perception of ADRs related

34
to 13 different drug classes via visual analogue scales, which were utilized to define a
score of perceived risk of ADRs related to each drug class (ranking from 0 to 10). Based
on the results from the study conducted by Bongard et al. (2002), the authors claimed that
the risk perception of ADRs varied between both groups. HCPs gave the highest and
second highest ranking to anticoagulants and nonsteroidal anti-inflammatory drugs
(NSAIDs), respectively, thereby claiming that these drugs were most hazardous to the
health and safety of patients and consumers. Contrarily, consumers gave a lower ranking
to anticoagulants and NSAIDs, thereby claiming that these drugs posed a lesser threat.
Moreover, non-HCPs gave the lowest ranking to aspirin, thereby stating that this drug
posed the least threat. However, the ADRs related to the aforementioned drugs are
significant, especially gastrointestinal (GI)-related ones. This perception of the safety of
aspirin by the consumer may partially be attributed to the dearth of information presented
on the risk of aspirin and the excess of information presented to the consumer through
advertisements, Internet, and commercials (Durrie et al., 2009). Hence, the authors
concluded that the public was incognizant of such ADRs and, therefore, underrated the
risk associated with NSAIDs (Bongard et al., 2002). Additional findings from the study
by Bongard et al. (2002) revealed that consumers gave the highest rank to sleeping pills,
followed by tranquillizers and antidepressant drugs. Additionally, consumers highly
ranked psychotropic drugs, thereby asserting that these drugs posed the greatest risk.
Bongard et al. (2002) acknowledged that mass media’s linking of psychotropic drugs
with frequent suicide attempts may have influenced the public’s perception of high-risk
regarding these drugs. Since consumers and HCPs perceived the dangers of one drug
35
class over another drug class differently, the authors concluded that HCPs and non-HCPs
possess differing risk perceptions of ADRs. Hence, the results from the study conducted
by Bongard et al. (2002) bolster the claim that risk perception of ADRs varies between
consumers and HCPs, which is crucial for this study and which may explain why HCPs
report ADRs less frequently in comparison to non-HCPs.
Durrie et al. (2009) conducted a study that assessed the perceived risk of ADRs
among 92 medical students (63 females and 29 males) and examined whether the
perceived risk of ADRs differs before and after taking pharmacology courses and found
this to be the case. The authors requested the medical student study participants to assess
their risk perception of ADRs related to 13 different drug classes prior and subsequent to
the pharmacology courses via a visual analogue scale, which was employed to define a
score of perceived risk of ADRs related to each drug class (ranking from 0 to 10). The
following drug classes were assessed: antibiotics; anticoagulants; antidepressants; aspirin;
contraceptive pill; corticosteroids; drugs for arterial hypertension; drugs for diabetes
(other than insulin); hypnotics; hypocholesterolaemic drugs; NSAIDs; postmenopausal
hormone replacement therapy; and, tranquilizers. The findings from the study conducted
by Durrie et al. (2009) revealed that the perceived risk of ADRs by medical students was
different after taking pharmacology courses. Based on the results from the authors’ study,
the authors claimed that, prior to the pharmacology courses, medical students ranked
hypnotics as the most hazardous drug (followed by antidepressants and anticoagulants)
and contraceptive pills as the least hazardous. After pharmacology courses,
antidepressants were ranked as the most dangerous drugs by medical students, followed

36
by anticoagulants and hypnotics. The authors claimed that, aside from several classes of
drugs (antidiabetics, antihypertensive drugs, tranquillizers, corticosteroids, and
hypnotics), upon completion of the pharmacology courses, there was a statistically
significant increase in perceived risk for other classes of drugs. The highest increases
were observed for contraceptive pills, NSAIDs, and aspirin, while the lowest increases
were observed for hypocholesterolaemic and antidepressant drugs. The authors concluded
that after completion of the pharmacology courses, medical students became more
cognizant of potentially serious ADRs that are associated with drugs deemed relatively
safe by non-HCPs, such as NSAIDs and aspirin. Hence, the findings from the study
conducted by Durrie et al. (2009) are critical to this study and may explain the need for
efficacious training and preparation, as well as adequate information for HCPs on ADRs,
which may explain the under-reporting of ADRs by HCPs.
Literature Review of Consumer Versus Healthcare Professional ADR Reporting
In a published review that compared patient and physician reporting of suspected
ADRs, the authors of Health Action International (2015) claimed that although HCPs are
an essential element of evidence regarding the safety and efficacy of medicine and
pharmaceutical drugs, they do not report ADRs as frequently as they should (Health
Action International, 2015). To the author’s opinion, one of the greatest challenges to
reporting ADRs by physicians is the shortage of time. The same authors argue that
physicians see many patients during their clinical visits per day and are often preoccupied
with completing medical records and forms, as well as attending to other clinical
priorities within the office or hospital setting. Consequently, HCPs only report the ADRs

37
they deem the most serious, as well as ADRs they may ascertain as associated with the
usage of medicines or drugs. Moreover, although patients consider certain ADRs to be
highly important with regards to affecting their quality-of-life, HCPs tend to not view
such ADRs in the same aspect. The same authors of stated that patients’ reports of their
personal reactions to the drugs and the drugs’ impact on their quality-of-life are typically
more detailed than physicians’ reports of their patients’ ADRs. Hence, the same authors
argued that if patients can collaborate with their physicians and discuss the ADRs
experienced by patients, both parties may contribute to delivering effective reports of
prospective safety issues of the drugs. Therefore, the authors of Health Action
International (2015) contended that it is essential to combine the reports from HCPs and
patients, as such a procedure may foster the growth and progression of systems of PV
within Europe.
Parrella et al. (2014) performed computer assisted telephone interviews of 191
South Australian parents who reported an AE following immunization (AEFI) of their
children. The authors compared parents reporting their children’s AEFI to either HCPs or
surveillance authorities with those who did not report their children’s AEFI based on the
following factors: awareness of surveillance, vaccine safety opinions, and demographics.
Based on the findings from their study, Parrella et al. (2014) claimed that reporting an
AEFI to an HCP or a surveillance authority was not statistically significantly related to an
awareness of a surveillance system. Furthermore, the authors stated that there was a
statistically significant relationship between AEFI reporters and the perception that a
serious reaction was more likely to occur at their children’s last immunization. Based on

38
their findings, the authors claimed that while reporting an AEFI was not statistically
significantly related to an awareness of surveillance or socio-demographic factors, the
findings revealed some differences in safety opinions. Parrella et al. (2014) concluded
that additional research is needed to determine if these differences have existed or have
occurred at a date earlier than the incidence of an AEFI or whether these differences are a
result of the AEFI. The authors emphasized the significance of consumer reporting for
postmarketing vaccine safety surveillance.
The aim of the descriptive-cross-sectional study performed by Vural, Ciftci, and
Vural (2014) was to examine the knowledge, attitudes, and behaviors of 112 nurses
employed in a public hospital regarding PV, ADRs, and AE reporting via a questionnaire.
Based on the findings of their study, the authors claimed that nearly 74% of the nurses
were cognizant of the definition of “severe adverse effect” of drug therapy. Almost 35%
of nurses were aware that ADRs are reported to a contact individual working in the
Turkish PV Center (TÜFAM). The same authors stated that while circa 70% of nurses
had knowledge of the importance of ADR reporting, only 8% of the nurses actually
reported ADRs to the TÜFAM. Based on these results, the authors stated that ADR event
reporting was low among nurses. The authors concluded that the findings from their
study revealed a deficit in knowledge regarding PV and ADR reporting. Vural et al.
(2014) stressed the need for additional research to ameliorate the rate of reporting and to
enhance the knowledge and understanding of PV not only among nurses, but also other
healthcare practitioners.

39
Alatawi et al. (2017) compared reporting rates in FAERS to expected rates of
known adverse drug events (ADEs). The authors chose three groups of drugs, including
statins, biologics, and narrow therapeutics index drugs (NTI) to determine the difference
in sensitivity to reporting. The results from the authors’ research revealed that most drug-
ADE pairs were statistically significantly under-reported by both consumers and
physicians. The authors contended that the reporting differences between consumers and
providers potentially stem from their perceptions of the seriousness of an ADE, which
subsequently necessitates whether an event report needs to be made and submitted to the
FDA. The authors claimed that circa 20% to 33% of the minimum number of expected
serious AEs were reported with biologics and NTI drugs. The authors stated that under-
reporting by both consumers and physicians significantly differs by the types of drug and
perceived severity of ADRs, and an understanding of this difference in under-reporting is
necessary when interpreting safety signals. The authors concluded that their study
explains the rate of under-reporting of ADEs in spontaneous reporting data within the
FAERS database.
The objectives of the study conducted by Di Maio et al. (2015) were to: compare
reporting by patients and HCPs of six toxicities (anorexia, nausea, vomiting, constipation,
diarrhea, and hair loss) occurring during anticancer treatment based on data prospectively
collected in three randomized trials; determine the agreement between patients’ and
physicians’ reports; and, calculate the rate of possible under-reporting of AEs by
physicians. The authors calculated toxicity rates for each toxicity, as well as computed
the agreement between patients and physicians (via inter-rater reliability scores) and the

40
under-reporting rate by HCPs. The results of their study revealed that the agreement
between patients and physicians was rather low for all toxicities. Moreover, toxicity rates
reported by HCPs were lower in comparison to those reported by patients. For patients
who reported any severity of toxicity level (based on their responses of either “not at all,”
“a little,” “quite a bit,” or “very much” on a quality-of-life questionnaire), under-
reporting by physicians ranged from 40.7% to 74.4%. For patients who reported “very
much” toxicity, under-reporting by physicians ranged from 13.0% to 50.0%. The authors
concluded that subjective toxicities were highly under-reported by physicians, even when
prospectively gathered within randomized trials. Based on the findings from their study,
the authors accentuated the need for patient reporting and encouraged the inclusion of
patient-reported outcomes into toxicity reporting within clinical trials.
Medawar and Herxheimer (2004) conducted research in the UK comparing the
reports from patients and primary care physicians regarding suspected reactions to an
antidepressant drug called paroxetine. The doctors’ reports were submitted via the
Yellow Card (YC) scheme – an information-collecting UK system for suspected ADRs to
medicines and drugs (Yellowcard, 2017). Based on the results from the research of
Medawar and Herxheimer (2004), in comparison to reports from the YC, reports from
patients were more comprehensive and specific, thereby detailing suicidality and
withdrawal symptoms, including, but not limited to, weight gain, suicidal behavior,
and/or loss of libido, in a lucid manner. Hence, the authors argued that reports from
patients conveyed important information regarding ADRs that medical professionals
were unable to deliver. Thus, the same authors concluded that an increase in physician

41
reporting, in conjunction with patient reporting, especially patients who directly report to
physicians, would decrease the rate of under-reporting and ultimately play a potent role in
PV and drug safety.
The objective of the study conducted by Farquhar et al. (2015) was to determine
the proportion of maternal and perinatal death and illness cases due to SAEs by
comparing the case reports from the Perinatal and Maternal Mortality Review Committee
(PMMRC) to those from the Health Quality and Safety Commission (HQSC) in New
Zealand. Based on the results from the study, the authors stated that less than 9% of
maternal and perinatal SAEs were identified by the HQSC SAE reporting system.
Farquhar et al. (2015) claimed that the proportion of maternal and perinatal AE reporting
to the HQSC is low in comparison to that of PMMRC reporting of AEs. The authors
concluded that these SAEs were not undergoing sufficient scrutiny at the local level and,
consequently, the reporting of SAEs to the HQSC may not be a valid method to detect or
ameliorate the quality of maternity services offered in New Zealand.
Moore and Bennett (2012) employed incidence studies that have been previously
published to compute reporting rates for hemorrhage, emergency hospitalization, and
venous thromboembolism (VTE) associated with four drugs: warfarin, clopidogrel,
ticlopidine, and thalidomide. The AEs were reported by healthcare providers to the
FDA’s FAERS system. The authors discovered the following annual reporting rates with
an associated AE: 1.15% for more than 33,000 emergency hospitalizations linked to
warfarin for patients aged 65 years or older; 0.98% for greater than 13,000
hospitalizations attributed to clopidogrel and ticlopidine; and, 1.02% for more than

42
67,000 hemorrhage cases associated with warfarin. Moreover, the results from their
research revealed a 9-year reporting rate of 2.33% for 48,000 VTE AEs linked to
thalidomide. Based on these findings, Moore and Bennett (2012) stated that the incidence
of these hematologic AEs is considerably high and reporting rates are rather low (near the
lower boundary of the 1 to 15% range evident for other events). The same authors
concluded that given the low reporting rates of AEs, the FDA FAERS system should be
examined.
Goldsmith, Aikin, Encinosa, & Nardinelli (2012) studied AE reports for 123
drugs that originated directly from patients prior and subsequent to the 2007 US federal
mandate of the print direct-to-consumer advertisement, which provides consumers with
information to directly contact the FDA (via phone or agency’s website) in order to report
any AEs experienced following the consumption of medicines. The authors assessed the
impact of this mandate via statistical model simulations and discovered that, if monthly
expenditures on print direct-to-consumer advertising increased from 0 to $7.7 million per
drug, patient-reported AEs would increase by three times (versus patient-reported AEs
prior to the mandate). However, based on their findings, the authors claimed that the
absolute increase per month was less than 0.24 reports per drug, thereby suggesting that
the influence of the increase on the health of the public was rather small and that the AE
reporting rate was still considerably low. The same authors concluded that additional
measures, including a greater awareness of FDA FAERs, in addition to an increase in
consumer education, is encouraged to stimulate patient reporting of AEs.

43
Blenkinsopp et al. (2007), examined literature on international experience from
six countries, as well as seven studies that surveyed patients in hospital or primary care.
According to the authors, published research has divulged findings suggesting that
patients are inclined to detect and report more ADRs in comparison to HCPs. However,
some patients neither discuss their ADRs with their HCPs nor do they report to healthcare
authorities and regulatory agencies. The same authors admitted that although the root
cause of patients failing to disclose all their ADRs to their physicians has not been
elucidated, the results from their research can nonetheless provide some evidence of
under-reporting of ADRs by patients due to patients’ viewpoint that there was insufficient
communication with their primary care physicians. Hence, Blenkinsopp et al. (2007)
concluded that it is essential for patients concerns to be expressed and reported to health
authorities.
Van Hunsel, Passler, & Grootheest (2009) compared ADR reports from patients
and medical professionals regarding the advantages and jeopardies of statins. Based on
the findings from the authors’ research, a majority of the patients claimed that they did
not receive proper knowledge about the drug, as well as adequate guidance from their
physicians regarding the side effects from the drug. Consequently, patients, rather than
HCPs, reported more frequently musculoskeletal and connective tissue disorders relating
to statins. The same authors believed that HCPs refrained from reporting these ADRs to
PV agencies due to them being specified in the Summary of Product Characteristics of
statins. The results from the authors’ research suggested that patient reports may yield
insight into ADRs, especially those that have not been previously known. Hence,

44
Van Hunsel et al. (2009) concluded that patients’ apprehensions regarding ADRs should
be acknowledged in reports to national PV agencies.
The study by Golomb, McGraw, Evans, & Dimsdale (2007) examined patients’
viewpoint of the patient-physician relationship, as well as physicians’ acknowledgment
of their patients’ reporting of suspected ADRs resulting from statins, a class of drugs that
lower the cholesterol level in the body. The findings from the study showed that 87% of
patients instigated the conversation with their physicians regarding their condition after
being treated with statins. Physicians were more inclined to refute than confirm the
potential association between ADRs and statins by disregarding their patients’ symptoms
and possibility of those symptoms’ relationship to statin use. Hence, Golomb et al.
(2007) argued that physicians’ failure to properly communicate with their patients might
be the cause of under-reporting of ADRs by primary care physicians. Therefore, the same
authors suggested an all-encompassing active postmarketing surveillance undertaking to
target patients to report ADRs may contribute to an amelioration of ADR reporting
systems.
The studies conducted by Aagaard et al. (2009) and de Langen, van Hunsel,
Passier, de Jong-van den Berg, & Van Grootheest (2008) employ a similar type of data
collection and/or data analysis methods in relation to this study. Aagaard et al. (2009)
conducted a retrospective study by employing the Danish ADR database to compare
ADR reports between consumers and other sources, including physicians, pharmacists,
lawyers, pharmaceutical companies and other HCPs. Aagaard et al. (2009) examined
6,319 ADR reports containing 15,531 ADRs from 2004 to 2006 and analyzed the data

45
from these reports with regards to the reporter category, severity of the ADRs, the
category of ADRs by SOC, and the suspected medicines on level 1 of the ATC
classification system. The same authors computed chi-square and ORs to determine the
relationship between the type of reporter and reported ADRs (classified by ATC or SOC).
The confidence interval (95%) was calculated for all the ORs. Based on the results from
the study of Aagaard et al. (2009), consumers reported 11% of the ADRs. Consumers’
reporting of serious ADRs was analogous to that of physicians (approximately 45%),
though lower than that of pharmacists and other HCPs. Consumers provided a different
perspective of the ADRs, especially for the disorders of the nervous system. Furthermore,
the same authors discovered that consumer reports provided greater detail on the
prospective diagnosis made by the consumers themselves, which is a finding that HCPs
do not typically anticipate from non-HCPs. In comparison to other sources, consumers
were more likely to report ADRs from the following SOCs: nervous system disorders
(OR = 1.27); psychiatric disorders (OR = 1.70); and, reproductive system and breast
disorders (OR = 1.27). Moreover, compared with other sources, consumers were less
likely to report ADRs from the SOCs blood and lymphatic system disorders (OR = 0.22)
and hepatobiliary system disorders (OR = 0.14). Aagaard et al. (2009) stated that, in
comparison to other sources, consumers were more likely to report ADRs from the
following ATC groups: N (nervous system) (OR = 2.72); P (antiparasitic products) (OR =
2.41); and, S (sensory organs) (OR = 4.79). Additionally, compared with other sources,
consumers were less likely to report ADRs from the following ATC groups: B (blood and
blood-forming organs) (OR = 0.04); J (anti-infective for systemic use) (OR = 0.44); L

46
(antioneoplastic and immunomodulating agents) (OR = 0.19); and, V (various) (OR =
0.03). In the SOC ‘nervous system disorders’, consumers reported seven categories of
ADRs, two of which were dysgraphia and parosmia, that were not reported by the other
sources. Aagaard et al. (2009) claimed that, in comparison to other sources, consumers
reported different categories of ADRs for different types of SOCs and ATC groups.
Hence, the authors concluded that consumers should be active participants within
systematic drug surveillance systems, including clinical settings, and their reports should
be treated with as much importance as those from other sources. The study conducted by
Aagaard et al. (2009) revealed significant findings suggesting that, in comparison to other
sources, consumers reported different categories of ADRs for different types of drugs.
Similar to this study’s quantitative methodology (Chapter 3), the chi-square and the OR
in the study by Aagaard et al. (2009) were computed to determine the relationship
between the type of reporter and seriousness, as well as type of reporter and type of
reported ADRs (classified by ATC or SOC). Although this study will not be focusing on
ATC, the authors’ statistical framework will nonetheless be beneficial to use in an effort
to compare and contrast the results from this study.
de Langen et al. (2008) performed a study that compared ADR reports between
consumers and HCPs from the Netherlands PV Center Lareb within a three-year time
period from April 2004 to April 2007. Consequently, my study will focus on the US and
the FDA FAERS database and focus solely on physician versus consumer, unlike Langen
et al. (2008). This is important to be studied, as the lack of AE reporting is a limitation of
current PV systems within the US, thereby hindering regulators’ ability to quantify risk of

47
under-reporting of ADRs. My study will ultimately see if the FDA FAERS database is
lacking in reporting of ADRs by consumers and/or physicians, thereby determining if
FAERS needs improvement in this area. The authors examined 2,522 ADR reports
comprising 5,401 ADRs that were submitted by consumers, and 10,635 reports
comprising 16,722 ADRs that were submitted by HCPs. The authors analyzed the data
from these reports with regards to the age and gender of the reporters, the attributes of the
most frequently reported drugs, and the attributes of the most frequently reported ADRs,
their seriousness, and their outcome. de Langen et al. (2008) computed chi-square to
determine the relationship between the type of reporter (patient versus HCP), the number
of reports submitted by type of reporter, patient characteristics, and information regarding
the reported drugs and ADRs. Furthermore, the authors employed the t-test to determine
statistically significant differences in the male to female ratio among reports from
patients and HCPs.
de Langen et al. (2008) discovered statistically significant differences between
patient reports and reports from HCPs with regards to the seriousness and outcome of
reported ADRs in the Netherlands. In comparison to HCPs, patients reported a
significantly higher number of LT ADRs (5.2% vs 2.7%) and disability (2.3% vs 0.4%).
Moreover, patients reported significantly fewer ADRs leading to death (0.6% vs 1.5%)
and hospitalization or prolongation of hospitalization (9.8% vs 12.0%). The authors also
determined statistically significant differences in the outcome of the reported ADRs
between patients and HCPs (87% vs 68%). Patients reported non-recovery (35.4%) from
the ADR significantly more often than HCPs (16.7%). Contrarily, the same authors

48
claimed that no statistically significant differences were determined between patient
reports and reports from HCPs with regards to the following attributes: patient
characteristics (age and gender); most frequently reported ADRs from the five most
involved organ systems (nervous system disorders, psychiatric disorders, gastrointestinal
disorders, musculoskeletal disorders and general disorders/administration site
conditions); and, most frequently reported drugs from the five most reported drug
categories (HMG Co-A reductase inhibitors (“statins”), selective serotonin reuptake
inhibitors, B-adrenoceptor antagonists (“B-blockers”), anticoagulants, and proton pump
inhibitors). In addition to the aforementioned findings, de Langen et al. (2008) also
discovered that patient reports offered an entirely different perspective in comparison to
those of HCPs, especially in terms of recovery (full versus non-recovery).
The authors accentuated that although patient reporting should not substitute HCP
reporting, (as HCPs are a reliable source for ADR reporting), patient reporting may
nonetheless serve as a crucial component in healthcare, thereby placing patient safety and
greater access to efficacious drugs at the forefront of PV. The authors encouraged the
recognition and acknowledgment of patient reports, which they claimed will increase the
number of reported ADRs received within a certain timeframe, thereby ultimately
augmenting the statistical power for signal detection in an effort to yield signal detection
of new ADRs. Hence, the same authors concluded that patient reporting in SRSs is
advantageous, thereby fostering a valid PV.
The study conducted by de Langen et al. (2008) revealed significant findings
suggesting that patients reported ADRs differently from HCPs with respect to the

49
seriousness and outcome of reported ADRs. Similar to the quantitative methodology in
this study, the chi-square in the study by de Langen et al. (2008) was calculated to
determine the relationship between the type of reporter (patient versus HCP) and
seriousness and outcome of reported ADRs, patient characteristics, and attributes of the
most frequently reported ADRs.
Summary and Conclusions
The findings from the literature review suggested that consumer reporting is
imperative to successful PV. Researchers have argued that consumer reporting would
increase the number of spontaneous reports submitted, which would subsequently
enhance SRSs (Aagaard et al., 2009; de Langen et al., 2008; Blenkinsopp et al., 2007;
van Hunsel et al., 2009). Within their reports, consumers may provide an in-depth
account of their symptoms while consuming medication, thereby unveiling potential and
new ADRs that may otherwise have been unknown and undetected (WHO, 2012). Based
on the results from the literature review, the quality of reports from consumers is akin to
or even higher than that of reports from HCPs, especially in terms of identifying potential
new ADRs that had not previously been reported by HCPs (Blenkinsopp et al., 2007).
The findings from the study conducted by Aagaard et al. (2009) and de Langen et al.
(2008) revealed that, in comparison to physician reports, consumers reported different
categories of ADRs for different types of medicines, thereby providing a unique
perspective of their experiences with ADRs (Aagaard et al., 2009). By combining the
reports from consumers with those of HCPs, the SRSs may be filled with a plethora of
new information regarding ADRs, thereby accelerating signal detection (Health Action

50
International, 2015). Hence, the reports from consumers can deliver an understanding and
awareness of ADRs in greater detail (Herxheimer et al., 2010).
The results from the literature review revealed that a majority of ADRs are under-
reported since ADRs comprise more than 5% of all hospital admissions, and 10% of all
hospitalized patients. Findings have also shown that the overall reporting rate of ADRs is
circa 1%, although the rate considerably fluctuates due to the severity and type of
reaction, as well as the characteristics of the drug. Furthermore, reporting rates of
suspected ADRs by medical professionals is substantially low (Medawar & Herxheimer,
2004). Published research has shown that patients are inclined to detect and report more
ADRs in comparison to HCPs. However, findings have also suggested that spontaneous
reports from patients comprise a small proportion of total official reports, thereby
emphasizing the importance of encouraging patient reporting of suspected ADRs and
incorporating such reports into official systems (Blenkinsopp et al., 2007). While a
scarcity of research has been published to assess the spontaneous reporting of suspected
ADRs by patients, considerable and noteworthy experience from several countries in
which patient reporting has progressed has divulged evidence that patients have detected
potential new ADRs (Blenkinsopp et al., 2007; Medawar & Herxheimer, 2004). The
select few countries that have released the reported experience of patients confirmed that
such a patient reporting system will enable greater comprehension of consumer
perceptions, which will ultimately lead to ameliorations in patient reporting. Thus, the
advent of patient reporting should be taken into consideration by other countries
(Blenkinsopp et al., 2007).

51
To date, there are no studies that compared and contrasted consumer reports with
those of HCPs based on patient outcome in the US. Therefore, I will examine in my study
the statistical significance in the distribution of case and event level ADRs within the
FAERS database by non-HCPs (consumers) and HCPs (physicians) and patient outcome
in an effort to fill the gap in the literature. In Chapter 3, I provide the research methods
that will be employed for performing the secondary data analysis of the data contained in
the FAERS database. In Chapter 4, I provide the results of the study. Lastly, in Chapter 5,
I provide a discussion of the results, study limitations, recommendations for future
research, and the implications for social change.
52
Chapter 3: Research Method
Introduction
In the previous chapter, I provided a literature review of consumer versus
physician under-reporting, identified the existing gap in the literature, and discussed the
theoretical framework that is the most applicable to this study. Specifically, in this study,
I assessed whether a statistically significant difference existed in the distribution of case
and event level ADRs by reporter (consumer versus physician) and patient outcome, as
well as SOC and reporter demographics. The differences in under-reporting of physicians
versus consumers were explored and compared to determine whether consumer reporting
is imperative in AE reporting. It was anticipated that the outcome would impact
frequency of physician and consumer reporting, as well as the differences in reporting
rates between them. The independent variable was the reporter (consumer versus
physician), whereas patient outcome, SOC, and reporter demographics were the
dependent variables. The unit of analysis was the total number of ADR cases and
reported ADRs. This chapter provides a description of the statistical methodology that
was employed to compare consumer and physician reporting of ADRs. The essential
elements of this study, including the research design, setting and sample, materials, data
collection and analysis, threats to validity, and measures taken for protection of
participants’ rights, are discussed in this chapter.
Research Design and Rationale
In this study, I followed the design employed by Aagaard et al. (2009) in their
analysis of the Danish ADR database known as The Danish Medicines Agency (Aagaard

53
et al., 2009). My study was cross-sectional and descriptive, and the non-experimental
research design (known as the cross-sectional design) was employed to compare case and
event level ADRs between reporters (consumer and physician), specifically, for the total
number of case and event level ADRs reported and patient outcome, as well as SOC and
reporter demographics. The independent variable was the reporter (consumer and
physician), whereas patient outcome, SOC, and reporter demographics were the
dependent variables. The unit of analysis was the total number of ADR cases and
reported ADRs. The analysis focused on describing statistical relationships between the
variables that have been chosen for examination. This particular design enabled data
collection without manipulating the independent variables (see Field, 2013). Hence, the
cross-sectional design enabled the examination of associations or relationships among the
aforementioned variables by using statistical data analysis techniques (see Frankfort-
Nachmias, 2014).
In this study, I employed quantitative methods, which are frequently used to
analyze spontaneous data (see Aagaard et al., 2009). Chi-square test and ORs, as the most
appropriate statistical methods, were conducted to investigate the relationship between
reporter and reported ADRs. The test for association or dependence between the reporter
and the total number of reported ADRs, as well as patient outcome, SOC, and reporter
demographics, were conducted using the chi-square test and/or logistic regression (unless
specified otherwise).
The chi-square test, as the most appropriate analytical strategy to employ in this
study, was used to test for association between two categorical variables (see Gerstman,

54
2008). The statistical significance in association between reporter and total number of
case and event level reported ADRs, as well as patient outcome, SOC, and reporter
demographics, were shown with a p-value of less than 0.05. Given the number of
comparisons of a similar nature, the issue of multiple comparisons arose. Furthermore,
since multiple hypotheses were tested, the chance of incorrectly rejecting a null
hypothesis (Type I error) was increased (Mittelhammer, Judge, & Miller, 2000).
Therefore, to counteract these issues, I employed the Bonferroni correction, which tested
each individual hypothesis at a significance level of α/m, where α was the desired overall
alpha level and m was the number of hypotheses (see Miller, 1966). In this study, I
adjusted for multiple comparisons by dividing my criterion of significance (0.05) by the
number of tests (8), which yielded 0.006 (i.e. 0.05/8=0.006). Subsequently, I employed
this number (0.006) as a benchmark to determine whether any comparison was
statistically significant.
The OR, which is another measure of association for categorical data, as well as
an additional appropriate method to employ in this study, was also used in conjunction
with logistic regression models (see Gertsman, 2008). The chi-square test illustrated that
an association exists, while the OR displayed the strength of the association. The
confidence intervals were calculated at 95% for each OR. Statistical analysis were
performed using a statistical software package (SPSS v25).

55
Methodology
Population
In this study, the target population were the reporters, consumers and physicians,
who both submitted ADR reports (cases) to the FDA. ADRs voluntarily reported by
consumers and physicians can be made directly to the market authorization holders of the
product, which is mandated by law to subsequently report these events to the FDA (FDA,
2017). ADRs reported by consumers can also be made directly to such regulatory
agencies as the FDA without making the initial report to their physicians (Health Action
International, 2015).
Sampling and Sampling Procedures
I hypothesized that the two groups, consumers and physicians, were independent,
and that the sample size of physician and consumer groups were unequal. Moreover, I
hypothesized that the number of ADRs at case and event level reported by consumers and
physicians were not the same. Furthermore, I hypothesized that physicians would report a
lower number of ADRs at case and event level in comparison to consumers. To ascertain
that the reporting differences between consumers and physicians were statistically
significant and were not due to chance, the difference between two independent
proportions (with unequal sample size per group) sample size calculation was performed.
Hence, the following sample size formula was employed: n1= [√p(1-p) (1 + 1/k) zα/2 + √
p1(1-p1) + p2(1-p2)/k zß]2 /(p1-p2)2, n2=kn1 (see Ott & Longnecker, 2008), where
zα/2 corresponds to a two-tailed significance level and is the critical value of the Normal
distribution at α/2 (for a confidence level of 95%, α is 0.05 and the critical value is

56
1.96); Zβ corresponds to power and is the critical value of the Normal distribution at β
(for a power of 80%, β is 0.2 and the critical value is 0.84); p1 and p2 were the expected
sample proportions of the two groups of participants (consumer versus physician); and,
k = ratio of larger group (consumers) to smaller group (physicians) of participants (see
Ott & Longnecker, 2008).
A total of 87,807 ADR reports and 143,399 ADRs (consumer [83,009 ADRs] and
physician [60,390 ADRs]) for the 2nd quarter of the year 2016 were analyzed.
Spontaneous ADRs were reported by consumers and physicians with α = 0.05 (two-
tailed) and the minimum required power level β = 0.80. For the difference between two
independent proportions (with unequal sample size per group) analysis, G*Power was
used to calculate the appropriate sample size based on the following criteria: z-test (a
two-tailed test); proportion for group 2 (consumers = 83,009/143,399 =.58); proportion
for group 1 (physicians = 60,390/143,399 =.42); an allocation ratio of n2/n1, which is the
ratio of larger group (consumers) to smaller group (physicians) of participants
(83,009/60,390 = 1.37); an 80% power; and, an alpha level of .05. Based on the
aforementioned assumptions, the appropriate total sample size needed for this particular
test was 312, with 132 and 180 sample sizes needed for each consumer and physician
group, respectively. Hence, the total sample size of 312 represented the minimum sample
size needed for sufficient power.
Data Collection Procedures
This study included ADRs at case and event level that were submitted by
consumers and physicians to the FDA via the FDA’s FAERS database, which contains

57
the latest quarterly data files that were extracted for analysis. Data were collected
subsequent to Institutional Review Board (IRB) approval in April 2018. The data
containing the spontaneous ADR reports from the FAERS database were accessed and
downloaded from the quarterly data file data selection time period: 01 April 2016 through
30 June 2016. The quarterly data files were available in two different formats: ASCII and
SGML. In the ASCII files, the data elements were separated from each other by a “$”
sign (“$ delimited”) (FDA, 2016b). The SGML files conform to the ICH guidelines
regarding transmission of individual case safety reports (FDA, 2016b). The data files
included, but were not limited to, the following data: demographic and administrative
information and the initial report image identification (ID) number; drug information
from the case reports; reaction information from the reports; patient outcome information
from the reports; information on the source of the reports; and, a “README” file
containing a description of the files (FDA, 2016).
The spontaneous ADR reports were initially collected in the form of raw data via
the MedWatch program, which is the FDA’s Safety Information and AE Reporting
Program that gathers reports of ADRs, medication or product use errors, and quality
issues associated with human medical products, medical devices, vaccines and other
biologics, dietary supplements, and cosmetics (FDA, 2017). Under MedWatch, HCPs,
including physicians, and consumers may voluntarily submit reports to the FDA when
they discover an issue or an adverse reaction with a drug, medical device, biologic, or
other FDA-regulated products. Subsequently, these data were thoroughly cleaned,
recorded, recoded, redacted, and stored as an electronic file in the FAERS database by
58
the FDA for accessibility (Hyman, 2000). Since the data had been previously coded and
redacted, the data were anonymously encrypted in form, with no personal identifiers
present. The data were in a line listing format in which a unique number known as the
individual safety report (ISR) was assigned for identifying an AER report (FDA, 2015).
A case number, which consists of one or more ISR, was assigned for identifying an
AERS case, and served as a link to the necessary variables for research. Once the ADR
data had been collected, spontaneous reports from consumers and physicians were
compared for ADRs at case and event level.
Instrumentation and Operationalization of Constructs
ADRs were coded using MedDRA, and ADRs at case and event level were
determined by the Council for International Organizations of Medical Sciences criteria
(EMEA, 1995). All ADR terms had been previously coded to the PT within FAERS, and
the PT was used to obtain the correct SOC. The codes for outcomes in the FAERS ASCII
files were as follows: DE = Death; LT = Life-Threatening; HO = Hospitalization−Initial
or Prolonged; DS = Disability; CA = Congenital Anomaly; RI = Required Intervention to
Prevent Permanent Impairment/Damage; and, OT = Other. SOC was retrieved from the
quarterly output and the PT was entered into the MedDRA database (if necessary) to
determine SOC category. Reporter demographics were coded M= male and F= female or
NR= Not Reported.
The reporters in this study were consumers (non-HCPs) and physicians, and the
codes for reporter’s type of occupation in the AERS ASCII files were as follows: MD =
Physician and CN = Consumer.

59
Data Analysis Plan
In this study, I analyzed secondary data, specifically, ADRs that were submitted
by consumers and physicians to the FDA, from the FAERS database, which contains
quarterly data files that were extracted for analysis (FDA, 2016b). The data containing
the spontaneous ADR reports from the FAERS database were accessed and downloaded
from the quarterly data file data selection time period: 01 April 2016 through 30 June
2016. Once the ADR data had been collected, spontaneous reports from consumers and
physicians were assessed. A total of 87,807 ADR reports (cases) and 143,399 ADRs
(events) (consumer [83,009 ADRs] and physician [60,390 ADRs]) reported by consumers
and physicians for the 2nd quarter of the year 2016 (01 April 2016 through 30 June 2016)
were analyzed. The distinction between ADR reports and ADRs could be made in the
following manner: ADR reports (or cases) are singular and can have multiple ADRs (or
events) within them. In my study, 87,807 ADR cases referred to the number of cases that
contain 143,399 events. The numbers in brackets signifies that consumers reported
83,009 events while physicians reported 60,390 events (please note: the remaining
number of events that were reported from other sources that are not relevant to this study
include, but are not limited to, pharmacists, other HCPs, and lawyers). Spontaneous US
ADRs were analyzed in an effort to compare consumer and physician reporting of ADRs.
These reports were examined on the basis of the reporter type and patient outcome
(which determines the severity of the event).
The FAERS reporting system data contained seven files. The element that
connected the files data was the Primary ID. The files were as follows: Demographic,

60
Outcome, Drug, Reaction, Report Sources, Indication, and Therapy. The “Outcome” file
contains all outcomes, in other words “all” events, that occurred to a patient after drug
administration and reported by a medical doctor or a consumer. The “Demographic” file
contained and described the cases, which were identified through IDs (every case had a
single ID). As for a single patient (a case) could be reported with one or more outcomes
(events), there were IDs that were associated with more than one outcome. In an analysis
focused on cases and outcomes simultaneously, only those IDs that had a single outcome
could be used (FDA, n.d.).
Prior to commencing secondary data collection, approval from the IRB was
sought and obtained (04-18-18-0523354). Upon receipt of approval, the quarterly data
file data as described above were extracted from the FDA’s FAERS database (April
2018).
The following research questions will be addressed:
Primary Research Questions
Research Question 1A: Is there a statistically significant difference in the
distribution of ADRs by reporter (consumer versus physician) and patient outcome?
H01A: There is no statistically significant difference in the distribution of ADRs
by reporter (consumer versus physician) and patient outcome.
Ha1A: There is a statistically significant difference in the distribution of ADRs by
reporter (consumer versus physician) and patient outcome.
Research Question 1B: Is there a statistically significant difference in the
distribution of ADRs by reporter when comparing by severity of outcome?

61
H01B: There is no statistically significant difference in the distribution of ADRs
by reporter when comparing by severity of outcome.
Ha1B: There is a statistically significant difference in the distribution of ADRs by
reporter when comparing by severity of outcome.
Exploratory Research Questions
Research Question 2: Is there a statistically significant difference in the
distribution of ADRs by reporter (consumer versus physician) and SOC?
H02: There is no statistically significant difference in the distribution of ADRs by
reporter (consumer versus physician) and SOC.
Ha2: There is a statistically significant difference in the distribution of ADRs by
reporter (consumer versus physician) and SOC.
Research Question 3: Is there a statistically significant difference in the
distribution of ADRs by reporter (consumer and physician) and demographics?
H03: There is no statistically significant difference in the distribution of ADRs by
reporter (consumer versus physician) and demographics.
Ha3: There is a statistically significant difference in the distribution of ADRs by
reporter (consumer versus physician) and demographics.
The primary objective in this study was to test the association between the type of
reporter reporting the ADR and patient outcome, with exploratory objectives of
evaluating total ADRs (events) and total ADR cases (reports) reported by consumers and
physicians versus SOC and reporter demographics. Once data were downloaded from the
FDA’s FAERS database, they were analyzed for type of reporter and patient outcome, as

62
well as SOC, and reporter demographics. This study contains several tables, specifically
for the distribution of ADRs based on patient outcome, as well as SOC and reporter
demographics. The independent variable was the reporter (consumer versus physician
whereas patient outcome, SOC, and reporter demographics was the dependent variables.
The unit of analysis was the total number of ADR cases and reported ADRs. A statistical
software package (SPSS v.25) was employed to manage and set up the data, as well as to
perform bivariate and multivariate analyses. Bivariate analyses, specifically, the chi-
square test for independence, OR, and logistic regression was conducted to assess
statistically significant differences between the categorical independent variable (the
reporter) and the seven different levels of the categorical dependent variable (patient
outcome) (see Ott & Longnecker, 2008). The seven different levels of the patient
outcome variable were as follows: death (DE); LT; initial or prolonged existing inpatient
hospitalization (HO); persistent or significant disability or incapacity (DS); a congenital
anomaly or birth defect (CA); necessary intervention to inhibit permanent damage (RI);
or, other (important) medical outcome, event, or reaction (OT) (FDA, 2016b). As
previously mentioned, SOC was categorized by PT within MedDRA. Reporter
demographics were categorized as male versus female since this information was readily
available within the dataset.
In this study, I employed quantitative methods, which are frequently used to
analyze spontaneous data (see Aagaard et al., 2009). Chi-square test and ORs, as the most
appropriate statistical methods, were conducted unless otherwise specified to investigate
the relationship between reporter and reported ADRs. The chi-square test, as the most

63
appropriate analytical strategy to employ in this study, was used to test for association
between two categorical variables (see Gerstman, 2008). The statistical significance in
association between reporter and total number of reported ADRs, as well as patient
outcome, were shown with a p-value of less than 0.006. The OR, which is another
measure of association for categorical data, as well as an additional appropriate method to
employ in this study, was also used in conjunction with logistic regression models (see
Gertsman, 2008). The chi-square test illustrated that an association existed, while the OR
displayed the strength of the association. The confidence intervals were calculated at 95%
for each OR.
After bivariate analyses were conducted, the results were presented via tables. It is
important to mention that the tables presented had to be clear and concise. Table titles
had to be understandable without reading the chapter text (see Diether, 2016). All
relevant results were noted, even those that were contrary to the alternative hypotheses,
or those that tended to distract from clear determinations. Furthermore, statements of the
results were rendered without any implication, speculation, assessment, evaluation, or
interpretation (see van Hunsel et al., 2009). In conducting research for this study, the area
of examination and the research questions allowed me to determine the research method
that was be followed. The research method entailed the manner in which the researcher
gathered, assessed, and deciphered the data in this study (see Creswell, 2014). One of the
most important aspects of secondary data analysis is the implementation of theoretical
knowledge and conceptual skills within existing data in an effort to address the research
questions. Since a secondary data analysis was performed, which is a systematic method

64
with procedural and evaluative steps, this process was commenced with the development
of the research questions, which enabled identification of datasets for analysis (see
Creswell, 2014).
The main research question was as follows: is there a statistically significant
difference in the distribution of ADRs by reporter (consumer versus physician) and
patient outcome? To address this research question, seven logistic regression analyses
were conducted in which the dependent variable, patient outcome, were dichotomized for
seven distinct categories: fatal and non-fatal; LT and non-LT; hospitalized and non-
hospitalized; with and without the outcome of initial or prolonged disability; with and
without the outcome of congenital anomaly; with and without the outcome of required
intervention to prevent permanent impairment/damage; and, with and without the
outcome of other (important medical event). The results were presented in a tabular
fashion, thereby producing several tables comparing consumer versus physician to the
aforementioned seven distinct categories of the dependent variable patient outcome.
Secondary questions included reporter versus SOC and reporter demographics.
Threats to Validity
Since the correlational cross-sectional research design was utilized, the secondary
data led to under-reporting and recall bias, which yielded misclassification or information
bias (see Gualano et al., 2015). Furthermore, the use of this particular design only
provided a rather limited amount of information of the sample (see Gualano et al., 2015).
The correlational cross-sectional research design presented challenges regarding the
determination of causal relationships between the distribution of case and event level

65
ADRs by reporter (consumer versus physician) and patient outcome, SOC, and reporter
demographics. The correlational cross-sectional design contained several limitations that
were significant to examine, including internal validity, which was only germane to such
a design as experimental that attempts to establish a causal relationship (see Frankfort-
Nachmias, 2014). Since researchers do not alter the independent variables, they must
render logical or theoretical inferences in terms of the direction of the causation by taking
into account that correlation between variables does not imply causation (see Field,
2013). Hence, it is challenging for researchers to make causal inferences.
To overcome several methodological limitations of correlational cross-sectional
designs, researchers frequently employ statistical analyses, including cross-tabulation, for
the purpose of organizing, describing, and summarizing their observations, as well
approximating some of the processes inherent within experimental designs (see
Frankfort-Nachmias, 2014). When the data are categorized, researchers are able to make
contrasts between the categorical groups (see Frankfort-Nachmias, 2014).
Despite the disadvantages of correlational cross-sectional research designs, in
particular, the threat to internal validity, these designs have advantages inherent within
them. Despite this design’s internal weaknesses, it manages the threats to external
validity (see Campbell & Stanley, 1963). However, researchers using the cross-sectional
design must sacrifice internal validity in order to achieve greater generalizability or
external validity (see Research Design, n.d.). Correlational cross-sectional designs
usually have a high level of external validity, which enables researchers to generalize
their findings to a larger population (see Carlson & Morrison, 2009). Furthermore, these

66
designs enable the researchers to perform studies in natural, real-life settings utilizing
probability samples, thereby increasing the external validity of their studies (see
Frankfort-Nachmias, 2014).
Additionally, correlational cross-sectional designs do not require the random
assignment of individual cases to comparison groups, which is particularly useful in
situations where the random assignment of individuals to a treatment or control group
may be unethical or improbable (see Frankfort-Nachmias, 2014). Although correlational
cross-sectional designs prevent researchers from making causal inferences, these non-
experimental designs nonetheless play a pivotal role in research efforts by allowing
researchers to establish a statistical relationship between variables and, subsequently,
paving the way for future studies in which researchers can utilize experimental designs to
confirm the statistical relationship as a causal one (Price, 2012).
Ethical Procedures
Given that the ADR data from the FDA’s FAERS database have been de-
identified, it is not possible to trace back to the consumers and physicians from whom the
data were originally collected. Since these data will no longer identifiable, the subsequent
use of these data would not constitute research on human subjects (University of
Chicago, 2014). Moreover, since this study employed secondary data analysis,
recruitment of the participants were not made, especially those in vulnerable populations,
including, but not limited to the following: minors (age 17 and under); adult students of
the researcher; subordinates of the researcher; patients of the researcher; nursing home
residents; prisoners; mentally impaired or disabled individuals; emotionally impaired or

67
disabled individuals; physically impaired or disabled individuals; individuals residing
within the US who may not be fluent in English; undocumented immigrants;
victims/witnesses of violent crime or other trauma (e.g. natural disasters); active duty
military personnel; and, any other individuals who may not be able to protect their own
rights or interest (Walden University, n.d.).
Furthermore, this study did not involve the following sensitive topics, which
would pose ethical challenges in doctoral research and, consequently, entail early ethics
consultation with the Walden University IRB: questions about professional work that
might lead to disclosure of behavior(s) or standpoints that may lead to someone being
terminated from their position or passed over for promotion (e.g., lack of compliance
with policy, disagreement with leadership decisions, etc.); questions regarding substance
use, mental state, or violence that may necessitate a referral or intervention to eschew
violence to the participant (addiction, severe depression, suicidality, eating disorders,
bullying, physical threats, etc.); illicit activities in which the participant may inculpate
him or herself via research data (e.g. illegal drug use, illegal immigration, child neglect,
insider trading, harassment, assault, bullying, cyberbullying, etc.); personal issues that
may cause anxiety to an individual if framed in a judgmental, non-inclusive, dismissive,
or otherwise insensitive fashion (ethnicity, body image, religion, etc.); race or ethnicity as
a variable or inclusion criterion; and, outcomes of a new intervention or program in an
education, psychological, or clinical environment (Walden University, n.d.).
While doctoral research and other projects that necessitate secondary data analysis
do not entail interactions or interventions with humans, they still require IRB review, as

68
per the Code of Federal Regulations 45 CFR 46.102(f), which defines ‘human subject’ as
a living individual about whom a researcher collects data via intervention or interaction
with the individual or identifiable private information for the purpose of research (U.S.
Department of Health & Human Services, 2010). The secondary data analysis does not
require IRB review when it falls outside of the regulatory definition of research involving
human subjects (University of Chicago, 2014). Although secondary data analysis in this
study will not jeopardize the privacy of the participants in the manner that primary data
collection and analysis may (Purdue Online Writing Lab, 2016), the rights of participants
will still need to be protected by ensuring that all identifiers have been removed from the
dataset (Walden University, n.d.). Furthermore, since the data from the FAERS database
was readily available to the public, no additional approval (other than Walden University
IRB approval) was needed. Hence, prior to commencing secondary data collection,
approval from the Walden University IRB was sought and obtained (04-18-18-0523354).
Summary
This study was quantitative in nature, and the cross-sectional research design was
employed. Secondary analysis of these data was performed by utilizing the chi-square
test, as well as the OR. I discussed the methodology and analytical strategies in this
chapter and provided greater insight into the significance of including consumer reports
within SRSs, as well as comparing the rates of case and event level ADR reporting
between consumers and physicians for the purpose of increasing awareness of the rate of
under-reporting. The ADR data was obtained from the FDA’s FAERS database in order
to assess ADRs submitted as reports by consumers and physicians and patient outcome,

69
SOC, and reporter demographics. Chi-square test of association, OR, and logistic
regression analyses was employed for comprehending the nature of these categorical
secondary data. Statistical analysis was conducted via a statistical software package
(SPSS v.25). Next, in Chapter 4, I provide the results of the study. Lastly, in Chapter 5, I
provide a discussion of the results, study limitations, recommendations for future
research, and the implications for social change.

70
Chapter 4: Results
Introduction
The purpose of this quantitative study was to examine whether a statistically
significant difference exists in the distribution of ADRs within the FAERS database by
reporter (consumer versus physician) and patient outcome, while also evaluating reporter
differences in SOC and reporter demographics. The reporter was the independent variable
consisting of two levels: consumer and physician. Patient outcome, SOC, and reporter
demographics were the dependent variables. The unit of analysis was the total number of
ADR cases and reported ADRs. Within the exploratory research questions, I evaluated
the total number of ADR cases and reported ADRs of reporters (consumer and physician;
independent variable) compared to SOC (dependent variable), and I also evaluated the
total number of ADR cases and reported ADRs of reporters (consumer and physician)
compared to demographics. The findings of this study are represented in tables in this
chapter. The following research questions and hypotheses were addressed during the
analysis:
Primary Research Questions
Research Question 1A: Is there a statistically significant difference in the
distribution of ADRs by reporter (consumer versus physician) and patient outcome?
H01A: There is no statistically significant difference in the distribution of ADRs
by reporter (consumer versus physician) and patient outcome.
Ha1A: There is a statistically significant difference in the distribution of ADRs by
reporter (consumer versus physician) and patient outcome.

71
Research Question 1B: Is there a statistically significant difference in the
distribution of ADRs by reporter when comparing by severity of outcome?
H01B: There is no statistically significant difference in the distribution of ADRs
by reporter when comparing by severity of outcome.
Ha1B: There is a statistically significant difference in the distribution of ADRs by
reporter when comparing by severity of outcome.
Exploratory Research Questions
Research Question 2: Is there a statistically significant difference in the
distribution of ADRs by reporter (consumer versus physician) and SOC?
H02: There is no statistically significant difference in the distribution of ADRs by
reporter (consumer versus physician) and SOC.
Ha2: There is a statistically significant difference in the distribution of ADRs by
reporter (consumer versus physician) and SOC.
Research Question 3: Is there a statistically significant difference in the
distribution of ADRs by reporter (consumer and physician) and demographics?
H03: There is no statistically significant difference in the distribution of ADRs by
reporter (consumer versus physician) and demographics.
Ha3: There is a statistically significant difference in the distribution of ADRs by
reporter (consumer versus physician) and demographics.
Data Collection
I conducted the analysis by using data publicly available from the FAERS
database. The AEs and medication error were coded in the FAERS database to terms in
72
the MedDRA terminology. The FAERS database contained its data in seven tables linked
through cases reports identifications (IDs), which could be found within the following
data tables: Demographic, Outcome, Report sources, Reaction, Drug, and Therapy and
Indication (FDA, n.d.).
The data employed in the current analysis covered the cases of AEs reported or
updated in the second quarter of 2016 (from 01 April 2016 to 30 June 2016), and the
analysis was performed from the case perspective (case-based analysis) and events
perspective (event-based analysis). This type of approach was necessary due to the fact
that a significant number of cases are associated with multiple events. Consequently, the
analysis based on ADR cases was performed using only those case IDs that were
associated with only one event. Therefore, the samples used in the analysis of cases and
events had different sizes. Furthermore, since the number of events is greater than the
number of cases, the set of case IDs that was used to build the dataset with all necessary
variables and observations for the statistical analyses (along with the associated events
from the “outcome” table) was used as a starting point in the development of the dataset.
With regards to the analysis of ADRs by reporter and SOC, the drug consumption
outcomes and, more precisely, their associated reactions, were grouped according to the
SOC by matching the PTs for reactions from the FAERS “Reaction” table. Subsequently,
the matched terms were coded using the MedDRA terminology with the outcomes from
FAERS “Outcome” table based on the case identifiers (IDs). The conversion of the
existent PTs into SOCs was made using the 2016 release, which covers the first half of
the year, from The Protect Adverse Drug and Product Reaction Database, which is

73
provided by The European Medicines Agency and PROTECT Partners (FDA, n.d.). The
above-mentioned database contains drugs names (trade and active ingredient name), the
PTs for reactions (coded via MedDRA), and the SOC group for each PT. Given that not
all PTs from the “Reaction” table could be matched with a SOC group based on the PTs
from The Protect Adverse Drug and Product Reaction Database, and since the manual
matching may lead to bias (systematic or random), the analysis was limited to those PTs
for which the exact SOC group can be identified. Concurrently, since the intended
analysis was event outcome-based and multiple reactions (PTs) could be associated with
one or more outcomes, the analysis was also limited to only those case IDs associated
with a single reaction (PT) reported. Hence, this particular analysis was based on
approximately 25% of the total reported ADRs, namely, cases (IDs) with a single
reaction (PT) and one or more events.
All p-values were calculated using the chi-square (χ2) test and a significance level
of .006. Given the number of comparisons of a similar nature, the issue of multiple
comparisons arose. Furthermore, since multiple hypotheses were tested, the chance of
incorrectly rejecting a null hypothesis (Type I error) was increased (see Mittelhammer,
Judge, & Miller, 2000). Therefore, to counteract these issues, I employed the Bonferroni
correction, which tested each individual hypothesis at a significance level of α/m, where
α was the desired overall alpha level and m was the number of hypotheses (see Miller,
1966). In this study, I adjusted for multiple comparisons by dividing my criterion of
significance (0.05) by the number of tests (8), which yielded 0.006 (i.e. 0.05/8=0.006).
74
Subsequently, I employed this number (0.006) as a benchmark to determine whether any
comparison was statistically significant.
The same significance level was used for OR confidence intervals. The p-value
from the chi-square test was calculated for only the categorical data contained in the 2x2
contingency tables. Therefore, the test was conducted to determine whether statistically
significant differences exist between two groups. A significant p-value (less than .006)
indicated that a statistically significant difference exists between consumers and
physicians in reporting of an ADR case or event. The OR represented how much more
likely consumers were to report an ADR case or event in comparison to physicians. A
post-hoc power analysis was also computed. For the difference between two independent
proportions analysis, G*Power was used to calculate the power based on the following
criteria: z-test (a two-tailed test); a medium effect size of 0.33; proportion for group 1
(physicians = 60,390/143,399 = .42); an alpha level of .05; a sample size of 60,390 for
group 1, which represents physicians; and, a sample size of 83,009 for group 2, which
represents consumers. Based on the aforementioned criteria, the post-hoc power for this
analysis was 1.0.
Results
Research Question 1A
The first part of the research question, I examined whether a statistically
significant difference exists in the distribution of ADRs based on reporter (consumer
versus physician) and patient outcome. The case-based and event-based analyses were
performed, and the chi-square test was conducted for both types of analyses. Since the

75
response variable (patient outcome) contains seven categories, a reference category is
needed to compute ORs and compare reporter and patient outcome. Therefore, other
medical event (OME) was selected as a reference category; the results are shown in
Tables 1 and 2. As can be seen in Table 1, for the case-based analysis, the results from
the chi-square test revealed a statistically significant association between reporter and
patient outcome, χ2 (6, N = 87,807) = 406.74, p <.001, φC = .07. Cramer’s V value of .07,
which was less than a value of .20, signified a relatively weak relationship between
reporter and patient outcome. The ORs for the six categories of patient outcome
(congenital, fatal, disability, hospitalization, intervention, and LT) were computed and
compared to the reference category of OME.
For the patient outcome category of congenital, the odds ratio for reporter (OR =
0.39) was less than 1, thereby indicating a negative relationship between reporter and
patient outcome category of congenital. The odds of consumers reporting congenital
ADR reports versus OME ADR reports were 0.39 times the same odds among
physicians.
For the patient outcome category of fatal, the odds ratio for reporter (OR = 0.86)
was less than 1, thereby indicating a negative relationship between reporter and patient
outcome category of fatal. The odds of consumers reporting fatal ADR reports versus
OME ADR reports were 0.86 times the same odds among physicians.
For the patient outcome category of disability, the odds ratio for reporter (OR =
0.77) was less than 1, thereby indicating a negative relationship between reporter and

76
patient outcome category of disability. The odds of consumers reporting disability ADR
reports versus OME ADR reports were 0.77 times the same odds among physicians.
For the patient outcome category of hospitalization, the odds ratio for reporter
(OR = 0.87) was less than 1, thereby indicating a negative relationship between reporter
and patient outcome category of fatal. The odds of consumers reporting hospitalization
ADR reports versus OME ADR reports were 0.87 times the same odds among
physicians.
For the patient outcome category of intervention, the odds ratio for reporter (OR =
0.13) was less than 1, thereby indicating a negative relationship between reporter and
patient outcome category of intervention. The odds of consumers reporting intervention
ADR reports versus OME ADR reports were 0.13 times the same odds among
physicians.
For the patient outcome category of LT, the odds ratio for reporter (OR = 0.29)
was less than 1, thereby indicating a negative relationship between reporter and patient
outcome category of LT. The odds of consumers reporting LT ADR reports versus OME
ADR reports were 0.29 times the same odds among physicians. Based on these results,
the null hypothesis would be rejected in favor of the alternative hypothesis.
Table 1 also illustrates the distribution of ADR reports (cases) by reporter and the
seven categories of patient outcome. A total of 87,807 reports were received for the 01
April 2016 through 30 June 2016 period of the quarterly data file data selection time
period: 01 April 2016 through 30 June 2016. According to Table 1, in comparison to

77
physicians, consumers reported more ADR reports for the following categories of patient
outcome: death, disability, hospitalization, and OME.
Table 1
Distribution of Adverse Drug Reactions (ADRs) Reports in the US (01 April 2016
through 30 June 2016) by Reporter and Patient Outcome
Reporter Type
Congenital N
Death N
Disability N
Hospitalization N
Intervention N
Life-threatening
N
Other Medical Event
N
Total N
Both Reporters
181 7,903 978 26,416 12 753 51,564 87,807
Consumer
70
(38.7)
4,564 (57.8)
539
(55.1)
15,362 (58.2)
2
(16.7)
236
(31.3)
3,1683 (61.4)
52,456 (59.7)
Physician
111
(61.3)
3,339 (42.2)
439
(44.9)
11,054 (41.8)
10
(83.3)
517
(68.7)
19,881 (38.6)
3,5351 (40.3)
Note. χ2 = 406.74, df = 6, p <.001. Numbers in parentheses indicate column percentages. p <.006
As can be seen in Table 2, for the event-based analysis, the results from the chi-
square test revealed a statistically significant association between reporter and patient
outcome, χ2 (6, N = 143,399) = 1,299.37, p <.001, φC =.09. The Cramer’s V value of .09,
which was less than a value of .20, signified a relatively weak relationship between
reporter and patient outcome. The ORs for the six categories of patient outcome
(congenital, fatal, disability, hospitalization, intervention, and LT) were computed and
compared to the reference category of OME.
For the patient outcome category of congenital, the odds ratio for reporter (OR =
0.58) was less than 1, thereby indicating a negative relationship between reporter and
patient outcome category of congenital. The odds of consumers reporting congenital
ADRs versus OME ADRs were 0.58 times the same odds among physicians.

78
For the patient outcome category of fatal, the odds ratio for reporter (OR = 0.89)
was less than 1, thereby indicating a negative relationship between reporter and patient
outcome category of fatal. The odds of consumers reporting fatal ADRs versus OME
ADRs were 0.89 times the same odds among physicians.
For the patient outcome category of disability, the odds ratio for reporter (OR =
0.76) was less than 1, thereby indicating a negative relationship between reporter and
patient outcome category of disability. The odds of consumers reporting disability ADRs
reports OME ADRs were 0.76 times the same odds among physicians.
For the patient outcome category of hospitalization, the odds ratio for reporter
(OR = 0.85) was less than 1, thereby indicating a negative relationship between reporter
and patient outcome category of fatal. The odds of consumers reporting hospitalization
ADRs versus OME ADRs were 0.85 times the same odds among physicians.
For the patient outcome category of intervention, the odds ratio for reporter (OR =
0.12) was less than 1, thereby indicating a negative relationship between reporter and
patient outcome category of intervention. The odds of consumers reporting intervention
ADRs versus OME ADRs were 0.12 times the same odds among physicians.
For the patient outcome category of LT, the odds ratio for reporter (OR = 0.33)
was less than 1, thereby indicating a negative relationship between reporter and patient
outcome category of LT. The odds of consumers reporting LT ADRs versus OME ADRs
were 0.33 times the same odds among physicians. Based on these results, the null
hypothesis would be rejected in favor of the alternative hypothesis.

79
Table 2 also shows the distribution of ADRs (events) by reporter and patient
outcome. A total of 143,399 ADRs were received for the 01 April 2016 through 30 June
2016 period of the quarterly data file data selection time period: 01 April 2016 to 30 June
2016. According to Table 2, in comparison to physicians, consumers reported more
ADRs for the following categories of patient outcome: death, disability, hospitalization,
and OME.
Table 2
Distribution of Adverse Drug Reactions (ADRs) in the US (01 April 2016 through 30
June 2016) by Reporter and Patient Outcome
Reporter Type
Congenital N
Death N
Disability N
Hospitalization N
Intervention N
Life-threatening
N
Other Medical Event
N
Total N
Both Reporters
507 16,178 2,866 46,149 19 4,154 73,526 143,399
Consumer
237
(46.7)
8,346 (57.8)
1,535 (53.6)
26,074 (56.5)
3
(15.8)
1,394 (33.6)
44,420 (60.4)
83,009 (57.9)
Physician
270
(53.3)
6,832 (42.2)
1,331 (46.4)
20,075 (43.5)
16
(84.2)
2,769 (66.4)
29,106 (39.6)
60,390 (42.1)
Note. χ2 = 1,299.37, df = 6, p <.001. Numbers in parentheses indicate column percentages. p <.006 Research Question 1B
The second part of the research question, I examined whether a statistically
significant difference exists in the distribution of ADRs based on reporter (consumer
versus physician) and severity of patient outcome. For the severity of patient outcome
analysis, I grouped patient outcomes into a dichotomous variable by severity (serious
versus nonserious) and tested this first. For this particular analysis, the seven categories
of the patient outcome variable were grouped into a dichotomous variable by severity
(serious versus nonserious) and the relationship was first tested. The reason for grouping

80
the seven categories of patient outcome variable into two categories is to create a severity
variable consisting of two levels: serious and nonserious in order to determine whether
there is a statistically significant association between reporter and severity of patient
outcome.
As shown in Tables 3 and 4, the serious outcomes (“Serious” column) were
grouped as death and LT ADRs, and the nonserious outcomes (“Nonserious” column)
were grouped as hospitalization, disability, congenital anomaly, intervention (required to
prevent permanent impairment/damage), and OME. The case-based and event-based
analyses were performed and the chi-square test was conducted for both types of
analyses; the results are shown in Tables 3 and 4. As can be seen in Table 3, for the case-
based analysis, the results from the chi-square test revealed a statistically significant
association between reporter and patient outcome severity, χ2 (1, N = 87,807) = 73.39, p
<.001, φC =.03. The Cramer’s V value of .03, which was less than a value of .20, signified
a relatively weak relationship between reporter and severity of patient outcome. The odds
ratio for reporter (OR = 0.82) was less than 1, thereby indicating a negative relationship
between reporter and patient outcome severity. The odds of consumers reporting serious
ADR reports versus nonserious ADR reports were 0.82 times the same odds among
physicians. Based on these results, the null hypothesis would be rejected in favor of the
alternative hypothesis.
Table 3 also illustrates the distribution of ADR reports (cases) by reporter and
patient outcome severity. A total of 87,807 reports were received for the 01 April 2016
through 30 June 2016 period of the quarterly data file data selection time period: 01 April

81
2016 through 30 June 2016. Of these, consumers reported 52,456 (59.7%) ADR reports
and physicians reported 35,351 (40.3%) ADR reports. Of the total ADR reports, 8,656
reports were serious and 79,151 reports were nonserious. Of the 8,656 serious reports,
consumers reported 4,800 (55.5%) serious reports and physicians reported 3,865 (44.5%)
serious reports. Therefore, consumers reported more ADR reports and more serious ADR
reports in comparison to those reported by physicians.
Table 3
Distribution of Adverse Drug Reactions (ADRs) Reports in the US (01 April 2016
through 30 June 2016) by Reporter and Patient Outcome Severity
Patient Outcome Severity
Serious
N=8,656
Nonserious
N= 79,151
Total
N= 87,807
Consumer 4,800 (55.5)
47,656 (60.2)
52,456 (59.7)
Physician 3,856 (44.5)
31,495 (39.8)
35,351 (40.3)
Note. χ2 = *73.39, df = 1, OR = 0.82. p <.001. Numbers in parentheses indicate column percentages. p <.006
According to Table 4, for the event-based analysis, the results from the chi-square
test revealed a statistically significant association between reporter and patient outcome
severity, χ2 (1, N = 143,399) = 249.18, p <.001, φC =.04. The Cramer’s V value of .04,
which was less than a value of .20, signified a relatively weak relationship between
reporter and severity of patient outcome. The odds ratio for reporter (OR = 0.79) was less
than one, thereby indicating a negative relationship between reporter and patient outcome
severity. The odds of consumers reporting serious ADRs versus nonserious ADRs were

82
0.79 times the same odds among physicians. Based on these results, the null hypothesis
would be rejected in favor of the alternative hypothesis.
Table 4 also shows the distribution of ADRs (events) by reporter and patient
outcome severity. A total of 143,399 ADRs were received for the 01 April to 30 April
2016 period of the quarterly data file data selection time period: 01 April 2016 to 30 June
2016. Of these, consumers reported 83,009 (57.9%) ADRs and physicians reported
60,390 (42.1%) ADRs. Of the total ADRs, 20,332 ADRs were serious and 123,067
ADRs were nonserious. Of the 20,332 serious ADRs, consumers reported 10,740 (52.8%)
serious ADRs, and physicians reported 9,592 (47.2%) serious ADRs. Therefore,
consumers reported more ADRs and more serious ADRs in comparison to those reported
by physicians.
Table 4
Distribution of Adverse Drug Reactions (ADRs) in the US (01 April 2016 through 30
June 2016) by Reporter and Patient Outcome Severity
Patient Outcome Severity
Serious
N=20,332
Nonserious N= 123,067
Total
N= 143,399
Consumer 10,740 (52.8)
72,269 (58.7)
83,009 (57.9)
Physician 9,592 (47.2)
50,798 (41.3)
60,390 (42.1)
Note. χ2 = 249.18*, df = 1, OR = 0.79. p <.001. Numbers in parentheses indicate column percentages. p <.006 Given that the results from the severity of patient outcome analysis were
statistically significant, I subsequently proceeded to test specific dyads (e.g. fatal versus
non-fatal, LT versus non-LT, etc.) to further characterize the relationship between

83
reporter and patient outcome. For both the case-based and event-based analyses, seven
separate standard logistic regression models (thereby totaling 14 standard logistic
regression models for both types of analyses) were generated and run to determine
whether reporter was a statistically significant predictor of patient outcome. The results
from the logistic regression analyses as shown in Tables 5-18.
As can be seen in Table 5, for the case-based analysis, the results from the logistic
regression analysis revealed that reporter was a statistically significant predictor of
patient outcome of fatal (Wald χ2 = 14.3, p <.001). The odds ratio for the patient outcome
of fatal (OR =.91) was less than one, thereby indicating a negative relationship between
reporter and patient outcome of fatal. The odds of consumers reporting fatal ADR cases
versus non-fatal ADR cases were 0.91 times the same odds among physicians. Based on
these results, the null hypothesis would be rejected in favor of the alternative hypothesis.
Table 5
Logistic Regression Predicting Reporting Cases of Patient Outcome of Fatal versus Non-
Fatal
B
SEB OR 95% CI
Reporters (all) -.09 .02 .91 [.87,.96]
Note. CI = confidence interval for odds ratio (OR). N =87,807, p <.001. p <.006
As can be seen in Table 6, for the event-based analysis, the results from the
logistic regression analysis revealed that reporter was not a statistically significant
predictor of patient outcome of fatal (Wald χ2 = .10, p = .75). The odds ratio for the
patient outcome of fatal (OR = 1.00) was equal to one, thereby indicating that as reporter

84
changes from 0 (physician) to 1 (consumer), the odds of consumers reporting fatal ADRs
versus non-fatal ADRs were no different than the odds among physicians. Based on these
results, the null hypothesis would be retained.
Table 6
Logistic Regression Predicting Reporting ADRs Resulting in Patient Outcome of Fatal
versus Non-fatal
B
SEB OR 95% CI
Reporters (all) -.005 .02 1.00 [.96, 1.03]
Note. CI = confidence interval for odds ratio (OR). N = 143,399, p =.75. p <.006
For testing the relationship between reporting and patient outcome of LT, the
ADR cases and events were partitioned into two groups: LT or non-LT. ADR cases and
events that resulted in death were excluded for this particular analysis. Therefore, the
analysis was limited to only the non-fatal outcomes.
As can be seen in Table 7, for the case-based analysis, the results from the logistic
regression analysis revealed that reporter was a statistically significant predictor of
patient outcome of LT (Wald χ2 = 230.73, p <.001). The odds ratio for the patient
outcome of LT (OR = .30) was less than one, thereby indicating a negative relationship
between reporter and patient outcome of LT. The odds of consumers reporting LT ADR
cases versus non-LT ADR cases were 0.30 times the same odds among physicians. Based
on these results, the null hypothesis would be rejected in favor of the alternative
hypothesis.

85
Table 7
Logistic Regression Predicting Reporting Cases of Patient Outcome of Life-Threatening
versus Non-Life-Threatening
B
SEB OR 95% CI
Reporter (all) -1.20 .08 .30 [.26,.35]
Note. CI = confidence interval for odds ratio (OR). N = 79,904, p <.001. p <.006
As can be seen in Table 8, for the event-based analysis, the results from the
logistic regression analysis revealed that reporter was a statistically significant predictor
of patient outcome of LT (Wald χ2 = 963.39, p <.001). The odds ratio for the patient
outcome of LT (OR = .36) was less than one, thereby indicating a negative relationship
between reporter and patient outcome LT. The odds of consumers reporting LT ADRs
versus non-LT ADRs were 0.36 times the same odds among physicians. Based on these
results, the null hypothesis would be rejected in favor of the alternative hypothesis.
Table 8
Logistic Regression Predicting Reporting ADRs Resulting in Patient Outcome of Life-
Threatening versus Non-Life-Threatening
B
SEB OR 95% CI
Reporter (all) -1.04 .03 .36 [.33,.38]
Note. CI = confidence interval for odds ratio (OR). N = 127,221, p <.001. p <.006
As can be seen in Table 9, for the case-based analysis, the results from the logistic
regression analysis revealed that reporter was a statistically significant predictor of
patient outcome of hospitalization (Wald χ2 = 39.5, p <.001). The odds ratio for the

86
patient outcome of hospitalization (OR = .91) was less than one, thereby indicating a
negative relationship between reporter and patient outcome of hospitalization. The odds
of consumers reporting hospitalization ADR cases versus non-hospitalization ADR cases
were 0.91 times the same odds among physicians. Based on these results, the null
hypothesis would be rejected in favor of the alternative hypothesis.
Table 9
Logistic Regression Predicting Reporting ADR Cases of Patient Outcome of
Hospitalization versus Non-Hospitalization
B
SEB OR 95% CI
Reporter (all) -.09 .02 .91 [.88,.94]
Note. CI = confidence interval for odds ratio (OR). N = 87,807, p <.001. p <.006
As can be seen in Table 10, for the event-based analysis, the results from the
logistic regression analysis revealed that reporter was a statistically significant predictor
of patient outcome of hospitalization (Wald χ2 = 53.7, p <.001). The odds ratio for the
patient outcome of hospitalization (OR = .92) was less than one, thereby indicating a
negative relationship between reporter and patient outcome of hospitalization. The odds
of consumers reporting ADRs resulting in hospitalization versus those not resulting in
hospitalization were 0.92 times the same odds among physicians. Based on these results,
the null hypothesis would be rejected in favor of the alternative hypothesis.

87
Table 10
Logistic Regression Predicting Reporting ADRs Resulting in Patient Outcome of
Hospitalization versus Non-Hospitalization
B
SEB OR 95% CI
Reporter (all) -.08 .01 .92 [.90,.94]
Note. CI = confidence interval for odds ratio (OR). N = 143,399, p <.001. p <.006
As can be seen in Table 11, for the case-based analysis, the results from the
logistic regression analysis revealed that reporter was a statistically significant predictor
of patient outcome of disability (Wald χ2 = 8.8, p = .003). The odds ratio for the patient
outcome of disability (OR = .83) was less than one, thereby indicating a negative
relationship between reporter and patient outcome of disability. The odds of consumers
reporting disability ADR cases versus non-disability ADR cases were 0.83 times the
same odds among physicians. Based on these results, the null hypothesis would be
rejected in favor of the alternative hypothesis.
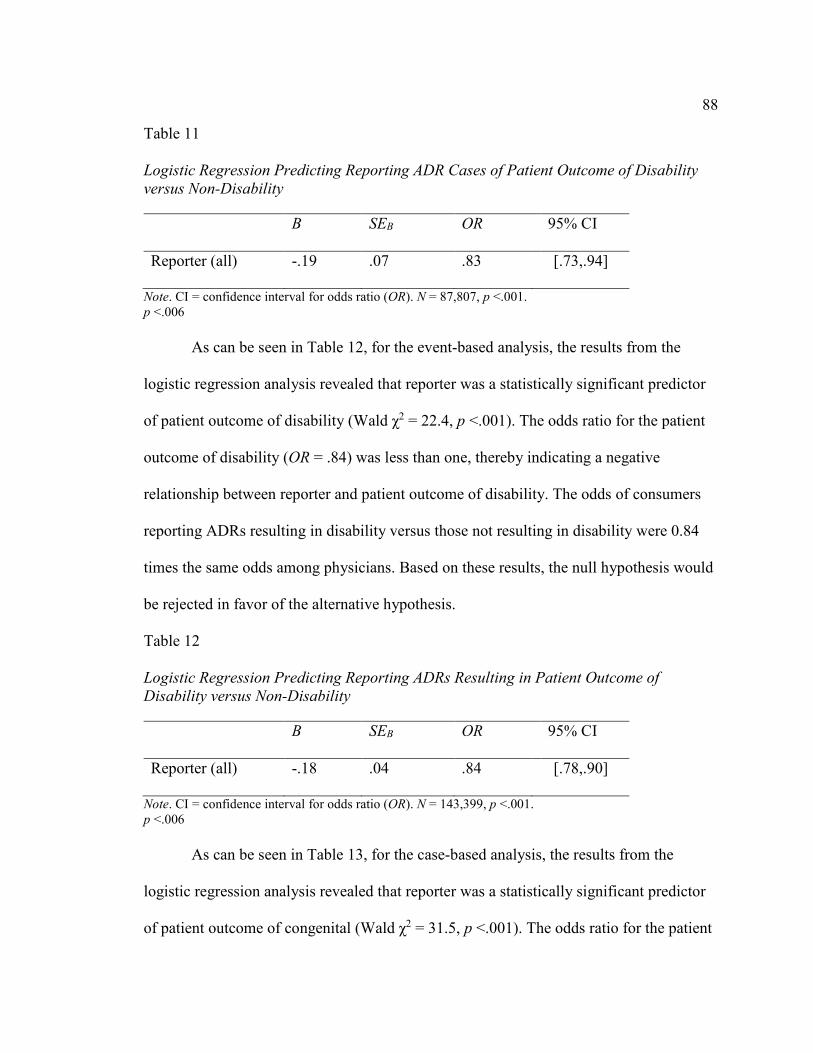
88
Table 11
Logistic Regression Predicting Reporting ADR Cases of Patient Outcome of Disability
versus Non-Disability
B
SEB OR 95% CI
Reporter (all) -.19 .07 .83 [.73,.94]
Note. CI = confidence interval for odds ratio (OR). N = 87,807, p <.001. p <.006
As can be seen in Table 12, for the event-based analysis, the results from the
logistic regression analysis revealed that reporter was a statistically significant predictor
of patient outcome of disability (Wald χ2 = 22.4, p <.001). The odds ratio for the patient
outcome of disability (OR = .84) was less than one, thereby indicating a negative
relationship between reporter and patient outcome of disability. The odds of consumers
reporting ADRs resulting in disability versus those not resulting in disability were 0.84
times the same odds among physicians. Based on these results, the null hypothesis would
be rejected in favor of the alternative hypothesis.
Table 12
Logistic Regression Predicting Reporting ADRs Resulting in Patient Outcome of
Disability versus Non-Disability
B
SEB OR 95% CI
Reporter (all) -.18 .04 .84 [.78,.90]
Note. CI = confidence interval for odds ratio (OR). N = 143,399, p <.001. p <.006
As can be seen in Table 13, for the case-based analysis, the results from the
logistic regression analysis revealed that reporter was a statistically significant predictor
of patient outcome of congenital (Wald χ2 = 31.5, p <.001). The odds ratio for the patient

89
outcome of congenital (OR = .42) was less than one, thereby indicating a negative
relationship between reporter and patient outcome of congenital. The odds of consumers
reporting congenital ADR cases versus non-congenital ADR cases were 0.42 times the
same odds among physicians. Based on these results, the null hypothesis would be
rejected in favor of the alternative hypothesis.
Table 13
Logistic Regression Predicting Reporting ADR Cases of Patient Outcome of Congenital
versus Non-Congenital
B
SEB OR 95% CI
Reporter (all) -.86 .15 .42 [.31,.57]
Note. CI = confidence interval for odds ratio (OR). N = 87,807, p <.001. p <.006
As can be seen in Table 14, for the event-based analysis, the results from the
logistic regression analysis revealed that reporter was a statistically significant predictor
of patient outcome of congenital (Wald χ2 = 25.5, p <.001). The odds ratio for the patient
outcome of congenital (OR = .64) was less than one, thereby indicating a negative
relationship between reporter and patient outcome of congenital. The odds of consumers
reporting ADRs resulting in congenital versus those not resulting in congenital were 0.64
times the same odds among physicians. Based on these results, the null hypothesis would
be rejected in favor of the alternative hypothesis.

90
Table 14
Logistic Regression Predicting Reporting ADRs Resulting in Patient Outcome of
Congenital versus Non-Congenital
B
SEB OR 95% CI
Reporter (all) -.45 .09 .64 [.54,.76]
Note. CI = confidence interval for odds ratio (OR). N = 143,399, p <.001. p <.006 As can be seen in Table 15, for the case-based analysis, the results from the
logistic regression analysis revealed that reporter was not a statistically significant
predictor of patient outcome of intervention (Wald χ2 = 6.7, p =.01). The odds ratio for
the patient outcome of intervention (OR = .14) was less than one, thereby indicating a
negative relationship between reporter and patient outcome intervention. The odds of
consumers reporting intervention ADR cases versus non-intervention ADR cases were
0.14 times the same odds among physicians. Based on these results, the null hypothesis
would be retained.

91
Table 15
Logistic Regression Predicting Reporting ADR Cases of Patient Outcome of Intervention
versus Non-Intervention
B
SEB OR 95% CI
Reporter (all) -2.00 .78 .14 [.03,.62]
Note. CI = confidence interval for odds ratio (OR). N = 87,807, p =.01. p <.006
As can be seen in Table 16, for the event-based analysis, the results from the
logistic regression analysis revealed that reporter (Wald χ2 = 10.03, p = .002) was a
statistically significant predictor of patient outcome of intervention. The odds ratio for the
patient outcome of intervention (OR = .14) was less than one, thereby indicating a
negative relationship between reporter and patient outcome of intervention. The odds of
consumers reporting ADRs resulting in intervention versus those not resulting in
intervention were 0.14 times the same odds among physicians. Based on these results, the
null hypothesis would be rejected in favor of the alternative hypothesis.
Table 16
Logistic Regression Predicting Reporting ADRs Resulting in Patient Outcome of
Intervention versus Non-Intervention
B
SEB OR 95% CI
Reporter (all) -2.00 .63 .14 [.04,.47]
Note. CI = confidence interval for odds ratio (OR). N = 143,399, p =.002. p <.006
As can be seen in Table 17, for the case-based analysis, the results from the
logistic regression analysis revealed that reporter was a statistically significant predictor

92
of patient outcome of OME (Wald χ2 = 150.7, p <.001). The odds ratio for the patient
outcome of OME (OR = 1.19) was greater than one, thereby indicating a positive
relationship between reporter and patient outcome of OME. The odds of consumers
reporting OME ADR cases versus non-OME ADR cases were 1.19 times higher than the
odds among physicians. Based on these results, the null hypothesis would be rejected in
favor of the alternative hypothesis.
Table 17
Logistic Regression Predicting Reporting ADR Cases of Patient Outcome of OME versus
Non-OME
B
SEB OR 95% CI
Reporter (all) .17 .01 1.19 [1.16, 1.22]
Note. CI = confidence interval for odds ratio (OR). N = 87,807, p <.001. p <.006
As can be seen in Table 18, for the event-based analysis, the results from the
logistic regression analysis revealed that reporter was a statistically significant predictor
of patient outcome of OME (Wald χ2 = 394.95, p <.001). The odds ratio for the patient
outcome of OME (OR = 1.24) was greater than one, thereby indicating a positive
relationship between reporter and patient outcome of OME. The odds of consumers
reporting ADRs resulting in OME versus those not resulting in OME were 1.24 times
higher than the odds among physicians. Based on these results, the null hypothesis would
be rejected in favor of the alternative hypothesis.

93
Table 18
Logistic Regression Predicting Reporting ADRs Resulting in Patient Outcome of OME
versus Non-OME
B
SEB OR 95% CI
Reporter (all) .21 .01 1.24 [1.21, 1.26]
Note. CI = confidence interval for odds ratio (OR). N = 143,399, p <.001. p <.006
Research Question 2
The second research question examined whether a statistically significant
difference exists in the distribution of ADRs between reporters and SOC. The event-
based analysis was performed, and the chi-square test was conducted; the results are
shown in Table 19. As can be seen in Table 19, the results from the chi-square test
revealed a statistically significant association between reporter and SOC (25, N = 36,
665) = 3,157.04, p <.001)). Based on these results, the null hypothesis would be rejected
in favor of the alternative hypothesis.
To further characterize the relationship between reporter and SOC, 26 separate
logistic regression analyses were performed to determine whether a statistically
significant relationship exists between the reporter and each individual SOC. The results
from the event-based analyses can be seen in Table 19. According to the results in Table
19, there was a statistically significant difference between the reporter and the ADRs
(events) grouped by the SOCs of their associated reactions. Hence, reporter was a
predictor for a majority of the SOCs that were analyzed. Moreover, there are ADRs
grouped by SOCs that were more frequently reported by consumers in comparison to

94
those reported by physicians. The odds of consumers reporting ADRs were higher than
the odds of physicians for the following six SOCs: Gastrointestinal disorders (OR = 2.85,
p <.001); General disorders and administration site conditions (OR = 1.99, p <.001);
Injury, poisoning and procedural complications (OR = 1.36, p =.001); Psychiatric
disorders (OR = 1.26, p = .001); Reproductive system and breast disorders (OR = 3.30, p
<.001); and, Vascular disorders (OR = 1.44, p <.001).
However, the odds of consumers reporting ADRs were lower than the odds of
physicians for the following 14 SOCs: Blood and lymphatic system disorders (OR = .23,
p <.001); Cardiac disorders (OR = .74, p <.001); Endocrine disorders (OR = .30, p
<.001); Hepatobiliary disorders (OR =.30, p <.001); Immune system disorders (OR =.61,
p <.001); Infections and infestations (OR = .85, p <.001); Investigations (OR = .83, p =
0.005); Metabolism and nutrition disorders (OR = .52, p <.001); Musculoskeletal and
connective tissue disorders (OR = .50, p <.001); Neoplasms benign, malignant and
unspecified (OR = .61, p <.001); Nervous system disorders (OR = .78, p <.001); Renal
and urinary disorders (OR = .62, p <.001); Respiratory, thoracic and mediastinal
disorders (OR = .61, p <.001); and, Skin and subcutaneous tissue disorders (OR = .30, p
<.001).
An evaluation was not made for the SOC Social circumstances due to the fact that
a single event was reported by the consumers and zero events were reported by the
physicians. Out of the 25 evaluable SOCs, a statistically significant difference between
reporter and SOC was not found for the following five SOCs: Congenital, familial and
genetic disorders (p = .11); Ear and labyrinth disorders (p = .79); Eye disorders (p = .37);

95
Pregnancy, puerperium and perinatal conditions (p = .81); and, Surgical and medical
procedures (p = .07).
Table 19 also shows the distribution of ADRs (events) by reporter and SOC. A
total of 36,665 ADRs were received for the quarterly data file data selection time period:
01 April 2016 to 30 June 2016.

96
Table 19
Analysis of Adverse Drug Reactions in the United States (01 April to 30 April 2016) by
System Organ Class (SOC) and Reporter
SOC Consumers
Physicians *p OR 95% CI
Blood and lymphatic system disorders 300 (25.2) 891 (74.8) <.001 .23 [.21, .27] Cardiac disorders
1,149 (50.7)
1,118 (49.3)
<.001
.74
[.68, .80]
Congenital, familial and genetic disorders
5 (35.7)
9 (64.3)
.11
.40
[.14, 1.20]
Ear and labyrinth disorders
68 (56.7)
52 (43.3)
.79
.95
[.66, 1.37]
Endocrine disorders
24 (28.9)
59 (71.1)
<.001
. 30
[.18, .48]
Eye disorders
367 (56.1)
287 (43.9)
.37
.93
[.79, 1.09]
Gastrointestinal disorders 3,797 (77.6) 1,099 (22.4) <.001 2.85 [2.65, 3.06] General disorders and administration site conditions
5,743 (70.3)
2,430 (29.1)
<.001
1.99
[1.89, 2.10]
Hepatobiliary disorders
213 (29.8)
502 (70.2)
<.001
.30
[.25, .35]
Immune system disorders
203 (45.9)
239 (54.1)
<.001
.61
[.51, .74]
Infections and infestations
1,624 (54.4)
1,364 (45.6)
<.001
.85
[.79, .93]
Injury, poisoning and procedural complications
327 (65.0)
176 (35.0)
.001
1.36
[1.13, 1.64]
Investigations
468 (53.2)
411 (46.8)
.005
.83
[.73, .94]
Metabolism and nutrition disorders
358 (42.2)
490 (57.8)
<.001
.52
[.46, .60]
Musculoskeletal and connective tissue disorders
441 (41.0)
635 (59.0)
<.001
.50
[.44, .56]
Neoplasms benign, malignant and unspecified (incl. cysts and polyps)
832 (46.2)
967 (53.8)
<.001
.61
[.56, .67]
Nervous system disorders
1,715 (52.2)
1,568 (47.8)
<.001
.78
[.73, .84]
Pregnancy, puerperium and perinatal conditions
15 (55.6)
12 (44.4)
.81
.91
[.43, 1.96]
Psychiatric disorders
580 (63.2)
337 (36.8)
.001
1.26
[1.10, 1.45]
Renal and urinary disorders
475 (46.4)
549 (53.6)
<.001
.62
[.55, .70]
Reproductive system and breast disorders
327 (81.1)
73 (18.3)
<.001
3.30
[2.56, 4.26]

97
Respiratory, thoracic and mediastinal disorders
846 (46.2) 986 (53.8) <.001 .61 [.56, .67]
Skin and subcutaneous tissue disorders
282 (29.7)
667 (70.3)
<.001
.30
[.26, .34]
Social circumstances 1 (100)
0 (0)
1.00
NE
NE
Surgical and medical procedures 17 (77.3)
5 (22.7)
.07
2.48
[.91, 6.72]
Vascular disorders
1,032 (66.1)
530 (33.9)
<.001
1.44
[1.29, 1.60]
Note. χ2 = *3,157.04, df = 25, *p <.006. Numbers in parentheses indicate column percentages. CI = confidence interval for odds ratio (OR). NE= Not Evaluable.
Research Question 3
The third research questions examined whether a statistically significant
difference exists in the distribution of ADRs by reporter (consumer versus physician) and
reporter demographics (gender). The case-based and event-based analyses were
performed and the chi-square test was conducted for both types of analyses; the results
are shown in Tables 20 and 21. As can be seen in Table 20, for the case-based analysis,
the results from the chi-square test revealed a statistically significant association between
the reporter and the reporter gender (male versus female) (χ2 = 118.48, p <.001, N =
77,025). The odds ratio for the reporter gender (OR = 1.18) was greater than one, thereby
indicating a positive relationship between reporter and reporter gender. The odds of
consumers reporting ADR cases were 1.18 times higher for females versus males than the
odds of physicians. Moreover, the odds of physicians reporting ADR cases were 1.18
times higher for males versus females than the odds of consumers. Based on these results,
the null hypothesis would be rejected in favor of the alternative hypothesis.
Table 20 also illustrates the distribution of ADR reports (cases) by reporter and
reporter gender. A total of 77,025 ADR reports were received from the quarterly data file
data selection time period: 01 April 2016 to 30 June 2016. Of these, 32,534 reports were

98
reported by male reporters and 44,491 reports were reported by female reporters. Of the
32,534 reports from male reporters, male consumers reported 18,529 (57%) ADR reports
and male physicians reported 14,005 (43%) ADR reports. Of the 44,491 reports from
female reporters, female consumers reported 27,075 (60.9%) ADR reports and female
physicians reported 17,416 (39.1%) ADR reports. Regardless of gender, consumers
reported more ADR reports in comparison to those reported by physicians (59.2% vs
40.8%, respectively).
Table 20
Distribution of Adverse Drug Reactions (ADRs) Reports in the US (01 April 2016
through 30 June 2016) by Reporter and Gender
Reporter Male
N= 32,534
Female
N= 44,491
Total N= 77,025
Consumer 18,529 (57.0) 27,075 (60.9) 45,604 (59.2)
Physician 14,005 (43.0) 17,416 (39.1) 31,421 (40.8)
Note. χ2 = *118.48, df = 1, OR = 1.18. p <.001. Numbers in parentheses indicate column percentages. p <.006
As can be seen in Table 21, for the event-based analysis, the results from the chi-
square test revealed a statistically significant association between reporter and the
reporter gender (χ2 = 258.47, p <.001, N = 128,100). The odds ratio for the reporter
gender (OR = 1.20) was greater than one, thereby indicating a positive relationship
between reporter and reporter gender. The odds of consumers reporting ADRs were 1.20
times higher for females versus males than the odds of physicians. Moreover, the odds of
physicians reporting ADRs were 1.20 times higher for males versus females than the

99
odds of consumers. Based on these results, the null hypothesis would be rejected in favor
of the alternative hypothesis.
Table 21 also illustrates the distribution of ADRs (events) by reporter and reporter
gender. A total of 128,100 ADRs (events) were received from the quarterly data file data
selection time period: 01 April 2016 to 30 June 2016. Of these, 56,841 ADR were
reported by male reporters and 71,259 ADRs were reported by female reporters. Of the
56,841 ADRs reported by male reporters, male consumers reported 31,212 (54.9%)
ADRs and male physicians reported 25,629 (45.1%) ADRs. Of the 72,259 ADRs
reported by female reporters, female consumers reported 42,315 (59.4%) ADRs and
female physicians reported 28,944 (40.6%) ADRs. Regardless of gender, consumers
reported more ADR reports in comparison to those reported by physicians (57.4% vs
42.6%, respectively).
Table 21
Distribution of Adverse Drug Reactions (ADRs) in the US (01 April 2016 through 30
June 2016) by Reporter and Gender
Reporter Male
N=56,841
Female
N= 71,259
Total N= 128,100
Consumer 31,212 (54.9) 42,315 (59.4) 73,527 (57.4)
Physician 25,629 (45.1) 28,944 (40.6) 54,573 (42.6)
Note. χ2 = *258.47, df = 1, OR = 1.20. p <.001. Numbers in parentheses indicate column percentages. p <.006
Summary
For the quarterly data file data selection time period: 01 April 2016 to 30 June
2016, a total of 87,807 ADR reports with 143,399 ADR events were examined in this

100
study. For the case and event-based analyses, the findings from the study revealed that
consumers reported more ADR reports and more ADRs in comparison to those reported
by physicians. Moreover, consumers reported more serious ADR reports and more
serious ADRs in comparison to those reported by physicians. For the first research
question, the results from both the case- and event-based analyses revealed statistically
significant differences between consumers and physicians with regards to the distribution
of ADR cases and events by patient outcome, as well as by the severity of patient
outcome in the US. For the second research question, the results from the event-based
analysis showed a statistically significant difference between consumers and physicians
with regards to the distribution of ADR events by SOC. For the third research question,
the results from both the case- and event-based analyses revealed a statistically
significant difference between consumers and physicians with regards to the distribution
of ADR cases and events by reporter gender. Female consumers and male physicians
were more likely to report ADR cases and events in comparison to their respective
opposite gender counterparts. For the case-based analysis, the findings from the study
revealed that female consumers reported more ADR cases than female physicians. Next,
in Chapter 5, I provide a discussion of these results, study limitations, recommendations
for future research, and the implications for social change.

101
Chapter 5: Discussion, Conclusions, and Recommendations
Introduction
To date, no studies have been conducted within the US in which the FDA FAERS
database was employed to compare reporting of ADRs by reporter (consumers and
physicians) and patient outcome, as well as by SOC and reporter demographics at case
and/or event levels (Sakaeda et al., 2013). In this quantitative study, in an effort to fill the
gap in the literature, I examined the statistical difference in the distribution of case and
event level ADRs within the FAERS database by reporter (consumers and physicians)
and patient outcome, while also evaluating reporter differences in SOC and
demographics. The factors explored and compared included the differences in under-
reporting of consumers compared to physicians, thereby elucidating whether consumer
reporting played a pivotal role in AE reporting.
In this study, I analyzed secondary data, specifically, ADRs that were submitted
by consumers and physicians to the FDA from the FAERS database, which contained
quarterly data files that were extracted for analysis (FDA, 2016b). The data containing
the spontaneous ADR reports from the FAERS database were accessed and downloaded
from the quarterly data file data selection time period containing one quarter of data: 01
April 2016 through 30 June 2016. Once the ADR data were collected, spontaneous
reports from consumers and physicians were assessed for ADRs. The reporter was the
independent variable and consisted of two levels: consumer and physician. Patient
outcome, SOC, and reporter demographics were the dependent variables. The unit of
analysis was the total number of ADR cases and reported ADRs. Because this study was

102
quantitative in nature, secondary data analysis was performed by utilizing the chi-square
test, the OR, and logistic regression.
For both the case- and event-based analyses, the findings from the study revealed
that consumers reported significantly more ADR reports (59.7% versus 40.3%,
respectively) and more serious ADR reports (55.5% versus 44.5%, respectively) in
comparison to those reported by physicians. Moreover, consumers reported significantly
more ADRs (57.9% versus 42.1%, respectively) and more serious ADRs (52.8% versus
47.2%, respectively) in comparison to those reported by physicians.
Furthermore, the results from the event-based analysis showed that a statistically
significant difference exists between consumers and physicians with regards to the
distribution of ADR events by SOC. Additionally, the results from both the case- and
event-based analyses revealed a statistically significant difference between consumers
and physicians with regards to the distribution of ADR cases and events by reporter
gender. Based on these findings, I provide in this chapter a discussion, recommendation
for action and further research, and implications for positive social change.
Interpretation of Findings
In an effort to assess ADRs and ADR reports from physicians and consumers, as
well as to compare the findings among those from other studies, researchers from
European countries and the US have conducted studies using their respective databases
for collecting ADRs. The findings from such studies suggest the significance of including
ADR reports from consumers. Alatawi and Hansen (2017) also evaluated the FAERS
database. However, the aforementioned study involved the comparison of reporting rates

103
in the FAERS database to expected rates of known ADEs by examining three groups of
drugs (statins, biologics, and narrow therapeutic index drugs) in order to determine the
difference in sensitivity to reporting. The results from the authors’ research revealed that
most drug-ADE pairs were statistically significantly under-reported by both consumers
and physicians.
In my study, I did not aim at determining the statistical significance of under-
reporting of drug-ADE pairs by consumers and physicians. Rather, I focused on the
comparison of the two reporter types, thereby showing that consumers reported more
ADRs and ADR reports in comparison to those reported by physicians, similar to the
findings from the European studies conducted by Aagaard et al. (2009) and de Langen, et
al. (2008). Currently, no studies have been conducted within the US in which the FDA
FAERS database was employed to compare under-reporting of ADRs by reporter
(consumers and physicians) and patient outcome, as well as by SOC and reporter
demographics at case and/or event level (Sakaeda et al., 2013).
The studies performed by Aagaard et al. (2009) and de Langen et al. (2008) used
a similar type of data collection and/or data analysis methods in relation to my study.
Aagaard et al. (2009) utilized the Danish ADR database to compare ADR reports
between consumers and other sources, including physicians, pharmacists, lawyers,
pharmaceutical companies and other HCPs. The same authors analyzed the data from
these reports in terms of the reporter category, severity of the ADRs, the category of
ADRs by SOC, and the suspected medicines on level 1 of the ATC classification system.
Based on the results from the study of Aagaard et al. (2009), statistically significant

104
differences existed between reporter types and distribution of ADRs. Consumers
reporting of serious ADRs was analogous to that of physicians (approximately 45%),
although lower than that of pharmacists and other HCPs.
Similar to the study by Aagaard et al. (2009), my study involved the analysis of
data from the ADR reports collected by FAERS database with respect to the following:
the distribution of ADR cases and events by patient outcome and reporter (consumer
versus physician); the distribution of ADR cases and events by the severity of patient
outcome (serious versus nonserious) and reporter; the distribution of ADR events by SOC
and reporter; and, the distribution of ADR cases and events by reporter and reporter
gender (male versus female). However, unlike the study by Aagaard et al. (2009), my
study did not analyze data with regards to ATC.
In my study, the results from both the case- and event-based analyses revealed
statistically significant differences between consumers and physicians with regards to the
distribution of ADR cases and events by patient outcome as well as by the severity of
patient outcome in the US. The results of ADR reporting by consumers and physicians
from my study differed from those reported by Aagaard et al. (2009) due to the
characteristics of the sample and methodology. The study by Aagaard et al. (2009) was
conducted in Denmark with a significantly smaller sample size in comparison to that of
my study. Moreover, the same authors did not investigate patient outcome or sample
demographics.
With regards to reporting ADRs and serious ADRs, for the case-based analysis,
the findings from my study have revealed that consumers reported more ADR cases than

105
physicians. The results have shown that consumers reported nearly 60% of ADR cases,
while physicians reported about 40% of ADR cases. Furthermore, consumers reported
nearly 56% of serious ADR cases, while physicians reported nearly 45% of serious ADR
cases. Therefore, consumers reported more ADR reports and more serious ADR reports
in comparison to those reported by physicians.
With regards to SOC, the results from the study by Aagaard et al. (2009) revealed
a statistically significant difference between reporter types in terms of the distribution of
ADRs by SOC. The same authors claimed that, in comparison to other sources,
consumers were more likely to report ADRs from the following SOCs: Nervous system
disorders (OR = 1.27); Psychiatric disorders (OR = 1.70); and, Reproductive system and
breast disorders (OR = 1.27). In my study, the findings from the event-based analysis also
showed a statistically significant difference between consumers and physicians with
regards to the distribution of ADR events by SOC. Similar to the results from the
Aagaard et al. (2009) study, the findings from my study have revealed that the odds of
consumers reporting ADRs were higher than those of physicians for the SOCs Psychiatric
disorders (OR = 1.26, p = .001) and Reproductive system and breast disorders (OR =
3.30, p <.001). Unlike the results from Aagaard et al. (2009), the results from my study
have also shown that the odds of consumers reporting ADRs were higher than those of
physicians for the following SOCs: Gastrointestinal disorders (OR = 2.85, p <.001);
General disorders and administration site conditions (OR = 1.99, p <.001); Injury,
poisoning and procedural complications (OR = 1.36, p =.001); and, Vascular disorders
(OR = 1.44, p <.001).

106
According to Aagaard et al. (2009), compared with other sources, consumers were
less likely to report ADRs from the SOCs Blood and lymphatic system disorders (OR =
.22) and Hepatobiliary system disorders (OR = .14). Similar to the findings from my
study, the odds of consumers reporting ADRs were lower than those of physicians for the
SOCs Blood and lymphatic system disorders (OR = .23, p <.001) and Hepatobiliary
disorders (OR = .30, p <.001). Additionally, unlike the findings from Aagaard et al.
(2009), the results from my study have also shown that the odds of consumers reporting
ADRs were lower than those of physicians for the following SOCs: Cardiac disorders
(OR = .74, p <.001); Endocrine disorders (OR = .30, p <.001); Immune system disorders
(OR = .61, p <.001); Infections and infestations (OR = .85, p <.001); Investigations (OR
=.83, p = 0.005); Metabolism and nutrition disorders (OR = .52, p <.001);
Musculoskeletal and connective tissue disorders (OR = .50, p <.001); Neoplasms benign,
malignant and unspecified (OR = .61, p <.001); Nervous system disorders (OR = .78, p
<.001); Renal and urinary disorders (OR = .62, p <.001); Respiratory, thoracic and
mediastinal disorders (OR = .61, p <.001); and, Skin and subcutaneous tissue disorders
(OR = .30, p <.001).
The study conducted by Aagaard et al. (2009) revealed statistically significant
findings suggesting that, in comparison to other literature reviewed, consumers reported
different categories of ADRs for different types of SOC and ATC groups. Similarly, the
findings from my study have revealed that consumers had also reported different
categories of ADRs for different types of SOCs in comparison to physicians (although
my study did not focus on ATC). Therefore, when comparing and contrasting the results

107
from Aagaard et al. (2009) and those from my study, it can be concluded that consumers
should be active participants within systematic drug surveillance systems, including
clinical settings, and their reports should be treated with as much importance as those
from other sources.
The study conducted by de Langen et al. (2008) involved the comparison of ADR
reports between patients and HCPs collected from the Netherlands database. The authors
analyzed the data from these reports with regards to the age and gender of the reporters,
the attributes of the most frequently reported drugs and the attributes of the most
frequently reported ADRs, their seriousness, and their outcome. Although this study is
very similar to mine, I focused on the US and the FDA FAERS database as well as on
consumers and physicians. de Langen et al. (2008) discovered statistically significant
differences between patient reports and reports from HCPs with regards to the
seriousness and outcome of reported ADRs in the Netherlands. In comparison to HCPs,
patients reported a significantly higher number of LT ADRs (5.2% vs 2.7%) and
disability (2.3% vs 0.4%). Conversely, the findings from my study have shown that, for
the case-based analysis, the odds of consumers reporting ADR cases were lower than
those of physicians corresponding to the following patient outcomes: death (OR = .91, p
<.001); LT (OR = .30, p <.001); hospitalization (OR = .91, p <.001); disability (OR = .82,
p = .003); and, congenital (OR = .42, p <.001). However, unlike the results from de
Langen et al. (2008), the results from my study have demonstrated that the odds of
consumers reporting ADR cases corresponding to OME were higher than those of
physicians (OR = 1.19, p <.001).
108
The findings from de Langen et al. (2008) have shown that patients reported
significantly fewer ADRs leading to death (0.6% vs 1.5%) and hospitalization or
prolongation of hospitalization (9.8% vs 12.0%). Similarly, the findings from my study
have shown that, for the event-based analysis, the odds of consumers reporting LT ADRs
(OR = .36, p <.001) and those resulting in hospitalization (OR = .92, p <.001) were lower
than those of physicians. Additionally, unlike the findings from de Langen et al. (2008),
the results from my study have demonstrated that, in comparison to physicians,
consumers were less likely to report the following patient outcomes: disability (OR = .84,
p <.001); congenital (OR = .64, p <.001); and, intervention (OR = .14, p =.002).
However, unlike the results from de Langen et al. (2008), the results from my study have
demonstrated that the odds of consumers reporting ADRs resulting in OME were higher
than the odds of physicians (OR = 1.24, p <.001).
The findings from the same authors revealed that no statistically significant
differences were determined between patient reports and reports from HCPs with regards
to patient characteristics (age and gender). Conversely, the findings from my study from
both the case- and event-based analyses have shown a statistically significant difference
between consumers and physicians with regards to the distribution of ADR cases and
events by reporter gender. Female consumers and male physicians were more likely to
report ADR cases and events in comparison to their respective opposite gender
counterparts. Prior research has divulged findings suggesting that females are 1.5 to 1.7
times more susceptible to ADRs in comparison to males (Rademaker, 2001; Luca,
Ramesh, & Ram, 2017). Researchers have discovered that possible risk factors attributed

109
to pharmacokinetics, pharmacodynamic, pharmacogenetics, and immunological and
hormonal factors are responsible for females’ predisposition to ADRs. Furthermore,
researchers have determined an additional risk factor linked to the difference in
prescribed drug consumption between females and males Rademaker, 2001; Luca et al.,
2017). Therefore, female consumers may be more inclined to report ADRs in comparison
to their male counterparts.
Results from previous literature have shown that the rate of burnout for female
physicians is twice as high as that of male physicians within the US (Medscape, 2017).
Moreover, the suicide rate among US female physicians is 2.5 to 4 times as high in
comparison to that of the general US population (Schernhammer & Colditz, 2004).
Additionally, high ranking leadership positions within hospital and academic settings in
the US are occupied by male physicians given that only 15% of medical school dean-
level (decanal) positions are held by female physicians (Schor, 2018). Findings from
prior research have also demonstrated a salary gap between male and female physicians
in the US, thereby suggesting that female physicians earn less than their male
counterparts (Jagsi et al., 2012; Jenna, Olenski, & Blumenthal, 2016). Researchers have
discovered that, even after controlling for such factors as faculty ranking, years in
practice, and graduation from a top medical university, female physicians earned nearly
$20,000 less in comparison to male physicians (Jenna et al., 2016). Therefore, female
physicians may be less inclined to report ADRs compared to male physicians.
For the case-based analysis, the findings from my study revealed that female
consumers reported more ADR cases than female physicians (61% versus 39%,

110
respectively). The odds of consumers reporting ADR cases were higher for females
versus males than the odds of physicians (OR = 1.18, p <.001). For the event-based
analysis, the findings from my study showed that female consumers reported more ADRs
than female physicians (60% versus 40%, respectively). The odds of consumers reporting
ADRs were higher for females versus males than the odds of physicians (OR = 1.20, p
<.001). Therefore, irrespective of gender, from both the case- and event-based analyses,
consumers reported more ADR reports and more ADRs in comparison to those reported
by physicians.
de Langen et al. (2008) also stated that no statistically significant differences were
determined between patient reports and reports from HCPs with regards to the most
frequently reported ADRs from the following five most involved SOCs: Nervous system
disorders, Psychiatric disorders, Gastrointestinal disorders, Musculoskeletal disorders,
and General disorders/administration site conditions. Conversely, the results from my
study have revealed statistically significant differences between consumer reports and
reports from physicians with regards to the ADRs that were reported for the
aforementioned SOC categories.
The study conducted by de Langen et al. (2008) revealed statistically significant
findings suggesting that patients reported ADRs differently from HCPs with respect to
the seriousness and outcome of reported ADRs. Similarly, the findings from my study
have revealed that consumers have reported ADRs in a different manner than that
reported by physicians with regards to the patient outcome and the severity of patient
outcome. Therefore, when comparing and contrasting the results from de Langen et al.
111
(2008) and those from my study, it can be concluded that consumer reporting should not
substitute physician reporting (as physicians are a reliable source for ADR reporting).
Hence, consumer reporting may nonetheless serve as a crucial component in healthcare,
thereby placing patient safety and greater access to efficacious drugs at the forefront of
pharmacovigilance.
The theoretical foundation that was employed this study is known as SARF,
which stems from the perception of risk framework. The theory maintains that risk
interconnects with the psychological, social, institutional, and cultural viewpoints of
individuals in a way that may increase of decrease individuals’ responses to the risk or
risk event (Kasperson & Ratick, 1988). These variations in the perception of risk evoke
behavioral responses from individuals that change the social and economic aspects of
society, thereby magnifying or diminishing the actual physical risk (Kasperson & Ratick,
1988).
Similar to the theoretical framework used in this study, Bongard et al. (2002) and
Durrie et al. (2009) conducted studies in which the SARF theoretical framework was
used. The findings from both studies have shown the difference in risk perception
between consumers and physicians. In the study conducted by Bongard et al. (2002),
study participants consisting of 400 HCPs and 153 non-HCPs were requested to assess
their risk perception of ADRs related to 13 different drug classes. Based on the findings
from the study, anticoagulants and NSAIDs were ranked by HCPs as the first and second
most dangerous drugs, respectively. Contrarily, aspirin, anticoagulants, and NSAIDs
were ranked by consumers as the least dangerous drugs, with aspirin ranking as the least

112
harmful. Moreover, sleeping pills, tranquillizers, and antidepressant drugs were ranked by
consumers as the most dangerous, with psychotropic drugs ranking as the most harmful.
The consumer’s perception of the safety of aspirin may in part be linked to the
insufficient information regarding the risk of aspirin and the abundance of information
given to the consumer via advertisements, Internet, and commercials (Durrie et al., 2009).
Hence, the authors concluded that the consumer was unaware of such ADRs and,
therefore, underestimated the risk related to NSAIDs (Bongard et al., 2002).
Bongard et al. (2002) claimed that the mass media’s portrayal of psychotropic
drugs and its association with frequent suicide attempts may have greatly affected the
public’s high-risk perception of these drugs. Given the difference in the drug class
perception between the consumers and HCPs, the authors concluded that consumers and
HCPs have differing risk perceptions of ADRs. Hence, the results from the study
conducted by Bongard et al. (2002) bolster the claim that risk perception of ADRs varies
between consumers and HCPs, which is crucial for my study and which may explain why
physicians reported ADRs less frequently than consumers.
In the study performed by Durrie et al. (2009), study participants comprised of 92
medical students were asked to evaluate their risk perception of ADRs related to 13
different drug classes before and after taking pharmacology courses. Based on the
findings from the study, before taking pharmacology courses, hypnotics were ranked by
medical students as the most dangerous drug, followed by antidepressants and
anticoagulants, while contraceptive pills were ranked as the least dangerous. After taking
pharmacology courses, antidepressants were ranked by medical students as the most

113
dangerous drugs, followed by anticoagulants and hypnotics. Furthermore, Durrie et al.
(2009) discovered a statistically significant increase in perceived risk for other classes of
drugs. The highest increases were observed for contraceptive pills, NSAIDs, and aspirin,
while the lowest increases were observed for hypocholesterolaemic and antidepressant
drugs. The authors concluded that after completion of the pharmacology courses, medical
students became more aware of potentially serious ADRs that are associated with drugs
deemed relatively safe by non-HCPs, such as NSAIDs and aspirin. Therefore, the
findings from the study conducted by Durrie et al. (2009) revealed that the perceived risk
of ADRs by medical students was different after taking pharmacology courses. The lack
of adequate training and education for physicians can greatly influence their risk
perception with regards to different drug classes and the various levels of risk associated
with each drug class. Hence, the findings from the study conducted by Durrie et al.
(2009) are critical to this study and may explain the need for efficacious training and
preparation, as well as adequate information for physicians on ADRs, which may explain
the under-reporting of ADRs, including both serious and nonserious, by physicians in
comparison to consumers.
The SARF theory may elucidate the difference in risk perception between
consumers and physicians. Consumers may perceive any ADR, whether nonserious or
serious, as a risk based on media, marketing, advertisement, promotional materials,
Internet, and even anecdotal evidence (Durrie et al. (2009). For instance, traditional
media (television, newspaper, magazine, radio) coverage affects the propagation of drug
safety information, thereby influencing warnings, alerts, and label changes to the drugs

114
that are issued by the FDA (Yong et al., 2009). According to findings from prior
research, 100% of newspaper articles referenced a salubrious effect of a recently
approved medicine, while only 32% mentioned at least one deleterious adverse effect
from this drug (Cassels et al., 2003). Moreover, the Internet can serve a crucial role in
contributing to behavioral changes to drug safety information, thereby influencing the
risk perception of consumers since the message delivered by regulatory authorities, such
as the FDA, is not akin to the one conveyed by the media (Cassels et al., 2003; Yong et
al., 2009).
Additionally, direct-to-consumer (DTC) advertising, which is as an effort
undertaken by pharmaceutical companies to promote their prescription products directly
to patients (currently only allowed in the US and New Zealand), plays a pivotal role in
impacting the risk perception of consumers. Results from previous research have
suggested that an increase in consumer reporting of ADRs to the FDA was evident thanks
to the 2007 enactment of the print advertising requirement (Du et al., 2012), which
mandated DTC advertisements to contain, in clear and conspicuous text, the following
statement: “You are encouraged to report negative side effects of prescription drugs to
the FDA. Visit www.fda.gov/medwatch or call 1-800-FDA-1088.” (Kessler & Vladeck,
2007).
While investments have been made in digital promotion via Web sites, online
display advertising, search engine marketing, social media campaigns, and mobile
advertising, nearly two-thirds of promotional expenditure has been distributed to
traditional media (television, newspaper, magazine, radio), including DTC advertising

115
(Gilchrist, 2016). Findings from the study conducted by Du et al. (2012), which
investigated the relationship between DTC advertising expenditure and ADR
reporting, have shown a positive relationship between the two variables (Du et al., 2012).
According to the same authors, after the ratification of the Title IX of the Food and Drug
Administration Amendments Act (FDAAA) in 2008, spending on DTC print ads resulted
in more reports per drug on a monthly basis, of which nearly 65% might have resulted
from the MedWatch enactment of the print advertisement requirement that mandates
manufacturers to include toll-free reporting numbers in print DTC advertisements (Du et
al., 2012). Furthermore, the same authors claimed that, based on their findings, a positive,
statistically significant association existed between the number of patients and ADR
reporting. According to the same authors, the influx of DTC ads contributed to an
increase in ADR reporting by patients, which increased nearly 40% (from 1.28 monthly
reports per drug to 1.74 monthly reports per drug) (Du et al., 2012).
The difference in consumer reporting of ADRs to the FDA prior and subsequent
to the 2007 print advertisement requirement was apparent. In 2004, nearly 18% of
consumers submitted ADR reports to the FDA. One decade later, ADR reports were
submitted to the FDA by approximately 42% of consumers (Aikin, et al., 2016). Hence,
due to the collaborative efforts between the media and the FDA, the contribution of
consumer reporting has been steadily increasing, as more consumers have been reporting
ADRs. Therefore, the influence of media may explain the large amount of serious and
nonserious ADR cases and events reported by the consumers in comparison to those
reported by physicians, which was evident in this study.

116
Moreover, consumers may also perceive an ADR as a risk based on the
communication gap (either lack of or poor communication) between them and their
physicians. The results from the study conducted by Golomb et al. (2007) have suggested
that 87% of patients initiated communication with their physicians regarding a potential
association between an AE and a drug that they were consuming. However, the
physicians were less likely to corroborate the possible relationship and, therefore, were
more reticent to report ADRs (Golomb et al., 2007). Even if physicians and their patients
engaged in conversations regarding drug safety risks, which was evident in the study
conducted by Enger et al. (2013), poor or insufficient communication still existed,
thereby potentially contributing to a change in risk perception among consumers. The
findings from the study performed by Enger et al. (2013) have suggested that only 33%
of patients (who were using the anti-smoking patch varenicline reported having
conversations with their physicians regarding the drug safety risks and the adverse effects
they were experiencing from the drug (Enger, et al., 2013). Consequently, consumers
were more likely to report ADRs while physicians were less likely to report them.
Therefore, improper communication between consumers and their physicians may justify
the large amount of nonserious ADR cases and events reported by the consumers in
comparison to those reported by physicians, which was evident in my study.
Moreover, consumers may also perceive an ADR as a risk based on consumers’
reporting behaviors, which arise from consumers’ perception and experience of ADRs,
especially serious ADRs, as well as their experiences in reporting ADRs directly to PV
centers. In several studies conducted within the Netherlands and the UK, researchers have

117
explored the differences between ADR reports from patients and HCPs regarding the
perception of the importance of ADR reporting, as well as the perception of the severity
of the reported ADRs (van Hunsel et al., 2010; Anderson et al., 2011; & Krska et al.,
2011). The findings from the study conducted by Anderson et al. (2011) have suggested
that patients perceived reporting ADRs directly to a PV center as significant, thereby
resulting in more ADRs being reported in comparison to those reported by physicians.
The findings from the studies performed by Anderson et al. (2011) and Krska et al.
(2011) have demonstrated a difference in viewpoints between consumers and physicians
with regards to the severity of the ADR. The same authors argued that the definition of
“seriousness” or severity of the ADR may be dissimilar between patients and HCPs. For
instance, patients considered ADRs resulting in disability as serious ADRs and, therefore,
reported more ADRs resulting in disability in comparison to those reported by HCPs.
Interestingly, the findings from my study have revealed that consumers also reported
more ADR disability reports and ADRs resulting in disability than those reported by
physicians. Therefore, the perception of seriousness of ADRs may justify the large
amount of serious ADR cases and events reported by consumers in comparison to those
reported by physicians, which was evident in my study.
Additionally, the findings from these studies conducted by van Hunsel et al.
(2010) and Anderson et al. (2011) have suggested that patient reporting of ADRs is not
only a consequence of patients’ perception of the seriousness of the ADR, but also the
necessity to share their experiences of an ADR with others, especially the manner in
which an ADR influences their quality-of-life on a daily basis. The same authors argued

118
that patients are eager to divulge their experiences of ADRs, as well as their perceptions
and viewpoints regarding the significance of ADR reporting to a PV center. Hence, the
authors concluded that altruism, viz., patients’ selfless concern for the well-being of
others, was the primary motivation for reporting ADRs. Therefore, the potential
inclination for consumers to report ADR cases and events out of sheer altruism may
explain the large amount of serious and nonserious cases and events reported by
consumers in comparison to those reported by physicians, which was evident in my
study.
The SARF theory may also justify the reason physicians reported less ADR
reports and ADRs, including both serious and nonserious, in comparison to those
reported by consumers. The findings from a systematic review performed by Lopez-
Gonzalez et al. (2009), which sought to identify knowledge and attitudes associated with
ADR reporting, revealed that the lack of knowledge and certain reporting behaviors of
HCP seem to be associated with under-reporting in over 90% of studies (Lopez-
Gonzalez, Herdeiro, & Figueriras, 2009). Specifically, the lack of knowledge regarding
the functionality of SRS, as well as the attitudes (ignorance, in particular) to report
ADRs, appear to be linked to under-reporting of ADRs by physicians. Findings from
prior studies have suggested that numerous HCPs deemed that the sole purpose of SRS
was to identify serious ADRs. Consequently, these HCPs Therefore, the ignorance of the
ADR reporting requirements was prevalent among physicians, thus suggesting that
insufficient knowledge and an oblivious attitude of physicians was evident.

119
Furthermore, Lopez-Gonzalez et al. (2009) claimed that certain attitudes of HCPs,
such as diffidence, insecurity, complacency, lethargy, and fear, appeared to be related to
the under-reporting of ADRs. The results from the same authors’ systematic reviewed
have shown that diffidence (fear of appearing ridiculous) was an attitude related to under-
reporting in more than 70% of the studies reviewed. Moreover, insecurity, which may
also be linked to diffidence, appeared in more than 65% of the studies reviewed by these
same authors as a potential factor for under-reporting. The aforementioned attitudes are
based on the inability for an HCP to establish a causal relationship between a drug and an
ADR. The same authors stated that most HCPs are inclined to believe that only a causal
relationship between a drug and an AE necessitates reporting of ADRs to an SRS.
Therefore, such HCPs may be reluctant to report ADRs if they deem a non-causal drug-
ADR association.
According to Lopez-Gonzalez et al. (2009), the attitude of fear may be aligned
with the attitude of lack of confidence about confirming drug-ADR associations since
HCPs may be less inclined to report an ADR when they feel less confident about the
existence of a causal relationship between drugs and ADRs. This attitude may reflect the
apprehensions of reporters “not to appear foolish”, a perception that may explain the
reason why physicians reported less ADRs in comparison to those reported by consumers
in my study.
Lopez-Gonzalez et al. (2009) also claimed that the attitude of complacency, the
belief that all ADRs of a drug are known when a drug enters the market and that only safe
medications are marketed, seemed to be linked to under-reporting in about 67% of studies
120
they reviewed. This perception may be attributed to the lack of adequate or proper
training and education received by HCPs, especially in epidemiology and pharmacology
and at the clinical levels in undergraduate and medical schools.
Moreover, Lopez-Gonzalez et al. (2009) identified the attitude of lethargy, viewed
as a set of factors, including, lack of time and interest in rendering a diagnosis and
reporting, which may impede or rationalize non-reporting of ADRs. The perception of the
reporting process as a bureaucratic and challenging one was also identified as part of the
attitude of lethargy and an additional factor contributing to under-reporting of ADRs by
HCPs. If reporters are incognizant of the usefulness of the ADR data that may be reported
to the system, then it is understandable, and perhaps to some extent justifiable that,
despite any guarantee of confidentiality, those who were unfamiliar with the system
would be less likely/less inclined to report ADR, due to an aversion to disclosing
confidential information. Therefore, the findings from Lopez-Gonzalez et al. (2009) have
shown that training and medical specialty appear to be related to reporting in nearly
three-fourths of the studies that they reviewed. The same authors contended that such
findings may yield the following insights: the greater the training, the better the attitudes
toward ADR reporting (Lopez-Gonzalez et al., 2009). Hence, the findings from the study
conducted by Lopez-Gonzalez et al. (2009) are critical to this study and may explain the
need for adequate and necessary training and preparation, which may increase the
knowledge and attitudes of physicians on ADR reporting, thereby potentially contributing
to an increase in physician reporting of ADRs. These results may explain the under-
reporting of ADRs, including both serious and nonserious, by physicians in comparison

121
to those reported by consumers in my study. Thus, the increase in knowledge of
physicians and the amelioration in physician attitudes may lead to an increase in ADR
reporting.
In my study, I identified variations between physicians and consumers in terms of
reporting ADRs (Aagaard et al., 2009). SARF was employed to elucidate the differences
between HCPs and consumers’ reporting of ADRs. The perception of risk as it applies to
the present issue involved the premise that different groups (HCPs and non-HCPs,
researchers and the public, or HCPs and consumers) hold different views on the possible
risks associated with some action or environment. In my study, I discovered that several
factors contribute to the perception of risk, including factors related to the individual, the
presentation of the risk, and the attributes of the risk (Aagaard et al., 2009). The findings
from the studies conducted by Bongard et al. (2002), Durrie et al. (2009), and Lopez-
Gonzalez et al. (2009), which also employed the SARF framework and confirmed the
aforementioned factors contributing to the risk perception, are important to my study and
may explain the need for adequate education and training for physicians, as well as an
educational intervention designed to ameliorate attitudes associated with under-reporting,
especially among physicians, which may explain the differences in reporting of ADRs by
physicians and consumers found in my study. Furthermore, the results from the study
performed by Du et al. (2012), are also significant to my study and may justify the need
to launch initiatives for consumers and physicians aimed at ameliorating patient-
physician communications, which may also explain the differences in ADR reporting
between consumers and physicians found in my study. Hence, with respect to ADR
122
reporting and drug therapy, consumers frequently have contrasting views in their
perception of risk versus HCPs (Aronson, 2006). Therefore, the SARF framework was
appropriate for this study with regards to identifying under-reporting of ADRs since it
was assumed that the consumer’s perception of risk differed from that of the physician.
Limitations of the Study
Despite the advantages of the FAERS database, which offers a solid structure for
reporting of ADRs, the disadvantages of this system and its data are noteworthy to
discuss. FAERS contains redundancies, reporting biases, and conflations (including, but
not limited to, multiple entries and indications with ADRs) that are negatively impacting
analysis and interpretation (McAdams et al., 2008). These biases can lead to conclusions
of drug-ADR causal relationships where none exist and may also obfuscate potential
drug-ADR relationships. Within the FAERs data, there is no evidence of a causal
relationship between the drug and the reported event (FDA, 2017). Although consumers
and HCPs are urged to submit ADR reports, the existence of the event may not
necessarily be attributed to the drug, but rather to the condition being treated, other
concomitant medicines or drugs, or other reasons. Therefore, the information in the ADR
reports is indicative of the viewpoints of the reporter (FDA, 2017).
Additionally, the FAERS data do not lead to a precise risk estimation relating to a
drug. Risk estimation necessitates sufficient information associated with drug utilization
to generate a numerical figure for the denominator of the risk estimate. However, this
information is typically extracted from sales data, which may exaggerate the prescription
and utilization levels (Hazell & Shakir, 2006). Since the denominator (number of patients

123
prescribed the product) may be unknown or erroneous, it is improbable to compute the
incidence rate of ADR using the FAERS data (Rodriguez, Evelyn, Staffa, & Graham,
2001). Hence, neither incidence rates nor an estimation of drug risk can be calculated
from the FAERS data (FDA, 2017).
An additional limitation of the FAERS database is its bias toward serious
outcomes, in particular, the conflation of ADRs and serious outcomes (Maciejewski et
al., 2017). This bias may have resulted from the lack of comprehension regarding the
definition of the term “death”, specifically, whether death was listed as an ADR
(resulting from the consumption of a medicinal product drug only) or an outcome (due to
a disease). For instance, within the FAERS database, death was erroneously reported as
an ADR rather an outcome resulting from the use of the drug thalidomide to treat a type
of cancer known as complex myeloma multiplex (Maciejewski et al., 2017). Moreover,
there are instances where the patient outcome of death may be over-reported, in relation
to its prevalence among ADRs. Hence, the aforementioned limitation may contribute to
over-reporting, especially among consumers.
Since FAERS is a voluntary reporting system, not all reports for every AE or
medication error that occurs with a product are submitted to the FDA. Moreover,
duplicate reports may exist in which the same report was submitted by a consumer and/or
by another reporter (the physician). Hence, the aforementioned limitations may result in
an increase in risk associated with a product or drug (Chedid, Vijayvargiya, & Camilleri,
2018).

124
An additional limitation of the study that needs to be discussed is that one reporter
may report more than one ADR event per case (report), thereby resulting in ADRs not
being truly independent. Since my study was conducted at the ADR case and event level
(modeled after the Danish study conducted by Aagaard et al. (2009)), the findings from
these analyses were not at the patient/consumer level. Therefore, it was impossible to
differentiate between ADRs, as the ADR events are identified by an ISR number instead
of by reporter. Moreover, it was not possible to differentiate ADR events by reporter type
and, consequently, it was not possible to designate an ADR event as primary (or
secondary) for a reporter. Therefore, a reporter level analysis was not performed in this
study.
Limitations of the correlational cross-sectional research design, as well as the
secondary data analysis in this study, must also be acknowledged. Since quantitative
methods were employed, consumer perception of ADRs was not analyzed given that the
latter requires qualitative methods. Qualitative data analysis of consumer reports would
have been advantageous to this study in an effort to garner a fresh and alternate
perspective of the consumer’s experience of ADRs. Since the correlational cross-
sectional research design was employed in this study, the secondary data may have
resulted in implicit bias, reporting bias, and recall bias, which may yield misclassification
or information bias (Gualano et al., 2015). Implicit bias among physicians may occur,
thereby propagating disparities in healthcare and rendering clinical decisions, especially
physicians’ inclination for certain drugs versus other drugs (Gawron & Bielefeldt, 2018).
Under-reporting not only impacts older medicines and products as well as nonserious

125
ADRs, but also affects new drugs and serious ADRs (Hazell & Shakir, 2006). Reporting
rate is also subject to fluctuate gradually and, therefore, be impacted by such aspects as
media coverage, thereby contributing to reporting bias (Hazell & Shakir, 2006).
Moreover, it can prove challenging to render statistical decisions on the relative risk of
one product or indication versus another given that the rate of under-reporting may be
different between the two medicines, thereby potentially concealing or overstating any
statistically significant difference in toxicity profile (Hazell & Shakir, 2006).
Furthermore, the use of this particular design provided a rather limited amount of
information of the sample (Gualano et al., 2015). The correlational cross-sectional
research design presented challenges regarding the determination of causal relationships
between the distribution of ADRs by reporter (consumer versus physician) and patient
outcome, as well as SOC and reporter demographics. The correlational cross-sectional
design contained several limitations that are significant to examine, including internal
validity, which is only germane to experimental designs, which attempt to establish a
causal relationship (Frankfort-Nachmias, 2014). Since researchers do not alter the
independent variables, they must render logical or theoretical inferences in terms of the
direction of the causation by taking into account that correlation between variables does
not imply causation (Field, 2013). Hence, in my study, it was challenging to make causal
inferences when working with FAERS data for which quantitative methods were
Recommendations
With regards to the case- and event-based analyses performed in this study, in
addition to analyzing consumer and physician ADR reports for severity of ADRs, it is
126
also noteworthy to assess such reports for nonserious ADRs in order to determine into
which SOC groups they would fall and compare the findings to those with serious ADRs.
Furthermore, it would be beneficial to assess the serious and nonserious ADRs based on
ATC groups, which was not addressed or performed in my study. Additionally, it would
be worthwhile to examine and analyze the chronological trends in spontaneous reporting
of ADRs to the FAERS database by computing and comparing over time the reporting
proportions for both serious and nonserious events, as well as the serious to nonserious
ratio (Moulis et al., 2012). Although the seriousness of ADRs is a crucial factor to
investigate in ADR reporting, the trends in reporting of serious versus nonserious ADRs
have not been scrutinized, especially within the FAERS database. Therefore, additional
research is needed and it is recommended that an observational, descriptive study is
employed (Moulis et al., 2012).
Additional research is needed to assess the quality of spontaneous reports, which
is consequential for the precise assessment of drug safety signals. Crucial information
that allows researchers to render causal inferences may potentially be omitted from ADR
reports with inferior quality and those that contain insufficient details (Hazell & Shakir,
2006). Moreover, ADR reports can be confounded by concurrent diseases or conditions,
concomitant medication, or other factors. Consequently, “background noise” can emerge
within the FAERS database, thereby rendering signal detection difficult or impossible or
potentially creating false positive signals (Hazell & Shakir, 2006).
To reduce the “noise” within the FAERS database, it may be worthwhile to map
drug identifiers in FAERS to the chemical structures of these drugs’ ingredients, which

127
may yield information on the complete drug profile rather than the incomplete profile
consisting of merely drug names and synonyms (Maciejewski et al., 2017). Moreover,
given the millions of reports that are submitted to the FAERS database, it may be
necessary to automate this process by utilizing machine learning methods. As a result,
such an automated process may facilitate the identification of conflations in the data, such
as multiple reports for the same ADR and consumer, or cases where ADRs were
confounded with the conditions that the medicines or products are treating. For instance,
diabetes was previously recorded as a side effect for medicines that treat diabetes
(Maciejewski et al., 2017).
Signals in FAERS database are obfuscated by redundancies in the chemical name,
which yields incorrect statistical associations that lead to statistical insignificance on
synonym aggregation, thereby concealing associations that would otherwise be
statistically significant on aggregation (Maciejewski et al., 2017). To counteract this
issue, it may be necessary to represent the active ingredients of drugs by their unique
chemical structures by creating and embedding a readily searchable form within FAERS
that enables users to easily search by the drugs’ chemical structures (Maciejewski et al.,
2017). Therefore, additional research is needed in this respect.
Given the conflation of ADRs and outcomes, particularly the serious outcome of
“death”, it is recommended to create a feature within FAERS that distinguishes between
disease- and drug-related outcomes in an effort to correct the confusion as to when a
medicinal product is utilized in different indications with distinct symptoms and
outcomes (Moulis et al., 2012). Moreover, an additional feature to build and integrate

128
within the FAERS database is to automatically send an alert to the investigator to
common indication biases, including high death rate in cancer, or baseline metabolic
anomalies in diabetes (Moulis et al., 2012). Therefore, additional research is needed on
this topic and subsequent statistical analysis on ADR reporting is recommended to
distinguish between the outcomes associated with the disease or with the drug
(Maciejewski et al., 2017).
Additionally, within FAERS, the trends and biases, such as the conflation of
ADRs and serious outcomes, in ADR reporting may hinder the reliability of drug-ADR
associations (Maciejewski et al., 2017). Consequently, additional research on detecting
drug-ADR associations is needed to monitor fluctuations in reporting patterns and trends.
Since FAERS contains numerous types of conflation, these may be discovered via
statistical analyses, such as a chemical structure and time-resolve analyses of ADR
reporting (comparing ADR reports over time) (Maciejewski et al., 2017). Such analyses
may be necessary to calculate time-resolved profiles of drug-ADR associations, which
may divulge significant drug safety information relating to the comorbidities and
similarities of ADRs between drugs and AEs across ATC, as well as their time evolution
(the numbers of reports per month for individual ADRs observed across FAERS database
for certain drugs) (Maciejewski et al., 2017). Moreover, the use of correlative studies
may divulge additional features of the potential discrepancies between the clinical
profiles of medicines or products that possess similar chemical structures (Maciejewski et
al., 2017).

129
Consequently, ADR signals and their evolution can be observed and compared
over time in an attempt to unveil biases that were otherwise difficult to detect.
Furthermore, the use of time-resolved statistical analysis for drug-ADR associations can
yield potential benefits in identifying biased reporting trends and biases within the ADR
data (Maciejewski et al., 2017). Therefore, additional research is needed to demonstrate
the value of performing chemical structure analysis and comparative analysis of ADRs
over time (time-resolved analysis) in an effort to potentially divulge factors that have
previously been undetected.
The results from such additional research may provide unbiased classification of
ADRs, indications, and drugs with similar clinical profiles. Once these biases and
conflations are rectified, the molecular mechanism of previously hidden ADRs may
ultimately be unveiled (Maciejewski et al., 2017). Therefore, the findings from such
additional research may prompt investigators to avoid confounding associations based on
chemical compounds and reporting biases in FAERS.
Since FAERS is an instrumental database for consumers, physicians,
pharmaceutical representatives and scientists, and other reporters, it can nonetheless be
ameliorated in several ways to improve postmarketing pharmacovigilance. As was
previously discussed in this chapter, it was recommended that an automated process is
created to map drugs and synonyms to their unique chemical ingredients (Maciejewski et
al., 2017). Moreover, alerts could be provided for indications where serious outcomes are
frequent and challenging or impossible to detect or differentiate from ADRs. However,
definitive drug-ADR associations necessitate exposure data, as the information on dosage

130
application and related pharmacokinetics (PK) data are crucial (Maciejewski et al., 2017).
Currently, dosage information is not provided, and PK data can only be acquired from
various sources, such as PharmaPendium, which contains both FAERS data and PK
information (Maciejewski et al., 2017). However, these data are not directly mapped, and
this resource cannot be accessible by the public. However, FAERS database could be
linked to such public databases as DailyMed or drugs.com, which may yield information
on PK, drug labels, formulations, and approved indications (Maciejewski et al., 2017).
Therefore, it is recommended to invest in and perform additional research on acquiring
information and performing statistical analyses that may offer further insight into drug-
ADR associations based on dose and PK data.
One of the current disadvantages of the FAERS database is the lack of
commentary by any reporter when submitting ADR reports. Several EU countries,
including, but not limited to, Sweden and UK, enable any reporter to add free text case
narratives of their ADR experiences when submitting suspected ADR reports online
(Vilhelmsson, 2015). Therefore, it would be of utmost significance to ameliorate the
FAERS surveillance system by introducing a feature that includes free text comments
from all reporter types, especially consumers. Hence, such a feature may yield greater
insight into consumer experiences with the drug and ADR.
It would be beneficial to improve the FAERS database by creating and
incorporating an automated reporting mechanism in FAERS that not only collects ADR
information in a manner that would diminish inaccuracies and other errors relating to
misclassification of ADRs and indications, but also interacts with the reporters in a user-

131
friendly manner, especially with those who do not possess technical competence.
Consequently, such qualities within the FAERS system would enable reporters to acquire
feedback after submitting their entries, particularly with cases on the same or similar
suspect drug, indication, patient population, and treatment programs that are most
frequent or challenging. In addition to other advantages, the inclusion of such features
may also assist investigators, physicians, and scientists to determine and define the
“suspect drug” in treatment regimens, irrespective of the aim of the submitters/reporters
(Maciejewski et al., 2017). Although such a development within the FAERS database
would certainly necessitate funding, it is recommended that such a commitment and
investment be a concerted public and private sector effort that would not only be
advantageous to legislature and the scientific community, but also to the health and well-
being of the public.
Under-reporting has been a significant problem that has plagued PV activities not
only at a national scale, but also at a global scale. Although the reporting rate of ADRs
has gradually improved over the years, ADRs are still under-reported in SRSs by
consumers and physicians. Results from prior research have revealed that lack of training
and education, as well as the lack of knowledge and certain attitudes on the part of
physicians, contribute to under-reporting of ADRs by physicians (Lopez-Gonzalez et al.,
2009). Consequently, such findings may have potential significant impact given that
knowledge and attitudes are factors that can be modified through proper trainings and
educational efforts. HCPs, especially physicians, are encouraged to continue enhancing
their comprehension regarding the objective and significance of PV in an effort to not

132
only submit ADR reports, but to ameliorate the amount and quality of ADR reports. If
physicians are properly educated on the purpose of SRS and the benefits of ADR
reporting, then it is possible that they may impart their knowledge upon their patients.
Moreover, if physicians are thoroughly educated by the FDA and other regulatory
agencies on the postmarketing safety risks, then they can also impart their teachings upon
their patients and consumers on such risks. Therefore, it is recommended that physicians
undergo additional training, especially at the undergraduate level of pre-medical
education, that enhances their knowledge regarding observing and detecting ADRs at the
clinical level, as well as increases their comprehension regarding the significance of ADR
reporting.
If an educational intervention is created to bridge the gap between HCPs’
knowledge and attitudes and under-reporting of ADRs, then the reporting rate among
physicians may be ameliorated (Lopez-Gonzalez et al., 2009). Therefore, in an effort to
increase reporting, it is recommended that observational studies be conducted to explore
the utility and effectiveness of such interventions, and to assess whether a statistically
significant relationship exists between attitudes and reporting. Subsequently, it is
recommended to design and launch an educational initiative to ameliorate attitudes
associated with under-reporting, particularly among physicians. Consequently, such an
effort may contribute to an increase in signal detection, thereby allowing the health
authorities and regulatory agencies to address and combat health disparities in a rapid
fashion.

133
Prior research has shown findings suggesting the need for educational initiatives
to foster efficient patient-physician communication in an effort to improve the poor
communication between patients and their physicians. Findings from previous literature
have demonstrated that efficacious communication between patients and their providers
stems from the ability of HCPs to convey important information regarding their patients’
health, as well as the benefits and risks of drugs that patients may be consuming, in a
manner that is precise, well-timed, thorough, and clear (Marcus, 2014). With regards to
drug safety information, results from prior research have shown that a majority of
patients prefer to have such information relayed to them in a manner and format that is
accessible, easy to read, and facilitates comprehension of the material learned, with any
new safety information clearly identified or marked. Accordingly, such a method may
enable patients to be cognizant of new information regarding the advantages and
jeopardizes of the drugs they are consuming, specifically for those who have been
consuming medications for a long time and, therefore, do not feel the need to repeatedly
check for new drug safety information (Marcus, 2014). Consequently, patients will be
motived to actively partake in their care, thereby resulting in increased patient
satisfaction, greater adherence to treatment guidelines and medication usage instructions,
an amelioration in health outcomes, and a reduction in treatment times and expenditures
associated with administering care (Marcus, 2014).
Additionally, results from prior research have shown that physicians are more
engaged during their conversations with their patients regarding their health when these
physicians have drug safety information that is relayed to them in a well-timed, concise,

134
and authentic fashion, thus yielding stronger and more efficient patient-physician
communications (Van de Wiel et al., 2011). Therefore, it is recommended to implement
educational interventions that target efficient patient-physician communication in an
effort to improve the poor communication between patients and their physicians.
Previous literature findings have demonstrated findings that, although consumer
reporting has increased globally, awareness of ADR reporting, especially among
consumers, is still rather low (Margraff & Bertram, 2014). Findings from the UK study
conducted by Avery et al. (2011) have revealed that only 8.5% of patients were cognizant
of ADR reporting to SRS YCS despite patient contribution to ADR reporting since 2005
within the UK (Avery et al., 2011). The duration between the inception of direct
consumer reporting and the frequency of consumer ADR reporting to SRSs appeared to
impact the reporting rate. Results from prior research have shown that those countries
that have allowed for direct consumer reporting for a long period of time, including, the
Netherlands, Denmark, and the UK, had a higher reporting rate (de Langen et al., 2008;
Aagaard et al., 2009; Avery et al., 2011). Contrarily, those countries that have recently
introduced direct patient reporting, such as Portugal, Malta, and Hungary, had a lower
reporting rate (Inch, Watson, Anakwe-Umeh, & YC Study Collaboration, 2012; Margraff
& Bertram, 2014). Although not the aim of the present study, it is unclear the manner in
which physician reporting is evolving in the countries that have introduced patient
reporting. Increasing consumer and physician awareness of ADR reporting should be at
the forefront of national regulatory agencies, especially in countries with a low reporting
rate. Therefore, additional research is needed to investigate the attributes of consumer

135
reporters, in particular, the psychological features that may elucidate the willingness to
partake in consumer reporting.
A recommended method to ameliorate under-reporting is to advertise the SRS to
the general public and to stimulate not only HCPs, but also the consumers and their
families who have experience with ADRs to submit ADR reports to regulatory health
agencies, such as the FDA. Findings from a study conducted Arnott et al. (2013) have
shown that promoting greater participation in pharmacovigilance activities will depend
on raising public awareness, which should commence with strengthening patient-
physician communication and promoting education among consumers and HCPs,
especially regarding drug safety risks and ADR reporting. Moreover, it is essential to
embolden consumers to submit ADR reports and to encourage them that their actions will
yield significance and value to their reports (Arnott et al., 2013). If communications
between patients and their physicians are strengthened, then these conversations will
involve discussions on the importance and value of ADR reporting, especially if both
parties are aware of ADR reporting and its significance. While educational efforts may
not necessarily lead to a change in reporting behaviors, such initiatives may nonetheless
provide a better understanding of reporting behaviors among consumers and physicians.
Thus, it may be possible to combat discrepancies in healthcare and improve the well-
being and safety of the public if concerted efforts are undertaken by researchers working
with regulatory agencies, legislators, pharmaceutical companies, and the public.
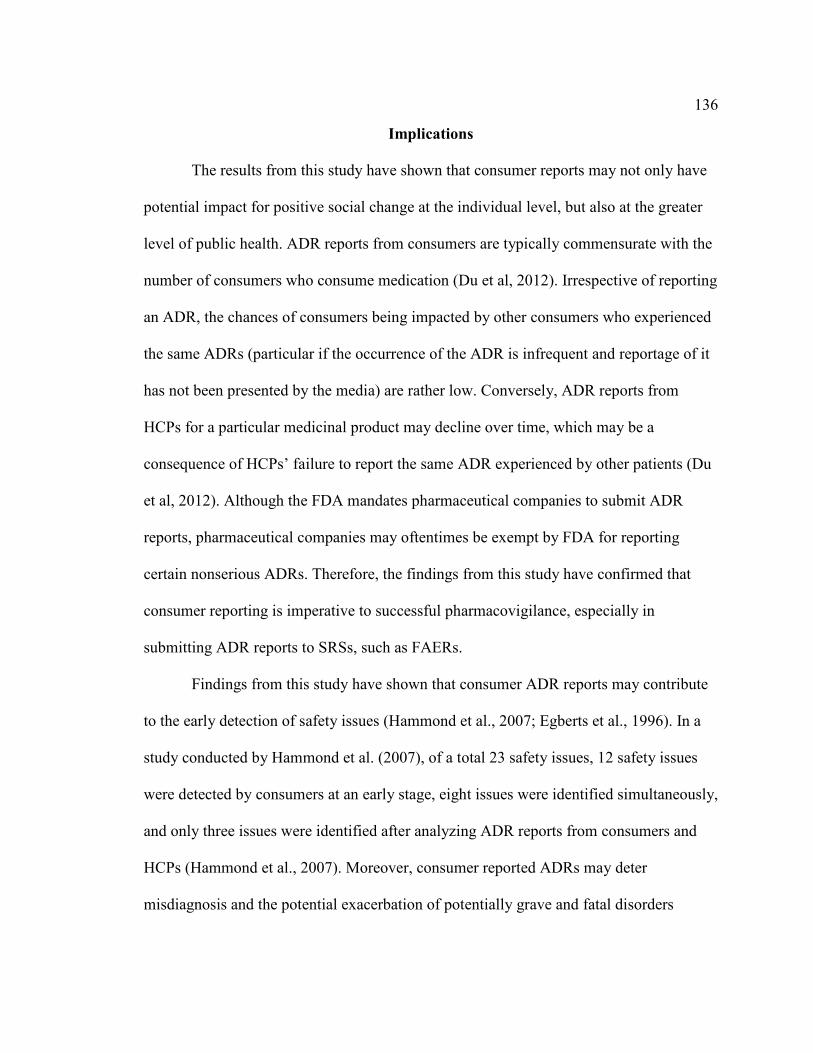
136
Implications
The results from this study have shown that consumer reports may not only have
potential impact for positive social change at the individual level, but also at the greater
level of public health. ADR reports from consumers are typically commensurate with the
number of consumers who consume medication (Du et al, 2012). Irrespective of reporting
an ADR, the chances of consumers being impacted by other consumers who experienced
the same ADRs (particular if the occurrence of the ADR is infrequent and reportage of it
has not been presented by the media) are rather low. Conversely, ADR reports from
HCPs for a particular medicinal product may decline over time, which may be a
consequence of HCPs’ failure to report the same ADR experienced by other patients (Du
et al, 2012). Although the FDA mandates pharmaceutical companies to submit ADR
reports, pharmaceutical companies may oftentimes be exempt by FDA for reporting
certain nonserious ADRs. Therefore, the findings from this study have confirmed that
consumer reporting is imperative to successful pharmacovigilance, especially in
submitting ADR reports to SRSs, such as FAERs.
Findings from this study have shown that consumer ADR reports may contribute
to the early detection of safety issues (Hammond et al., 2007; Egberts et al., 1996). In a
study conducted by Hammond et al. (2007), of a total 23 safety issues, 12 safety issues
were detected by consumers at an early stage, eight issues were identified simultaneously,
and only three issues were identified after analyzing ADR reports from consumers and
HCPs (Hammond et al., 2007). Moreover, consumer reported ADRs may deter
misdiagnosis and the potential exacerbation of potentially grave and fatal disorders

137
(Vihelmsson, 2015). Hence, by gathering as many consumer and patient experiences as
possible, new and suspected ADRs may be detected, thereby enabling the analysis of
potential causation at the population level in an effort to counteract unwarranted harm
and suffering to levels, including, but not limited to, individual, family, organizational,
and societal/policy (Vihelmsson, 2015).
Additionally, the results from this study have corroborated findings from previous
research suggesting that consumer ADR reports may yield novel insight and information
different from that provided by reports from physicians and other HCPs. In the study
conducted by Aagaard et al. (2009) in which an analysis of 6,319 ADR reports was
performed, results from the study have revealed that, in comparison to other sources,
patients were more likely to report ADRs associated with the following SOCS: “nervous
system disorders,” “psychiatric disorders,” and “reproductive system and breast
disorders.” (Aagard et al., 2009).
Findings from this study have supported results from previous literature
suggesting that consumer reporting may contribute to a greater amount of spontaneous
ADR report submission, thereby augmenting SRSs and contributing to positive social
change (Aagaard et al., 2009; de Langen et al., 2008; Blenkinsopp et al., 2007; van
Hunsel et al., 2009). Results from published research have shown that consumers and
patients are inclined to detect and report more ADRs in comparison to HCPs (Aagaard et
al., 2009; de Langen et al., 2008; Blenkinsopp et al., 2007; van Hunsel et al., 2009).
Similarly, the findings from my study have also demonstrated that consumers reported
more ADRs and submitted more ADR reports than physicians. Since the number of

138
ADRs reported by consumers is higher in comparison to that of HCPs and other reporters
(Van Grootheest, & de Graaf, 2003; Blenkinsopp, et al., 2007), and since the inclusion of
consumer reports can provide value and additional insight beyond those reports submitted
by HCPs, as evidenced in this study and previous studies, it would be justifiable to
include consumer reports in the pharmacovigilance and signal detection activities of other
countries in addition to those that currently accept consumer reporting of ADRs (Health
Action International, 2015). Thus, by merging the reports from consumers with those of
physicians and other HCPs, and injecting them into SRSs in a manner that enables causal
relationships to be detected between the drugs and ADRs (and compared over time), the
SRSs may ultimately contain informative and crucial data regarding ADRs, thereby
contributing to the detection of signals and overall improvement in pharmacovigilance
and drug safety (Health Action International, 2015).
The findings from this study have an impact for positive change at the societal
level. The FAERS SRS plays an integral role in postmarket surveillance. However, the
system is in dire need of updates and standardizations in an effort to respond to, depict,
and disseminate information contained within the dynamic environment and the digital
age consisting of the Internet and social media (ISMP, 2018). To date, the FDA has stated
that it continues to revise its critical guidelines for reporting ADRs, which is a document
that previously updated circa 2001. No drafts for discussion have been released.
Therefore, the results from this study may attract the attention of regulatory agencies to
release important instructions regarding the proper and effective means of ADR

139
reporting, which may inevitably stimulate reporting of ADRs to regulatory health
agencies by both consumers and physicians.
Consequently, consumer reporting may actively be promoted to the general public
not only through the official websites of drug regulatory agencies and via pamphlets and
drug product information leaflet (for those who may not have access to the Internet), but
also via public information. As indicated by the WHO, consumer reporting should be as
easy and cheap as possible with, for instance, easy access to prepaid reporting forms
(Vihelmsson, 2015). Findings from prior research have confirmed that consumer
reporting leads to an increase in the frequency of ADRs reported to PV centers, thereby
leading to signal detection (Vihelmsson, 2015). Furthermore, consumers who are
cognizant of voluntary, SRSs, appeared to be knowledgeable and equipped in using such
systems to directly report ADRs. However, increased promotion of and adequate training
on how to utilize such systems, as well as accurate and precise ADR reporting
requirements, are nonetheless needed (Vihelmsson, 2015). For instance, active promotion
and increasing awareness of ADR reporting can be made at local pharmacies via
brochures and information when a medicine that is prescribed or over-the-counter is
purchased. These brochures may also contain easy accessible information of consumer
ADR reports from which data have already been amassed and assessed, thereby
presenting additional insight into potential drug-ADR associations. Within the current
digital epoch, the utilization of social media data that is available for ADR monitoring is
being increasingly discussed by researchers (Vihelmsson, 2015). The use of social media,
especially Facebook and Twitter, has been recommended as one of the methods to

140
increase spontaneous ADR reporting (Vihelmsson, 2015). Currently, specific
applications, such as MedWatcher, are available and accessible by consumers for
reporting adverse effects resulting from drugs, vaccines, and medical devices
(Vihelmsson, 2015). Hence, the results from this study can encourage additional research
that may yield further insight and greater understanding of the aforementioned factors,
which will ultimately transform into positive developments and practices given the
necessity for more consumers to report their experienced suspected ADRs.
Conclusion
This study has shown that consumers reported more ADR reports and ADRs as
well as more serious ADR reports and serious ADRs in comparison to those reported by
physicians. Additionally, the study has revealed that consumers reported a large amount
of nonserious ADR reports and ADRs in comparison to those reported by physicians.
Moreover, the results from this study have revealed that female consumers reported more
ADRs in comparison to female physicians. The results from this study have also
demonstrated that consumers reported on different SOC groups than physicians. Based on
the results from previous studies and from this study, consumer reports yield insight into
not only the limitations of surveillance systems, but also the under-reporting of ADRs,
both of which are persistent problems, especially in foreign countries and in those
countries not currently accepting consumer reporting. The results from prior research
have revealed that a majority of ADRs are under-reported, and the overall reporting rate
of ADRs is circa 1% (although the rate considerably fluctuates due to the severity and
type of reaction, as well as the characteristics of the drug). Additional findings from

141
studies have shown that only 6% of all ADRs are reported in the US (Alatawi & Hansen,
2017). The information from consumer reports may offer additional understanding of the
ADR experiences that consumers may have. Given the higher number of ADRs reported
by consumers in comparison to those reported by physicians, which was evident from the
results in this study, it would be judicious to incorporate consumer reports in the PV and
signal detection processes, especially in foreign countries that are not currently accepting
such reporting. Hence, the findings from this study may reveal the significance of
consumer reporting in providing a deeper understanding and awareness of ADRs, thereby
encouraging regulators and legislators from foreign countries to accept consumer reports
and integrate them with physician reports within their PV practices.

142
References
Aagaard, L, Nielsen, L.H., & Hansen, E.H. (2009). Consumer reporting of adverse drug
reactions. A retrospective analysis of the Danish adverse drug reaction database
from 2004 to 2006. Drug Safety, 32(11), 1067-1074. Retrieved from
http://adisonline.com/drugsafety/Pages/default.aspx
Abraham, J., & Ballinger, R. (2012). The neoliberal regulatory state, industry interests,
and the ideological penetration of scientific knowledge: Deconstructing the
redefinition of carcinogens in pharmaceuticals. Science, Technology, & Human
Values, 37(5), 443-477. doi:10.1177/0162243911424914
Adams, J. (1995). Risk. London: UCL Press. doi: 10.1002/sim.4780141513
Aikin, K. J., O’Donoghue, A. C., M. Squire, C., Sullivan, H. W., & Betts, K. R. (2016).
An empirical examination of the FDAAA-mandated toll-free statement for
consumer reporting of side effects in direct-to-consumer television
advertisements. Journal of Public Policy & Marketing, 35(1), 108-123.
doi:10.1509/jppm.14.077
Alatawi, Y. M., & Hansen, R. A. (2017). Empirical estimation of under-reporting in the
US Food and Drug Administration Adverse Event Reporting System
(FAERS). Expert Opinion on Drug Safety, 1-7.
doi:10.1080/14740338.2017.1323867
Anderson, C., Krska, J., Murphy, E., Avery, A., & Yellow Card Study Collaboration.
(2011). The importance of direct patient reporting of suspected adverse drug

143
reactions: a patient perspective. British Journal of Clinical Pharmacology, 72(5),
806-822. doi: 10.1111/j.1365-2125.2011.03990.x
Arnott, J., Hesselgreaves, H., Nunn, A. J., Peak, M., Pirmohamed, M., Smyth, R. L.,... &
Young, B. (2013). What can we learn from parents about enhancing participation
in pharmacovigilance?. British Journal of Clinical Pharmacology, 75(4), 1109-
1117. doi: 10.1111/j.1365-2125.2012.04441.x
Aronson, J. K. (2006). A prescription for better prescribing. British Journal of Clinical
Pharmacology, 61(5), 487-491. doi: 10.1111/j.1365-2125.2006.02649
Avery, A. J., Anderson, C., Bond, C. M., Fortnum, H., Gifford, A., Hannaford, P. C.,...
& Murphy, E. (2011). Evaluation of patient reporting of adverse drug reactions to
the UK ‘Yellow Card Scheme’: Literature review, descriptive and qualitative
analyses, and questionnaire surveys. Health Technology Assessment. doi:
10.3310/hta15200
Biagi, C., Montanaro, N., Buccellato, E., Roberto, G., Vaccheri, A., & Motola, D.
(2013). Underreporting in pharmacovigilance: an intervention for Italian GPs
(Emilia–Romagna region). European Journal of Clinical Pharmacology, 1-8. doi:
10.1007/s11096-015-0209-x
Blenkinsopp, A., Wilkie, P., Wang, M., & Routledge, P. A. (2007). Patient reporting of
suspected adverse drug reactions: a review of published literature and international
experience. British Journal of Clinical Pharmacology, 63(2), 148-156. doi:
10.1111/j.1365-2125.2006.02746.x
Bongard, V., Ménard-Taché, S., Bagheri, H., Kabiri, K., Lapeyre-Mestre, M., &

144
Montastruc, J.L. (2002). Perception of the risk of adverse drug reactions:
differences between health professionals and non-health professionals. British
Journal of Clinical Pharmacology, 54(4), 433-6. doi:10.1046/j.1365-
2125.2002.01674.x
Bren, L. (2001). Frances Oldham Kelsey: FDA medical reviewer leaves her mark on
history. FDA consumer, 35(2), 24-29. Retrieved from
http://urschristen.de/GA%20-%20Thalidomid%20-
%20Frances%20Oldham%20Kelsey.pdf
Britten, N. (2009). Medication errors: the role of the patient. British Journal of Clinical
Pharmacology, 67(6), 646–650. doi10.1111/j.1365-2125.2009.03421.x
Brown, M. T., & Bussell, J. K. (2011). Medication adherence: WHO cares? Mayo Clinic
Proceedings, 86(4), 304–314. doi:10.4065/mcp.2010.0575
Brun, W. (1994). Risk perception: Main issues, approaches and findings. Subjective
Probability, 295-320. Retrieved from doi10.1111/j.1365-2125.2009.06425.x
Campbell, D., & Stanley, J. (1963). Experimental and quasi-experimental designs for
research. Boston. Retrieved
https://books.google.com/books?hl=en&lr=&id=KCTrCgAAQBAJ&oi=fnd&pg=
PT4&dq=Experimental+and+quasi-
experimental+designs+for+research&ots=Mdp2DSuH-
I&sig=mRXgDmc6bXGSmCFOw55j6kysChU#v=onepage&q=Experimental%20
and%20quasi-experimental%20designs%20for%20research&f=false
Carlson, M. D., & Morrison, R. S. (2009). Study design, precision, and validity in

145
observational studies. Journal of Palliative Medicine, 12(1), 77-82. doi:
10.1089/jpm.2008.9690
Cassels, A., Hughes, M. A., Cole, C., Mintzes, B., Lexchin, J., & McCormack, J. P.
(2003). Drugs in the news: an analysis of Canadian newspaper coverage of new
prescription drugs. Canadian Medical Association Journal, 168(9), 1133-1137.
Retrieved from http://www.cmaj.ca/content/168/9/1133.short
Chedid, V., Vijayvargiya, P., & Camilleri, M. (2018). Advantages and limitations of the
federal adverse events reporting system in assessing adverse event reporting for
eluxadoline. Clinical Gastroenterology and Hepatology, 16(3), 336-338.
Retrieved from https://www.cghjournal.org/article/S1542-3565(17)31362-
9/abstract
Cobert, B. (2011). Cobert's manual of drug safety and pharmacovigilance. Jones &
Bartlett Publishers.
Creswell, J. (2014). The Selection of a Research Design. In Research Design:
Qualitative, Quantitative, and Mixed Methods Approaches (p. 3). London: Sage
Publications. Retrieved
from http://www.sagepub.com.proxy1.athensams.net/upm-
data/22780_Chapter_1.pdf
de Langen, J., van Hunsel, F., Passier, A., de Jong-van den Berg, L., & van Grootheest,
K. (2008). Adverse drug reaction reporting by patients in The Netherlands three
years of experience. Drug Safety, 31(6), 515-524. Retrieved from
https://rd.springer.com/article/10.2165/00002018-200831060-00006

146
Diether, v. (2016, December 5). Writing Chapter 4: The results of your research study.
Retrieved from http://dissertationwriting.com/write-dissertation-results-chapter/
Di Maio, M., Gallo, C., Leighl, N. B., Piccirillo, M. C., Daniele, G., Nuzzo, F., ... &
Ceribelli, A. (2015). Symptomatic toxicities experienced during anticancer
treatment: agreement between patient and physician reporting in three randomized
trials. Journal of Clinical Oncology, 33(8), 910-915. Retrieved from
https://iris.unito.it/handle/2318/1572016#.W9H9w8_rt9M
Drottz-Sjöberg, B. M. (1991). Non-expert definitions of risk and risk perception. Center
for Risk Research, Stockholm School of Economics. Retrieved from
https://books.google.com/books?id=DC34skLhI90C&pg=PA758&dq=Non-
expert+definitions+of+risk+and+risk+perception.+Center&hl=en&sa=X&ved=0a
hUKEwiZ5orhj6LeAhXSUt8KHS1eBRMQ6AEIKDAA#v=onepage&q=Non-
expert%20definitions%20of%20risk%20and%20risk%20perception.%20Center&
f=false
Du, D. T., Goldsmith, J., Aikin, K. J., Encinosa, W. E., & Nardinelli, C. (2012). Despite
2007 law requiring FDA hotline to be included in print drug ads, reporting of
adverse events by consumers still low. Health Affairs, 31(5), 1022-1029.
Retrieved from https://www.healthaffairs.org/doi/abs/10.1377/hlthaff.2010.1004
Durrie, G., Hurault, C., Damase-Michel, C., & Montastruc, J.L. (2009). Perception
of risk of adverse drug reactions: A 3-year follow-up of a cohort of medical
students. Fundamental and Clinical Pharmacology, 24(4), 423-427.
doi:10.1111/j.1472-8206.2009.00783.x

147
Egberts, T. C., Smulders, M., De Koning, F. H., Meyboom, R. H., & Leufkens, H. G.
(1996). Can adverse drug reactions be detected earlier? A comparison of reports
by patients and professionals. BMJ, 313(7056), 530-531. Retrieved from
https://www.bmj.com/content/313/7056/530.short
EMEA. (1995). ICH Topics E 2 A Clinical Safety Data Management Definitions and
Standards for Expedited Reporting. Retrieved from
http://www.ema.europa.eu/docs/en_GB/document_library/Scientific_guideline/20
09/09/WC500002749.pdf
Enger, C., Younus, M., Petronis, K. R., Mo, J., Gately, R., & Seeger, J. D. (2013). The
effectiveness of varenicline medication guide for conveying safety information to
patients: a REMS assessment survey. Pharmacoepidemiology and Drug Safety,
22(7), 705-715. Retrieved from
https://onlinelibrary.wiley.com/doi/full/10.1002/pds.3400
European Medicines Agency. (2010). Regulations. Retrieved April 23, 2017, from Office
Journal of the European Union: http://eur-
lex.europa.eu/LexUriServ/LexUriServ.do?uri=%20OJ:L:2010:348:0001:0016:EN
Farquhar, C., Armstrong, S., Kim, B., Masson, V., & Sadler, L. (2015). Under-reporting
of maternal and perinatal adverse events in New Zealand. BMJ open, 5(7),
e007970. Retrieved from https://bmjopen.bmj.com/content/5/7/e007970.short
148
FDA. (n.d.). FAERS Public Dashboard. Retrieved from
https://fis.fda.gov/sense/app/777e9f4d-0cf8-448e-8068-
f564c31baa25/sheet/7a47a261-d58b-4203-a8aa-6d3021737452/state/analysis
FDA. (2015). Instructions for Requesting Individual Case Reports. Retrieved January 18,
2016, from http://www.fda.gov/Drugs/GuidanceComplianceRegulatoryInformation/S
urveillance/AdverseDrugEffects/ucm345338.htm
FDA. (2016a). Preventable Adverse Drug Reactions: A Focus on Drug Interactions
Retrieved November 5, 2017, from
https://www.fda.gov/Drugs/DevelopmentApprovalProcess/DevelopmentResources/D
rugInteractionsLabeling/ucm110632.htm
FDA. (2016b). FDA Adverse Event Reporting System (FAERS): Latest Quarterly Data
Files. Retrieved January 18, 2016, from
http://www.fda.gov/Drugs/GuidanceComplianceRegulatoryInformation/Surveillance
/AdverseDrugEffects/ucm082193.htm
FDA. (2017). Questions and Answers on FDA’s Adverse Event Reporting System.
Retrieved October 7, 2017, from
https://www.fda.gov/drugs/guidancecomplianceregulatoryinformation/surveillanc
e/adversedrugeffects/
Field, A. (2013). Discovering Statistics using IBM SPSS Statistics. SAGE Publications,
Ltd.
Frankfort-Nachmias, C. (2014). Research Methods for the Social Sciences.Worth
Publishers.

149
Gawron, A. J., & Bielefeldt, K. (2018). Risk of pancreatitis following treatment of
irritable bowel syndrome with eluxadoline. Clinical Gastroenterology and
Hepatology, 16(3), 378-384. Retrieved from
https://www.sciencedirect.com/science/article/pii/S1542356517309357
Gerstman, B. B. (2008). Basic biostatistics: Statistics for health practice. Sudbury, MA:
Jones and Bartlett.
Gilchrist, A. (2016). Bill to restrict DTC ads introduced in house commitee. Retrieved
September 26, 2018, from Pharmacy Times:
https://www.pharmacytimes.com/news/bill-to-restrict-dtc-ads-introduced-in-
house-committe
Goldsmith, J., Aikin, K. J., Encinosa, W. E., & Nardinelli, C. (2012). Despite 2007 law
requiring FDA hotline to be included in print drug ads, reporting of adverse events
by consumers still low. Health Affairs, 31(5), 1022-1029. Retrieved from
https://www.healthaffairs.org/doi/abs/10.1377/hlthaff.2010.1004
Golomb, B., McGraw, J., Evans, M., & Dimsdale, J. (2007). Physician response to
patient reports of adverse drug effects: implications for patient-targeted adverse
effect surveillance. Drug Safety, 30, 669-675. Retrieved from
https://rd.springer.com/article/10.2165/00002018-200730080-00003
Gualano, M. R., Gili, R., Scaioli, G., Bert, F., & Siliquini, R. (2015). General
population's knowledge and attitudes about antibiotics: a systematic review and
meta‐analysis. Pharmacoepidemiology and Drug Safety, 24(1), 2-10. Retrieved
from https://onlinelibrary.wiley.com/doi/full/10.1002/pds.3716

150
Hammond, I. W., Rich, D. S., & Gibbs, T. G. (2007). Effect of consumer reporting on
signal detection: using disproportionality analysis. Expert Opinion on Drug
Safety, 6(6), 705-712. Retrieved from
https://www.tandfonline.com/doi/abs/10.1517/14740338.6.6.705
Hauben, M., & Aronson, J. K. (2009). Defining a signal and its subtypes in
pharmacovigilance based on a systematic review of previous definitions. Drug
Safety, 32(2), 99. Retrieved from
https://rd.springer.com/article/10.2165/00002018-200932020-00003
Hazell, L., & Shakir, S. A. (2006). Under-reporting of adverse drug reactions. Drug
Safety, 29(5), 385-396. Retrieved from
https://rd.springer.com/article/10.2165/00002018-200629050-00003
Health Action International. (2015). Direct Patient Reporting in the European Union.
Retrieved December 22, 2016, from A Snapshot of Reporting Systems in Seven
Member States: http://haieurope.org/wp-content/uploads/2015/09/Direct-Patient-
Reporting-in-the-EU.pdf
Herdeiro, M. T., Figueiras, A., Polónia, J., & Gestal-Otero, J. J. (2005). Physicians’
attitudes and adverse drug reaction reporting. Drug Safety, 28(9), 825-833.
Retrieved from https://rd.springer.com/article/10.2165/00002018-200528090-
00007
Herxheimer, A., Crombag, R., & Alves, T. L. (2010). Direct patient reporting of adverse
drug reactions: a 12-country survey. Briefing Paper. Health Action International,

151
Europe. Retrieved from
https://consumers.cochrane.org/sites/consumers.cochrane.org/files/public/uploads/
10%20May%202010%20Report%20Direct%20Patient%20Reporting%20of%20
ADRs.pdf
Hoyert, D. L., & Xu, J. (2012). Deaths: preliminary data for 2011. National Vital
Statistics Report, 61(6), 1-51. Retrieved from
https://www.cdc.gov/nchs/data/nvsr/nvsr61/nvsr61_06.pdf
Hyman S.E. (2000). The needs for database research and for privacy collide. American
Journal of Psychiatry, 157(11), 1723-1724. Retrieved from
http://ajp.psychiatryonline.org/article.aspx?Volume=157&page=1723&journalID
=13
Jagsi, R., Griffith, K. A., Stewart, A., Sambuco, D., DeCastro, R., & Ubel, P. A. (2012).
Gender differences in the salaries of physician researchers. JAMA Internal
Medicine, 307(22), 2410-2417. Retrieved from
https://jamanetwork.com/journals/jama/fullarticle/1182859
Jena, A. B., Olenski, A. R., & Blumenthal, D. M. (2016). Sex differences in physician
salary in US public medical schools. JAMA Internal Medicine, 176(9), 1294-
1304. Retrieved from
https://jamanetwork.com/journals/jamainternalmedicine/fullarticle/2532788?linkI
d=26599569
Kasperson, J., & Ratick, S (1988). The social amplification of risk: a conceptual
framework. Risk Analysis 8(2), 177–187. doi:10.1111/j.1539-6924.1988.tb01168.x

152
Krska, J., Anderson, C., Murphy, E., Avery, A. J., & Yellow Card Study Collaboration.
(2011). How patient reporters identify adverse drug reactions. Drug Safety,
34(5), 429-436. Retrieved from https://rd.springer.com/article/10.2165/11589320-
000000000-00000
Inácio, P., Cavaco, A., & Airaksinen, M. (2016). The value of patient reporting to the
PV system: a systematic review. British Journal of Clinical Pharmacology.
Retrieved from
https://bpspubs.onlinelibrary.wiley.com/doi/full/10.1111/bcp.13098
ICH. (2013). Understanding MedDRA. Retrieved from
https://www.meddra.org/sites/default/files/page/documents/meddra2013.pdf
Inch, J., Watson, M. C., Anakwe-Umeh, S., & Yellow Card Study Collaboration. (2012).
Patient versus healthcare professional spontaneous adverse drug reaction
reporting. Drug Safety, 35(10), 807-818. Retrieved from
https://rd.springer.com/article/10.1007/BF03261977
Institute for Safe Medication Practices. (2015). A Critique of a Key Drug Safety
Reporting System. Retrieved December 3, 2017, from
https://www.ismp.org/quarterwatch/pdfs/2014Q1.pdf
ISMP. (2018, September). Annual Report Issue- September 2018. Retrieved September
28, 2018, from Quarter Watch: https://www.ismp.org/quarterwatchtm/annual-
report-Sept-2018
Jarernsiripornkul, N., Krska, J., Capps, P. A. G., Richards, R. M. E., & Lee, A. (2002).

153
Patient reporting of potential adverse drug reactions: a methodological
study. British Journal of Clinical Pharmacology, 53(3), 318-325. Retrieved from
https://bpspubs.onlinelibrary.wiley.com/doi/full/10.1046/j.0306-
5251.2001.01547.x
Kasperson, J., & Ratick, S (1988). The social amplification of risk: a conceptual
framework. Risk Analysis 8(2), 177–187. doi:10.1111/j.1539-6924.1988.tb01168.x
Kessler, D. A., & Vladeck, D. C. (2007). A critical examination of the FDA's efforts to
preempt failure-to-warn claims. Geo. LJ, 96, 461. Retrieved from
https://heinonline.org/HOL/LandingPage?handle=hein.journals/glj96&div=18&id
=&page=
Lazarou, J., Pomeranz, B. H., & Corey, P. N. (1998). Incidence of adverse drug reactions
in hospitalized patients: a meta-analysis of prospective studies. JAMA Internal
Medicine, 279(15), 1200-1205. Retrieved from
https://jamanetwork.com/journals/jama/article-abstract/187436
Leroy, F., Dauxois, J. Y., Théophile, H., Haramburu, F., & Tubert-Bitter, P. (2014).
Estimating time-to-onset of adverse drug reactions from spontaneous reporting
databases. BMC Medical Research Methodology, 14(1), 17. Retrieved from
https://bmcmedresmethodol.biomedcentral.com/articles/10.1186/1471-2288-14-
17
Lopez-Gonzalez, E., Herdeiro, M. T., & Figueiras, A. (2009). Determinants of under-
reporting of adverse drug reactions. Drug Safety, 32(1), 19-31. Retrieved from
https://rd.springer.com/article/10.2165/00002018-200932010-00002

154
Lucca, J. M., Ramesh, M., & Ram, D. (2017). Gender differences in the occurrences and
pattern of adverse drug reactions in psychiatric patients: a prospective
observational study. Tropical Journal of Medical Research, 20(1), 84. Retrieved
from http://www.tjmrjournal.org/article.asp?issn=1119-
0388;year=2017;volume=20;issue=1;spage=84;epage=90;aulast=Lucca
Maciejewski, M., Lounkine, E., Whitebread, S., Farmer, P., DuMouchel, B., Shoichet, B.
K., & Urban, L. (2017). The importance of reverse translation for preclinical off-
target mitigation: quantification and mitigation of biases in the FDA adverse
event reporting system. BioRxiv, 068692. Retrieved from
https://www.biorxiv.org/content/early/2017/01/29/068692
Marcus, C. (2014). Strategies for improving the quality of verbal patient and family
education: a review of the literature and creation of the EDUCATE model. Health
Psychology and Behavioral Medicine: An Open Access Journal, 2(1), 482-495.
Retrieved from
https://www.tandfonline.com/doi/abs/10.1080/21642850.2014.900450
Margraff, F., & Bertram, D. (2014). Adverse drug reaction reporting by patients: an
overview of fifty countries. Drug Safety, 37(6), 409-419. Retrieved from
https://rd.springer.com/article/10.1007/s40264-014-0162-y
McAdams, M. A., Governale, L. A., Swartz, L., Hammad, T. A., & Dal Pan, G. J. (2008).
Identifying patterns of adverse event reporting for four members of the
angiotensin II receptor blockers class of drugs: revisiting the Weber
effect. Pharmacoepidemiology and Drug Safety, 17(9), 882-889. Retrieved from

155
https://insights.ovid.com/pharmacoepidemiology-drug-
safety/pads/2008/08/001/index-blame-agreement-subjective-vs-
objective/37/01445491
Medscape. (2017). Physician Lifestyle Report 2017. Retrieved September 28, 2018, from
https://www.medscape.com/sites/public/lifestyle/2017
Mezher, M. (2017, August 29). Making Sense of FAERS: Researchers Suggest Fixes to
FDA's Adverse Event Database. Retrieved from http://raps.org/Regulatory-
Focus/News/2017/08/29/28355/Making-Sense-of-FAERS-Researchers-Suggest-
Fixes-to-FDAs-Adverse-Event-Database/
Medawar, C., & Herxheimer, A. (2004). A comparison of adverse drug reaction reports
from professionals and users, relating to risk of dependence and suicidal behavior with paroxetine. International Journal of Risk & Safety in Medicine, 16(1), 5-19. Retrieved from https://content.iospress.com/articles/international- journal-of-risk-and-safety-in-medicine/jrs295
Miller, Rupert G. (1966). Simultaneous Statistical Inference. Springer. Retrieved from
https://www.springer.com/us/book/9781461381242
Mitchell, A., Henry, D., Sanson-Fisher, R., & O'Connell, D. (1994). Patients as a direct
source of information on adverse drug reactions. British Medical Journal, 297, 891-
893. Retrieved from https://www.bmj.com/content/297/6653/891.short
Mittelhammer, Ron C., Judge, George G., Miller, Douglas J. (2000). Econometric
Foundations. Cambridge University Press. pp. 73–74. ISBN 0-521-62394-4.
Moore, T. J., & Bennett, C. L. (2012, November). Under-reporting of hemorrhagic and

156
thrombotic complications of pharmaceuticals to the US Food and Drug
Administration: empirical findings for warfarin, clopidogrel, ticlopidine, and
thalidomide from the Southern Network on Adverse Reactions (SONAR).
In Seminars in thrombosis and hemostasis (Vol. 38, No. 08, pp. 905-907). Thieme
Medical Publishers.
Moulis, G., Sommet, A., Durrieu, G., Bagheri, H., Lapeyre‐Mestre, M., & Montastruc, J.
L. (2012). Trends of reporting of ‘serious’ versus‘non‐serious’ adverse drug
reactions over time: a study in the French PharmacoVigilance Database. British
Journal of Clinical Pharmacology, 74(1), 201-204.
Ott, R. L., & Longnecker, M. T. (2008). An Introduction to Statistical Methods and Data
analysis. Nelson Education.
Pal, S. N., Duncombe, C., Falzon, D., & Olsson, S. (2013). WHO strategy for collecting
safety data in public health programmes: complementing SRSs. Drug
Safety, 36(2), 75-81. Retrieved from
https://rd.springer.com/article/10.1007/s40264-012-0014-6
Parrella, A., Gold, M., Marshall, H., Braunack-Mayer, A., Watson, M., & Baghurst, P.
(2012). Parental views on vaccine safety and future vaccinations of children who
experienced an adverse event following routine or seasonal influenza vaccination
in 2010. Human Vaccines & Immunotherapeutics, 8(5), 662-667. Retrieved from
https://www.tandfonline.com/doi/abs/10.4161/hv.19478
Pillans, P. I. (2008). Clinical perspectives in drug safety and adverse drug

157
reactions. Expert Review of Clinical Pharmacology, 1(5), 695-705. Retrieved
from https://www.tandfonline.com/doi/abs/10.1586/17512433.1.5.695
Prescrire International. 2015. The Reorganisation of European Pharmacovigilance. doi
10.1111/j.1472-8206.2009.00799.x
Price, P. (2012). Research Methods in Psychology: Core Concepts and Skills. Retrieved
March 13, 2016, from Overview of Non-experimental Research. Retrieved from
https://www.ncbi.nlm.nih.gov/pubmed/25802924
Rademaker, M. (2001). Do women have more adverse drug reactions?. American Journal
of Clinical Dermatology, 2(6), 349-351. Retrieved from
https://rd.springer.com/article/10.2165/00128071-200102060-00001
Research Design. (n.d.). Retrieved March 9, 2016, from Descriptive Studies:
https://ori.hhs.gov/education/products/sdsu/res_des1.htm
Robertson, J., & Newby, D. A. (2013). Low awareness of adverse drug reaction
reporting systems: a consumer survey. The Medical Journal of Australia, 199(10),
684-686. Retrieved from
https://www.mja.com.au/system/files/issues/199_10_181113/rob10069_fm.pdf
Rodriguez, E. M., Staffa, J. A., & Graham, D. J. (2001). The role of databases in drug
postmarketing surveillance. Pharmacoepidemiology and Drug Safety, 10(5), 407-
410. Retrieved from https://onlinelibrary.wiley.com/doi/abs/10.1002/pds.615
Sakaeda, T., Tamon, A., Kadoyama, K., & Okuno, Y. (2013). Data mining of the public
158
version of the FDA Adverse Event Reporting System. International Journal of
Medical Sciences, 10(7), 796. Retrieved from
https://www.ncbi.nlm.nih.gov/pmc/articles/PMC3689877/
Schernhammer, E. S., & Colditz, G. A. (2004). Suicide rates among physicians: a
quantitative and gender assessment (meta-analysis). American Journal of
Psychiatry, 161(12), 2295-2302. Retrieved from
https://ajp.psychiatryonline.org/doi/abs/10.1176/appi.ajp.161.12.2295
Schor, N. F. (2018). The decanal divide: women in decanal roles at US medical
schools. Academic Medicine, 93(2), 237-240. Retrieved from
https://www.ingentaconnect.com/content/wk/acm/2018/00000093/00000002/art0
0030
Science Museum. (n.d.). Thalidomide. Retrieved from Brought to Life:
http://broughttolife.sciencemuseum.org.uk/broughttolife/themes/controversies/tha
lidomide
Sen, S. (2016). Consumer reporting of adverse drug reactions: A current
perspective. International Journal of Green Pharmacy (IJGP), 10(03). Retrieved
from http://www.greenpharmacy.info/index.php/ijgp/article/view/671
Sultana, J., Cutroneo, P., & Trifirò, G. (2013). Clinical and economic burden of adverse
drug reactions. Journal of Pharmacology & Pharmacotherapeutics, 4(Suppl1),
S73. Retrieved from https://www.ncbi.nlm.nih.gov/pmc/articles/PMC3853675/
Tadesse, W. T., Mekonnen, A. B., Tesfaye, W. H., & Tadesse, Y. T. (2014). Self-

159
reported adverse drug reactions and their influence on highly active antiretroviral
therapy in HIV infected patients: a cross-sectional study. BMC Pharmacology and
Toxicology, 15(1), 32. Retrieved from
https://bmcpharmacoltoxicol.biomedcentral.com/articles/10.1186/2050-6511-15-
32
University of Chicago. (2014, March). Guidance on Secondary Analysis of Existing Data
Sets. Retrieved from https://sbsirb.uchicago.edu/page/irb-guidance-documents-
important-topics
U.S. Department of Health & Human Services. (2010, January 15). Office for Human
Research Protections. Retrieved February 1, 2016, from 45 CFR 46:
https://www.hhs.gov/ohrp/regulations-and-policy/regulations/45-cfr-46/
Van de Wiel, M. W., Van den Bossche, P., Janssen, S., & Jossberger, H. (2011).
Exploring deliberate practice in medicine: how do physicians learn in the
workplace?. Advances in Health Sciences Education, 16(1), 81-95. Retrieved
from https://rd.springer.com/article/10.1007/s10459-010-9246-3
Van Grootheest, K., & de Graaf, L. (2003). Consumer adverse drug reaction
reporting. Drug Safety, 26(4), 211-217. Retrieved from
https://rd.springer.com/article/10.2165/00002018-200326040-00001
Van Hunsel, F., Passler, A., & Grootheest, C. (2009). Comparing patients’ and healthcare
professionals’ ADR reports after media attention: the broadcast of a Dutch
television programme about the benefits and risks of statins as an example. British

160
Journal Clinical Pharmacology, 5, 558-564. Retrieved from
https://bpspubs.onlinelibrary.wiley.com/doi/full/10.1111/j.1365-2125.2009.03400.x
Van-Lierop, T., & Bunyan, C. (2008). Strengthening Pharmacovigilance to Reduce
Adverse Effects of Medicines. Retrieved from
https://ec.europa.eu/health/sites/health/files/files/pharmacovigilance/docs/2007_0
2_26/press-release_02_2007_en.pdf
Vilhelmsson, A. (2015). Consumer narratives in ADR reporting: an important aspect of
public health? Experiences from reports to a Swedish consumer organization.
Frontiers in Public Health, 3, 211. Retrieved from
https://www.frontiersin.org/articles/10.3389/fpubh.2015.00211/full
Vural, F., Ciftci, S., & Vural, B. (2014). The knowledge, attitude and behaviors of
nurses about pharmacovigilance, adverse drug reaction and adverse event
reporting in a state hospital. Northern Clinics of Istanbul, 1(3), 147. Retrieved
from https://www.ncbi.nlm.nih.gov/pmc/articles/PMC5175033/
Walden University. (n.d.). Red flag issues that should trigger a research ethics
consultation with the IRB. Retrieved February 1, 2016, from
http://academicguides.waldenu.edu/researchcenter/orec/guides
WHO. (2002). The importance of PV: safety monitoring of medicinal products. Retrieved
from http://apps.who.int/medicinedocs/en/d/Js4893e/9.html
WHO. (2012). Safety Monitoring of Medicinal Products: Reporting System for the
General Public. Retrieved April 23, 2017, from

161
http://www.who.int/medicines/areas/quality_safety/safety_efficacy/EMP_Consum
erReporting_web_v2.pdf
WHO. (2017). Essential medicines and health products. Retrieved April 23, 2017, from
PV:
http://www.who.int/medicines/areas/quality_safety/safety_efficacy/pharmvigi/en/
Yellowcard. (2017). About Yellowcard. Retrieved October 7, 2017, from
https://yellowcard.mhra.gov.uk/the-yellow-card-scheme/
Yong, P. L., Bigman, C., Flynn, D. N., Mittermaier, D., & Long, J. A. (2009). Messages
about Black-Box Warnings. Drug Safety, 32(12), 1147-1157. Retrieved from h
ttps://rd.springer.com/article/10.2165/11318960-000000000-00000