undergraduate honors theses student works 5-2016
TRANSCRIPT

East Tennessee State UniversityDigital Commons @ East Tennessee State University
Undergraduate Honors Theses Student Works
5-2016
Extracting (1,3/1,6)-β-Glucans fromSaccharomyces cerevisiae: A FungalImmunotherapeuticJames C. ElliottEast Tennessee State University
Follow this and additional works at: https://dc.etsu.edu/honors
Part of the Analytical Chemistry Commons
This Honors Thesis - Open Access is brought to you for free and open access by the Student Works at Digital Commons @ East Tennessee StateUniversity. It has been accepted for inclusion in Undergraduate Honors Theses by an authorized administrator of Digital Commons @ East TennesseeState University. For more information, please contact [email protected].
Recommended CitationElliott, James C., "Extracting (1,3/1,6)-β-Glucans from Saccharomyces cerevisiae: A Fungal Immunotherapeutic" (2016).Undergraduate Honors Theses. Paper 334. https://dc.etsu.edu/honors/334

April 15, 2016

2
Table of Contents
Abstract ...................................................................................................... 3
1. Introduction ............................................................................................ 4
1.0 Saccharomyces cerevisiae .............................................................. 4
1.1 Fungal cell wall ................................................................................ 4
1.2 Various uses of fungi in food production and pharmaceuticals ........ 6
1.3 Historical background of β-glucan extraction ................................... 7
1.4 Calculation of β-glucans in sample .................................................. 8
1.5 Research aims ................................................................................. 10
2. Materials and Methods .......................................................................... 11
2.0 Sources for solvents and materials used ......................................... 11
2.1 Three times boiling with 1N NaOH, 1N H3PO4, absolute ethanol .... 11
2.2 NMR Analysis .................................................................................. 15
2.3 Alternative Method I: One ethanol boiling step ................................ 16
2.4 Alternate Method II: Reducing overall volume and materials ........... 17
2.5 Alternate Method III: Titrating the acid concentration ...................... 17
2.6 Tabulated summary of methods utilized .......................................... 18
3. Results and Discussion ........................................................................ 19
3.0 Recap of research questions ........................................................... 19
3.1 Reduction of frequency of extractions with boiling ethanol .............. 19
3.2 Reduction of initial sample size of S. cerevisiae .............................. 21
3.3 Acid titration ..................................................................................... 24
4. Conclusions and Future Work ............................................................. 27
4.0 Conclusions ..................................................................................... 27
4.1 Future work ...................................................................................... 29
5.0 References ........................................................................................... 32
6.0 Acknowledgments ............................................................................... 36
7.0 Appendix .............................................................................................. 37

3
Abstract
The goal of this research was the development of a method to extract pure
(1,3/1,6)-β-glucans from Saccharomyces cerevisiae. These β-glucans are of
pharmaceutical importance because an animal’s immune system can recognize
glucan molecules, and these molecules can act as immunomodulators,
essentially turning on the immune system. The problem in the past has been that
previously published methods produce β-glucans with low side chain lengths and
few branching occurrences. This issue was tackled by a multivariable approach
that reduced extraction steps, initial sample size, and concentrations of reagents
used. This method has been shown to produce greater yields of β-glucans while
maintaining high purity. Analyses such as 1H-NMR and GC-MS have been used
to confirm the content of the extracted glucans. Ideally, this research will
generate interest for further β-glucan studies and ultimately be utilized
pharmacologically with immunocompromised individuals.

4
1. Introduction
1.0 Saccharomyces cerevisiae
Saccharomyces cerevisiae is a fungal species that is characterized as
yeast. It has several practical applications in areas such as brewing beer or
baking bread. Additionally, it is easy to obtain and relatively inexpensive, thus
making it a good model for experimentation. It is unicellular and a eukaryotic
species, and it shares other characteristics of fungal species such as
reproduction by budding, and a complex cell wall.1
1.1 Fungal cell wall
The fungal cell wall is generally intricate and is comprised many parts. Its
composition in S. cerevisiae contains lipids, mannans, glucans, and chitin. The
presence of chitin is one of the aspects of fungal cell walls that separates it from
the cell walls of plants.2 A simplified schematic of the theoretical structure of a
fungal cell wall is shown in Figure
1.1.0.
The fungal cell wall provides for
the organism in several ways. Not
only does it act as a secondary
defense system, but the chitin helps to
provide a stronger structural integrity
to the fungus. But chitin is not the
most noteworthy part of the fungal cell
wall. The fungal cell wall contains polymers of of glucose that are commonly
Figure 1.1.0: Generalized structure of a fungal cell
wall3

5
referred to as glucans. These glucans have specific linkages and conformations
that are unique to fungal species.4
Glucose molecules are named
according to the location of their
alcohol group on the first carbon as
shown in Figure 1.1.1. In the alpha
conformation, the alcohol group is on
the same side of the ring as the alcohol group on the second carbon, and in the
beta form, they are in opposition. Glucans are essentially polymers of glucose
that have a particular connectivity. In cereals and grains, the connectivity of these
glucose molecules follows a (1,3/1,4) linkage, as shown in Figure 1.1.2.
While these are still classified as glucans, they are not the glucans that
are found in fungal species. This is particularly important because there is a
significant difference
among the glucans
regarding the way
the immune system
responds to each.
Fungal species feature what is known as a (1,3/1,6)-linkage seen in Figure
1.1.3. This (1,3/1,6)-linkage is important because it is recognized by the immune
system as a sign of infection. In generalized terms, when a fungal infection is in
Figure 2.1.1 - Alpha and Beta Glucose
Figure 1.1.2 – (1,3/1,4)-β-glucan

6
its early stages, the (1,3/1,6)-
linkage is the first marker the
immune system sees before it
starts to generate antibodies.
For the purposes of
immunotherapeutics, it is
fortunate that this particular
marker is not dangerous on its own. These glucans can be used to preemptively
start the immune system.
1.2 Various uses of fungi in food production and pharmaceuticals
Many fungi,
including S. cerevisiae,
have been used for many
years in the production of
various types of food and
drink. S. cerevisiae has
often been called baker’s yeast because it is the leavening agent in bread. This
leavening occurs through a fermentation process that yeast perform naturally. It
is also this same process that allows for the production of many alcoholic
beverages such as beer. Essentially, yeast breaks down glucose molecules for
food and energy, and the byproducts are pyruvate and ethanol as shown in
Equation 1.2.0.
Equation 1.2.0: Fermentation of glucose by yeast into pyruvate
which is then converted into ethanol.
Figure 1.1.3 – (1/3,1/6)-β-glucan

7
Since the discovery of penicillin in 1928, fungal species have been heavily
used to produce various antibioitics.5 The type of resistance that is gained from
the ingestion of certain fungal species is due to the antimicrobial adaptations that
fungi have evolved throughout history. Unfortunately, many of these antibiotics
were and continue to be overused by the general population. As a result, many
pathogens have evolved resistance to these fungal-based drugs, such as
methicillin resistant Staphylococcus aureus (MRSA).
1.3 Historical background of β-glucan extraction
In 1941, Hassid, et al. detailed their experimental procedure for the
extraction of (1,3/1,6)-β-glucans.6 Their method employed a series of extractions
that used various acid, base, and ethanol solvents. While their method was
successful in yielding pure samples of the desired β-glucans, the yields that were
achieved were low. Additionally, the native structure of these glucans was
severely degraded. The polymerization of glucans is one of the key , high levels
degradation could interfere with the immune system’s ability to recognize
(1,3/1,6)-β-glucans. The glucan’s native structure is generally defined by the
lengths of its side chains and the frequency of branching that occurs. Both of
these are dependent upon the 1,6-linkage shown above in Figure 1.1.2. Hassid’s
method will be referred to as the classical method and is important to note
because their attempts were some of the first that focused on extracting the β-
glucans from Saccharomyces cerevisiae.
One attempt to improve upon the classical method has been to utilize the
efforts of enzymes to extract the (1,3/1,6)-β-glucans. In particular, Shiavone, et
8
al. have worked on perfecting this methodology.7 While their methods have
produced results with high yields and purity, the enzymes that are required for
their extraction process are not cost efficient. While enzymes are expensive, they
are also extremely sensitive to their storage conditions. With the use of
(1,3/1,6)-β-glucans as pharmaceutical grade immunotherapeutics, it would be
difficult to produce the desired product at an economically feasible price.
Dr. Rachel Greene also worked to optimize the extraction methods that
were available. Some of the methods employed involved the reduction of the
number of extraction steps. Additionally, different acids were used such as
hydrochloric acid, phosphoric acid, and formic acid. By attempting to optimize
these conditions, Greene’s methods provided better resolution of the native
structure of the (1,3/1,6)-β-glucans because there were novel structures
observed.8 By maintaining the native polymerized structure, the understanding of
how (1,3/1,6)-β-glucans interact with the innate immune system increased.
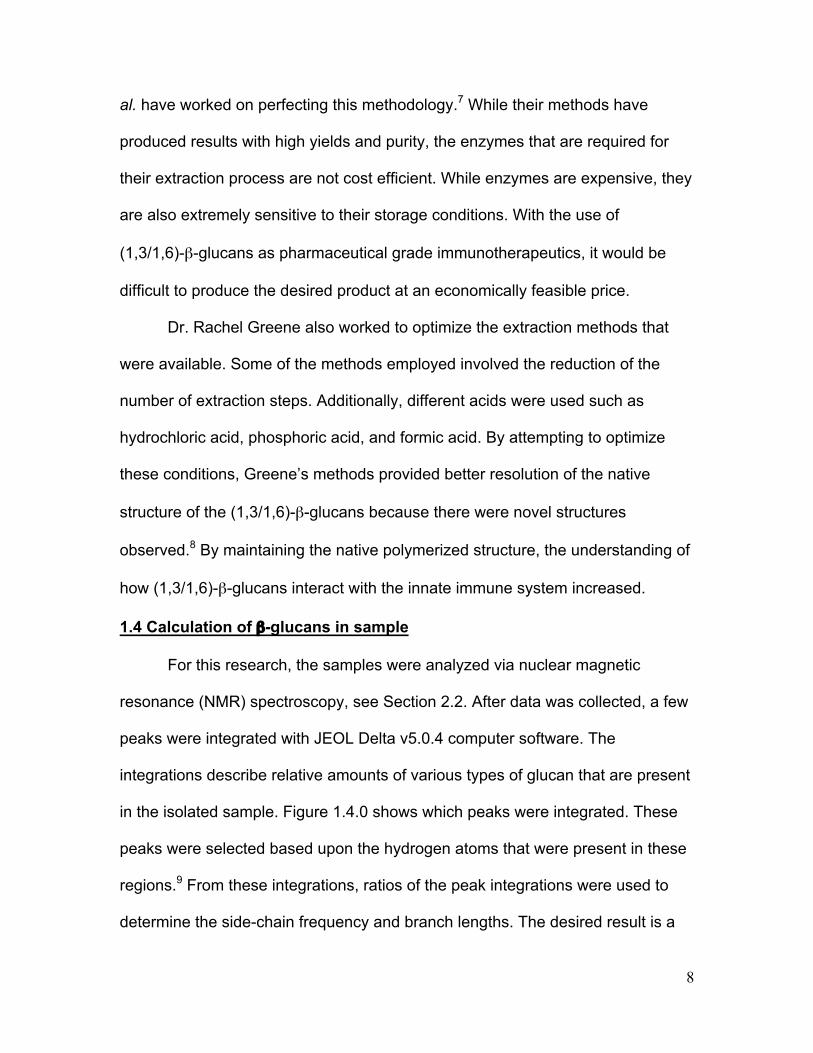
1.4 Calculation of β-glucans in sample
For this research, the samples were analyzed via nuclear magnetic
resonance (NMR) spectroscopy, see Section 2.2. After data was collected, a few
peaks were integrated with JEOL Delta v5.0.4 computer software. The
integrations describe relative amounts of various types of glucan that are present
in the isolated sample. Figure 1.4.0 shows which peaks were integrated. These
peaks were selected based upon the hydrogen atoms that were present in these
regions.9 From these integrations, ratios of the peak integrations were used to
determine the side-chain frequency and branch lengths. The desired result is a

9
high average side chain length (ASCL) and a low average branching frequency
(ABF). The black box
below in Figure 1.4.0
encloses the anomeric
hydrogen; this hydrogen
is positioned on the first
carbon of each glucose
molecule, C-1. Because
each glucose molecule
has this hydrogen, its
peak was normalized to
1000 to use as a reference. Next, the red box surrounds the doublet that is
associated with the hydrogen on the first carbon when a (1,3) linkage is present.
Lastly, the blue box displays the doublet for the protons that are attached to the
C-6 with a (1,6) linkage.
Once the spectrum was integrated, the ratios were used to determine the
branching frequency and side chain lengths as
seen in Sample Calculation 1.4.0. To do this,
the difference of the integrations of the red box
and the blue box was found. Having normalized
the tall doublet to 1000, the difference was
divided into 1000. By using this ratio, the
branching frequency was determined. The branching frequency refers to the
Figure 1.4.0 – Regions of interest for protons that reveal branching
patterns
Sample Calculation 1.4.0 – Calculation
of branching frequency and side chain
frequency; colors correspond to
Figure 1.4.0

10
number of glucose molecules in the (1,3) backbone that must be present before
a (1,6) branching will occur. For the spectrum in Figure 1.4.0, the difference
between the red box and blue box is approximately 45; therefore, 1000 would be
divided by 45 to get a branching frequency of around 22.
Next, the side chain length was found by dividing the blue peaks’
integration by the difference, so for Figure 1.4.0 the side chain length would be
159 divided by 45, which reveals that the side chain length was around 3.5 for
this sample. This method of analysis was used for every sample. The data were
then recorded in a spreadsheet (Appendix 1.4.0.a) for easy comparison with the
various methods.
1.5 Research aims
The ultimate goal of this research was to optimize the extraction process
for (1,3/1,6)-β-glucans. The ultimate extraction process would yield pure
(1,3/1,6)-β-glucans while maintaining their native structure. In order to achieve
this, some experimental variables were tested. Chapter 2 describes these
variables which included the number of extractions with boiling ethanol, the
scalability of the method, and determining the optimal acid concentration to be
used. The structure was then investigated with the NMR to determine if more of
the native structure was retained.

11
2. Materials and Methods
2.0 Sources for solvents and materials used
S. cerevisiae was obtained from Red Star Yeast & Products and kept at
4ºC. Sodium hydroxide (NaOH) pellets from Fischer Scientific were dissolved to
the desired concentration with deionized (DI) water at 18 MΩ. Specific
concentrations desired of o-phosphoric acid (H3PO4) were prepared from an 85%
stock solution from Fischer Scientific. For the final boiling step, 200 proof ethanol
from Pharmco-AAPER was used. A Sorvall Legend RT+ with 250 mL Nalgene
PPCO bottles; later, 50 mL Thermo Scientific were used for centrifugation. For
mass measurements, an Adventurer Pro AV114 was used. A Thermo Scientific
Super Nuova Multiplace Spinning Hotplate was used for boiling and stirring
solutions and suspensions. A Thermo Scientific Orion Star A211 pH meter was
used for neutralization steps. A VirTis BenchTop Pro Freeze Dryer was used for
lyophilization of the samples. For 1H NMR, the final product was dissolved in
1 mL of deuterated dimethyl sulfoxide (DMSO-d6) from Sigma-Aldrich.
Trifluoroacetic acid from Sigma-Aldrich was also used. For the analysis with
nuclear magnetic resonance, a JEOL 400 MHz NMR was used. Delta v5.0.4
software was used for integration and comparison.
2.1 Three times boiling with 1N NaOH, 1N H3PO4, and absolute ethanol
In order to extract the glucans from the yeast samples, a method
developed by Dr. Rachel Greene was employed. Greene’s method was shaped
after what is referred to as the classical method that was developed by Hassid et
al. Section 2.1 will cover Greene’s method which will be referred to as the

12
reduced method. A brief flowchart of the steps of the method is shown in Figure
2.1.0.
The samples were dry Saccharomyces cerevisiae, commonly known as
baker’s yeast. For each set of extractions, samples were completed in sets of
four trials simultaneously. Before the samples were weighed, a 1 N solution of
sodium hydroxide, NaOH, and a 1 N solution phosphoric acid, H3PO4, were
prepared. Approximately 1 L of both the acid and base solutions were prepared
for each extraction.
In Greene’s reduced method, approximately 4 g of S. cerevisiae was
weighed and deposited into 500 mL Erlenmeyer flasks. Each of the exact weights
and were recorded and assigned a unique ID. Each of the yeast samples were
boiled, with stirring, for fifteen minutes in 200 mL of the base. The suspensions
were then removed from the hotplate and allowed to cool.
Figure 2.1.0: Flowchart of general steps involved in reduced method of glucan extraction

13
After cooling, the suspensions were transferred into labeled 200 mL
centrifuge vessels. Using a top loading balance, the vessels were weight
balanced for centrifugation. The samples were then centrifuged at 5000 rpm for
five minutes. After centrifugation, the supernatant was discarded. The pellet was
then washed, to remove any remaining NaOH residue, in approximately 200 mL
of DI. The sample was then centrifuged again. The suspensions were then
weight balanced again and centrifuged at 5000 rpm for five minutes. Afterwards,
the supernatant was discarded again. The pellet was again resuspended in 200
mL of DI.
Next, the pH of the suspensions were adjusted to between 6.9 and 7.1.
This was accomplished with dilute concentrations of NaOH and HCl (0.1 to 1 M).
When the desired pH was achieved, the suspensions were weight balanced with
DI and centrifuged, again discarding the supernatant and suspending the pellet in
DI. Lastly, the vessels were balanced and put through the centrifuge one more
time at 5000 rpm for five minutes. Again, the supernatant was discarded.
However, unlike the previous washings, this time the pellet was
suspended in the H3PO4 prepared earlier. Using a graduated cylinder, 200 mL of
the acid was used to suspend the pellet, and then each of the suspensions were
poured into clean, 500 mL Erlenmeyer flasks with a clean stirring bar. The
200 mL volume of acid was used for rinsing the centrifuge vessels to ensure
quantitative transfer. Once resuspended, the solutions were boiled for fifteen
minutes at 200 rpm and then allowed to cool.

14
The suspensions were then weight balanced in centrifuge vessels with DI
and the top loading balance. The vessels were then centrifuged at 5000 rpm for
five minutes. The supernatant was again discarded. After one centrifugation
cycle, the pellet was suspended in 200 mL of absolute ethanol in the same flasks
in which the acid boiling took place. The Erlenmeyer flasks were then covered
with cellophane and left in the hood overnight.
The ethanol suspension samples were then boiled for fifteen minutes at
200 rpm. Once the fifteen minutes had elapsed, the samples were allowed to
cool. Next the suspensions were transferred to centrifuge vessels, balanced, and
centrifuged. Unlike the previous steps, the ethanol suspension made it more
difficult for the sample to pellet out of the suspension, so the samples were
centrifuged at 7000 rpm for five minutes. The supernatant was discarded. The
pellet was then suspended in approximately 200 mL DI, balanced, and
centrifuged at 5000 rpm. Then, in the same manner as before, the suspension
was neutralized to a pH between 6.9-7.1. It was then weight balanced and
centrifuged at 5000 rpm for five minutes.
The pellet was then suspended in 200 mL of ethanol, boiled for fifteen
minutes, centrifuged, the supernatant was discarded, and it was suspended in an
additional 200 mL of ethanol. Then the same procedures for boiling and
centrifugation were followed. Next, the pellet was suspended in 200 mL DI. Then
the suspension was boiled in Erlenmeyer flasks merely to ensure the excess
ethanol was evaporated, and subsequently allowed to cool. Just as before, the
suspension was then centrifuged at 5000 rpm for five minutes. The pellet was

15
suspended again in DI, and centrifuged at 5000 rpm for a final time. Lastly, the
pellet was suspended in less than 15 mL of DI and frozen on an angle of
approximately 15° in a labeled conical vial with a lid. The angle created more
surface area, which facilitated lyophilization.
2.2 NMR Analysis
The samples were analyzed with 400 MHz 1H NMR. Initially, a dry weight
of the entire sample was taken in order to assess percent yield by mass. To get
the samples into solution for NMR, approximately 18 to 22 mg of the dried
samples were placed into small vials. To these vials was added 1 mL of
deuterated dimethyl sulfoxide (DMSO-d6) and a few drops of trifluoroacetic acid
(TFA), which moved the water peak downfield and out of the way of the peaks of
interest to ensure their resolution was optimal. Previous research has shown that
glucans are soluble in DMSO.10 Evidence of solubility was supported by a clear
solution; impurities such as residual proteins or lipids created increased pigment
in the solution.
The 1H NMR analysis was done according to the protocol designed by Dr.
Lowman.11 This was the procedure followed for all NMR collection on the glucan
samples. The NMR original protocol required the following specifications:

16
• Number of Scans: 16 (originally 64) • Acquisition Time: 3.2768 seconds • Interpulse Delay: 15 seconds (includes Acquisition Time + Relaxation
Delay) • Relaxation Delay: 15 seconds • Data Points: 32,768 • Sweep Width (X_Sweep): 25 ppm • X_Offset: 5.0 ppm • Using 90° pulses • Probe Temperature: 80°C (353 K) • Total 1D 1H collection time: • Chemical shift reference set to 2.50 ppm
Once spectral data had been collected, it was analyzed. First, the software
Delta v5.0.4 was used to correct the baseline. The software’s “Baseline
Correction (Interactive)” option was used, and various anchor points were placed
on the spectrum to adjust the baseline. Next, to ensure that the reference DMSO-
d6 peak was at exactly 2.50 ppm, the software was used to shift the reference
peak to a desired ppm.12 The peaks of interest mentioned in Chapter 1 were
integrated and values were recorded.
2.3 Alternative Method I: One ethanol boiling step
Sections 2.3-2.5 discuss alternate methods employed to the reduced
method in order to further optimize and reduce the extraction steps required.
Classical methods employed three times boiling steps for even the acid and
base, but Greene’s reduced method had showed that the additional boiling steps
were unnecessary.13 Therefore, it was reasonable that the ethanol boiling steps
could be reduced to a single boiling event with ethanol. All of the steps from Dr.
Greene’s original reduced method, Section 2.1, were followed up to the point of
the first ethanol addition. With this new, altered method, the pellet was then
suspended in ethanol and left covered overnight.

17
The next day, the procedure picked up with boiling the ethanol suspension
for fifteen minutes. The suspension was then centrifuged at 7000 rpm for five
minutes. The pellet was then suspended in DI. Next, the suspension was boiled
in DI to remove excess ethanol, then the suspension was centrifuged at
5000 rpm for five minutes in DI two more times, discarding the supernatant.
Lastly, the pellet was suspended in less than 15 mL of water and frozen on a
slant at a 15º angle for lyophilization.
2.4 Alternate Method II: Reducing overall volumes and materials
This method employed all of the steps from the reduced method (2.1) as
they were modified for Section 2.3, but it added an additional variation to
Greene’s reduced protocol. In this method, all volumes and quantities were
reduced to one-fourth of their original measurements, i.e. a 1 g yeast sample in a
125 mL Erlenmeyer flask with 50 mL of solvent for each flask, etc. Again, the
same lyophilization steps and 1H NMR techniques were used to analyze the
samples.
2.5 Alternate Method III: Titrating the acid concentration
Method III investigated the concentration of H3PO4 required to
successfully isolate β-glucan from S. cerevisiae. In order to test this, all steps of
Sections 2.1-2.4 were used, but the acid concentration of sample sets was
reduced by a factor each time, i.e. 1 N H3PO4, then 0.1 N H3PO4, then 0.01 N
H3PO4, and finally 0.001 N H3PO4. The same 1H NMR techniques were applied
to these samples.

18
2.6 Tabulated summary of methods utilized
The method conditions for each variation are tabulated in Figure 2.6.0.
The frequency of boiling steps with the base and the acid are omitted from this
table because they were unchanged at one extraction step each throughout all
trials.
Section MethodID InitialSampleSize BaseConc. AcidConc. EthanolBoilingFreq.2.1 Reduced 4g 1N 1N 3times
2.2 Alternate1 4g 1N 1N 1time
2.3 Alternate2 1g 1N 1N 1time
2.4 Alternate3 1g 0.1N
0.1N
1time0.01N
0.001N
Table 2.6.0: Tabulated summary of methods used

19
3.Results and Discussion
3.0 Recap of research questions
Through this research, there was a considerable volume of data collected
on the extraction processes of β-glucans. The ultimate goal was to obtain
β-glucans that most accurately represent the native structure of β-glucans.
Achieving this goal could provide the an effective therapeutic. Because this
research contained so many different variables in terms of numbers of
extractions, types of solutions used, and size of the samples, it was possible to
determine a more efficient extraction process for β-glucans from S. cerevisiae.
The questions that were addressed were:
1. Could the frequency of extractions with boiling ethanol be reduced
to one? (Section 2.3)
2. Could the method be scaled down while maintaining previous
results? (Section 2.4)
3. Could the acid concentration be reduced to provide further
optimization of the extraction steps involving boiling acid? (Section
2.5)
3.1 Reduction of frequency of extractions with boiling ethanol
First, one of the most major improvements from the classical method was
to reduce the number of extractions with boiling ethanol. It was previously
demonstrated that β-glucans could be successfully extracted through the
employment of three extractions with acid, base, and ethanol.6 Section 2.3 shows
the steps that were taken to reduce the number of extractions with boiling

20
ethanol. The ethanol helped to remove lipids that remained in the sample
because lipids are soluble in alcohols.14
Through the work of Asare, it was discovered that one extraction with the
chosen acid and base was sufficient to remove the undesired parts of the fungal
cell wall.13 Because of this result, the constant frequency of one extraction step
with acid and base have been omitted from all tables. Table 3.1.0 shows the
average data obtained for the reductions of ethanol extractions from 3 times to 1
time. As stated in Section 1.4, the desired result is a high average side chain
length (ASCL) and a low average branching frequency (ABF). Section 1.4 details
the derivation of the ABF and ASCL.15
The results of these data support the reduction of the ethanol boiling step
to 1 time. Peaks resulting from residual lipids in the sample would appear around
SampleIDs InitialSampleSize Ethanol Mean%Yield ABF ASCL
JE1-8-(A-D) 4g 1time 5.45% 21.2 3.54
JE1-11-(A-D) 4g 3times 4.67% 21.2 3.48
(Tho
usan
ds)
020
0.0
400.
0
X : parts per Million : 1H5.4 5.3 5.2 5.1 5.0 4.9 4.8 4.7 4.6 4.5 4.4 4.3 4.2 4.1 4.0 3.9
1.00
0k
163.
021
118.
168
JE1-8-D-2.jdf
(Tho
usan
ds)
020
0.0
400.
060
0.0
X : parts per Million : 1H5.4 5.3 5.2 5.1 5.0 4.9 4.8 4.7 4.6 4.5 4.4 4.3 4.2 4.1 4.0 3.9
1.00
0k
159.
575
114.
186
JE1-11-B-2.jdf
Figure 3.1.0 – NMR Spectra showing variation in frequencies of extractions with boiling
ethanol. The top spectrum (JE1-8-D) represents a sample where only 1 extraction step with
boiling ethanol was employed. The bottom spectrum (JE1-11-B) is a sample where three
extraction steps with boiling ethanol were used.
Table 3.1.0: Results of samples JE1-8-(A-D) and JE1-11-(A-D) are shown. The variable of this
sample set is the frequency of ethanol boiling step shown in red.

21
the 5.0 ppm region. There are two very small peaks in the extraction with only
one boiling step with ethanol at 5.0 ppm and 5.2 ppm in sample JE1-8-D in
Figure 3.1.0. This peak is small enough to be accounted for by instrumental
noise. The spectra in Figure 3.1.0 indicate that there is very little difference
between the two extraction methods.
3.2 Reduction of initial sample size of S. cerevisiae
The next step was to determine if the structure of the isolated glucan
would vary if the sample size and extraction volumes were reduced. This was a
crucial step in learning whether or not the extraction processes would be able to
be scaled up or down while yielding the same high quality glucan extract.
Because it was anticipated that the end product of this research could possibly
lead to the pharmaceutical use of β-glucans, it was necessary to determine if
these methods could be scaled effectively. By demonstrating the method could
be scaled between 1 g samples and 4 g samples, there was support for adjusting
the scale further for pharmaceutical purposes. Reducing the scale helped to
make method development much more cost efficient due to fewer supplies being
required.
Figure 3.2.0 shows that the 1 g sample (JE1-13-B) and the 4 g sample
(JE1-11-B) did not have significant variations. There was not an observable
increase in impurities between 2.9 to 4.9 ppm or a degradation of peak height or
sharpness. Therefore, reducing the extraction method had little impact on the
extracted glucan structure. This supported that scaling the method between 4 g
samples and 1 g samples had little effect on the extraction product. Because the

22
starting materials and reagent volumes were reduced to a quarter of their original
size, the 1 g method was utilized for further extractions. Table 3.2.0 displays the
results of the scale reduction.
SampleIDs InitialSampleSize Ethanol Mean%Yield ABF ASCL
JE1-13-(B-D) 1g 3times 3.73% 22.9 3.63
JE1-11-(A-D) 4g 3times 4.67% 21.2 3.48
Table 3.2.0 – Results of samples JE1-13-(B-D) and JE1-11-(A-D) are shown. The variable of this
sample set is the initial sample size. Note: Sample JE1-13-A was omitted from the averages because
some of the sample was lost due to laboratory error. As a result, no spectral data were able to be
obtained.
Table 3.2.0 displays the average results of four replicates of each set of
the smaller scale extractions. It was observed that the reduction in the extraction
scale from 4 g samples to 1 g samples not only made the process more time
efficient for method development, but it also sustained results similar to the larger
scale, typical extractions that had been performed previously. These results
support that the initial batch size does not have a significant impact on the β-
glucan extracted. In addition to having used a quarter of the initial yeast sample,
the amounts of extraction solvents were also reduced; this was helpful because it
Figure 3.2.0 - NMR Spectra showing variation in initial sample size of S. cerevisiae. The top
spectrum (JE1-13-B) represents a sample where only 1 g was utilized. The bottom spectrum (JE1-
11-B) is a sample where 4 g of S. cerevisiae were used.
(Mill
ions
)1.
0
X : parts per Million : 1H4.8 4.7 4.6 4.5 4.4 4.3 4.2 4.1 4.0 3.9 3.8 3.7 3.6 3.5 3.4 3.3 3.2 3.1 3.0 2.9 2.8
1.00
0k
164.
533
119.
680
JE1-13-B-2.jdf
(Mill
ions
)1.
0
X : parts per Million : 1H4.8 4.7 4.6 4.5 4.4 4.3 4.2 4.1 4.0 3.9 3.8 3.7 3.6 3.5 3.4 3.3 3.2 3.1 3.0 2.9 2.8
1.00
0k
159.
575
114.
186
JE1-11-B-2.jdf

23
reduced the amount of time required for boiling and cooling of the suspensions,
and it was more cost effective and better for the environment. Through several
different trials, there was good evidence that the method was capable of handling
different sized samples.
Figure 3.2.1 shows that varying both the initial sample size and the
frequency of extractions with boiling ethanol does not significantly alter the results.
Table 3.2.1 shows the average results of the combined variables of extraction
frequency with ethanol and initial sample size on the glucan product. This is
interesting because it couples two of the variations on the reduced method while
maintaining comparable glucan products. This tandem result helps to support both
variations of the extraction method. The percent yield in JE1-11-(A-D) does seem
to be slightly lower than JE1-15-(A-D). When there are more extraction steps, i.e.
JE1-11, there is going to be more sample lost because quantitatively transferring
the glucan suspension is unachievable.
Figure 3.2.1 – NMR Spectra showing both variation in initial sample size and frequency of
extractions with boiling ethanol. The top spectrum (JE1-15-D) shows an initial sample size of
1 g and only one extraction with boiling ethanol. The bottom spectrum (JE1-11-B) shows an
initial sample size of 4 g and three extractions with boiling ethanol.
(Mill
ions
)0
1.0
X : parts per Million : 1H5.7 5.6 5.5 5.4 5.3 5.2 5.1 5.0 4.9 4.8 4.7 4.6 4.5 4.4 4.3 4.2 4.1 4.0 3.9 3.8 3.7 3.6 3.5 3.4 3.3 3.2 3.1 3.0 2.9 2.8
1.00
0k
159.
197
113.
980
JE1-15-D-2.jdf
(Mill
ions
)1.
0
X : parts per Million : 1H5.7 5.6 5.5 5.4 5.3 5.2 5.1 5.0 4.9 4.8 4.7 4.6 4.5 4.4 4.3 4.2 4.1 4.0 3.9 3.8 3.7 3.6 3.5 3.4 3.3 3.2 3.1 3.0 2.9 2.8
1.00
0k
159.
575
114.
186
JE1-11-B-2.jdf
24
SampleIDs InitialSampleSize Ethanol Mean%Yield ABF ASCL
JE1-15-(A-D) 1g 1time 6.06% 22.1 3.50
JE1-11-(A-D) 4g 3times 4.67% 21.2 3.48
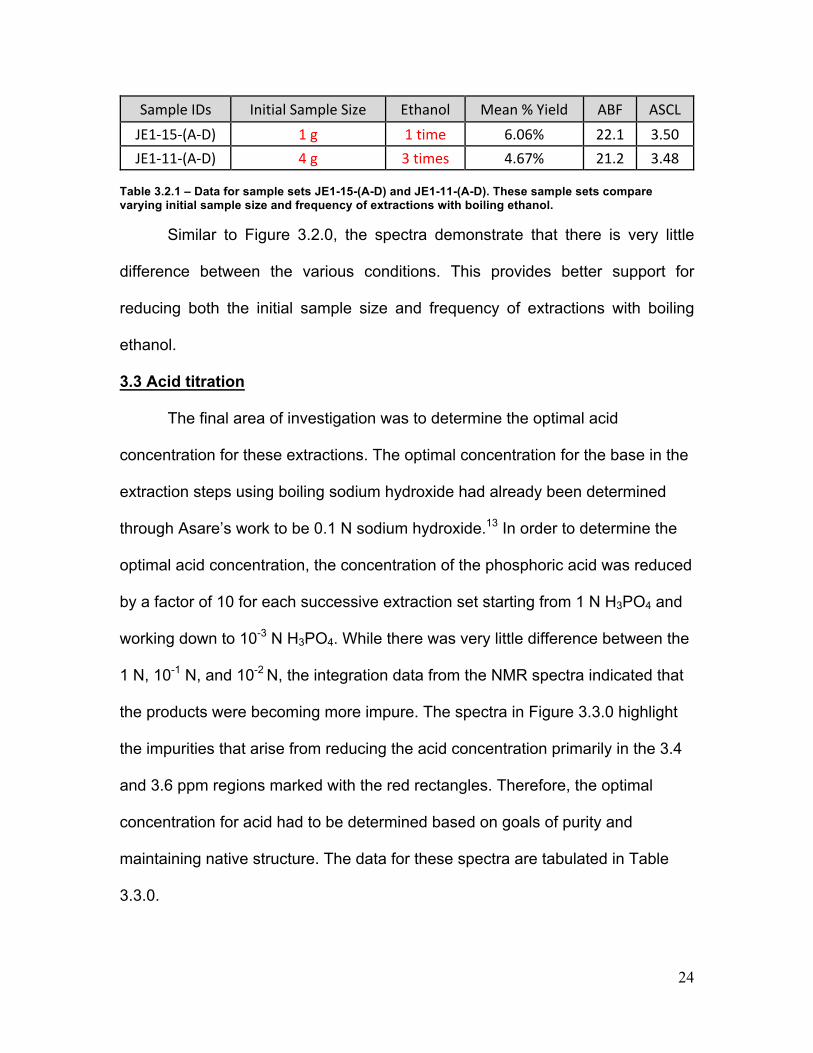
Table 3.2.1 – Data for sample sets JE1-15-(A-D) and JE1-11-(A-D). These sample sets compare
varying initial sample size and frequency of extractions with boiling ethanol.
Similar to Figure 3.2.0, the spectra demonstrate that there is very little
difference between the various conditions. This provides better support for
reducing both the initial sample size and frequency of extractions with boiling
ethanol.
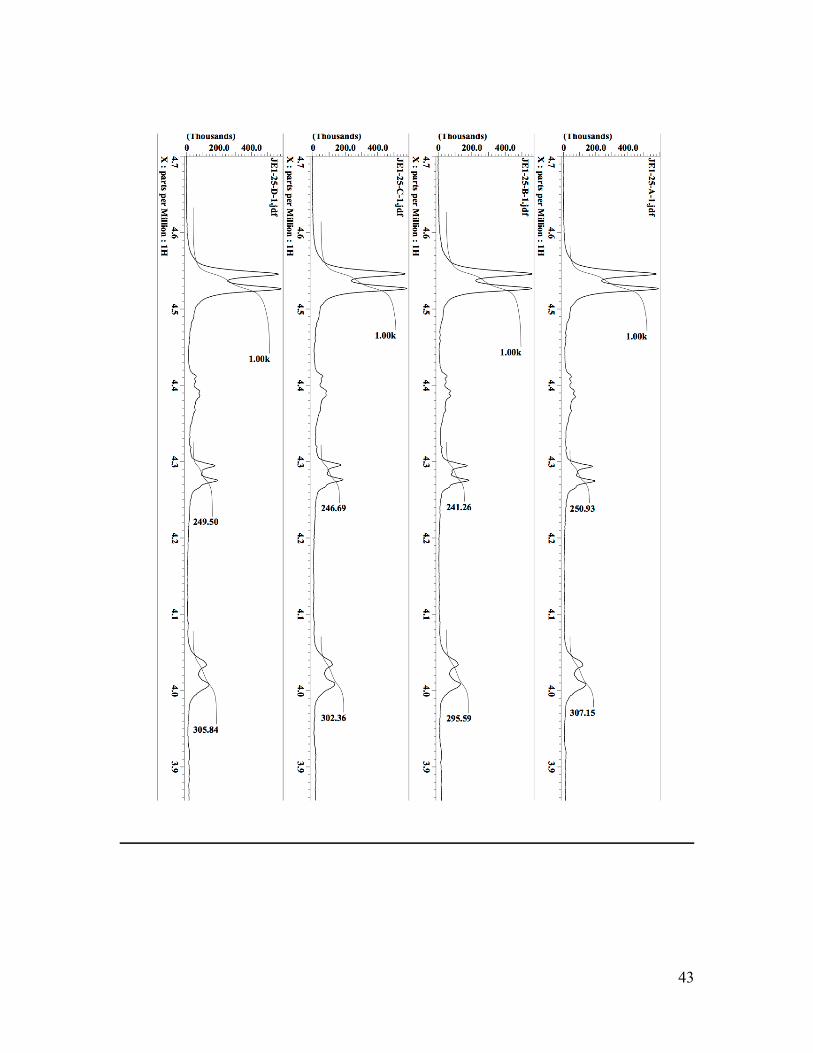
3.3 Acid titration
The final area of investigation was to determine the optimal acid
concentration for these extractions. The optimal concentration for the base in the
extraction steps using boiling sodium hydroxide had already been determined
through Asare’s work to be 0.1 N sodium hydroxide.13 In order to determine the
optimal acid concentration, the concentration of the phosphoric acid was reduced
by a factor of 10 for each successive extraction set starting from 1 N H3PO4 and
working down to 10-3 N H3PO4. While there was very little difference between the
1 N, 10-1 N, and 10-2 N, the integration data from the NMR spectra indicated that
the products were becoming more impure. The spectra in Figure 3.3.0 highlight
the impurities that arise from reducing the acid concentration primarily in the 3.4
and 3.6 ppm regions marked with the red rectangles. Therefore, the optimal
concentration for acid had to be determined based on goals of purity and
maintaining native structure. The data for these spectra are tabulated in Table
3.3.0.

25
Figure 3.3.0 – NMR Spectra showing the difference in varying acid concentration for the extractions
with areas of potentially increasing impurity in red boxes. The top spectrum (JE1-22-A) has 0.1 N for
its acid concentration. The middle spectrum (JE1-25-A) has 0.01 N for its acid concentration. The
bottom spectrum (JE1-28-A) has 0.001 N for its acid concentration.
SampleIDs AcidConc. InitialSampleSize Ethanol Mean%Yield ABF ASCL
JE1-22-(A-D) 0.1N 1g 1time 7.69% 17.6 4.70
JE1-25-(A-D) 0.01N 1g 1time 9.34% 18.0 5.44
JE1-28-(A-D) 0.001N 1g 1time 12.25% 14.6 4.76
Table 3.3.0 – Results of acid titration. Note: percent yields are by weight, so the presence of
impurities, likely in JE1-28-(A-D), would appear to be an increase in percent yield. The coloration of
the final product for JE1-28-(A-D) also lacked the characteristic off-white coloration, but instead
looked light brown.
Because these impurities are difficult to detect with a varying acid
concentration, it is difficult to determine which acid concentration is optimal. It is
suspected that some of the impurities that appear are the results of another
monosaccharide unit called mannans. Mannans possess acid-labile portions, so
it would make sense that they would be left behind under lower acidic
conditions.16 Mannans are not necessarily bad for one’s health, but because the
purpose of this extraction is to obtain pure, isolated β-glucans, this effect is

26
undesired. The change in ABF and ASCL is generally helpful in determining the
optimal conditions, but these results do not show a significant difference. It
appears that the higher concentration of phosphoric acid would be preferred in
terms of purity. Another extraction with conditions of 0.1 N NaOH and 1 N H3PO4
should be performed to compare to sample JE1-22-A (Figure 3.3.0).

27
4. Conclusions and Future Work
4.0 Conclusions
The results of this research project showed great promise towards the
optimization of the extraction of (1,3/1,6)-β-glucans. This research investigated
extraction optimization by reducing the number of steps required and testing
various acid concentration. By learning more about ways to enhance the
extraction process for (1,3/1,6)-β-glucans, the potential for this process to be
used by modern pharmaceutical companies increased greatly. This was because
the results showed great favor with regard to reduced cost and extraction time.
The first part investigated whether or not the number of extraction steps
with boiling ethanol affected the purity and sample size of the resulting β-glucan
product. Compared to the traditional method, reducing the number of steps with
boiling ethanol did not show a significant change in the purity of the final product.
Additionally, this reduction resulted in higher percent yields by mass as
compared to the starting masses. In some instances, the percent recovery of
material was almost doubled when the extraction steps with boiling ethanol were
reduced. This result is very important to be able to market this method in the
future, and will be the basis of some potential ideas for future work (see Section
4.1).
The next area investigated was the reduction of the sample size in order
to assess whether or not the extraction methods were scalable. The results
showed the initial sample mass of S. cerevisiae did not have a significant effect
on the final sample’s composition or size. This also makes the extraction process

28
more favorable for industrial purposes. Further, these results implied that the
method can be scaled and still provide desired results without sacrificing any of
the desired product’s quality.
Finally, the optimization of the acid concentration revealed interesting and
important information about its role in the extraction process. By reducing the
acid concentration in many trials, it was demonstrated that while the acid plays a
very small role in the removal of undesired fungal cell wall components, it is still
essential. There is research that shows there are acid labile portions of fungal
cell wall structures, such as mannans, which are left behind by gentler extraction
methods.17 Without being able to remove these acid labile portions, the final
product composition contained impurities. It is likely these impurities were difficult
to detect because of the similarity of composition between fungal glucans and
mannans. By reducing the acid concentration significantly, small impurities began
to arise which revealed the essential role of the extraction step that utilizes acid.
By considering each of these conditions independently, it was much easier
to determine the optimal conditions of the extraction process. Perhaps the most
beneficial result from this research is that it set the stage for future research to be
conducted on the extraction of (1,3/1,6)-β-glucans. Many of the efforts that were
made aim to make the extraction process more favorable for industrial purposes.
Luckily that also means that the process becomes easier for researchers to
conduct further optimizations. There is still much work that can be done to
improve this extraction process. Fortunately, working so intimately with this

29
extraction process revealed several avenues where this research could be
improved.
There are still areas where this extraction scheme could be improved, but
based off of this research, the best method for the extraction of
(1,3/1,6)-β-glucans was determined. First, reducing the extractions with boiling
ethanol to only one time provides not only similar results, but also allows for the
total extraction to be completed more quickly. Second, it should be noted that the
size of the initial sample does not yield any significant effects on the final
product’s purity; therefore, when improving this method, smaller batches will
allow for more progress while maintaining cost efficiency. Lastly, the optimal
concentration for the solvents is not known precisely; however, based off of
observed trends in this research, it is believed that the optimal solution
concentrations with the solvents NaOH and H3PO4 would be 0.1 N and 1 N,
respectively.
4.1 Future work
One of the first areas that needs to be addressed is the interpretation of
the results of the research. While there is good reason to believe that the results
that were obtained are precise and consistent, it is an entirely different task to
assess their accuracy. One potential way to do this would be to perform these
experiments with other forms of yeast. Another closely related yeast, such as S.
paradoxus or S. mikatae, would be a good place to start. S. paradoxus has many
similar structural features to that of S. cerevisiae. S. paradoxus is also the closest
known family member to S. cerevisiae, but has not been domesticated by

30
humans.18 Applying the extraction process that was optimized for S. cerevisiae
would reveal information about the accuracy of the results that were being
obtained. By being able to compare the yields and composition of the products
obtained from each species, greater understanding of the functionality of this
method could be gathered. This could reveal new information about ways in
which this method could be further optimized.
Additionally, there are some initial results from this research that indicate
there may be some potential for a different acid to be used for the extraction
process.19 In other trials, formic acid showed a similar result to that of phosphoric
acid, but these results have not been fully investigated. There have been studies
that have shown that formic acid is a more environmentally friendly solvent.
Furthermore, it also has a lower cost and does not leave behind phosphates.20
By utilizing an acid that showed similar promise, there is potential for greater
overall yield and possibly better removal of the acid labile portions of the fungal
cell wall. It would also be worthwhile to investigate the use of an alternative to
sodium hydroxide because most prior research has only adjusted the acid
concentration. However, the sodium hydroxide appears to be efficient. Further,
sodium hydroxide provides a good solvent due to its shelf life and ease of use.
Additionally, it is the strongest base relative to other similar bases such as
potassium hydroxide or lithium hydroxide. Other bases not that do not include
contain elements from Group 1 of the periodic table (e.g. ammonia, ethylamine)
neither exhibit the same strength in terms of basicity nor are they easy to store in
a laboratory.

31
In an attempt to further reduce the time required for this extraction
process, additional steps could be taken. For instance, each time there is a step
where an extraction is occurring by the use of boiling acid, base, or ethanol, the
time specified in the methods is set at 15 minutes. There is a possibility that for
some of these steps, if not all, the amount of time spent boiling could be reduced
two-or-three-fold. This would significantly reduce the amount of time and energy
required to extract the β-glucans. Likewise, the centrifugation steps could be
altered in their duration. This could even reveal insights into the potentials of
utilizing differential centrifugation to expedite some steps in the process.
Lastly, it would be beneficial to investigate more in-depth analyses using
other analytical methods. By utilizing GC-MS, there would be further confirmation
of the true contents of the final products that were obtained. GC-MS was utilized
for a few samples in this experimental work, but utilization of this technique would
be excellent for providing even greater insight into the native structure of the β-
glucans. By utilizing methods similar to Arthur’s, periodic checkpoints could be
performed to ensure the glucan’s native structure is being maintained.20 Through
Arthur’s work, the fractionation patterns supported that the extraction processes
were successfully isolating the β-glucans. With further research, similar analytical
methods to GC-MS should be used to further confirm the isolation of β-glucans in
the extracted product.

32
5.0 References
1. Siggers, K.A.; Lesser, C.F. The Yeast Saccharomyces cerevisiae: A Versatile
Model System for the Identification and Characterization of Bacterial
Virulence Proteins. Cell Host & Microbe, 2008, 4(1), 8-15
2. Bowman, S.M.; Free, S.J. The structure and synthesis of the fungal cell wall.
Bioessays 2006, 28(8), 799-808
3. Selitrennikoff, C.P. Antifungal Proteins. Appl Environ Microbiol. 2001, 67(7),
2883-2894
4. Daou, C.; Zhang, H. Oat Beta-Glucan: Its Role in Health Promotion and
Prevention of Diseases. Comprehensive Reviews in Food Science and
Food Safety 2012, 11(4), 355-365
5. Ganeshpurkar, A.; Rai, G.; Jain, A.P. Medicinal mushrooms: Towards a new
horizon. Pharmacogn Rev 2010, 4(8), 127-135
6. Hassid, W. Z., Joslyn, M. A., & McCready, R. M. Molecular constitution of an
insoluble polysaccharide from yeast Saccharomyces cerevisiae. Journal of
the American Chemical Society 1941, 63, 295–298
7. Schiavone M, Vax A, Formosa C, Martin-Yken H, Dague E, François JM. A
combined chemical and enzymatic method to determine quantitatively the
polysaccharide components in the cell wall of yeasts. FEMS Yeast Res.
2014, 14, 933–947
8. Lowman, D.W.; Greene, R.R.; Bearden, D.W.; Kruppa, M.D.; Pottier, M.;
Monteiro, M.A.; Soldatov, D.V.; Ensley, H.E.; Cheng, S.C.; Netea, M.G.;
Williams, D.L. Novel structural features in Candida albicans hyphal glucan

33
provide a basis for differential innate immune regonition of hyphae versus
yeast. J Biol Chem 2014, 289(6), 3432-43
9. Ensley, H.E.; Tobias, B.; Pretus, H.A.; McNamee, R.B.; Jones, E.L.; Browder,
I.W.; Williams, D.L. NMR spectral analysis of a water-insoluble (1→3)-β-D-
glucan isolated from Saccharomyces cerevisiae. Carbohydrate Research
1994, 258, 307-311
10. Du, L.; Zhang, X.; Wang, C.; Xiao, D. Preparation of Water Soluble Yeast
Glucan by Four Kinds of Solubilizing Processes. Engineering 2012, 5,
184-88
11. Lowman, D.W.; Ferguson, D.A.; Williams, D.L. Structural characterization of
(1→3)-β-D-glucans isolated from blastospore and hyphal forms of
Candida albicans. Carbohydrate Research 2003, 338(14), 1491-96
12. Cambridge Isotope Laboratories, Inc. NMR Solvent Data Chart: More
Solvents, More Sizes, More Solutions.
http://www2.chem.umd.edu/nmr/reference/isotope_solvent.pdf (accessed
Feb 9, 2015).
13. Asare, Shardrack O.; Optimized Acid/Base Extraction and Structural
Characterization of β-glucan from Saccharomyces Cerevisiae (2015).
Electronic Theses and Dissertations. Paper 2513.
http://dc.etsu.edu/etd/2513
14. Ingólfsson, H.I.; Andersen, O.S. Alcohol’s Effects on Lipid Bilayer Properties.
Biophys J 2011, 10(14), 847-855

34
15. Lowman, D. W.; West, L. J.; Bearden, D. W.; Wempe, M. F.; Power, T. D.;
Ensley, H. E.; Haynes, K.; Williams, D. L.; Kruppa, M. D., New insights
into the structure of (1→3, 1→6)-β-D-Glucan side chains in the Candida
glabrata cell wall. PLoS ONE 2011, 6 (11), e27614.
16. Masuoka, J.; Hazen, K.C. Differences in the acid-labile component of
Candida albicans manna from hydrophobic and hydrophilic yeast cells.
Glycobiology 1999, 9(11), 1281-6
17. Kwofie, F. Candida albicans Hyphal Mannan is Structurally Distinct from
Yeast Mannan (2015). Electronic Theses and Dissertations. Paper 2555.
http://dc.etsu.edu/etd/2555
18. Sniegowski, P.D.; Dombrowski, P.G.; Fingerman, E. Saccharomyces
cerevisiae and Saccharomyces paradoxus coexist in a natural woodland
site in North America and display different levels of reproductive isolation
from European conspecifics. FEMS Yeast Res. 2002, 1(4), 299-306
19. Freimund, S.; Sauter, M.; Käppeli, O.; Dutler, H. A new non-degrading
isolation process for 1,3-β-D-glucan of high purity from baker’s yeast
Saccharomyces cerevisiae. Carbohydrate Polymers 2003, 53, 159-171
20. Poll, D.J.; Harding, D.R. Formic acid as a milder alternative to trifluoroacetic
acid and phosphoric acid in two-dimensional peptide mapping. J
Chromatogr. 1989, 469, 231-9
21. Arthur, C. Linkage Analysis and Compositional Studies of β-Glucan from
Saccharomyces cerevisiae and Compositional Studies of Mannan from

35
Candida albicans" (2015). Electronic Theses and Dissertations. Paper
2537. http://dc.etsu.edu/etd/2537

36
6.0 Acknowledgments
I would like to thank a few of the people who have helped me throughout
this process. My friends and family have been an amazing encouragement
throughout these past few years. There’s no way that I would have been able to
make it through without their love and support. Specifically, I’d like to thank
Kaitlyn Mathis for being an unofficial reader and letting me know when my words
were less than eloquent. I’d also like to thank some of the faculty who have
helped to make me a better writer and researcher. Namely, Dr. Cassandra Eagle,
Dr. Rachel Greene, Dr. Douglas Lowman, Dr. Hilary Malatino, and Dr. Rebecca
Pyles have all be integral in the writing process. Lastly, I’d like to thank the
Honors College at East Tennessee State University, the ETSU Chemistry
Department faculty and students, the ETSU Start Up Grant funding, and the
Honors College Undergraduate Research Fellowship for allowing me to work on
this research over the summer. Thank you again, everyone.

37
7.0 Appendix
7.1 Cited Appendix
Appendix 1.4.0.a
Note: Sample JE1-13-A: First 1 g sample: The wrong size centrifuge flasks likely responsible for
some sample loss. Sample A had too low of a yield for NMR. Average % Yield for this set calculated
only from samples B-D.
FINISHDATE SAMPLEID BASE NORMALITY ACID NORMALITY ETHANOL INITIALSAMPLESIZE6/4/14 1*NaOH 1 1*H3PO4 1 1time 4g6/6/14 1*NaOH 1 1*H3PO4 1 3times 4g6/11/14 JE1-6-(A-D) 1*NaOH 1 1*HCl 1 1time 4g6/13/14 JE1-8-(A-D) 1*NaOH 1 1*H3PO4 1 1time 4g6/18/14 JE1-11-(A-D) 1*NaOH 1 1*H3PO4 1 3times 4g6/25/14 JE1-13-(A-D) 1*NaOH 1 1*H3PO4 1 3times 1g7/2/14 JE1-15-(A-D) 1*NaOH 1 1*H3PO4 1 1time 1g7/25/14 JE1-20-(A-D) 1*NaOH 0.01 1*H3PO4 0.01 3times 4g7/28/14 JE1-22-(A-D) 1*NaOH 0.1 1*H3PO4 0.1 1time 1g8/5/14 JE1-25-(A-D) 1*NaOH 0.1 1*H3PO4 0.01 1time 1g8/12/14 JE1-28-(A-D) 1*NaOH 0.1 1*H3PO4 0.001 1time 1g
SAMPLEID Avg.%Yield NMRRUNDATEA B C D A-D
JE1-6-(A-D) 3.073% 3.227% 3.163% 2.901% 3.091% N/AJE1-8-(A-D) 5.817% 5.432% 4.907% 5.627% 5.446% 7/15/14JE1-11-(A-D) 3.908% 5.106% 4.845% 4.807% 4.667% 7/22/14JE1-13-(A-D) 1.174% 3.391% 3.726% 4.072% 3.091% 7/16/14JE1-15-(A-D) 6.345% 5.869% 5.938% 6.086% 6.060% 7/18/14JE1-20-(A-D) 40.251% 40.838% 41.799% 38.416% 40.251% N/AJE1-22-(A-D) 7.497% 7.473% 7.712% 8.095% 7.694% 9/20/14JE1-25-(A-D) 9.284% 9.354% 9.493% 9.604% 9.434% 9/20/14JE1-28-(A-D) 12.653% 12.392% 12.376% 11.560% 12.245% 9/20/14
%Yield

38
7.2 Spectra for all samples
Data sets are labeled at top left (upright) of each spectrum for all samples.

39

40

41

42
43

44