underpriced default spread exacerbates market crashes · pdf fileunderpriced default spread...
TRANSCRIPT

ANY OPINIONS EXPRESSED ARE THOSE OF THE AUTHOR(S) AND NOT NECESSARILY THOSE OF THE SCHOOL OF ECONOMICS & SOCIAL SCIENCES, SMU
Underpriced Default Spread Exacerbates Market Crashes
Winston T H Koh, Roberto S. Mariano, Andrey Pavlov, Sock Yong Phang, Augustine H H Tan, Susan M. Wachter
May 2006
Paper No. 12-2006
SSSMMMUUU EEECCCOOONNNOOOMMMIIICCCSSS &&& SSSTTTAAATTTIIISSSTTTIIICCCSSS WWWOOORRRKKKIIINNNGGG PPPAAAPPPEEERRR SSSEEERRRIIIEEESSS

Underpriced Default Spread Exacerbates Market Crashes*
Winston T.H. Koha,
Roberto S. Marianoa,
Andrey Pavlovb +,
Sock Yong Phanga,
Augustine H. H. Tana
Susan M. Wachterc
March 9, 2006
Keywords: real estate bubble, lender optimism, disaster myopia, Asian financial crisis
* Research support from the Wharton-SMU Research Centre, Singapore Management University, and the Social Sciences and Humanities Research Council of Canada grant #410-2003-0901 is gratefully acknowledged. + Corresponding author. a School of Economics and Social Sciences, Singapore Management University, 469 Bukit Timah Road, Singapore 256976. Contact details: +65 68220853, [email protected] (Winston TH Koh); +65 68220888, [email protected] (Roberto S Mariano); +65 68220368, [email protected] (SY Phang); +65 68220379, [email protected] (Augustine HH Tan). b Faculty of Business Administration, Simon Fraser University, 8888 University Dr., Burnaby, BC V5A 1S6, Canada. Tel: 604 291 5835; E-mail: [email protected] c Department of Finance, The Wharton School, University of Pennsylvania, 2300 Steinberg-Dietrich Hall, Philadelphia, PA 19104, USA. Tel: 215 8986355; Email: [email protected]

Abstract
In this paper, we develop a specific observable symptom of a banking system that
underprices the default spread in non-recourse asset-backed lending. Using three different
data sets for 18 countries and property types, we find that, following a negative demand
shock, the “underpricing” economies experience far deeper asset market crashes than
economies in which the put option is correctly priced. Furthermore, only one of the
countries in our sample continues to exhibit the underpricing symptom following a market
crash. This indicates that market crashes have a cleansing effect and eliminate
underpricing at least for a period of time. This makes investing in such markets safer
following a negative demand shock.
Keywords: real estate bubble, lender optimism, disaster myopia, Asian financial crisis
2

1. Introduction
All non-recourse asset-backed mortgage loans contain a put option that allows the
borrower, through default, to “sell” the asset to the lender for the outstanding mortgage
balance. The default spread compensates the lender for this put option. If correctly priced,
the imbedded put option has no impact on asset markets. If, however, the put is
underpriced, efficient asset markets incorporate this mistake into the transaction price of the
asset. This leads to inflated asset prices above their fundamental level.1
Our contribution is twofold. First, utilizing the theory of Pavlov and Wachter
(2002, 2005), we develop a specific and observable symptom of underpricing in the
economy (discussed in Section 2). Second, using data from 18 countries and property
types, we empirically find that, following a negative demand shock, markets which exhibit
the symptom of underpricing tend to experience far deeper market crashes than markets
that do not exhibit the symptom.
Following a negative demand shock, the asset prices in an economy which
experiences underpricing have to fall far enough not only to reflect the new supply and
demand conditions but also to eliminate the prior price inflation.2 Therefore, economies
that experience underpricing, while not necessarily subject to a higher risk of market
crashes, are subject to deeper crashes when they occur.
Furthermore, only one of the countries in our sample continues to exhibit the
underpricing symptom after its respective market crash. This suggests that underpricing is 1 See Allen and Gale (1998 and 1999) and Pavlov and Wachter (2002, 2005) for models that show how underpricing of the put option leads to inflated asset prices. 2 See Pavlov and Wachter (2002, 2005) for models that show how underpricing of the put option can exacerbate asset market crashes.
3

typically eliminated following a negative demand shock. Therefore, investing is safer
following large negative demand shocks as the risk of inflated asset prices is greatly
reduced. Of course, given enough time and absent institutional changes, some of these
economies may switch back to underpricing. This, in turn, would exacerbate any
subsequent market crashes.
Our study is distinct from the literature which estimates the fundamental price of an
asset directly and detects asset price inflation by comparing the estimated to the observed
price.3 While this approach is very intuitive, it ultimately suffers from an inability to
distinguish between asset price bubbles and inappropriate models of the fundamental price.
Other studies have focused selectively on macroeconomic ratios such as income to
mortgage payment or income to price ratios.4 Yet another branch of this literature
investigates local demand and supply conditions and potential for further development and
metropolitan area limitations. Such models are always vulnerable to the criticism that they
are lacking fundamental features of the market that are efficiently contributing to price
rises.
In addition to finding support for our theory, our findings give policy makers and
market participants a measurable symptom of underpricing. If such underpricing is
suspected, policy makers and regulators can take steps to eliminate it or at least contain its
market-wide impact. More importantly, both lenders and market participants can take
measures to prepare for or hedge the expected increased magnitude of any future price
3 See for instance Smith, Smith, and Thompson (2005) for a direct estimation of real estate values in Los Angeles. Other studies of the fundamental real estate values include Case and Shiller (2003), Krainer and Wei (2004), Krugman (2005), Leamer (2002), McCarthy and Peach (2004), and Shiller (2005), among others. 4 Examples include Edelstein (2005) and Edelstein, Dokko, Lacayo, and Lee (1999).
4

declines should a negative demand shock occur. Indeed while underpriced lending may not
initiate unsustainable “asset bubbles” thereby causing market crashes, the underpricing of
risk makes these crashes worse. Moreover, Herring and Wachter (1999) demonstrate that
price rises, even if efficient, may set off underpricing episodes. Moreover, inefficient over
pricing of assets is unlikely to be sustainable without supportive lending policies.
We proceed as follows. Section 2 develops the symptom of underpricing and
formulates the testable empirical implication discussed above. Section 3 describes the data,
presents our main results, and provides robustness analysis utilizing various controls and
econometric tests. Section 4 examines in detail some of the markets we include in our
empirical tests and provides an in-depth review of the economic conditions in each market
that led to its respective asset price increase and crash. Section 5 concludes with policy
implications and direction for future research.
2. The Symptom of Underpricing
There are two reasons for the lending spread, i.e. the value of the imbedded put
option, to fall. First, the default spread can narrow because the asset price volatility falls,
which, in turn, reduces the value of the put option. This is a rational reason to reduce the
lending spread and has no impact on asset prices. Note that a change in the volatility of the
asset has little or no impact on the asset price because investors are diversified.
The second reason lending spreads narrow is that lenders underprice the default
risk. This increases the asset prices because rational investors take advantage of the
underpriced non-recourse lending even if they are fully diversified.
5

The transaction price of an asset financed through a non-recourse loan is the
composite of the fundamental value of the asset, V, the value of the mortgage loan, M, and
the face value of the adjustable-rate mortgage loan:
( ) ( , ( ))P V M s Bσ σ σ= − + , (1)
where σ denotes the expected future volatility of the asset and s denotes the spread of
lending over deposit rates. This spread compensates the lender for the put option imbedded
in the non-recourse mortgage. If the mortgage is priced correctly, its market value equals
its face value, and the transaction price equals the fundamental value of the asset. If the
lending spread, s, changes in response to σ,
0
0
s
P V M M s Vs
σ
σ σ σ σ σ
∂>
∂∂ ∂ ∂ ∂ ∂ ∂
= − − = ≈∂ ∂ ∂ ∂ ∂ ∂
(2)
Since the spread adjusts to compensate the lender for the changes in the value of the
put option imbedded in the mortgage loan, 0M M ssσ σ
∂ ∂ ∂+ =
∂ ∂ ∂. If the change in volatility of
the asset is fully diversifiable, then 0Vσ∂
=∂
. If the increase in volatility affects the
covariance of the asset return with the market, then 0Vσ∂
<∂
, but still relatively small.
The response of the asset price to the spread is:
6

0
P VP
s ssσ σ
σ σ
∂ ∂∂ ∂ ∂= =∂ ∂∂
≈
∂ ∂
(3)
Therefore, the correlation between transaction prices and lending spread is zero if
the increase in asset volatility is fully diversifiable, and close to zero if it affects the
covariance between the asset and the overall market.
If, on the other hand, the spread changes because of underpricing, not in response to
changes in expected future asset volatility, the response of the price to the spread is very
different:
0, 0, 0s V Ms sσ
∂ ∂ ∂= =
∂ ∂ ∂> , (4)
therefore,
0P V M Ms s s s
∂ ∂ ∂ ∂= − = − <
∂ ∂ ∂ ∂. (5)
Thus, the correlation between asset prices and lending spread is negative and driven
by the sensitivity of the value of the mortgage to the lending spread, which is substantial.
The above differential impact of default spread on asset prices produces the
following symptom of underpricing:
Underpricing of the default risk in non-recourse lending produces a negative
correlation between asset returns and changes in the default spread. Correctly
7

pricing the default risk in non-recourse lending produces no correlation between
asset returns and changes in the default spread.
Following an asset market negative demand shock, “underpricing” economies
experience deeper market crashes because the new asset price not only reflects the new
supply and demand conditions, but also eliminates the price inflation due to underpricing.
This leads to the following empirical implication:
Countries that experience underpricing (i.e., have a negative correlation between
asset returns and changes in the default spread), experience larger market crashes
following negative demand shocks.
Therefore, narrowing of the lending spread is not sufficient evidence of
underpricing or asset price inflation. Instead, we need to observe a negative correlation
between the landing spread and asset prices to suspect underpricing. Moreover to
determine whether the phenomenon of underpricing is contributing to higher asset prices
we need to observe a positive relationship, all else equal, between the correlation and asset
price rises. While theoretically appealing, this approach does limit the practical
applicability of our symptom as a tool to detect and combat underpricing. Estimating the
correlation requires a number of observations and introduces a substantial time lag between
the start of underpricing and its detection. Nonetheless, a measurable symptom is useful for
countries and markets that track and report lending activity and asset prices in a timely
fashion. Absent the symptom we propose here, even these markets may not be able to
detect underpricing before a market crash occurs. Thus we develop and implement a test
for whether underpricing contributes to asset price inflation based on the statistically
8

significant joint presence of price rises and a negative correlation of the narrowing of the
lending spread with asset price rises across countries, using an international database of
property returns. Furthermore, we test the sequential presence of negative correlation and
large price declines following a negative demand shock. Finally, we test the absence of
negative correlation in all markets following a negative demand shock.
3. Empirical Support
To test the above theoretical predictions we need, at the minimum, property return
data and the spread of lending over deposit rates for a number of countries and property
types. Lending and deposit rates are readily available from the World Bank. Reliable
property data with deep history is rare, however. In this paper we use three distinct real
estate property data sets, two international and one from a particular U.S. market. While
each of the data sets has its own advantages and shortfalls, taken together our empirical
findings paint a picture which is strongly consistent the theoretical predictions above.
3.1 Global Property Research Indices
The largest of our three data sets is the Global Property Research Indices (GPR)
compiled by Eichholtz, et. al. (1998) and refined and extended by Dr. Christopher Shun,
Menang Corporation, Malaysia. This data includes property indices for 25 countries over
20 and 12 years for developed and emerging countries, respectively. The GPR 250 Global
Property Stocks index only includes property companies with a minimum of USD $50mn
of freely available market value and high liquidity in terms of average last-year stock
trading volume. As of December 2002, the securities included in the GPR 250 index had a
combined available market value of USD$194 bn.
9

This data set has a number of advantages. In particular, it has the deepest history
and the largest cross-sectional span across the globe of any real estate property database.
Since the returns are based on publicly traded and liquid securities, the data quality is high,
available at a monthly frequency, and is consistent through time. The only drawback of
this data is that it provides the returns of publicly traded securities rather then the actual
returns to direct real estate investment. As noted by Eichholtz, et. al. (1998) and by Chun
(2002), the real estate investment trust returns used to construct the GPR indices are subject
to stock market flow of funds effects and do not always follow the returns to direct real
estate investment. Nonetheless, our theoretical model is valid for both public and private
real estate investments, and the use of REIT return data provides for a legitimate test of the
theoretical predictions.
The most direct test of the theoretical model described above is a negative
relationship between the correlation of the change in lending spread and asset returns
before the crash and the total price decline during the crash for each market. Figure 1
depicts a scatter plot of all observations with enough history to compute the correlation
before the respective market crash. The horizontal axis depicts the correlation between
asset returns, including dividends, and the change in lending over deposit rate spread before
the respective market crash. Since market crashes occurred during different periods in each
country, this correlation is computed over different time intervals. We use data going as far
back in time as possible up to the peak of the respective real estate market. The vertical
axis contains the percent decline, from top to bottom, during the most recent market crash
for each country. In some cases this decline spanned only a few months, while for others it
10
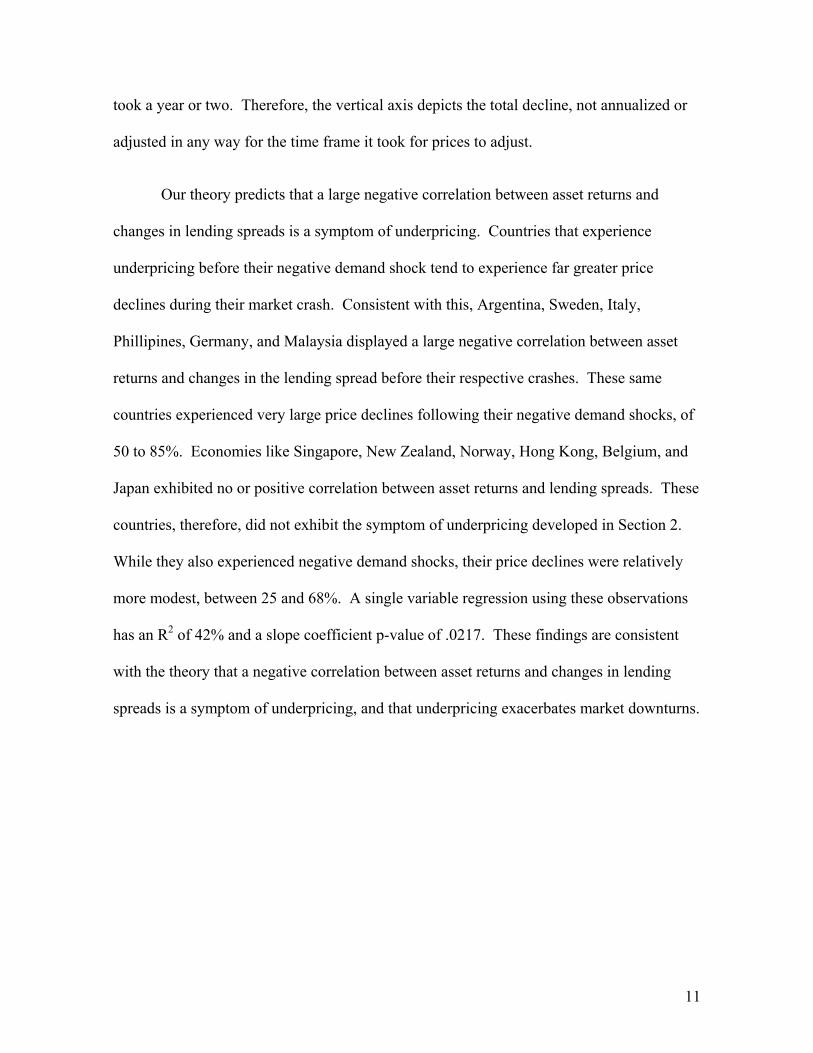
took a year or two. Therefore, the vertical axis depicts the total decline, not annualized or
adjusted in any way for the time frame it took for prices to adjust.
Our theory predicts that a large negative correlation between asset returns and
changes in lending spreads is a symptom of underpricing. Countries that experience
underpricing before their negative demand shock tend to experience far greater price
declines during their market crash. Consistent with this, Argentina, Sweden, Italy,
Phillipines, Germany, and Malaysia displayed a large negative correlation between asset
returns and changes in the lending spread before their respective crashes. These same
countries experienced very large price declines following their negative demand shocks, of
50 to 85%. Economies like Singapore, New Zealand, Norway, Hong Kong, Belgium, and
Japan exhibited no or positive correlation between asset returns and lending spreads. These
countries, therefore, did not exhibit the symptom of underpricing developed in Section 2.
While they also experienced negative demand shocks, their price declines were relatively
more modest, between 25 and 68%. A single variable regression using these observations
has an R2 of 42% and a slope coefficient p-value of .0217. These findings are consistent
with the theory that a negative correlation between asset returns and changes in lending
spreads is a symptom of underpricing, and that underpricing exacerbates market downturns.
11

Figure 1: Symptom of Underpricing Vs. Total Market Crash Decline
Negative Correlation = Underpricing
0
0.1
0.2
0.3
0.4
0.5
0.6
0.7
0.8
0.9
-1.2 -1 -0.8 -0.6 -0.4 -0.2 0 0.2 0.4 0.6 0.8
Correlation(before the crash)
%de
clin
e
JapanArgentina
SwedenPhillpine
Italy
Germany
Malaysi
Singapore
Hongkong
New Zealand
Belgium
Norway
R2 of the regression line is 42% and the regression coefficient has p-value 0.0217. The correlation is computed between the total index return, including dividends, and the change in the spread of lending over deposit rates. In this figure, we compute the correlation using data before the crash, i.e., from the beginning of our data set to the peak of the property market. The vertical axis depicts the total percent decline in the property market, from top to bottom. This is over one or more years and is specific for each country. According to our theory, negative correlation is a symptom of underpricing, and is associated with larger losses during a market downturn. Countries that do not exhibit the symptom of underpricing have zero or positive correlation, and their respective property market declines are relatively modest.
12

As a robustness check, we repeat the above analysis except using all available data,
before, during, and after the crash, for each country, to compute the correlation between
asset returns and changes in the lending spread. This approach allows us to include more
observations in the analysis, but has the major drawback that lending spreads may have
increased in response to the market crash. Following a negative demand shock, the
perceived or actual risk of the asset markets typically increases. Thus, the lending spread
increases, rationally or not, following a negative demand shock irrespective of the
underpricing behavior of lenders before the crash. However, since low asset prices
(following the crash) are associated with high lending spreads (following the crash), the
correlation between asset returns and changes in the lending spreads may appear negative
even in the absence of underpricing. In other words, our theoretical implication will hold
even in the absence of underpricing and using all data is not a direct test of our hypothesis.
Nonetheless, we include it in Figure 2 as a form of robustness check.
13
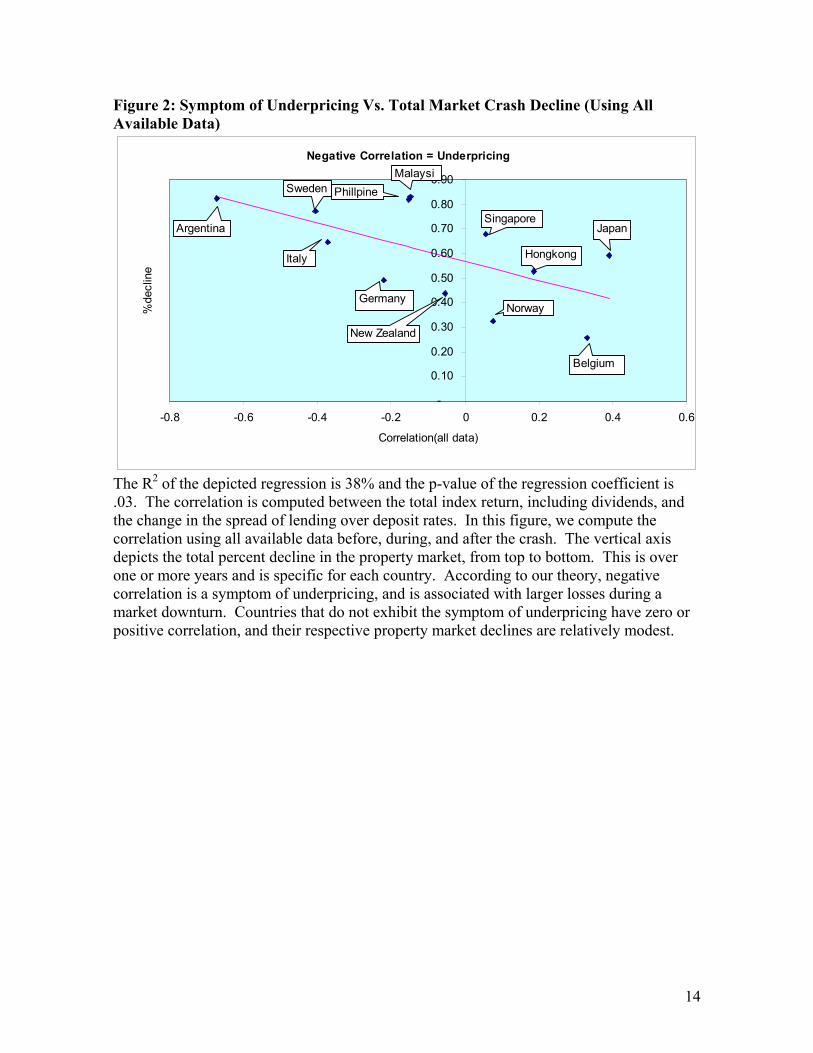
Figure 2: Symptom of Underpricing Vs. Total Market Crash Decline (Using All Available Data)
Negative Correlation = Underpricing
-
0.10
0.20
0.30
0.40
0.50
0.60
0.70
0.80
0.90
-0.8 -0.6 -0.4 -0.2 0 0.2 0.4 0.6
Correlation(all data)
%de
clin
e
Argentina
Belgium
Germany
HongkongItaly
Japan
Malaysi
New Zealand
Norway
PhillpineSweden
Singapore
The R2 of the depicted regression is 38% and the p-value of the regression coefficient is .03. The correlation is computed between the total index return, including dividends, and the change in the spread of lending over deposit rates. In this figure, we compute the correlation using all available data before, during, and after the crash. The vertical axis depicts the total percent decline in the property market, from top to bottom. This is over one or more years and is specific for each country. According to our theory, negative correlation is a symptom of underpricing, and is associated with larger losses during a market downturn. Countries that do not exhibit the symptom of underpricing have zero or positive correlation, and their respective property market declines are relatively modest.
14
Pavlov and Wachter (2002, 2005) suggest that underpricing is eliminated, at least
for a period of time, following a negative demand shock. Our data presents an opportunity
to test this prediction as well. In particular, we compute our symptom of underpricing, i.e.,
the correlation between asset returns and changes in the lending spread, following the
negative demand shock in each country. While we only have six observations with enough
data to compute a meaningful correlation, our finding is consistent with the Pavlov-
Wachter prediction. Following the negative demand shock, there is no relationship
between the correlation of asset returns and changes in the lending spread and the
magnitude of the previous crash. Furthermore, only one country, Italy, continues to exhibit
a negative correlation between asset returns and changes in the lending spread. This
suggests that in most cases negative demand shocks have a cleansing effect and eliminate
underpricing in the economy, at least for a period of time.
15

Figure 3: Symptom of Underpricing Vs. Total Market Crash Decline (Using Data After the Crash)
Negative Correlation= underpricing
0
0.2
0.4
0.6
0.8
1
1.2
-0.8 -0.6 -0.4 -0.2 0 0.2 0.4 0.6 0.8
Correlation(After the crash)
%decline
Malaysia
Indonesia
ItalyHongkong
Japan
Singapore
The R2 of this regression is nearly zero and the slope coefficient is not significant. The correlation is computed between the total index return, including dividends, and the change in the spread of lending over deposit rates. In this figure, we compute the correlation using data after the crash. The vertical axis depicts the total percent decline in the property market, from top to bottom. This is over one or more years and is specific for each country. According to our theory, negative correlation is a symptom of underpricing, and is associated with larger losses during a market downturn. Countries that do not exhibit the symptom of underpricing have zero or positive correlation. Only one country, Italy, continues to exhibit the symptom of underpricing following its market crash. Furthermore, we find no relationship between the correlation between asset returns and changes in lending spreads and the size of the decline.
16
3.2 Appraisal-based indices
The above analysis is based entirely on publicly traded Real Estate Investment
Trusts (REITs) to construct the property price indices across countries. While this
approach has the advantages of timely, accurate, high-frequency, and market-based data, it
is vulnerable to any deviations of publicly traded REIT returns from the returns to direct
real estate investment. To mitigate this potential deficiency, we repeat the above analysis
using the Investment Property Databank (IPD).5 This data uses annually appraised values
for various types of commercial real estate to construct country and property type indices.
Since this data contains only enough history to compute the correlation between
asset returns and changes in the lending spread for only three countries, we use all available
data, before, during, and after the crash to compute these correlations. As noted above, this
analysis suffers from the caveat that lending spreads may have increased in response to the
market crash and independent of our theory. Nonetheless, the similarity between figures 1
and 2 above suggests that high negative correlation, even if computed over the entire
sample period, is consistent with underpricing.
Figure 4 depicts the correlation between asset returns and changes in lending over
deposit rate spreads versus the percent decline, top to bottom, during the respective market
crash for each country. The correlation is computed using all available data. Consistent
with our analysis above using publicly traded REIT returns, countries and markets, such as
Thailand and France – office, exhibit the symptom of underpricing and also experienced
very severe price declines. On the other hand, countries and markets like Hong Kong,
5 7 Greenland Place, London, NW1 0AP, United Kingdom.
17

Singapore, and Canada – residential, did not exhibit the symptom of underpricing and
experienced more modest price declines during their respective negative demand shocks.
Figure 4: Symptom of Underpricing Vs. Total Market Crash Decline (Using Appraisal-based data)
Symptoms and Effects of Underpricing
0
10
20
30
40
50
60
70
80
90
100
-1.0 -0.8 -0.6 -0.4 -0.2 0.0 0.2 0.4 0.6 0.8
Correlation
decl
ine%
Thailand
France-officeUK-office
Hong KongSingapore
Canada-res
The R2 of this regression is 50% and the slope coefficient is strongly significant. The correlation is computed between the total property return, including dividends, and the change in the spread of lending over deposit rates. In this figure, we compute the correlation using all available data. The vertical axis depicts the total percent decline in the property market, from top to bottom. This is over one or more years and is specific for each country. According to our theory, negative correlation is a symptom of underpricing, and is associated with larger losses during a market downturn. Countries that do not exhibit the symptom of underpricing have zero or positive correlation.
18

3.3 Transaction-based indices
The most appropriate data for verification of our hypothesis is real estate price
indices based on transaction data. Unfortunately, the availability of such data across
countries is extremely limited. Therefore, in what follows, we focus on one particular
market for which we have rare and very high quality transaction data. In particular, we use
transaction data for apartment buildings in the Los Angeles Metropolitan Area from CoStar
COMPS. The firm produces high quality transactions data for a wide range of income
producing properties. The firm has provided data for all transactions in Los Angeles
County apartment buildings that occurred between January 1989 and July 2001 for a total
of 18,168 observations.6 Table 1 provides summary statistics describing the transactions
that occurred during the period. The mean and median per unit price during this period
were a little more than $50,000 per unit. As can be seen from the table the typical LA
County apartment complex is relatively small and the distribution of complex size is
positively skewed, with a median of 10 and a mean of 17 units.
6 The transaction data were screened for outliers and influential observations.
19

Table 1: Descriptive statistics for transactions 1/1988-9/2000.
Price per unit
Cap Rate Age Parking Spaces
Number of Units
Mean $56,896 .09 29 21 17
Median $52,500 .09 32 12 10
Standard Deviation
$28,076 .03 20 31 20
To calculate the value of an apartment building we estimate the time series of rates
of appreciation of the per unit price of LA County apartments. We use the following semi-
log hedonic value model to estimate this series:
ln(Valueit ) = Constant + b∑=
T
t 2t St + a’Ci, + e (6)
where Valueit is the price paid for property i sold at time t, Ci is a vector of physical
characteristics that describe the building, St is a matrix of indicator variables for the time of
sale, and bt is the marginal time effect ( i.e., monthly). T is the total number of months in
the sample and e is an error term with zero expectation.7 Thus bt is an estimate of the rate
of appreciation for time period t. The mean of the vector b provides an estimate of the
expected monthly rate of apartment appreciation.
Tables 2 and 3 report the parameter estimates and implied appreciation rates
obtained by estimating Equation (6). The parameter estimates presented in Table 2 have
7 The bt are estimated as follows. If a transaction occurred during January 1989 (i.e., t=1), all time indicator variables are assigned a value of zero. If a transaction occurred during the second month, the first time indicator variable is assigned a value of one and all other time indicator variables are set to zero. If a transaction occurred during the third month, the first two indicators are set to one and all others are set to zero.
20
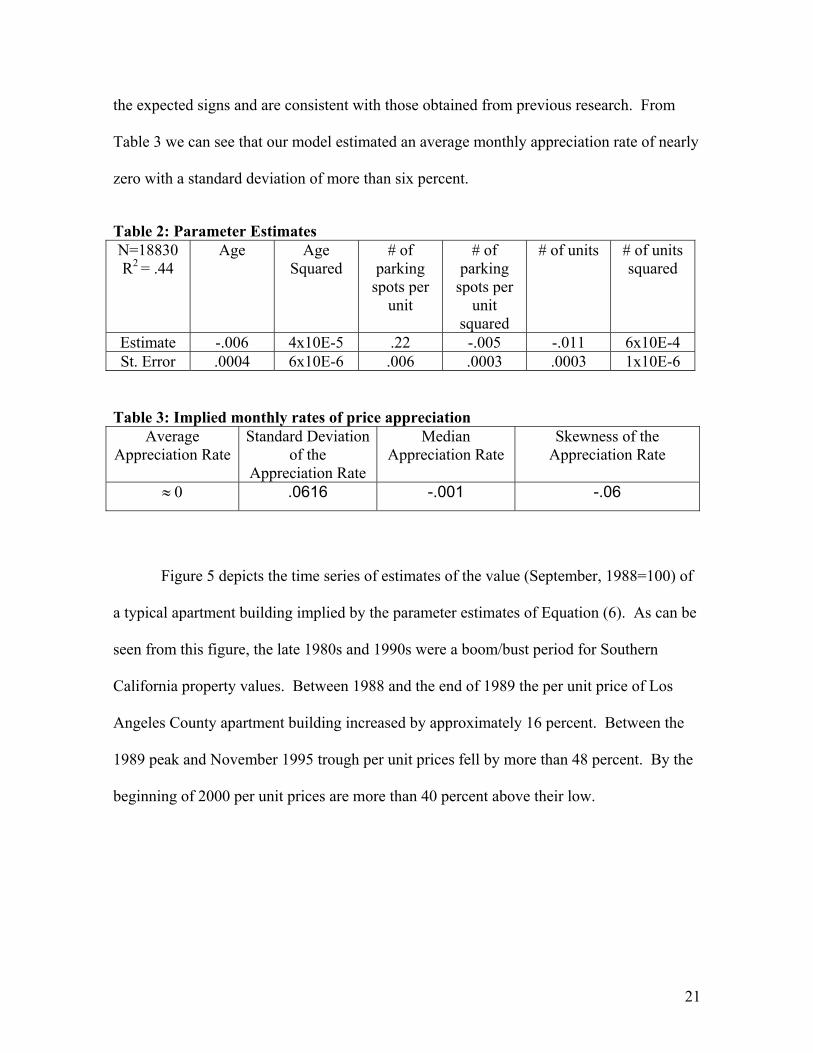
the expected signs and are consistent with those obtained from previous research. From
Table 3 we can see that our model estimated an average monthly appreciation rate of nearly
zero with a standard deviation of more than six percent.
Table 2: Parameter Estimates N=18830 R2 = .44
Age Age Squared
# of parking
spots per unit
# of parking
spots per unit
squared
# of units # of units squared
Estimate -.006 4x10E-5 .22 -.005 -.011 6x10E-4 St. Error .0004 6x10E-6 .006 .0003 .0003 1x10E-6
Table 3: Implied monthly rates of price appreciation
Average Appreciation Rate
Standard Deviation of the
Appreciation Rate
Median Appreciation Rate
Skewness of the Appreciation Rate
0≈ .0616 -.001 -.06
Figure 5 depicts the time series of estimates of the value (September, 1988=100) of
a typical apartment building implied by the parameter estimates of Equation (6). As can be
seen from this figure, the late 1980s and 1990s were a boom/bust period for Southern
California property values. Between 1988 and the end of 1989 the per unit price of Los
Angeles County apartment building increased by approximately 16 percent. Between the
1989 peak and November 1995 trough per unit prices fell by more than 48 percent. By the
beginning of 2000 per unit prices are more than 40 percent above their low.
21

Figure 5: Apartment Building Price per Unit Index
Apartment Building Price per Unit Index
40
50
60
70
80
90
100
110
120
130
1 5 9 13 17 21 25 29 33 37 41 45 49 53 57 61 65 69 73 77 81 85 89 93 97 101 105 109 113 117 121 125 129 133
Date (1 = Sept, 88)
Inde
x (S
ept,
88 =
100
)
We use the above time series for the value of the asset to test the empirical
implications of out model described in Section 2. The Federal Reserve Bank of St. Louis
provides U.S. interest rate data. The first prediction of our theory is that the spread
between lending and borrowing rates is negatively correlated with asset prices. We
compute the spread as the difference between prime lending rates and 1-month certificate
of deposit rates. The correlation between this spread and the asset price described above is
– 67%. This high negative correlation provides very strong support for the hypothesis that
underpricing was prevalent in Los Angeles during the run-up of property prices.
While this is only a single observation and does not provide a test of whether
underpricing magnifies asset price declines during potential market crashes, it allows us to
22

expand the model by including additional explanatory variables. In particular, we include
macroeconomic variables that have the potential to impact real estate values, such as labor
force growth, unemployment rate, personal income, and mortgage rates. Table 5 reports
the results of these regressions.
Table 5: Asset Prices and Interest Rates (II)
Dep. Var. is percent change in asset price
Spread of lending over deposit rates
Labor Force
Unempl. Personal income
Mortgage rates
Base Case .38 (.65)
-.14 (-1.9)
.30 (1.55)
-.09 (-.49)
Spread 1 -.12 (-1.82)
.26 (.44)
-.06 (-.75)
.28 (1.49)
-.02 (-.09)
Spread 2 -.12 (-1.87)
.30 (.50)
-.07 (-.75)
.03 (.21)
Spread 3 -.12 (1.87)
.31 (.54)
-.07 (-.89)
Spread 4 -.15 (-2.58)
Notes to Table 5: All variables, dependent and independent, are in one month percent change form. t-statistic is in prentices. The adjusted R2 of all regressions varies between 2 and 7%.
The one common feature of all models is that the spread of lending over deposit
rates remains negatively correlated with asset returns, even in the presence of various
controls. This is consistent with our hypothesis that asset prices in Los Angeles were
driven by underpricing of the default put options imbedded in non-recourse lending in
addition to all other macroeconomic factors affecting real estate markets.
23

4. Detailed Analysis of Some of the Markets
In what follows, we provide an in-depth analysis of most of the markets included in
our empirical tests above. In particular, we provide the specific market and institutional
events and characteristics that contributed to the correctly priced or underpriced lending.
While this does not offer a rigorous test of our theory, it does provide some robustness
checks to supplement the statistical analysis. More importantly, it summarizes the
institutional and market circumstances that have contributed in the past to possible
underpricing.
In the case of Singapore, tight control was exercised by the government over land
sales and such sales were accelerated in the 1990s to dampen the property market as real
estate prices rose. Hence, property prices were not allowed to spiral out of control.
Moreover, real estate loans were tightened in 1996 to curb speculation in property. Among
the measures introduced was to treat capital gains of real estate transactions as taxable
income if the sale of the property took place within three years of purchase. The maximum
loan quantum was also fixed at 80% of the appraised real estate value. All these measures
combined to reduce the degree of underpricing in the Singapore property market. Our
finding that Singapore did not exhibit the symptom of underpricing and that its total market
decline following the Asian financial crisis was relatively less severe is not surprising.
In the case of Hong Kong, the currency was pegged to the U.S. dollar at HK$7.8 to
one U.S. dollar. As a result, Hong Kong interest rates moved in line with the U.S. interest
rates. This in turn acted as a mechanism to prevent Hong-Kong-based banks from
underpricing in the property market. Not surprisingly, then, the Hong Kong lending market
24

did not exhibit the symptom of underpricing (as indicated in Figure 1), and also
experienced a relatively modest price decline during the Asian crisis.
Indonesia, on the other hand, enjoyed very strong inflows of foreign capital in the
early 1990s up to the eve of the Asian Financial Crisis in 1997, and domestic deposit rates
fell in the wake of the inflow. As foreign capital surged into Indonesia, speculation in the
real estate market, driven by cheap financing, was rampant. Loan quantum and credit
facilities of up to 90% of the collateral value were common for investments in real estate
properties (Mera and Renaud, 2000). This flood of liquidity led to a sharp price
appreciation in the asset markets, inflated collateral value and prompted further credit
expansion as asset prices climbed. Indonesia experienced the symptom of underpricing
(Indonesia is part of Figure 4), and a subsequent price decline of 80% or more.
In Thailand, foreign inflows similarly fuelled the rise in the property market, and
underpricing was rampant as banks competed by increasing loan amounts, reducing interest
rates for certain customers, and even extending renovation loans. With a pegged exchange
rate (up to 1 July 1997), it was attractive to borrow in offshore market and then invest in
real estate projects. By 1996, the loan exposure of the real estate sector in Thailand was
estimated at 30-40% of total loans with a value of US$160 billion. Consistent with our
findings (Figure 4), Thailand experienced a very sever case of underpricing and the largest
price decline in our dataset.
Malaysia also saw a significant buildup in the exposure to the property market.
From 1992-96 more than 70% of bank lending in Malaysia was channeled into real estate
and stock-market investments. Barth et al. (1998) estimate that expansion in bank credit to
25

the private sector, relative to GDP growth during the 1990–1996 period was 40% in
Malaysia, 62% in Indonesia, 115% in the Philippines, and 70% in Thailand. By
comparison, the growth was 19% in Germany, 3% in Japan, 16% in the United Kingdom,
and 21.5% in the United States. Again, consistent with our empirical analysis (Figure 1
and 4), Malaysia exhibited the symptom of underpricing, although to a lesser extent than
Thailand and Indonesia, and also experienced a severe price decline during the Asian
financial crisis.
At a first glance Japan appears to be an outlier in our analysis. There is no evidence
of underpricing as the correlation between asset returns and changes in lending spreads is
positive. Japan’s steep price decline is, therefore, inconsistent with our theory. The reality
is that the explanation for Japan’s real estate bubble and subsequent decline lies elsewhere.
Monetary and exchange rate policies in the 1980s resulted in excessive money supply and
extremely low interest rates. The land boom began in the mid 1980s after the 1985 Plaza
Accord amongst the finance ministers and chairmen of central banks from the G5 countries
agreed to push down the value of the dollar and strengthen the yen. The yen dramatically
appreciated from 244 yen/dollar in September 1985 to 152 in August 1986 (Saito, 2003).
The dramatic appreciation over a short period resulted in fears of a recession driven by loss
of competitiveness of Japanese exports. This led the Bank of Japan to slash its discount
rates from 5 to 2.5 percent over 15 months, and to keep the money supply abundant.
Banks, insurance companies and non-banks also invested heavily in real estate. The bubble
ended when tight monetary policies, credit controls on bank lending to real estate, and a
new real estate tax on land were introduced by Japan’s finance ministry between 1988 and
1992. Thus, even though Japan experienced a substantial price decline, this decline was
26

likely caused by other macroeconomic factors not by underpricing the default spread of
mortgage loans.
5. Summary and Policy Conclusions
By any measure, real-estate markets in many countries around the globe, including
in the US and Canada, prices are at, or above, their historic highs. Such an environment
naturally fuels fears that we are in a midst of a real-estate price bubble that will inevitably
burst. Even the strongest proponents of the bubble theories, however, will admit that it is
nearly impossible to accurately detect a real-estate bubble. At this stage, we still cannot tell
whether there is a bubble or if our economic fundamentals will prove strong enough to
support the new higher prices.
While we offer no remedy to this predicament, there are historical precedents
around the globe that do provide some insights for the future of the real estate markets
around the world. If there is one thing that the most severe real-estate bubbles have had in
common, it is easy access to low-cost credit. When this happens, real-estate investors and
homeowners take advantage of it and bid up land prices above their fundamental levels.
While this may or may not start a market price bubble, it can certainly make it worse. Easy
access to low-cost financing stimulates demand and drives up prices. If the lending
standards in this type of environment are lax, or weakened further, in order to increase
profits for lenders, the risk of a bubble is heightened. The bubble then bursts when market
prices exceed the fundamental values of the underlying properties by so much that even
virtually costless financing cannot generate more demand.
27

We all know what follows. The more reckless the lending industry is, the longer the
bubble can survive, and the harder it bursts. For instance, we found in this paper that the
lending sector was a major contributor to the real-estate price bubble in the mid-1990s in
countries such as Thailand, Malaysia, and Indonesia. Conversely, Singapore and Hong
Kong maintained far more restrictive lending practices, and the lending sector did not
contribute to the price inflation there.
While all of the countries in our study experienced deep price declines during their
respective crisis, these declines were two to three times more severe in the countries where
access to funds for real-estate development or ownership was unrestricted and very cheap.
Empirical evidence from earlier real-estate market bubbles across the globe also seems to
strongly support this idea.
In a more recent case, John Laker, Chairman of the Australian Prudential
Regulatory Authority, suggested that lax lending standards in Australia are potentially
contributing to Australia's real-estate boom where home prices have increased much more
dramatically than in North America. In response, the Regulatory Authority has taken steps
to strengthen bank lending standards to prevent further price inflation due to excessive
availability of funds.
Similarly, there is real concern, recently expressed by former Chairman of the US
Fed, Alan Greenspan, that price rises in the US are being artificially fuelled by new and
exotic mortgage instruments that embody overly liberal lending standards. While we
cannot say to what degree these instruments are contributing to asset price inflation, we do
know the direction of their impact. We also know that in the aftermath of a negative
28

demand shock, prices will fall both to adjust to new supply and demand fundamentals and
to compensate for past lending mistakes.
The bottom line is that we are still unable to detect market bubbles before they
burst, but at least we can estimate their severity by examining the impact of lending
practices prevalent in the market. Furthermore, the model shows the extent to which
lending-industry regulators can mitigate the economic impact of a potential bubble by
enforcing prudent lending standards.
29

References
Allen, F. 2001. Presidential Address: Do Financial Institutions Matter? The Journal of Finance. 56:1165-1176. Allen, F. and D. Gale. 1999. Innovations in Financial Services, Relationships, and Risk Sharing. Management Science. 45:1239-1253. Allen, F. and D. Gale. 1998. Optimal Financial Crises. Journal of Finance. 53:1245-1283. Barth, J. R., et al. 1998. Governments vs. Markets. Jobs and Capital, VII (3/4), 28–41. Case, K, and R. Shiller. 2003. Is There a Bubble in the Housing Market? Brookings Papers on Economic Activity (Brookings Institution), 2003:2, 299-342. Chun, C. 2004. An Empirical Investigation of the role of Legal Origin on the performance of Property Stocks. Ph.D. Dissertation. Edelstein, R. 2005. Explaining the Boom Cycle, Speculation or Fundamentals? The Role of Real Estate in the Asian Crisis. M.E. Sharpe, Inc. Publisher Edelstein, R., Y. Dokko, A. Lacayo, and D. Lee. 1999. Real Estate Value Cycles: A Theory of Market Dynamics. Journal of Real Estate Research. 18(1):69-95. Eichholtz, P., N. deGraaf, W. Kastrop, and H. Veld. 1998. Introducing the GRP 250 property share index. Real Estate Finance. 15(1): 51-61. Herring, R. and S. Wachter. 1999. Real Estate Booms and Banking Busts-An International Perspective. Group of Thirty, Wash. D.C. Krainer, J. and C. Wei. 2004. House Prices and Fundamental Value. FRBSF Economic Letter. 2004-27. Krugman, P. 2005. That Hissing Sound. The New York Times: August 8. Leamer, E. 2002. Bubble Trouble? Your Home Has a P/E Ratio Too. UCLA Anderson Forecast. McCarthy, J. and R. Peach. 2004. Are Home Prices the Next “Bubble”? FRBNY Economic Policy Review. 10 (3): 1-17. Mera, K. and B. Renaud. 2000. Asia’s Financial Crisis and the Role of Real Estate. M.E. Sharpe Publishers.
30
31
Pavlov, A. and S. Wachter. 2004. Robbing the Bank: Short-term Players and Asset Prices. Journal of Real Estate Finance and Economics. 28:2/3, 147-160 Pavlov, A. and S. Wachter. 2005. The Anatomy of Non-recourse Lending. Working Paper. Saito, H. (2003). The US real estate bubble? A comparison to Japan. Japan and the World Economy, 15, 365-371. Shiller, R. 2005. The Bubble’s New Home. Barron’s: June 20. Smith, M, G. Smith, and C. Thompson. 2005. When is a Housing Bubble not a Housing Bubble? Working Paper.