understand car insurance report
TRANSCRIPT
Prepared by Quantum Market Research for Understand Insurance
June 2014
Understand Insurance Motor Research Report
Background to this report
Page 2
Understand Car Insurance Research ReportJune 2014
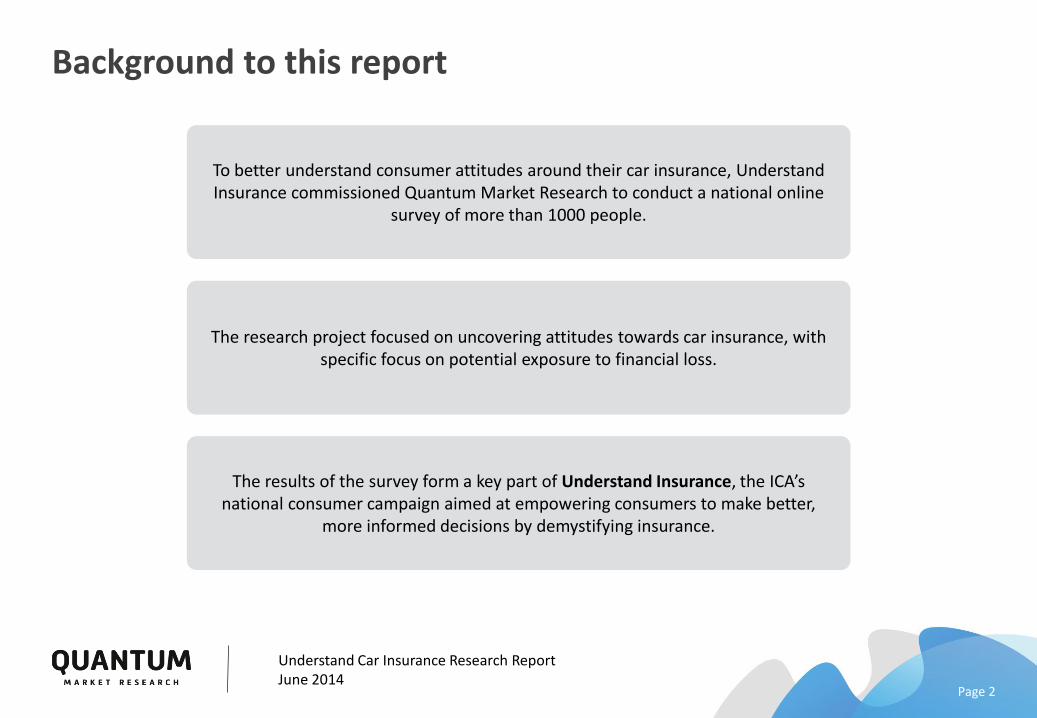
To better understand consumer attitudes around their car insurance, Understand Insurance commissioned Quantum Market Research to conduct a national online
survey of more than 1000 people.
The results of the survey form a key part of Understand Insurance, the ICA’s national consumer campaign aimed at empowering consumers to make better,
more informed decisions by demystifying insurance.
The research project focused on uncovering attitudes towards car insurance, with specific focus on potential exposure to financial loss.
Research methodology & sampling
Page 3
Understand Car Insurance Research ReportJune 2014
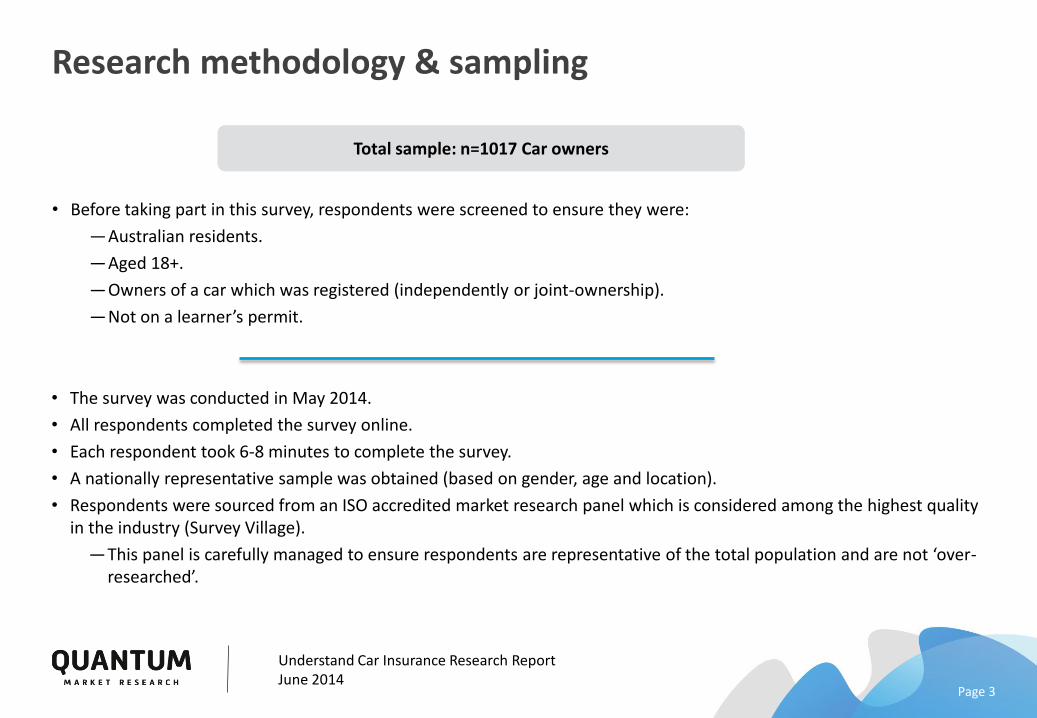
Total sample: n=1017 Car owners
• Before taking part in this survey, respondents were screened to ensure they were:
―Australian residents.
―Aged 18+.
―Owners of a car which was registered (independently or joint-ownership).
―Not on a learner’s permit.
• The survey was conducted in May 2014.
• All respondents completed the survey online.
• Each respondent took 6-8 minutes to complete the survey.
• A nationally representative sample was obtained (based on gender, age and location).
• Respondents were sourced from an ISO accredited market research panel which is considered among the highest quality in the industry (Survey Village).
―This panel is carefully managed to ensure respondents are representative of the total population and are not ‘over-researched’.
A nationally representative sample
Page 4
Understand Car Insurance Research ReportJune 2014
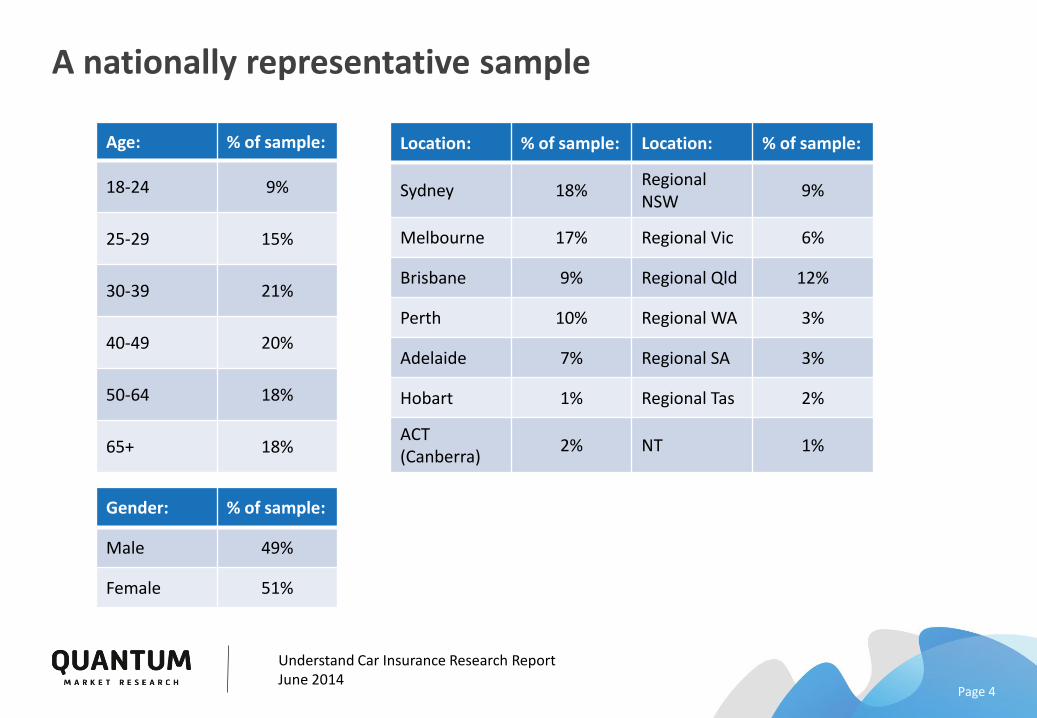
Location: % of sample: Location: % of sample:
Sydney 18%Regional NSW
9%
Melbourne 17% Regional Vic 6%
Brisbane 9% Regional Qld 12%
Perth 10% Regional WA 3%
Adelaide 7% Regional SA 3%
Hobart 1% Regional Tas 2%
ACT (Canberra)
2% NT 1%
Age: % of sample:
18-24 9%
25-29 15%
30-39 21%
40-49 20%
50-64 18%
65+ 18%
Gender: % of sample:
Male 49%
Female 51%
Sections of this report
Page 5
Understand Car Insurance Research ReportJune 2014
Understanding of insurance
Potential exposure to financial loss
Additional data
Summary of key findings

Summary of key findings
Page 6
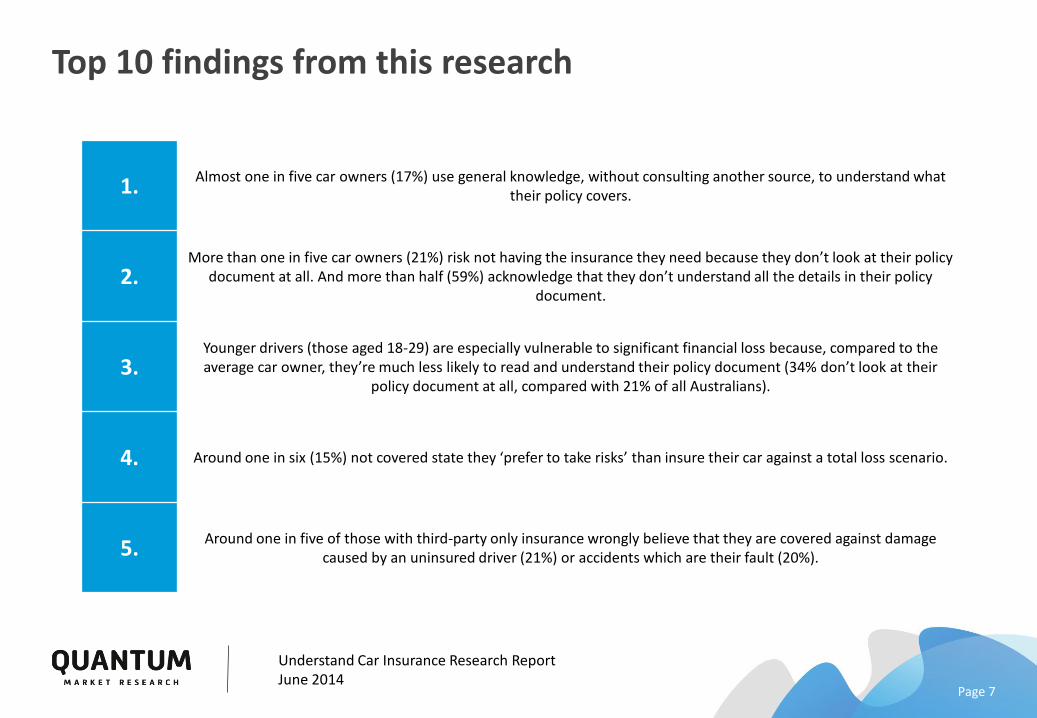
Top 10 findings from this research
Page 7
Understand Car Insurance Research ReportJune 2014
1.Almost one in five car owners (17%) use general knowledge, without consulting another source, to understand what
their policy covers.
2.More than one in five car owners (21%) risk not having the insurance they need because they don’t look at their policy
document at all. And more than half (59%) acknowledge that they don’t understand all the details in their policy document.
3.Younger drivers (those aged 18-29) are especially vulnerable to significant financial loss because, compared to the average car owner, they’re much less likely to read and understand their policy document (34% don’t look at their
policy document at all, compared with 21% of all Australians).
4. Around one in six (15%) not covered state they ‘prefer to take risks’ than insure their car against a total loss scenario.
5.Around one in five of those with third-party only insurance wrongly believe that they are covered against damage
caused by an uninsured driver (21%) or accidents which are their fault (20%).
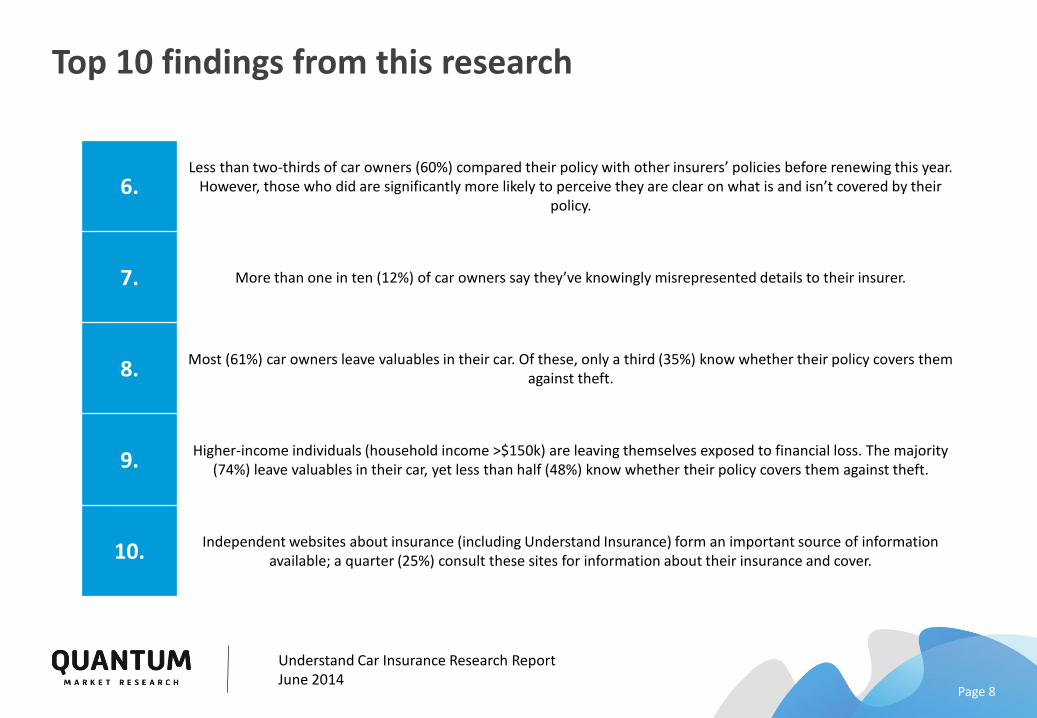
Top 10 findings from this research
Page 8
Understand Car Insurance Research ReportJune 2014
6.Less than two-thirds of car owners (60%) compared their policy with other insurers’ policies before renewing this year.
However, those who did are significantly more likely to perceive they are clear on what is and isn’t covered by their policy.
7. More than one in ten (12%) of car owners say they’ve knowingly misrepresented details to their insurer.
8.Most (61%) car owners leave valuables in their car. Of these, only a third (35%) know whether their policy covers them
against theft.
9.Higher-income individuals (household income >$150k) are leaving themselves exposed to financial loss. The majority
(74%) leave valuables in their car, yet less than half (48%) know whether their policy covers them against theft.
10.Independent websites about insurance (including Understand Insurance) form an important source of information
available; a quarter (25%) consult these sites for information about their insurance and cover.

Understanding of insurance
Page 9
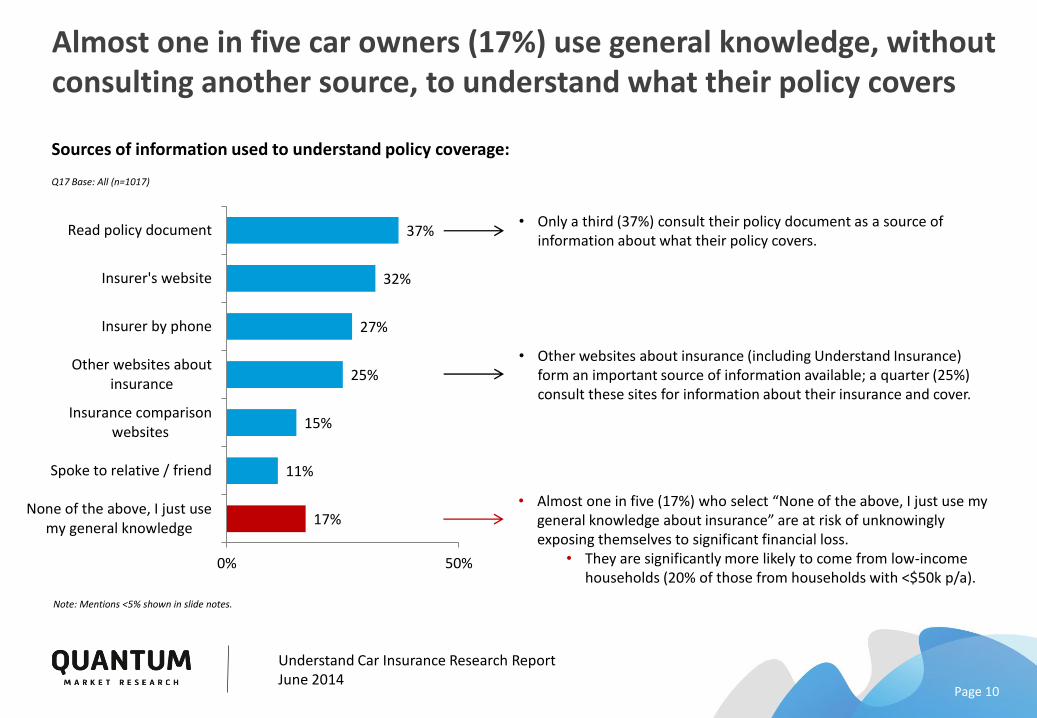
Almost one in five car owners (17%) use general knowledge, without consulting another source, to understand what their policy covers
Page 10
Understand Car Insurance Research ReportJune 2014
Sources of information used to understand policy coverage:
Q17 Base: All (n=1017)
37%
32%
27%
25%
15%
11%
17%
0% 50%
Read policy document
Insurer's website
Insurer by phone
Other websites aboutinsurance
Insurance comparisonwebsites
Spoke to relative / friend
None of the above, I just usemy general knowledge
Note: Mentions <5% shown in slide notes.
• Only a third (37%) consult their policy document as a source of information about what their policy covers.
• Other websites about insurance (including Understand Insurance) form an important source of information available; a quarter (25%) consult these sites for information about their insurance and cover.
• Almost one in five (17%) who select “None of the above, I just use my general knowledge about insurance” are at risk of unknowingly exposing themselves to significant financial loss.
• They are significantly more likely to come from low-income households (20% of those from households with <$50k p/a).
More than one in five car owners (21%) risk significant financial loss because they don’t look at their policy document at all
Page 11
Understand Car Insurance Research ReportJune 2014
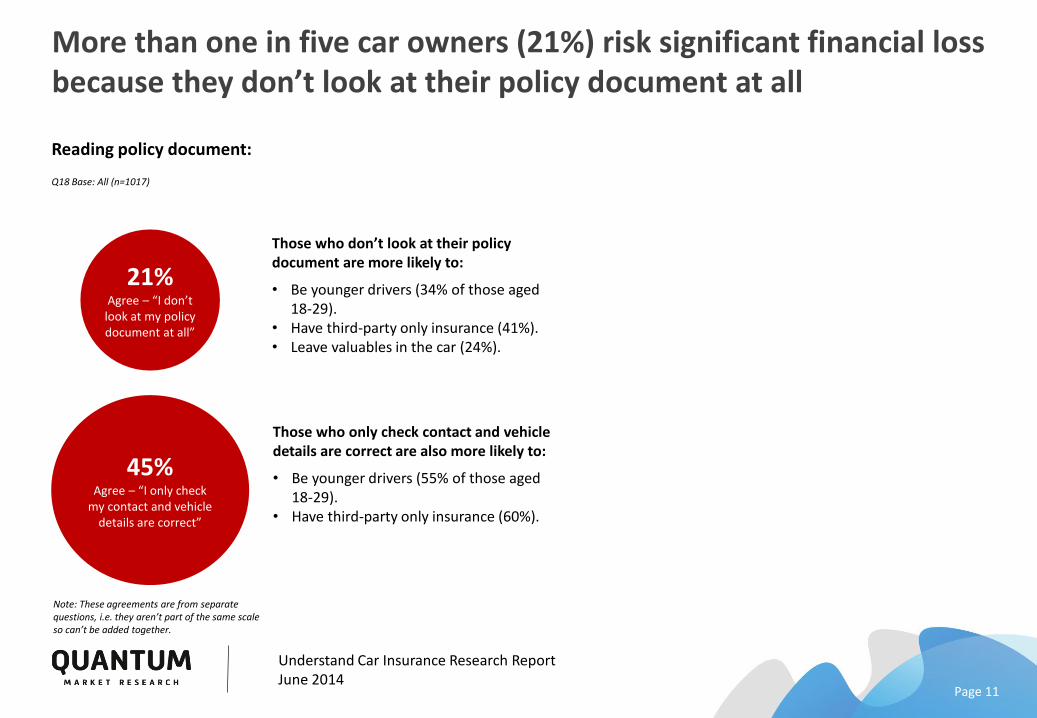
Reading policy document:
Q18 Base: All (n=1017)
21% Agree – “I don’t look at my policy document at all”
45% Agree – “I only check
my contact and vehicle details are correct”
Those who don’t look at their policy document are more likely to:
• Be younger drivers (34% of those aged 18-29).
• Have third-party only insurance (41%).• Leave valuables in the car (24%).
Those who only check contact and vehicle details are correct are also more likely to:
• Be younger drivers (55% of those aged 18-29).
• Have third-party only insurance (60%).
Note: These agreements are from separate questions, i.e. they aren’t part of the same scale so can’t be added together.
Potential exposure to financial loss
Page 12
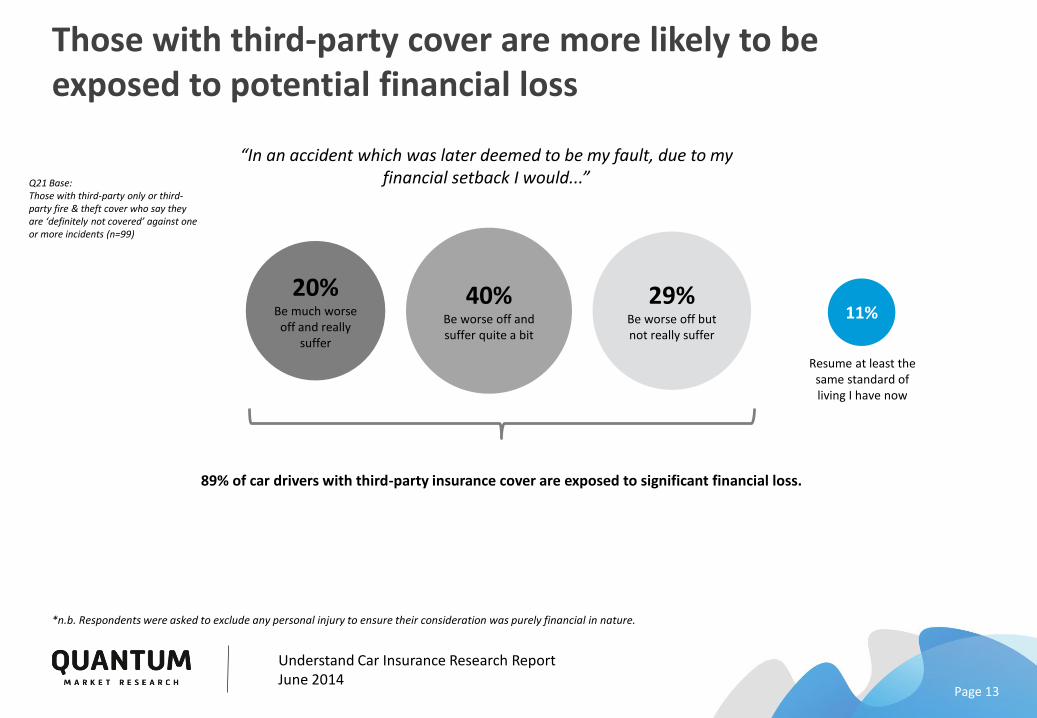
Those with third-party cover are more likely to be exposed to potential financial loss
Page 13
Understand Car Insurance Research ReportJune 2014
20% Be much worse
off and really suffer
Q21 Base:Those with third-party only or third-party fire & theft cover who say they are ‘definitely not covered’ against one or more incidents (n=99)
“In an accident which was later deemed to be my fault, due to my financial setback I would...”
40% Be worse off and suffer quite a bit
29% Be worse off but not really suffer
11%
89% of car drivers with third-party insurance cover are exposed to significant financial loss.
*n.b. Respondents were asked to exclude any personal injury to ensure their consideration was purely financial in nature.
Resume at least the same standard of living I have now
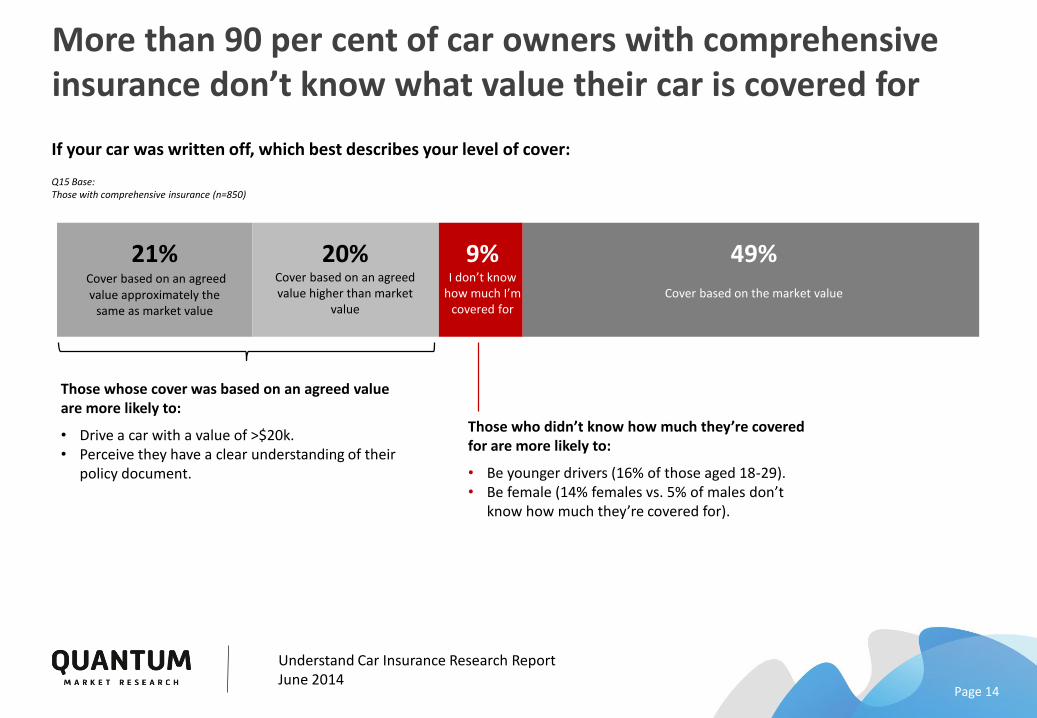
More than 90 per cent of car owners with comprehensive insurance don’t know what value their car is covered for
Page 14
Understand Car Insurance Research ReportJune 2014
If your car was written off, which best describes your level of cover:
Q15 Base: Those with comprehensive insurance (n=850)
49%
Cover based on the market value
21% Cover based on an agreed value approximately the
same as market value
20% Cover based on an agreed value higher than market
value
9% I don’t know
how much I’m covered for
Those whose cover was based on an agreed value are more likely to:
• Drive a car with a value of >$20k.• Perceive they have a clear understanding of their
policy document.
Those who didn’t know how much they’re covered for are more likely to:
• Be younger drivers (16% of those aged 18-29).• Be female (14% females vs. 5% of males don’t
know how much they’re covered for).
62%
46%
21%
20%
12%
10%
9%
34%
40%
55%
32%
38%
43%
44%
4%
13%
24%
49%
50%
48%
48%
0% 100%
Damage to someone else'sproperty
Damage to own car if not at fault& other vehicle insured
Damage to own car if not at fault& other vehicle uninsured
Damage to own car if at fault
Damage or loss by theft
Damage or loss by fire
Damage or loss by vandalism
Definitely covered Unsure Definitely not covered
Knowledge of coverage – Third-party only
Page 15
Understand Car Insurance Research ReportJune 2014
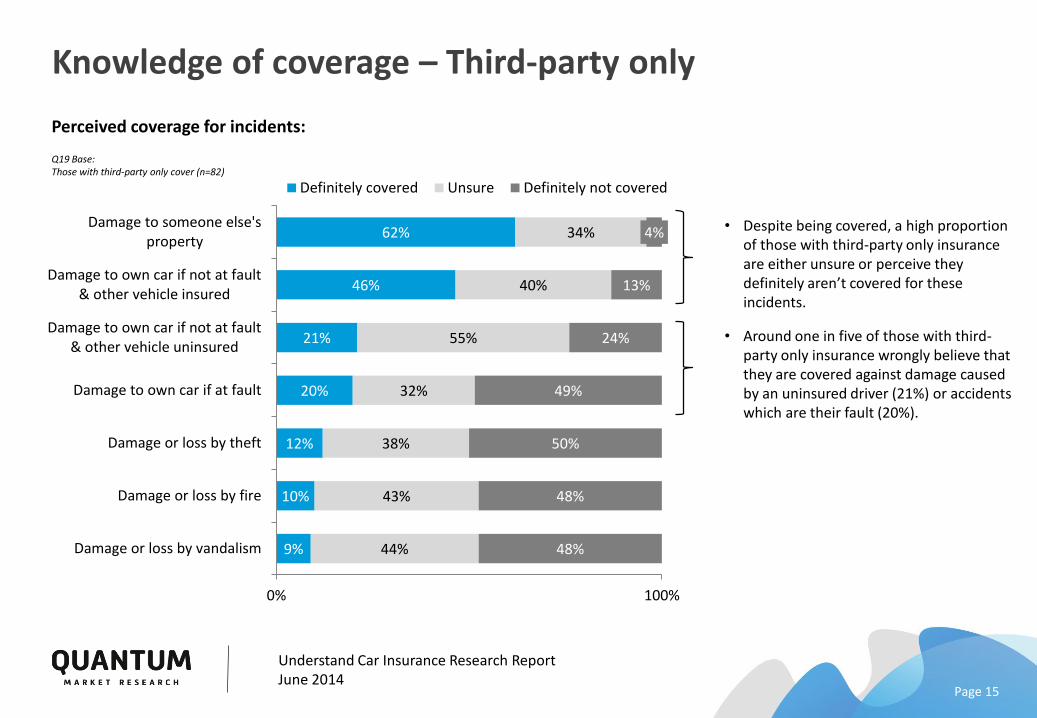
Perceived coverage for incidents:
Q19 Base: Those with third-party only cover (n=82)
• Despite being covered, a high proportion of those with third-party only insurance are either unsure or perceive they definitely aren’t covered for these incidents.
• Around one in five of those with third-party only insurance wrongly believe that they are covered against damage caused by an uninsured driver (21%) or accidents which are their fault (20%).
68%
42%
29%
23%
81%
82%
24%
23%
39%
48%
19%
16%
18%
56%
10%
19%
23%
58%
19%
0% 100%
Damage to someone else'sproperty
Damage to own car if not at fault& other vehicle insured
Damage to own car if not at fault& other vehicle uninsured
Damage to own car if at fault
Damage or loss by theft
Damage or loss by fire
Damage or loss by vandalism
Definitely covered Unsure Definitely not covered
Knowledge of coverage – Third-party fire and theft
Page 16
Understand Car Insurance Research ReportJune 2014
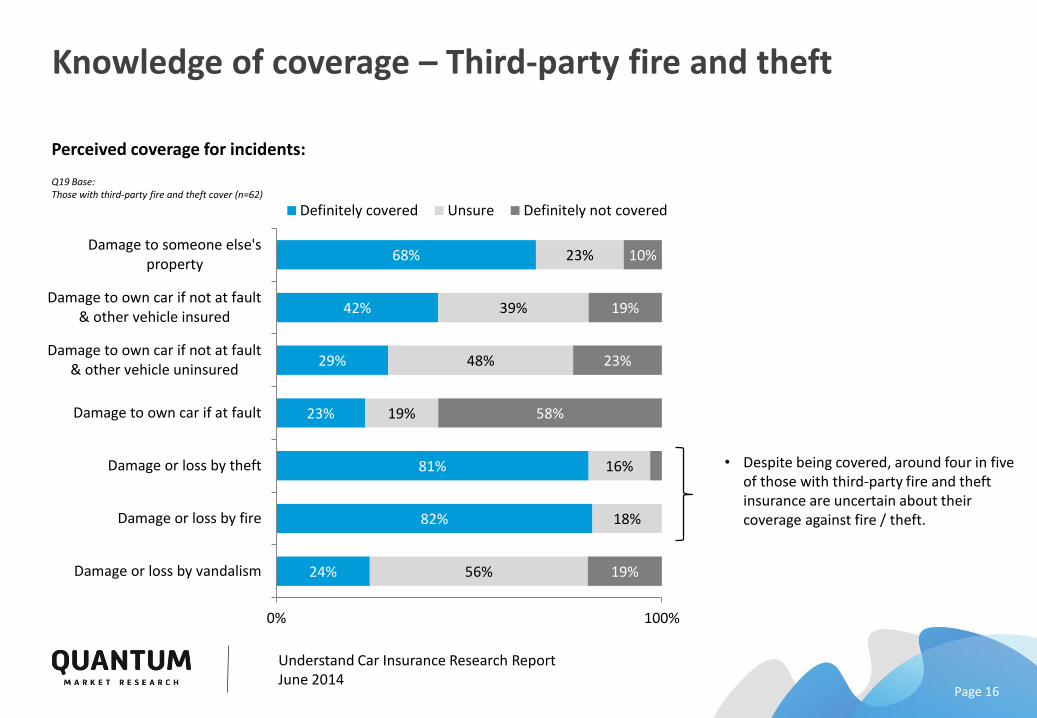
Perceived coverage for incidents:
Q19 Base: Those with third-party fire and theft cover (n=62)
• Despite being covered, around four in five of those with third-party fire and theft insurance are uncertain about their coverage against fire / theft.
81%
87%
80%
86%
87%
81%
72%
17%
11%
19%
12%
12%
18%
27%
0% 100%
Damage to someone else'sproperty
Damage to own car if not at fault& other vehicle insured
Damage to own car if not at fault& other vehicle uninsured
Damage to own car if at fault
Damage or loss by theft
Damage or loss by fire
Damage or loss by vandalism
Definitely covered Unsure Definitely not covered
Knowledge of coverage – Comprehensive
Page 17
Understand Car Insurance Research ReportJune 2014
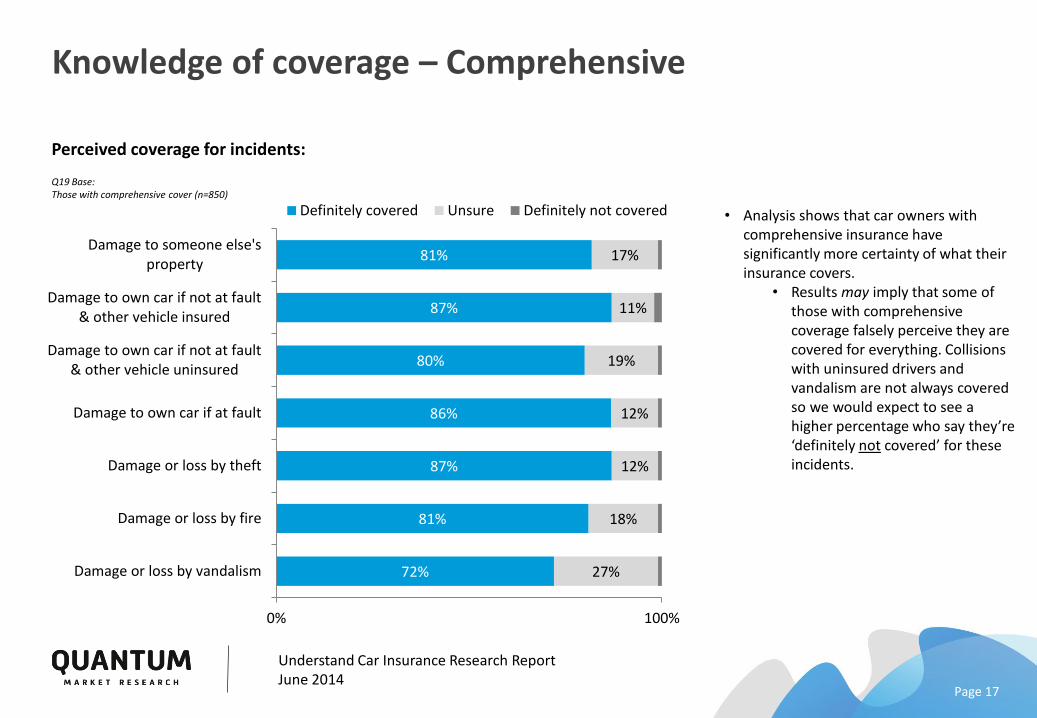
Perceived coverage for incidents:
Q19 Base: Those with comprehensive cover (n=850)
• Analysis shows that car owners with comprehensive insurance have significantly more certainty of what their insurance covers.
• Results may imply that some of those with comprehensive coverage falsely perceive they are covered for everything. Collisions with uninsured drivers and vandalism are not always covered so we would expect to see a higher percentage who say they’re ‘definitely not covered’ for these incidents.
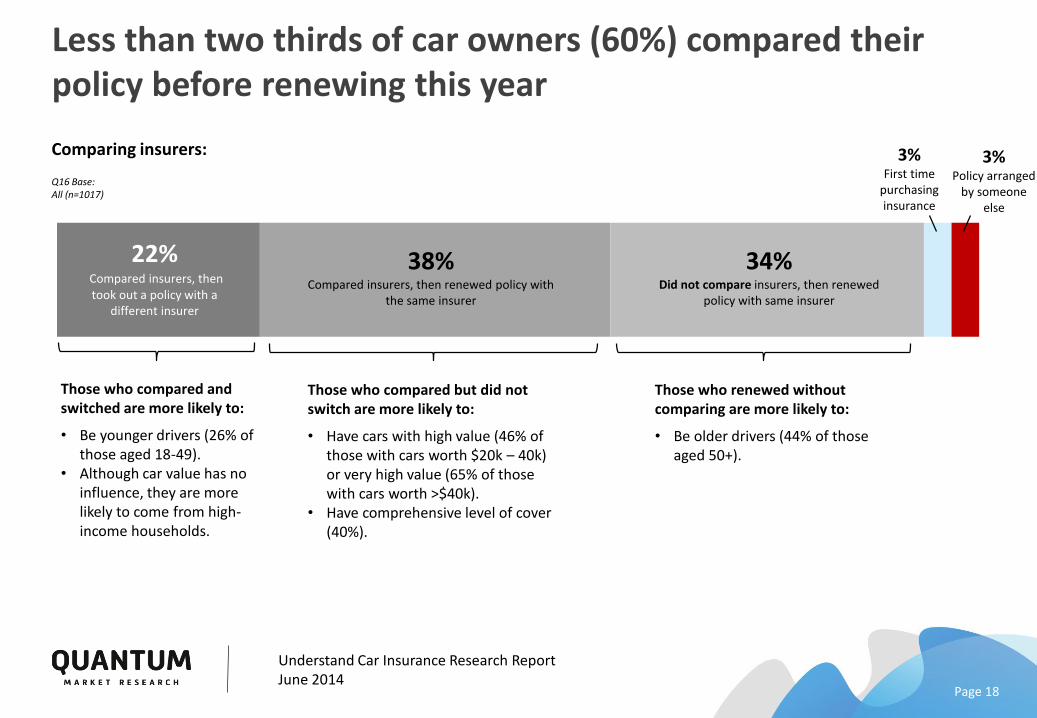
Those who compared and switched are more likely to:
• Be younger drivers (26% of those aged 18-49).
• Although car value has no influence, they are more likely to come from high-income households.
Less than two thirds of car owners (60%) compared their policy before renewing this year
Page 18
Understand Car Insurance Research ReportJune 2014
Comparing insurers:
Q16 Base: All (n=1017)
22% Compared insurers, then took out a policy with a
different insurer
38% Compared insurers, then renewed policy with
the same insurer
34% Did not compare insurers, then renewed
policy with same insurer
3% First time
purchasing insurance
3% Policy arranged
by someone else
Those who compared but did not switch are more likely to:
• Have cars with high value (46% of those with cars worth $20k – 40k) or very high value (65% of those with cars worth >$40k).
• Have comprehensive level of cover (40%).
Those who renewed without comparing are more likely to:
• Be older drivers (44% of those aged 50+).
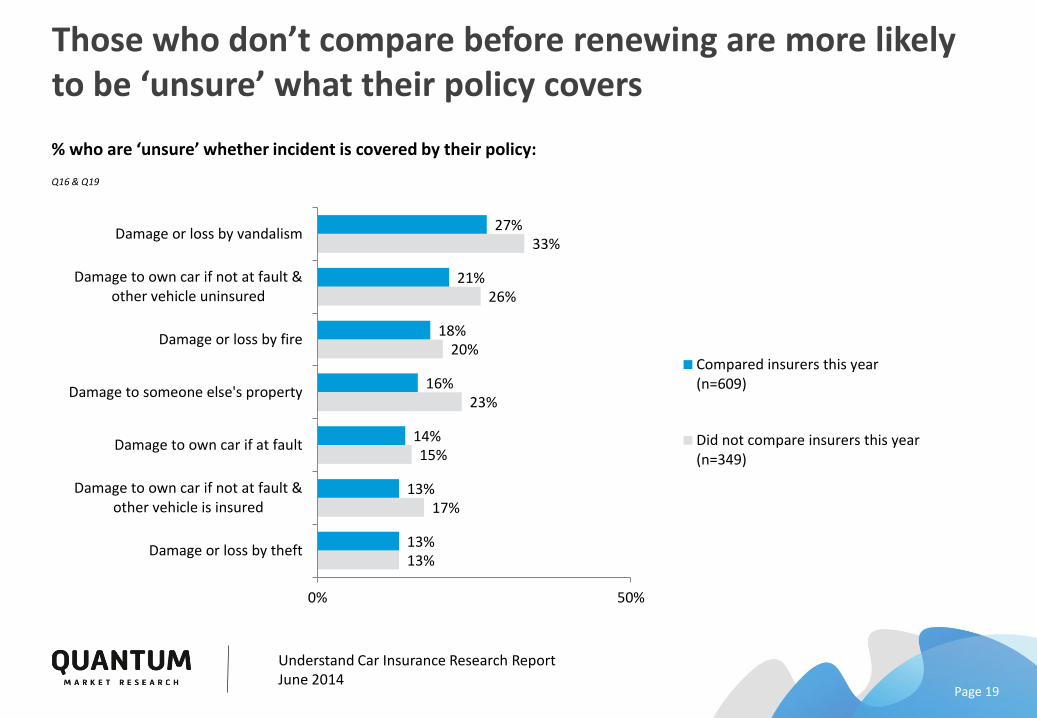
Those who don’t compare before renewing are more likely to be ‘unsure’ what their policy covers
Page 19
Understand Car Insurance Research ReportJune 2014
% who are ‘unsure’ whether incident is covered by their policy:
Q16 & Q19
27%
21%
18%
16%
14%
13%
13%
33%
26%
20%
23%
15%
17%
13%
0% 50%
Damage or loss by vandalism
Damage to own car if not at fault &other vehicle uninsured
Damage or loss by fire
Damage to someone else's property
Damage to own car if at fault
Damage to own car if not at fault &other vehicle is insured
Damage or loss by theft
Compared insurers this year(n=609)
Did not compare insurers this year(n=349)
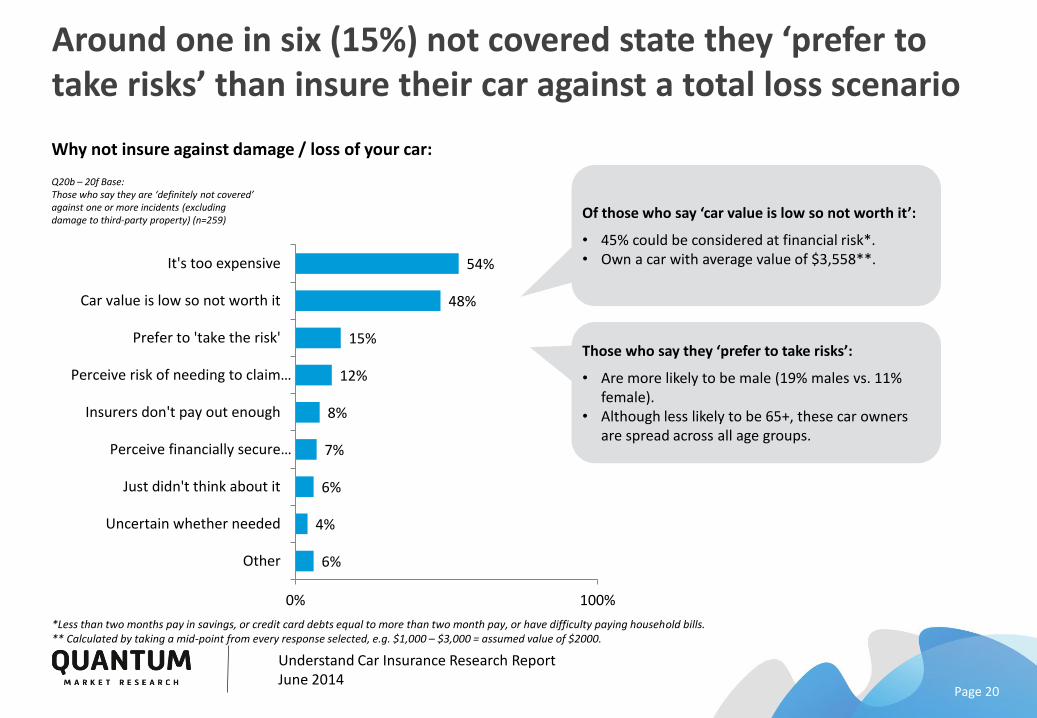
Around one in six (15%) not covered state they ‘prefer to take risks’ than insure their car against a total loss scenario
Page 20
Understand Car Insurance Research ReportJune 2014
Why not insure against damage / loss of your car:
Q20b – 20f Base: Those who say they are ‘definitely not covered’ against one or more incidents (excluding damage to third-party property) (n=259)
54%
48%
15%
12%
8%
7%
6%
4%
6%
0% 100%
It's too expensive
Car value is low so not worth it
Prefer to 'take the risk'
Perceive risk of needing to claim…
Insurers don't pay out enough
Perceive financially secure…
Just didn't think about it
Uncertain whether needed
Other
Of those who say ‘car value is low so not worth it’:
• 45% could be considered at financial risk*.• Own a car with average value of $3,558**.
Those who say they ‘prefer to take risks’:
• Are more likely to be male (19% males vs. 11% female).
• Although less likely to be 65+, these car owners are spread across all age groups.
*Less than two months pay in savings, or credit card debts equal to more than two month pay, or have difficulty paying household bills.** Calculated by taking a mid-point from every response selected, e.g. $1,000 – $3,000 = assumed value of $2000.
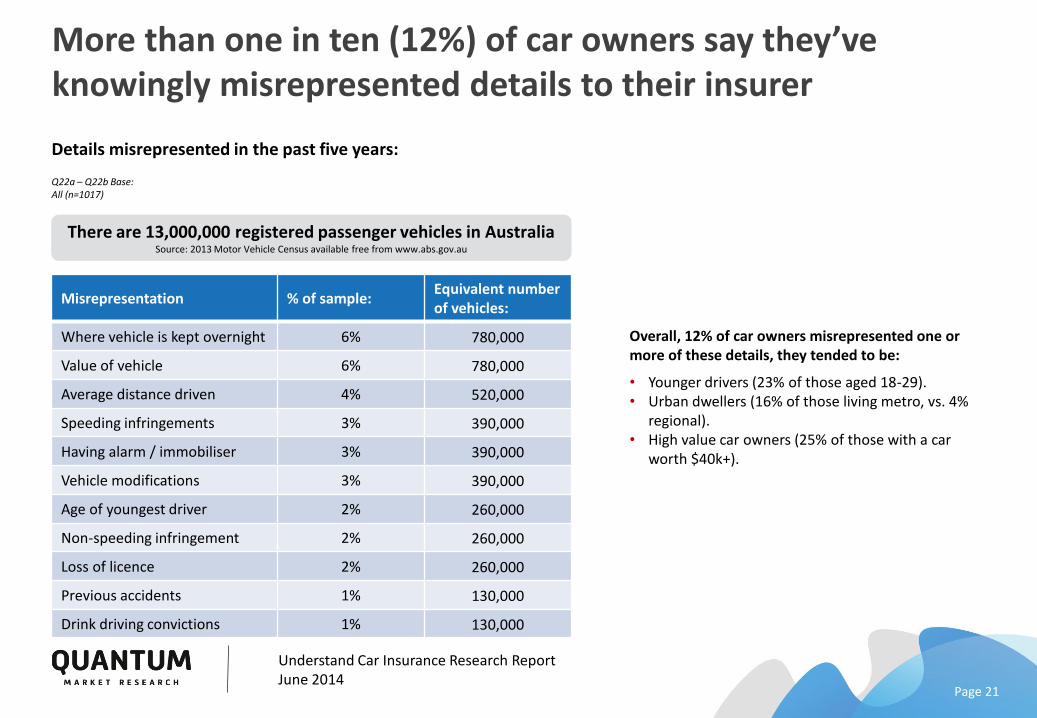
More than one in ten (12%) of car owners say they’ve knowingly misrepresented details to their insurer
Page 21
Understand Car Insurance Research ReportJune 2014
Details misrepresented in the past five years:
Q22a – Q22b Base: All (n=1017)
There are 13,000,000 registered passenger vehicles in AustraliaSource: 2013 Motor Vehicle Census available free from www.abs.gov.au
Misrepresentation % of sample:Equivalent number of vehicles:
Where vehicle is kept overnight 6% 780,000
Value of vehicle 6% 780,000
Average distance driven 4% 520,000
Speeding infringements 3% 390,000
Having alarm / immobiliser 3% 390,000
Vehicle modifications 3% 390,000
Age of youngest driver 2% 260,000
Non-speeding infringement 2% 260,000
Loss of licence 2% 260,000
Previous accidents 1% 130,000
Drink driving convictions 1% 130,000
Overall, 12% of car owners misrepresented one or more of these details, they tended to be:
• Younger drivers (23% of those aged 18-29).• Urban dwellers (16% of those living metro, vs. 4%
regional).• High value car owners (25% of those with a car
worth $40k+).

The majority (61%) of car owners leave valuables in their car. Of these, only a third (35%) know whether their policy covers them against theft
Page 22
Understand Car Insurance Research ReportJune 2014
Valuables left in car:
Q23 Base: All (n=1017)
61%Leave valuables in
their car(12% very often, 49%
occasionally)
39%Never leave valuables
in their car
Whether insured for theft of valuables:
54% Are unsure whether they
have coverage
13% Know they don’t have coverage
35% Know they have coverage
(22% on home contents,13% as part of car policy)
Those who leave valuables in their car are more likely to:
• Have high household income (74% with household income >$150k).• Drive a car of very high value (77% of those whose car is worth $>40k). In the
majority of cases (42%) this is sports equipment (which those with lower value cars are significantly less likely to leave).
• See Slide 30 for detailed breakdown.
Q26 Base: Those who do leave valuables in their car (n=625)

Additional data
Page 23
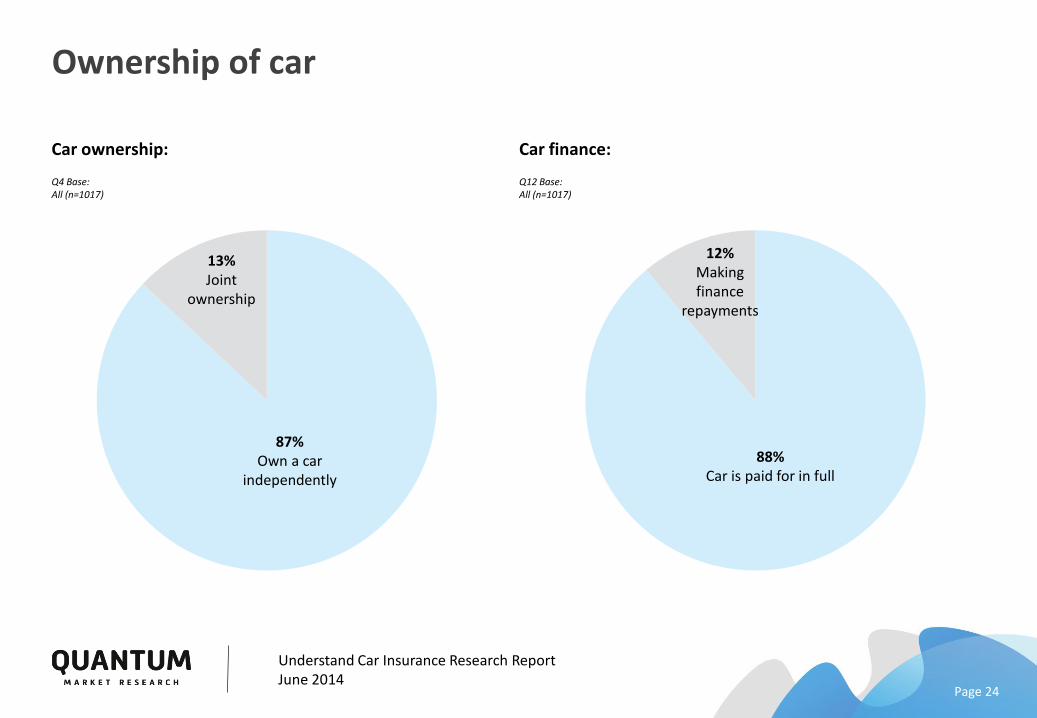
Ownership of car
Page 24
Understand Car Insurance Research ReportJune 2014
87%Own a car
independently
13%Joint
ownership
Car ownership:
Q4 Base: All (n=1017)
Car finance:
Q12 Base: All (n=1017)
88%Car is paid for in full
12%Makingfinance
repayments
Type and current value of car
Page 25
Understand Car Insurance Research ReportJune 2014
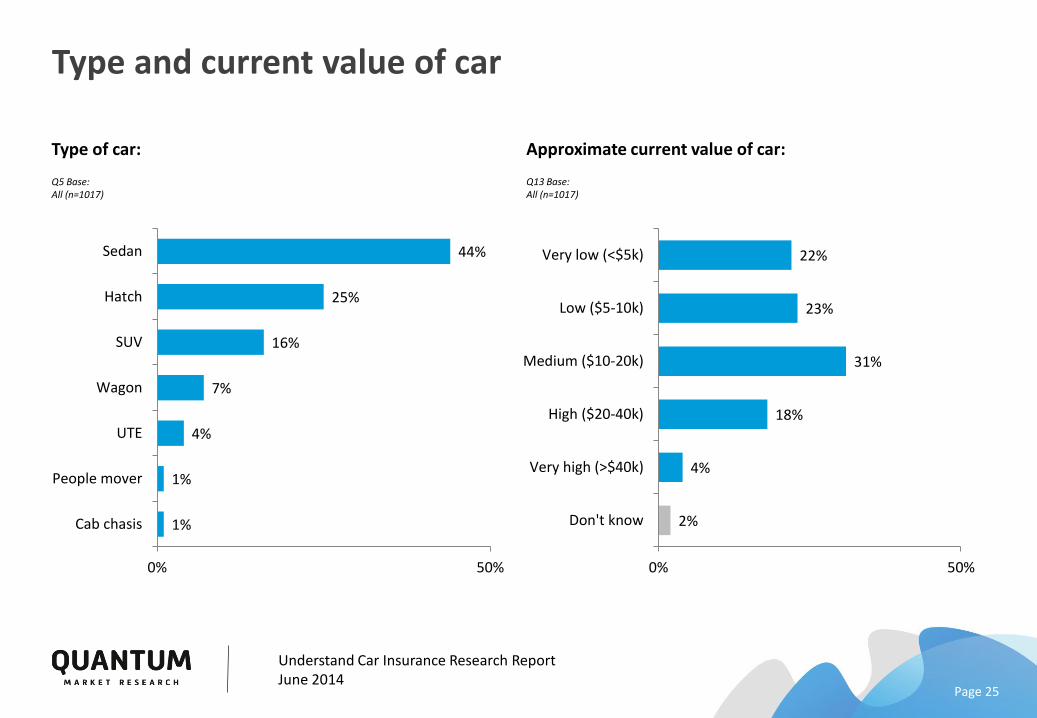
Type of car:
Q5 Base: All (n=1017)
44%
25%
16%
7%
4%
1%
1%
0% 50%
Sedan
Hatch
SUV
Wagon
UTE
People mover
Cab chasis
Approximate current value of car:
Q13 Base: All (n=1017)
22%
23%
31%
18%
4%
2%
0% 50%
Very low (<$5k)
Low ($5-10k)
Medium ($10-20k)
High ($20-40k)
Very high (>$40k)
Don't know
Age of car
Page 26
Understand Car Insurance Research ReportJune 2014
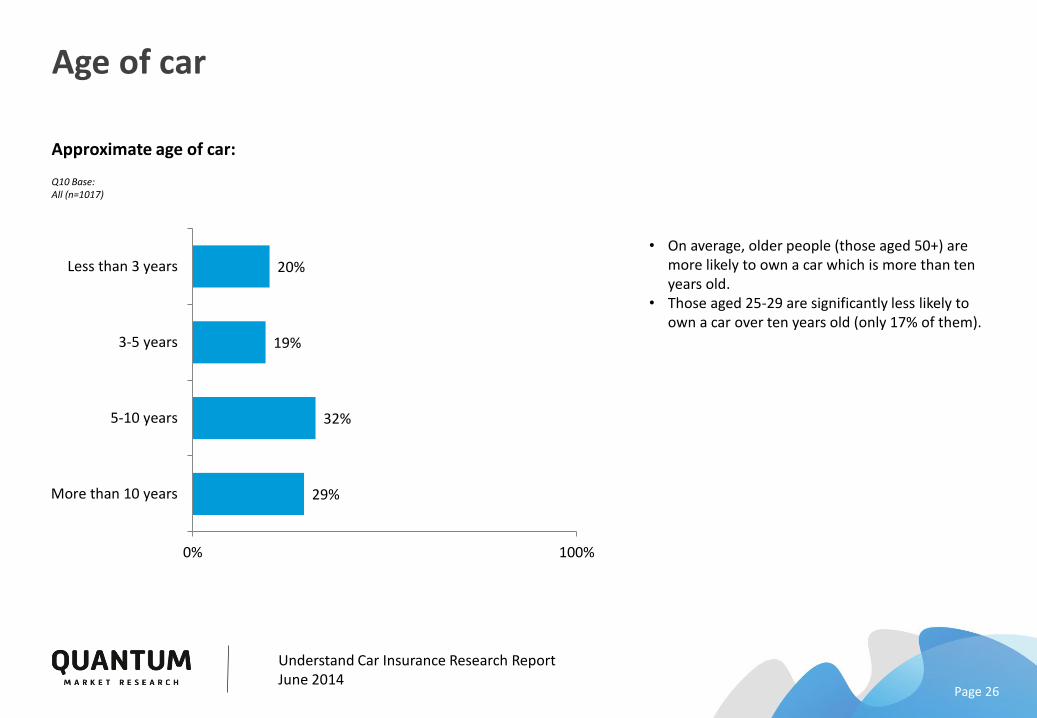
Approximate age of car:
Q10 Base: All (n=1017)
20%
19%
32%
29%
0% 100%
Less than 3 years
3-5 years
5-10 years
More than 10 years
• On average, older people (those aged 50+) are more likely to own a car which is more than ten years old.
• Those aged 25-29 are significantly less likely to own a car over ten years old (only 17% of them).
Frequency of car use
Page 27
Understand Car Insurance Research ReportJune 2014
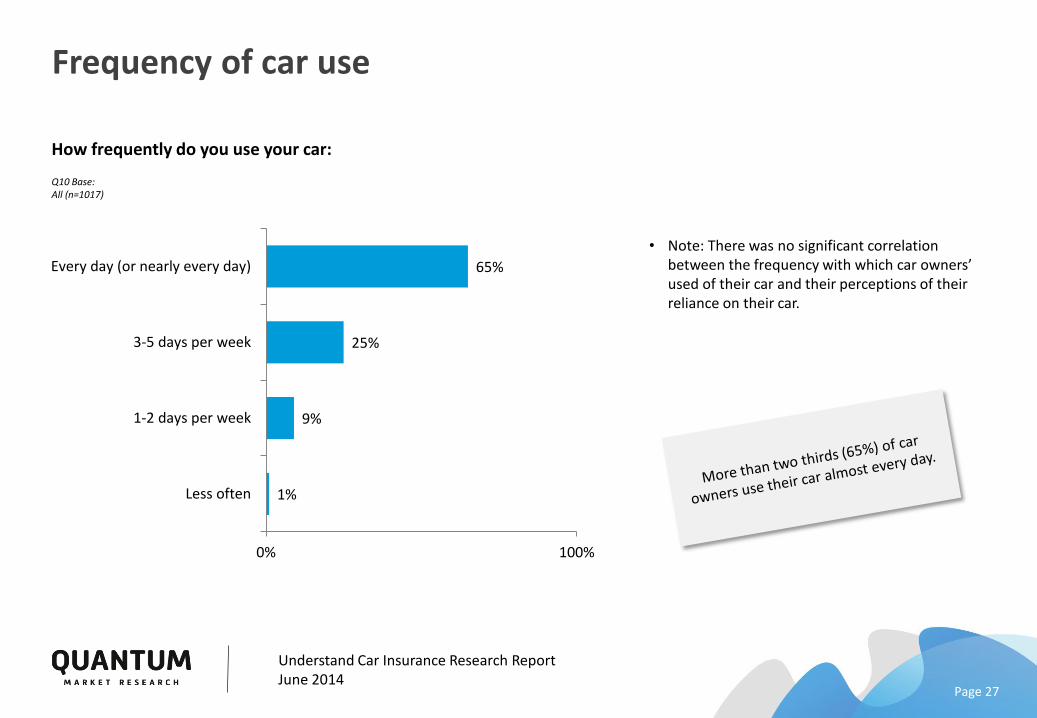
How frequently do you use your car:
Q10 Base: All (n=1017)
65%
25%
9%
1%
0% 100%
Every day (or nearly every day)
3-5 days per week
1-2 days per week
Less often
• Note: There was no significant correlation between the frequency with which car owners’ used of their car and their perceptions of their reliance on their car.
Uses of car
Page 28
Understand Car Insurance Research ReportJune 2014
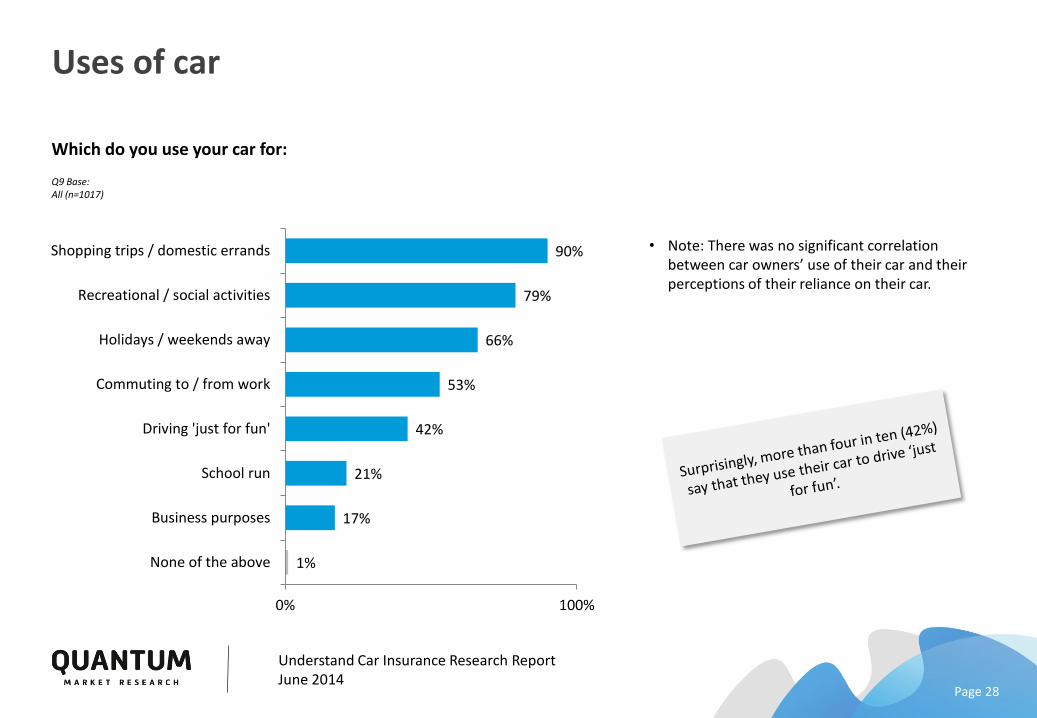
Which do you use your car for:
Q9 Base:All (n=1017)
90%
79%
66%
53%
42%
21%
17%
1%
0% 100%
Shopping trips / domestic errands
Recreational / social activities
Holidays / weekends away
Commuting to / from work
Driving 'just for fun'
School run
Business purposes
None of the above
• Note: There was no significant correlation between car owners’ use of their car and their perceptions of their reliance on their car.
Reliance on car
Page 29
Understand Car Insurance Research ReportJune 2014
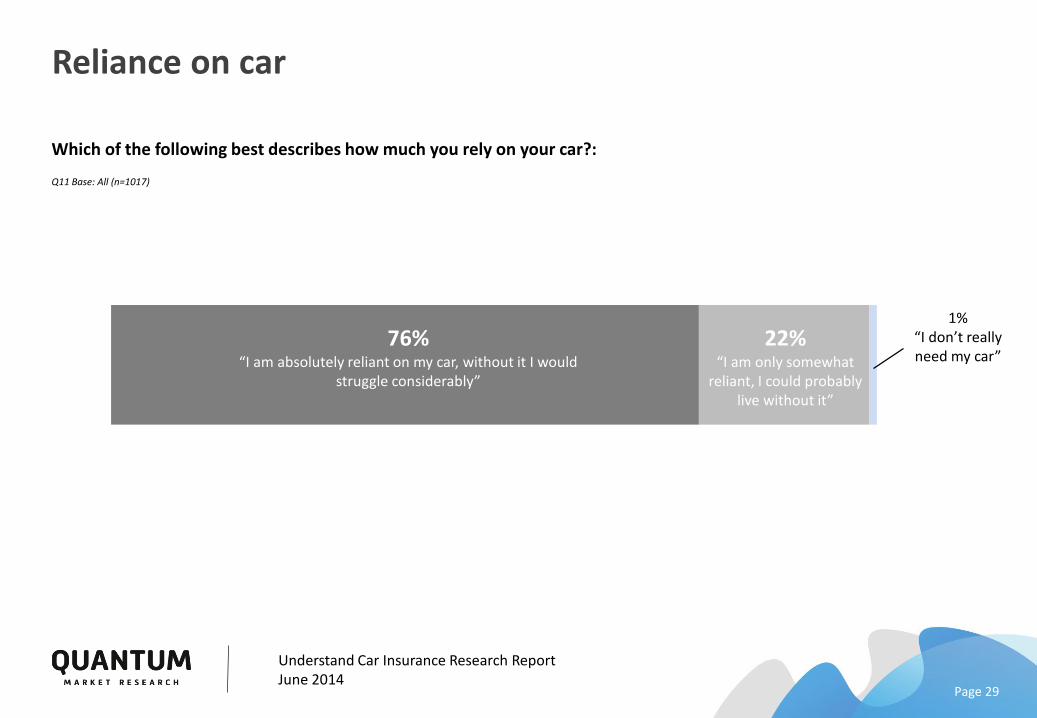
Which of the following best describes how much you rely on your car?:
Q11 Base: All (n=1017)
76%“I am absolutely reliant on my car, without it I would
struggle considerably”
22%“I am only somewhat
reliant, I could probablylive without it”
1%“I don’t really need my car”
Valuables left in car
Page 30
Understand Car Insurance Research ReportJune 2014
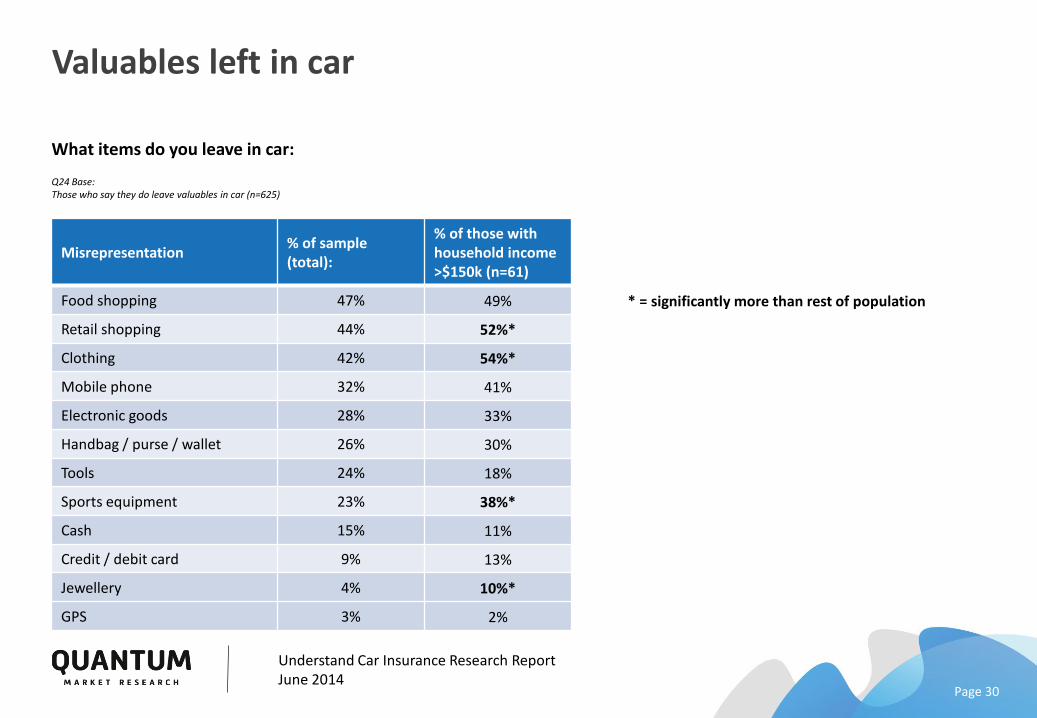
What items do you leave in car:
Q24 Base: Those who say they do leave valuables in car (n=625)
Misrepresentation% of sample (total):
% of those with household income >$150k (n=61)
Food shopping 47% 49%
Retail shopping 44% 52%*
Clothing 42% 54%*
Mobile phone 32% 41%
Electronic goods 28% 33%
Handbag / purse / wallet 26% 30%
Tools 24% 18%
Sports equipment 23% 38%*
Cash 15% 11%
Credit / debit card 9% 13%
Jewellery 4% 10%*
GPS 3% 2%
* = significantly more than rest of population
Prevalence of ‘dash-cams’
Page 31
Understand Car Insurance Research ReportJune 2014
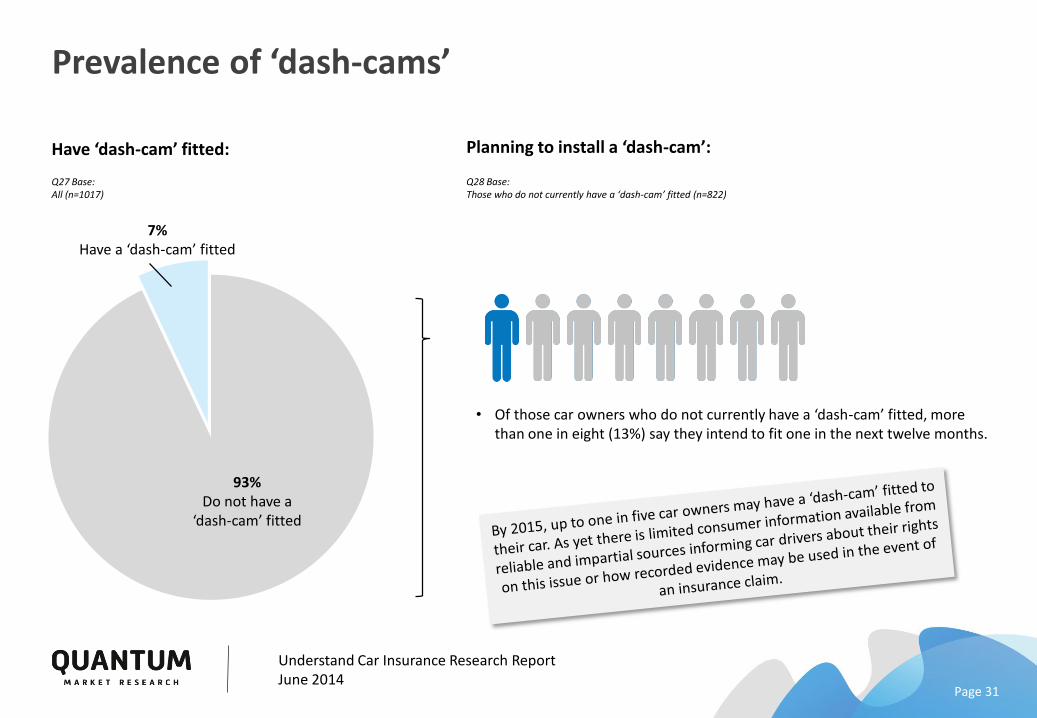
Have ‘dash-cam’ fitted:
Q27 Base: All (n=1017)
93%Do not have a
‘dash-cam’ fitted
7%Have a ‘dash-cam’ fitted
Planning to install a ‘dash-cam’:
Q28 Base: Those who do not currently have a ‘dash-cam’ fitted (n=822)
• Of those car owners who do not currently have a ‘dash-cam’ fitted, more than one in eight (13%) say they intend to fit one in the next twelve months.