understanding and engineering ion transport in conducting polymers
TRANSCRIPT

Understanding and engineering ion transport in
conducting polymers.
Eleni Stavrinidou
To cite this version:
Eleni Stavrinidou. Understanding and engineering ion transport in conducting polymers..Other. Ecole Nationale Superieure des Mines de Saint-Etienne, 2013. English. ¡ NNT :2013EMSE0711 ¿.
HAL Id: tel-00968227
https://tel.archives-ouvertes.fr/tel-00968227
Submitted on 31 Mar 2014
HAL is a multi-disciplinary open accessarchive for the deposit and dissemination of sci-entific research documents, whether they are pub-lished or not. The documents may come fromteaching and research institutions in France orabroad, or from public or private research centers.
L’archive ouverte pluridisciplinaire HAL, estdestinee au depot et a la diffusion de documentsscientifiques de niveau recherche, publies ou non,emanant des etablissements d’enseignement et derecherche francais ou etrangers, des laboratoirespublics ou prives.

NNT : 2013 EMSE 0711
THÈSE
présentée par
Eleni STAVRINIDOU
pour obtenir le grade de
Docteur de l’École Nationale Supérieure des Mines de Saint-Étienne
Spécialité : Microélectronique
LA COMPRÉHENSION ET L’AMÉLIORATION DU TRANSPORT
IONIQUE DANS LES POLYMÉRES CONDUCTEURS
soutenue à Gardanne, le 16 octobre 2013
Membres du jury
Président : Georges
HADZIIOANNOU
HDR, Professeur, Université de Bordeaux 1,
Bordeaux
Rapporteurs : John DE MELLO
Yvan
BONNASSIEUX
Professor, Imperial College, London
HDR, Professeur, Ecole Polytechnique, Paris
Examinateur(s) : Nicholas A.
MELOSH
Associate Professor, Stanford University, CA-USA
Directeur de thèse : George G.
MALLIARAS
HDR, Professeur, Ecole Nationale Supérieure des
Mines, St-Etienne
Co-Encadrant : Sébastien SANAUR Maître Assistant, Ecole Nationale Supérieure des
Mines, St-Etienne


In memory of my dear father

i
Abstract
Many organic electronic devices for energy harvesting, storage, information display,
sensing and actuation rely on mixed (electronic and ionic) transport within a single organic
layer. Although electronic transport in these materials is relatively well understood, a
fundamental understanding of ion transport is missing, mainly due to the lack of a direct
method to assess ion mobility in the simultaneous presence of electronic conduction.
I developed a simple analytical model that describes ion transport in a planar junction between
an electrolyte and a conducting polymer film. When ions are injected in the film, holes recede,
leading to partial dedoping of the film. This is modeled by two resistors in series, an ionic one
for the dedoped part and an electronic one for the still-doped part. Analytical predictions can
be made for the temporal evolution of the drift length of ions and the current, variables that
could be assessed experimentally. A numerical model based on forward time iteration of
drift/diffusion equations is used to validate these predictions. Using realistic materials
parameters, I found that the analytical model can be used to obtain the ion drift mobility in the
film.
Furthermore I developed an experimental method in which its one-dimensional
geometry allows the application of the analytical model and leads to a straightforward
estimation of the ion drift mobilities in conducting polymers. Using planar junctions between
the prototypical conducting polymer film poly(3,4-ethylenedioxythiophene) doped with
poly(styrene sulfonate) (PEDOT:PSS) and various electrolytes I was able to inject common ions
and directly observe their transit through the film. PEDOT:PSS was found to support efficient
transport of protons, potassium, sodium and choline ions, consistent with the observation of
extensive swelling of the film in water. Crosslinking the film decreased its swelling and the ion
mobility. This method, therefore, paves the way for establishing the relationship between
structure and ion transport properties in this important class of electronic materials.
Understanding the high correlation of hydration and ionic conductivity enables us to
engineer materials with high and defined ion mobilities. As an example collaborators from
Monash University developed blends of poly(3,4-ethylenedioxythiophene) doped with tosylate
(PEDOT:TOS) and the hydrogel protein Gelatin. I characterized the ion transport in the films and
the composites showed enhanced ion mobility in comparison with the neat PEDOT:TOS. We

ii
were able to tune the value of ion mobility by adjusting the relative ratio of the hydroscopic
phase to PEDOT:TOS.
Finally I combined the moving front experiment with electrochemical impedance
spectroscopy. The impedance spectra were consistent with an equivalent circuit of a time
varying resistor that corresponds to ion transport in the dedoped region of the film in parallel
with a capacitor that is associated with charge separation at the moving front. Eventually this
work will lead towards a microscopic model of the impedance response of conducting
polymers.

iii
Resume
De nombreux dispositifs pour l’électronique organique et la bioélectronique reposent
sur le transport mixte (électronique et ionique) au sein d'une seule couche organique. Le
transport électronique dans ces matériaux est relativement bien compris, mais une
compréhension fondamentale du transport des ions est manquante. J'ai développé un modèle
analytique simple qui décrit le transport d'ions dans une jonction planaire entre un électrolyte
et un film de polymère conducteur. Le modèle permet des prédictions de l'évolution temporelle
du courant et de la «drift length» des ions. Ces prédictions sont validées par des simulations
numériques et en utilisant des paramètres réalistes, je montre que le modèle analytique peut
être utilisé pour obtenir la mobilité des ions dans le film. De plus, j'ai développé une méthode
expérimentale qui permet l'application du modèle analytique et conduit à une estimation
simple de la mobilité de différents ions dans les polymères conducteurs. Le PEDOT : PSS offre
un transport efficace pour les ions les plus communs, qui peut être mis en relation avec le
gonflement important du film dans l'eau. De plus, je montre que la réticulation du film diminue
son gonflement ainsi que la mobilité des ions. Comprendre la forte corrélation entre
l'hydratation et la conductivité ionique nous permet alors de développer des matériaux à
mobilité ionique définie et importante. A titre d'exemple, le réglage de la mobilité ionique du
PEDOT:TOS est présenté en ajustant le rapport relatif de la phase hygroscopique. Pour finir, j'ai
effectué des mesures de spectroscopie d'impédance électrochimique au cours d'une
expérience de «moving front», afin de proposer une interprétation physique des spectres
d'impédance mesurés à une jonction polymère conducteur /électrolyte.

iv
Acknowledgments
I am grateful for all the support and guidance I received over the last three years and for
my time in the Department of Bioelectronics. First and foremost I am grateful to my advisor
George Malliaras not only for giving me the opportunity to join his department and to explore
my interests but for his inspiring, encouraging, and supporting personality. He was always
willing to give me advice and guide me in my research and make me see the positive side of
things. Working with him has been a great honor and pleasure and I will always consider myself
lucky that I had the chance of having him as my advisor. I am also thankful to Sebastien Sanaur,
co-supervisor, for his advises and help. I am especially thankful to Roisin Owens, for her kindness
and exciting personality, always willing to help and give a fresh perspective on the matters.
Working in BEL has been a wonderful experience due to the great people in this department that
made work fun. I am thankful to all for making this research possible and for the great deal you
taught me. Special thanks to Pierre Leleux for the help with the simulations and for his expertise
in Labview and to Dion Khodagholy for his help with fabrication and experiments especially at
the beginning of my PhD. I would also like to thank the Post-Docs: Jonathan Rivnay, Leslie
Jimison, Esma Ismailova and Michele Sessolo for being always supporting and reassuring and
for their help to organize and advance my research. Last but not least I would like to thank the
best officemates Manue and Xenofon - we had a wonderful time together and you have always
been there for me.
I would like to thank collaborators from Monash University, Bjorn Winther-Jensen and
Orawan Winther-Jensen for giving me the opportunity to explore new materials, spend some
time in their lab in Monash University and learn about polymerization and electrochemistry. I
am also grateful to Manfred Lindau for his great advice, insight and kind support during his
sabbatical stay in our lab.
Without funding, however I would not have the opportunity to pursuit my dreams. I
gratefully acknowledge funding from Ecole Nationale Superieure des Mines de St. Etienne for
the graduate student fellowship and the EU MASK project for funding my stay in Monash
University.
I couldn’t do any of these without the support and love from my family and friends. My
mum Sophia for her relentless love, trust and support in all the decisions I make in my life, my
brothers Nicholas, Panicos and Harris for their support and for believing in me, my niece Marisia

v
and nephew Stavros for all the joy they bring to my life and the family of my aunt Sotiroula that
has been like a second family to me. Also my friends in Cyprus: Georgia, Froso and Anastasia for
always being there for me and my friends in Aix en Provence Xenofon, Chara, Galateia,
Romanos and Ariadni for their support and the great times we spent together.
Thank you for being there for me, thank you for helping me make my dreams come true!

vi
Contents
Abstract i
Résumé iii
Acknowledgments iv
1. Introduction ........................................................................................................ 1
1.1 Conducting polymers .............................................................................................................2
1.2 Electronic Properties of Conducting Polymers .....................................................................3
1.2.1 Doping ............................................................................................................................5
1.2.2 Charge carriers ..............................................................................................................6
1.2.3 Electrochromism ............................................................................................................8
1.2.4 Charge Transport in 3D ............................................................................................... 10
1.2.5 Charge carrier mobility ............................................................................................... 12
1.2.5.1 Time of flight (TOF) .......................................................................................... 13
1.2.5.2 CELIV ................................................................................................................ 14
1.3 Ion transport ....................................................................................................................... 16
1.3.1 Ion Transport in Solution ............................................................................................. 16
1.3.2 Ion Transport in Polyelectrolytes ............................................................................... 19
1.4. Moving Front Experiment: A Platform for studying ion transport in
conducting polymers ......................................................................................................... 24
1.5 Organic electronic devices that are based on mixed conductivity of
conducting polymers: focus on bioelectronics ................................................................... 30
1.5.1 Organic electrochemical transistor (OECT) ................................................................ 30
1.5.2 Ion pump .................................................................................................................... 32
1.6 References .......................................................................................................................... 34
2. A simple model for ion injection and transport in conducting polymers ............... 38
2.1 Introduction ....................................................................................................................... 39
2.2 Analytical Model ............................................................................................................... 40
2.3 Numerical Model ............................................................................................................... 43
2.4 Results and Discussion ....................................................................................................... 45
2.4.1 Voltage Dependence .................................................................................................. 47
2.4.2 Ion Density Dependence ............................................................................................ 49

vii
2.4.3 Ion Mobility Dependence ........................................................................................... 51
2.5 Conclusions ........................................................................................................................ 53
2.6 References ......................................................................................................................... 54
3. Direct measurement of ion mobility in a conducting polymer .............................. 55
3.1 Introduction ...................................................................................................................... 56
3.2 Methods.............................................................................................................................. 58
3.2.1 Fabrication of Planar Junction .................................................................................... 58
3.2.2 Experimental Set Up ................................................................................................... 59
3.3 Results and Discussion ...................................................................................................... 61
3.3.1 Measurement of Potassium mobility in PEDOT:PSS .................................................. 63
3.3.2 Influence of crosslinking the PEDOT:PSS film on K+ mobility ..................................... 64
3.3.3 Swelling of PEDOT:PSS upon dedoping ...................................................................... 65
3.3.4 Determination of injected cation density in PEDOT:PSS ............................................ 66
3.3.5 Effect of electrolyte concentration on ion mobility in PEDOT:PSS ............................. 66
3.3.6 Effect of applied voltage on ion mobility in PEDOT:PSS ............................................. 67
3.3.7 Measuring the mobility of various cations in PEDOT:PSS .......................................... 67
3.3.8 Determination of hole mobility in PEDOT:PSS ........................................................... 69
3.4 Conclusions-Outlook .......................................................................................................... 69
3.5 References ......................................................................................................................... 71
4. Engineering ion transport in conducting polymers ............................................... 73
4.1 Introduction ...................................................................................................................... 74
4.2 Methods.............................................................................................................................. 76
4.2.1 PEDOT:TOS-Gelatin composites preparation ............................................................. 76
4.2.2 Fabrication of planar junction .................................................................................... 76
4.3 Measuring ion mobility in PEDOT:TOS-Gelatin composites .............................................. 78
4.4 Electronic conductivity of PEDOT:TOS-Gelatin composites .............................................. 80
4.5 Characterization of thermal behavior of the PEDOT:TOS-Gelatin
composites by Differential Scanning Calorimetry ............................................................ 82
4.6 Characterization of mass exchange with Electrochemical Quartz
Crystal Microbalance composites ...................................................................................... 83
4.7 Conclusions ........................................................................................................................ 86
4.8 References ......................................................................................................................... 87

viii
5. A Physical Interpretation of Impedance at Conducting Polymer/Electrolyte
Junctions ................................................................................................................. 88
5.1 Introduction ...................................................................................................................... 89
5.2 Methods ............................................................................................................................. 91
5.2.1 Experimental configuration ........................................................................................ 91
5.3 A physical model of impedance spectra at conducting polymer/electrolyte junction ..... 92
5.4 Conclusions ....................................................................................................................... 97
5.5 References ......................................................................................................................... 98
6. Conclusions – Outlook ....................................................................................... 100
A. Appendix .......................................................................................................... 104
Publication List ............................................................................................................. 107

1
Chapter 1
1. Introduction
In this chapter I give an overview of the theory and background necessary for understanding the
scientific achievements of this thesis. It is not meant to be an extensive review of the literature,
but more of an introduction on the basic concepts met up in the experimental work in order to
put the scientific results into context. The thesis deals with ion transport in conducting polymers,
materials that have found application in organic electronics and more recently in organic
bioelectronics. Conducting polymers conduct both electronic and ionic carriers and a variety of
devices utilize this key property. Although electronic transport has been widely studied and
advanced theories have been developed, a fundamental description of ion transport is missing. I
begin with an overview of electronic properties of conducting polymers and charge transport
theories, as well as experimental techniques for measuring electronic mobility. I present a
physicochemical description of ion conduction in liquid electrolytes followed by an overview of
ion transport in polymer electrolytes. Then a presentation of a promising method for studying
ion transport in conducting polymers that has a major role in this thesis is given. Finally I present
devices that are based on the mixed conductivity of conducting polymers with focus on
bioelectronics.

2
1.1 Conducting polymers
Conducting polymers have unique characteristics, combining electronic properties of
semiconductors and metals and mechanical properties of polymers. They were discovered in
1976 by Alan MacDiarmid, Hideki Shirakawa and Alan J. Heeger with the enhancement of
conductivity of polyacetylene by seven orders of magnitude after doping with iodine [1.1, 1.2].
In 2000 they were awarded the Nobel Prize in Chemistry. Their discovery followed synthesis of
numerous materials such as polypyrrole, polyaniline, polythiophene and their derivatives. Great
research has been done in tuning their properties during synthesis, characterization and
processing as well as understanding the fundamental mechanisms of their properties [1.3, 1.4].
During the 1980s organic electronic materials have found application in electrophotography
[1.5]. Ten years later efficient electroluminescence was observed and the first organic light
emitting diode was fabricated opening the era of Organic Electronics [1.6, 1.7]. Afterwards
organic thin film transistors and organic photovoltaics were developed. OLED, OTFT and OPVs
consist the “big three” of Organic Electronics and their development became the subject of
intense research during the 1990s. Today OLEDs have the most matured technology with
products already in the market from Sony and Samsung. Although research still goes on in these
three applications, especially in optimization of OPVs a new trend has emerged, the interface of
organic electronics with biology [1.8, 1.9]. Conducting polymers are ideal materials for
interfacing with cells due to their soft nature. Their mechanical properties are compatible with
tissue and their ability to conduct ions in addition to electrons and holes opens up a new
communication channel with biological units due to the importance of ion fluxes in biological
systems. In addition van der Waals bonding allows good interfacing with electrolytes without
dangling bonds or oxides [1.8]. The term of Organic Bioelectronics was introduced by Berggren
and Ricther-Dahlfors in their seminal review [1.8] and describes the coupling of organic
electronic (and optoelectronic) devices with objects from the biological world, a coupling that
works in two directions (figure 1.1[1.9]). Recent trends in the field of organic bioelectronics are
presented in the review of Owens and Malliaras [1.9]. Numerous application of conducting
polymers in organic bioelectronics have been reported including: biosensors (glucose sensing
[1.10, 1.11], multianalyte sensing [1.12], barrier tissue integrity [1.13] based on Organic
Electrochemical Transistrors (OECTs) [1.14]), biofuctionilized and biodoped polymers for tissue
engineering [1.15, 1.16], smart Petri dish for promoting or prohibiting cell adhesion [1.17],
electrically stimulated cell growth on conducting polymers surfaces [1.18, 1.19], devices for

3
establishing controllable cell density gradients that will lead to development of 3D
electroresponsive scaffold [1.20-1.23], ion pumps for controlled release of biochemicals [1.24,
1.25], tools for neuroscience; microelectrodes coated with conducting polymers for recording
and stimulating neurons and neural networks in vivo [1.25-1.29], a conformable electrode
[1.30] and OECT [1.31] array with conducting polymer as active material for in vivo recording of
brain activity.
Figure 1.1: A cartoon showing the scope of organic bioelectronics. Biological moieties, including cells,
micro-organisms, proteins, oligonucleotides, and small molecules, can be interfaced with organic
electronic devices to yield biosensors, medical diagnostics, tools for biomedical research, and
bioelectronic implants that will have a major impact in health care. [1.9]
1.2 Electronic Properties of Conducting Polymers
The electronic properties of conducting polymers arise from their bonding
configuration. Carbon is the main atom in the backbone of the polymer chain. Carbon has four
valence electrons with 2s2p electron configuration. When two carbon atoms are bound their
valence electrons form molecular orbitals. In a conducting polymer chain we have sp22pz
hybridization. That means that each carbon has three sp2 orbitals in plane to form covalent
bonds while the pz electron is unpaired and the orbital is perpendicular to the plane [1.32]. In
order to have a more comprehensive picture let us take the classic example of polyacetylene,
the simplest representative of conducting polymers. In polyacetylene each carbon atom forms

4
three covalent σ bonds through sp2 orbitals with two neighboring carbon atoms and one
hydrogen and one π bond from overlapping of the non-hybridized pz orbitals of adjacent atoms.
By increasing the number of the atoms in the polymer chain the overlapping of pz orbitals
extends, therefore instead of having discrete energy levels we have the formation of a band.
One would expect that since we have N atoms with N pz electrons and each state can be
occupied by two electrons of different spins the π band would be half filled and polyacetylene
would be a 1D metal [1.32]. In reality this structure is not stable energetically and as Peierls
predicts in its distortion theorem [1.33] we have dimerization (the unit cell now has two carbon
atoms) that leads to the alternation of the single double bond of the π band [1.34].
Consequently the band splits in π and π* band resulting the formation of the band gap. The π
band can take Ν electrons thus is full filled like the valence band while the π* is empty like the
conduction band in inorganic semiconductors. In molecular orbitals terminology the valence
band corresponds to the HOMO (Highest Occupied Molecular Orbital) and the conduction band
to the LUMO (Lowest Unoccupied Molecular Orbital) [1.35]. The alternation of the single
double bond is called conjugation and conducting polymers are also called conjugated
polymers. Therefore conjugated polymers if they are not doped they have semiconducting
properties. The band gap depends upon the molecular structure of the repeat unit thus design
in molecular level can tune the band gap of the material.
Figure 1.2: Relationship between the energy levels of ethylene, butadiene, hexatriene, octatetraene and
polyacetylene around Fermi level, illustrating the buildup of the polymer’s electronic structure. Bold line
represents the π orbitals and dashed line the σ orbitals. [1.32]

5
1.2.1 Doping
In order to enhance the conductivity of organic semiconductor and achieve even
metallic properties, the material needs to be doped. In organic semiconductors doping process
is different than in inorganic semiconductors. In inorganic semiconductors the doping is
achieved by substitution of an atom of the lattice with an impurity-atom that has a different
number of valence electrons. The dopant atom can be donor (for n-type doping) or acceptor of
an electron (p-type doping). Only few ppm of dopant atoms are enough to sufficiently increase
the conductivity of the inorganic semiconductor [1.36]. Usually the dopant atoms are
introduced to the structure by ion implantation. In organic semiconductor the doping changes
the physical structure of the material. It does not substitute an atom of the semiconductor but
is introduced as a separate unit that forms an ionic complex due to exchange of electrons with
the organic semiconductor. In this way a positive or negative charge is created and this charge
is counter balanced by the oppositely charged dopant [1.37]. In the following section the
different kinds of charge carriers in organic materials will be discussed. A large amount of
dopant is required in order to enhance the conductivity of organic semiconductors (more that
10%). The amount of dopant introduced in the material defines its conductivity but there is no
straightforward relationship between them. A physical description of the doping process
therefore remains challenging [1.38]. In addition, in organic semiconductors the dopant can be
mobile. Most conjugated polymers can be doped efficiently p type while n type doping can be
destructive. Dopants for conducting polymers can be ions, charged small molecules or
polyelectrolytes. The dopant can be introduced during synthesis, during electrochemical
switching or by diffusion. PEDOT, a conducting polymer of prime interest in this thesis, is a
derivative of polythiophene and is mainly doped by polystyrene sulfonate (PSS), a polyanion or
tosylate (TOS), a small molecule [1.39]. In Fig. 1.3 the structure of PEDOT:PSS is shown. The
sulfonate group in the PSS chain takes one electron from the PEDOT backbone creating a
positive charge. The charge is not localized in one monomer but extends over few monomers
creating the polaron. Under application of voltage the polaron moves along the backbone while
the charged sulfonate group remains immobile.

6
Figure 1.3: PEDOT:PSS structure, showing the formation of a polaron (red) on PEDOT backbone, that is
compensated by a negative sulfonate group (blue) on the PSS chain.
1.2.2 Charge carriers
Doping of conducting polymers introduces charge carriers. The charge bearing species
are not free electrons and holes but quasi-particles, coupled charge-lattice deformation entities
as a result of the soft nature of organic semiconductors. Conducting polymers can be
considered as quasi one dimensional since along the chain we have a strong covalent bonding
while interactions between different chains are of Van der Wall type. The charged species are
self-localized, the presence of electronic charge leads to local changes in the atomic geometry
(the lattice) which in turn leads to localized changes in the electronic structure [1.40].
Associated with charge carriers are localized electronic states with energy levels that arise in
the band gap. We can divide conducting polymers to two major categories, the ones with a
degenerated ground state and the ones with a non degenerated ground state [1.35,1.37].
Trans-polyacetylene has a degenerated ground state, that means that two geometric structures
that correspond to the ground state have exactly the same energy. The two structures differ
from one another from exchange of the single double bond alternation. For these systems the
charge carrier is a soliton. If we remove one charge from the chain then a boundary between
the two structures is formed that represents a neutral soliton with spin ½. It’s name comes
from solid state physics where the soliton is the quasi particle of a solitary wave that can
propagate without dissipation or deformation [1.36]. The soliton is not localized in one
monomer but expands over several carbons. If we remove two electrons from the backbone

7
then we have the formation of a spin-less positive soliton. While in the case of two negative
charges we have the formation of the negative soliton [1.37].
Figure 1.4: (a) Bond alternation defect on trans-polyacetylene. Note that A and B phases are
degenerated. (b) Neutral and charged mid-gap soliton levels [1.37]
Unlike trans-PA most of conducting polymers, polithiophene, polyaniline, polypyrrole
and derivatives have a non-degenerate ground state that corresponds to a single geometric
structure, the aromatic structure. Regarding the ground state the aromatic structure is
energetically favorable than the quinoid structure. In these systems the charges are polarons
and bipolarons. If we remove an electron from the system then we have the formation of a
polaron that delocalizes in a number of monomers resulting a change in the structure from
aromatic to quinoid because the ionized quinoid structure has lower energy (Fig. 1.5a). The
polaron is the complex of the charge with the deformation of the lattice. If we remove two
electrons then we will have the formation of a bipolaron instead of two independent polarons
since it is energetically favored (Fig. 1.5b). The bipolaron has no spin and is doubly charged. Due
to the charges we will have the formation of states in the band gap. By increasing the number
of charges with doping we have the formation of the polaronic band in the band gap. In low
doping levels spin is observed from Electron Spin Resonance signals suggesting the formation of
polarons, while in high doping levels no spin is observed suggesting the formation of bipolarons
[1.41].

8
Figure 1.5: Formation of polaron (a) and bipolaron (b) in PEDOT chain after the removal of one and two
electrons respectively. The formation of the bipolaron instead of two independent polarons is
energetically favored.
In highly doped conducting polymers the properties resemble more a metallic behavior.
This can be understood in the scheme of degenerated doped system where the broadening of
the bipolaron states in the band gap upon increasing dopant concentration eventually leads to
the merging of the lower and upper bipolaron bands with the VB and CB respectively. This
results in a new unfilled VB with the Fermi level below the edge of the band and a metallic
behavior [1.32, 1.34, 1.35,1.37, 1.41].
1.2.3 Electrochromism
The optical properties of materials are defined by their electronic structure, with the
band gap determining the intrinsic optical properties, transition from π to π* band. Doping the
materials changes the electronic structure with extra states that appear in the band gap, thus
electronic transitions in lower energies are allowed, and the absorption is shifted in higher
wavelengths. Since conducting polymers have their band gap in the visible range of the
spectrum (1-3eV) when doped it will be shifted towards IR. The absorption spectrum is the
signature of the color of the material, thus the same material in different doping states appears
with different color. This is described as the electrochromic phenomenon. Conducting polymers
offer an advantage over other materials due to their high degree of color tailorability. Through
structural modification the band gap can be tuned yielding color changes of both doped and
undoped form. In Fig. 1.6 the absorption spectrum of PEDOT is shown for different doping
states, during electrochemical switching. The polymer film is deposited on an electrode and is

9
mounted in an electrochemical cell. The doping state of the material changes by applying
voltage to the film and injecting/extracting holes while ions are exchanged from the electrolyte
in order to preserve electroneutrality in the film. The color of PEDOT is dark blue in the
undoped state (reduced state) while it turns to light semitransparent blue when in its doped
state (oxidized state). The bandgap is around 1.6-1.7 eV and in its undoped state it has a broad
absorption peak at λmax 600 nm. As the material is getting doped the absorption peak
becomes less and less strong and absorption is observed in higher wavelengths in the NIR and
IR range of the spectrum [1.42, 1.43]. Electrochromism of PEDOT was examined extensively by
Inganas et al. in the frame of ion transport [1.44, 1.45]. Studying the absorption spectra during
switching of the polymer in a solid state electrochemical cell, they find out very fast switching
time from fully colored state to fully bleached state in 4s and stability upon repeated switching.
They argued that is due to fast ion transport from the electrolyte to the polymer matrix during
reduction and from the polymer to the electrolyte during oxidation. Although they were not
able to have a Raman signal for the cation movement due to high Raman signal of the polymer
they excluded all the other mechanisms. The idea that PSS is moving during the switching
process seemed likely impossible due to its polymeric nature that would exclude fast switching
times. Also the fact that the cyclic voltammetry is identical in repeated cycles suggested that
the switching is due to cation movement [1.43]. In a consequent work they performed fast
optical spectroscopy in PEDOT with detectors along the film. The time resolution was in the
order of a second. The transmitted intensity of a laser with a wavelength close to the band gap,
was recorded as a function of time and position after the application of voltage for changing
the doping state of the material [1.45].

10
Figure 1.6: Absorbance spectrum of PEDOT in different doping states. The change is the absorption is due
to extra states that appear in the band gap. Adapted from [1.42]
1.2.4 Charge Transport in 3D
Until now we considered the one dimensional transport in a single polymer chain.
When increasing the degrees of freedom from 1D to 3D unlike inorganic semiconductors we
don’t have the formation of a well ordered crystal structure but we have a disorder system due
to chemical and physical defects. In disordered materials, charge carriers are localized on
molecular sites (molecules or polymer segments) due to the presence of energetic and
positional disorder. Charge transport occurs by hopping from one site to the other and is
thermally activated.
To describe charge carrier transport in 3D Bassler introduced the Gaussian distribution
of density of states arising from the statistics that govern the orientation of the transport sites
(adjacent molecules or polymer segments) [1.46]. The disorder can be positional and energetic.
Charge carriers are localized in molecular sites (molecules or polymer segments) and charge
transport is realized between localized states by thermally assisted hopping. Although many
models have been proposed for energetic and positional disorder the one of Bassler and co-
workers is the most comprehensive one [1.47]. The Gaussian distribution argument is
supported by the inhomogenously broadened features in the absorption profiles of polymers
and organic glasses. The hopping sites can be considered completely localized since between
them they are coupled by weak Van der Wall bonding. Therefore the distribution of energy
states takes a Gaussian profile since it depends on a large number of configuration coordinates.

11
In an energy matrix the energies appear on the diagonal therefore energetic disorder is often
called diagonal disorder. The origin of energetic disorder is the fluctuation of the lattice
polarization or the distribution of segment lengths on the π bonded polymer chain. Off diagonal
disorder describes positional disorder thus fluctuations of inter-site distances. The basic
assumptions of the formalism are
• Distributions of site energies and distances are Gaussian.
• The hopping rates can be described by Miller-Abrahams formalism originally proposed
to describe low temperature impurity hopping in semiconductors.
• The electron phonon coupling is sufficiently weak for polaronic effects but strong
enough for coupling to the heat bath.
• The process is incoherent characterized by the loss of phase memory after jump.
There are no analytical solutions for the Gaussian DOS, therefore predictions of the
disorder formalism have been largely developed by Monte Carlo (MC) simulations. MC
simulations can be considered as an ideal experiment where the test sample can have any
degree of disorder. It gives the opportunity to determine which level of sophistication is
required to produce the properties of the real world samples and by comparison with theory,
to check the validity of approximations in analytical treatments that are based on physical
properties. The dependence of mobility in system with Gaussian disorder was studied as a
function of temperature and electric filed. The temperature dependence follows a non
Arrhenius dependence like thermally assisted hopping would suggest but a dependence of
�~exp(−��) where � ≡ ���⁄ and the width of the Gaussian. In practice is difficult to
define the dependence due to the relatively small range of temperatures. The mobility
increases with field in high fields as �~exp(�√�) a Poole –Frenkel relation, although when
positional disorder is dominant the mobility can decrease with increasing field.
One parameter that was overlooked in charge transport theories of disorder systems
was the charge carrier density. Experiments on Light Emitting Diodes (LEDs) and Field Effect
Transistors (FETs) with the same polymer as active material showed that mobility can differ up
to three orders of magnitude between the two types of devices. This could only be explained by
taking into account a strong dependence of mobility in charge carrier density. The exponential
density of states which consistently described the field effect measurements where high charge
carrier density existed have been shown to be a good approximation of the tail states of the
Gaussian in the energy range where the Fermi was varied [1.48]. Pasveer et al developed a

12
model that takes into account the charge carrier density effect on mobility [1.49]. From a
numerical solution of the master equation for hopping transport in a disorder system with a
Gaussian density of states they determined the dependence of charge carrier mobility on
temperature, carrier density and electric field. They showed that the mobility dependents
strongly on both, charge carrier density and electric field at low temperatures (low values of the
reduced disorder parameter). The simulation data were fitted by an expression of mobility that
is a product of two functions, one that depends on temperature and charge density and
another that depends on temperature and electric field.
�(�, �, �) ≈ �(�, �)�(�, �) (1.1)
Good agreement with experiment was observed in the whole range of charge density values.
The impact of increasing the charge carrier density is to fill the tail states of the Gaussian
distribution. Experimental current density/voltage curves suggests that one can take into
account only the charge carrier dependence at room temperature while at low temperatures it
is necessary to take into account the field dependence as well [1.50]. However, it is hard
experimentally to separate the influence of E and p on the charge carrier mobility, since more
carriers will be injected at higher electric field.
1.2.5 Charge carrier mobility
Mobility is defined as the drift velocity of the carrier in the unit of electric field. It
defines how efficiently a charge carrier moves from one transport site to the other without
being trapped or scattered. The mobility of the carrier is a key parameter for understanding
transport phenomena since defining experimentally the dependence of mobility with internal
and external parameters allows validation of theories of charge transport. Mobility depends on
molecular packing, disorder, presence of impurities, electric field, temperature, charge carrier
density and pressure [1.51]. In addition it gives a signature for the type of transport, time
independent mobility suggests non dispersive transport while time dependent mobility
dispersive transport [1.47]. There are several techniques for measuring mobilities in organic
semiconductors such as: Time of Flight, CELIV, Field Effect Transistor Configuration and Diode
Configuration. Below I will give an overview of the TOF and CELIV method.

13
1.2.5.1 Time of flight (TOF)
The basic method for measuring electronic mobility in organic electronic materials is
the Time of Flight. It was first described by Haynes and Shockley (1951) and Lawrance and
Gibson (1952) and first applied in polymers by Vannikov (1967) [1.47]. The principle of the
method relies on measuring the time for a sheet of carriers generated by a short light pulse to
transit the sample of known thickness. A schematic of a typical set up is shown on Fig.1.7.
Figure 1.7: Schematic of a TFO experimental set up. The film is sandwiched between two electrodes and
the light pulse creates a sheet of carriers in the film. The transient of the carriers is monitored through
the current.
The sample, of typical thickness (L) 10-50μm thickness is sandwiched between two electrodes
with one being transparent. Voltage is applied between the electrodes and a sheet of carriers
(electron-hole pairs) is generated near the surface of one electrode by a short laser pulse. The
wavelength of the laser should be chosen in order to be highly absorbed by the sample and to
have an absorption depth much smaller than the thickness of the sample. Either electrons or
holes are extracted immediately at the exposed electrode while the opposite carriers have to
migrate across the sample to reach the other electrode. As the carries migrate across the
sample a displacement current is generated that is detected on the external circuit. Ensuring
that the time constant RC of the circuit is much smaller than the transit time the measured
current will be proportional to the photocurrent due to carrier displacement. The transit time
(ttr) of the carrier is defined as the time when the carriers exit the sample at the collecting
electrode and sharp decrease of the current is observed. Assuming constant velocity = "/$%&
and linear potential drop � = '/" in the sample the mobility is given from relationship
Light pulse
OSC
R
V

14
� = ()%*+, (1.2)
In order to ensure that the field is not disrupted in the sample as the carries transit, a small
amount of carriers should be generated comparing with the charge density of the sample. A
sharp signal is obtained in the case of ordered materials while in disordered systems
broadening of the signal occurs due to a distribution of transit times across the material. [1.46,
1.47, 1.51].
1.2.5.2 CELIV
Although TOF is the most common technique for measuring electronic carrier mobilities
in organic electronic materials it has some limitations and it cannot be applied in highly
conducting materials. In highly conducting materials where the number of equilibrium carriers
is sufficient for significant redistribution of electric field within time shorter than transit time
the generated pack of carriers disappears before its arrival to the opposite electrode. An
alternative to TOF that can be applied to highly conducting materials is a technique called CELIV
and has been developed by G. Juska, K. Arlauskas, and M. Viliunas in 1999 [1.52]. It was first
applied in microcrystalline Si as a proof of concept but later it was used to study conjugated
polymers [1.53]. The basic principle is the application of two consecutive pulses of linearly
increasing voltage and follow current transients related to extraction of equilibrium carriers.
The experimental set up is very simple and it consists of an oscilloscope, the sample and a
function generator. The sample (few hundreds nm thickness) is sandwiched between two
electrodes which one of them should be blocking. When the linearly increasing voltage is
applied equilibrium carriers are extracted without injection since one of the electrode is
blocking. The extracted charge is equal to the difference of these two transients for sufficiently
small delay between the pulses. Increase of the delay between the pulses allows the study of
the recovery of equilibrium. The second pulse is also important for identification of non-ideal
conditions (for example, no perfectly blocking contact). The extraction current is calculated
based on the continuity, current and Poisson’s equations. With the application of the voltage
the current starts increasing from a non zero value. This initial step, j0, is due to the geometrical
capacity of the sample. The extraction current ∆. = .% − ./ is caused by the conductivity of the
sample and the bulk conductivity can be estimated, without interference from the contact
barriers according to

15
= 0112∆3�%45632 (1.3)
From the time to reach maximum current tmax the mobility of equilibrium carriers can be
extracted by the equation (1.4)
� = �7)08%456) 9:;/.0=∆>>2?
(1.4)
Where d is the thickness of the sample, and A the cross section area.
Figure 1.8: Schematic illustration of the CELIV method. U is the applied voltage to the sample, j is the
corresponding current transient. Full line (a) corresponds to ideal contact blocking and no recovery;
dashed line (b) is calculated for partial equilibrium recovery. The inset illustrates schematically the band
diagram of the typical device.[1.52]
16
1.3 Ion transport
Ion transport has been extensively studied in liquid electrolytes in dilute and
concentrated systems and in polyelectrolytes and especially ion exchange membranes. Below I
will give an overview of the transport properties of these systems.
1.3.1 Ion Transport in Solution
Electrolytes are substances that have mobile ions and they are used as sources of ions.
They can be liquids, gels and solids. We have two types of liquid electrolytes, strong and weak.
In strong electrolytes we have full ionization of the dissociated species, like in the case of ionic
solids and strong acids. In weak electrolytes the species are not fully ionized in solution but the
degree of ionization depends on the concentration of the electrolyte [1.54]. Ions in solution
interact with water molecules, because of the interaction of the ionic charge with the electronic
dipoles of the water molecules. Therefore each ion is surrounded by a number of oriented
water molecules that define its hydration sphere. The water molecules in the vicinity of the
hydration sphere are partially oriented forming the secondary hydration layer [1.53]. Debye
and Huckel in 1923 gave a physical description of an electrolyte. Assuming one reference ion
with a discreet charge, the water molecules are described as a continuum medium with
dielectric constant of water and the rest of the ions as a continuum distribution of charge
around the central ion due to coulomb interaction between the ions. The charge distribution
has total charge equal and opposite to the charge of the reference ion. The charge distribution
around the central ion defines the ionic atmosphere and depends on the concentration of the
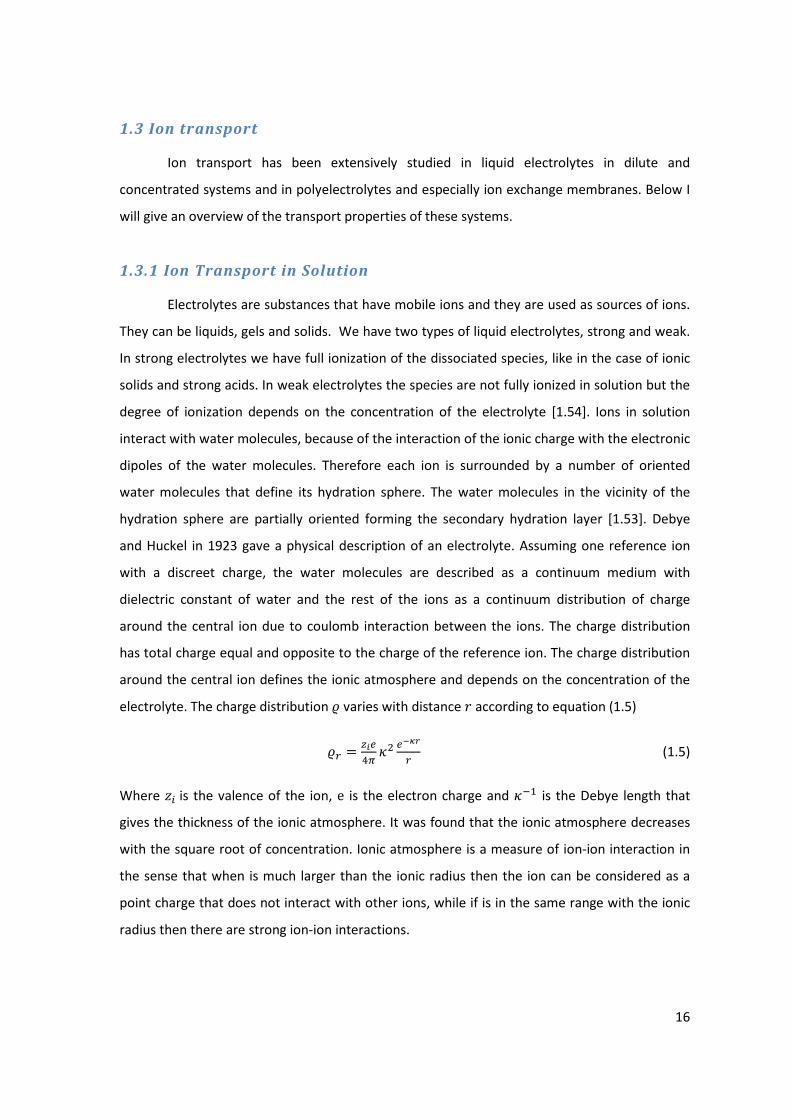
electrolyte. The charge distribution B varies with distance C according to equation (1.5)
B& = DEFGH I� F
JK+& (1.5)
Where LMis the valence of the ion, e is the electron charge and IN: is the Debye length that
gives the thickness of the ionic atmosphere. It was found that the ionic atmosphere decreases
with the square root of concentration. Ionic atmosphere is a measure of ion-ion interaction in
the sense that when is much larger than the ionic radius then the ion can be considered as a
point charge that does not interact with other ions, while if is in the same range with the ionic
radius then there are strong ion-ion interactions.

17
Ions in solution are transported via three mechanisms: diffusion, drift and convection. If
convection is negligible the transport of ions under the influence of a concentration gradient
and an external electric field is given by Nernst-Plank equation
. = .7MOO + .7&MO% = −Q∇c + T�∇U (1.6)
Where:
j: flux (or current density), D: diffusion coefficient, c: concentration, e: electron charge, μ: mobility φ:potential
Convection is the transport of ions due to a flow of the electrolyte that is induced by
external force for example by stirring the solution. Diffusion is described by Fick’s law where
the flux is proportional to the concentration gradient. Ions tend to move towards the area with
the lowest concentration in order to reduce the concentration gradient and bring the system to
equilibrium.
Drift occurs when an external field is applied. The Coulomb force will act on the ion and
the ion will move in the direction of the electric field. The ion will accelerate but because of its
speed a frictional force will act on it on the opposite direction. The frictional force is given by
Stokes formula. When the two forces will be equal and opposite, the total force acting on the
ion will be zero and the ion will continue its motion with a constant speed, the drift speed. In
this case we assume that the ion is not interacting with other ions. The mobility of the ion is
defined as the drift speed in the unit of the electric field.
� = [\ = F
=H]^ (1.7)
Where _ the radius of an ion and ` the viscosity of the electrolyte.
From relationship (1.7) one would expect that ion mobility decreases with solution viscosity and
ion size. This is true for bulky ions but not for small ions. The mobilities of alkali metals increase
from Li+ to Cs
+ even though the ionic radius increases [1.54]. This is due to the smaller
hydrodynamic radius, ion drags along fewer water molecules. Small ions give rise to higher
electric field due to their small radius and therefore are more extensively solvated than bigger
ones. There is a balance between size and electric field of ion. Proton shows higher mobilities
not only due to its small size but because it moves with two type of mechanisms the
conventional and the Grotthuss mechanism. According to the latter the proton “hops” between

18
water molecules with an on ongoing exchange of covalent and hydrogen bonds between O and
H atoms, leading to a net displacement of the positive charge.
The conductivity of electrolyte (σ) can be defined from the resistance of the solution
and the geometrical configuration. Usually the term molar conductivity (Λm) is used in order to
describe the conductivity of a molar of a substance.
Λc = de (1.8)
One would expect that molar conductivity would be independent of concentration (c) of the
electrolyte, therefore the parameterization with this quantity. This is not the case meaning that
the number of entities is not proportional to the concentration of electrolyte. In weak
electrolytes this is due to non-complete ionization of all the entities. In strong electrolytes
where all the entities are ionized this is due to strong ion-ion interaction, as the Debye-Huckel
theory predicts. Before the development of the Debye-Huckel theory, in the beginning of 19th
century, Friedrich Kahlraush showed that in low molar concentration the molar conductivities
of strong electrolytes vary linearly with the square root of concentration. This is called
Kohlrausch’law and is described by equation
Λc = Λc/ − Κ√ (1.9)
Where Λc/ is the limiting molar conductivity, thus the molar conductivity at zero concentration;
the contant K is found to depend more on the stoichiometry than the type of ion.
The conductivity of an electrolyte is due to both negative and positive ions. In the limit of
infinite dilution Kohlrausch establish the law of independent migration of ions that is
Λc/ = h;i; + hNiN (1.10)
where one can assume that ions migrate independently and where ionic conductivities i can be
determined, j is the stoichiometry of negative and positivies ions.
One can define the ionic mobility through the ionic molar conductivity using the relationship
� = kDl (1.11)
Where z: valence of ion, F: Faraday constant

19
Which can be reduced to the relationship used for electronic conductors
� = kDl =
d e⁄DFop =
dFq (1.12)
Where NA: Avogadro number, n: charge density
Therefore for an electrolyte the molar conductivity relates with mobility as below
Λc/ = (h;L;�; + hNLN�N)t (1.13)
In order to define the ionic conductivity from the molar conductivity of an electrolyte the
transport number (t) of the ion for that certain electrolyte should be known. The transport
number is defined as the ratio of the current of the specific ion u±, divided by the total current
I.
$± = x±x (1.14)
The most common method of defining transport number is the moving boundary method
where the motion of a boundary between two ionic solutions having a common ion is observed
[1.54, 1.55].
1.3.2 Ion Transport in Polyelectrolytes
Polymer electrolytes include electrolytes where one type of charges are bound in a
polymer chain and the other type compensates them in the form of counter ions.
Polyelectrolytes can be polyanions like polystyrene sulfonate (PSS) and polycations like
polyamine (PMA). The structures are shown in Fig. 1.9.

20
Figure 1.9: Structure of common polyelectrolytes, polyanion Sodium Polystyrene sulfonate (NaPSS) and
polycation Poly(diallyldimethylammonium chloride) (PDSA)
When a polar solvent is added complete dissociation of the counter ions occur and the
electrolytes supports ion transport. Due to their polymeric nature they form a viscous solution
in high concentrations.
Ion transport has been extensively studied in the polyelectrolyte Nafion, perfluorinated
sulfonic acid, Fig1.11a, that was discovered by Walther Grot of DuPont in the late 1960s. Nafion
type electrolytes are also called ion exchange membranes due to the fact that they form a
membrane when solvent is added to dissociate the ionic groups. Polyelectrolyte membranes
have a characteristic high selectivity when in contact with an electrolyte solution, they absorb
solvent molecules and counter ions (cations for polyanions and anions for polycations) but
exclude the co-ions (anions and cations respectively) due to repulsive forces between them and
the charged groups in the polymer chain. This is called the Donnan exclusion principle. The
selectivity is higher in low concentration electrolytes. Our understanding on the microstructure
of Nafion is based on the work done by Gierke and Hsu in early 1980s [1.56]. The membrane is
formed due to hydrophobic character of the fluorocarbon backbone and the hydrophilic
character of the ion exchange sites. Thus an inverted micellar structure is realized that results in
the formation of pores that are connected with narrower channels. When the membrane is dry
the average pore size is 1.8nm with 26 SO3- groups distributed in the inner surface. While when
it’s swollen the pore diameter is 4nm and the SO3- groups are around 70. The connecting
channels have an average size of 1nm. They also proposed the percolation theory for
correlation of conductivity and water content [1.57]. According to this theory there is critical
water content in the membrane below which ion transport is extremely low due to the absence
of extended pathways. Okada et al. showed that 50% of water molecules where associated with
SO3- primary level of hydration or protons and 50% is semifree in pores [1.58]. A modified

21
model for the microstructure is the random network model where we have formation of
random porous network due to the clustering of the side chains that end in the pendant
sulfonic acid group [1.59].
Figure 1.10: (a) Schematic view of the structure of Nafion as proposed by Gierke and Hsu [1.56], (b)
schematic view of the modified cluster network model [1.59]
Several approaches have been used to study the microstructure of Nafion, all of them
based on the structure proposed by Gierke and Hsu [1.60]. These include: structural
measurements, SAXS-Small Angle X-Ray Scattering, SANS-Small Angle Neutron Scattering [1.61-
1.64], water transport measurements [1.65,1.66], 2D diffraction patterns by direct Fourier
synthesis [1.67], theoretical modeling based on Monte Carlo simulations for different hydration
levels [1.68]. All the above resulted in a structure similar to the one proposed by Gierke and
Hsu and can be summarized in the structure shown in Fig. 1.11 for an intermediated water
context [1.69].
In Nafion the hydrophilic network is well connected with good percolation even at low
hydration levels. A third phase is introduced that is the transition region between the
hydrophilic and hydrophobic domain and consists of the side chains of Nafion. SAXS studies
showed progressive side chain unfolding with increase of hydration [1.70, 1.71]. Electronic
structure calculations have shown that only 2-3 water molecules per sulfonic acid group are

22
necessary for dissociation while when 6 water molecules are added separation of the
dissociated proton is observed [1.72-1.74]. The hydrophilic domains therefore contain water
molecules, protons that are mobile while anionic counter charge is immobilized.
Concerning the transport mechanism the general picture is that most of the mobile
protons are located in the center of the channel. Since the water in this area can be consider as
bulk, the proton transport mechanisms are the same as in water. Slowing down of protons and
water molecules with lower hydration levels is correlated to decreasing percolation in the
hydrophilic domain. At highest degree of hydration the major proton mechanism is structure
diffusion (Grotthuss mechanism). In more concentrated electrolytes the ratio of water
molecules to protons is smaller thus the intermolecular proton transfer and structural diffusion
is suppressed as seen in aqueous solutions [1.69].
Figure 1.11: (a) Chemical structure of perfluorinated sulfonic acid, Nafion. (b)Two dimensional illustration
of some microstructural features of Nafion for intermediate water content, adapted from [1.69]. (c)
Zoom in the highlighted area of (b), showing the minimum energy conformation of two-side chain
fragments of Nafion with six water molecules, showing the dissociation of both acidic protons, adapted
from [1.74].
The physical characteristics of the membrane have been widely studied as well [1.60].
One characteristic of the membrane is the ion exchange capacity that is the amount of charge
per gram that can hold. This is experimentally determined by titration. Typical values are 1-

23
2mequiv/gram (1equiv=1 mole of singly charged particles) [1.75]. The water content of the
membrane can be determined experimentally by weight gain in the membrane as a function of
relative humidity. There seems to be an increase in water molecules in proximity of 100% RH
(Relative Humidity) suggesting that a two stage hydration process exist, initially a distribution of
water molecules in the membrane matrix followed by redistribution within individual
microstructures [1.76]. Another useful parameter is the membrane void porosity that
represents the volume of free solution within the membrane per unit volume of wet membrane
and is also determined from the mass gain and the densities of dry membrane and electrolyte
[1.77]. The fixed ion concentration (moles of sites/unit volume of wet membrane) can be
calculated by the ion exchange capacity and volume increase [1.77]. The conductivity of the
membrane can be determined by AC or electrochemical impedance spectroscopy [1.77]. Most
of the conductivity studies are done as a function of relative humidity [1.76] since the amount
of water molecules present is the most important factor for complete dissociation and
transport of ions. From conductivity measurements and by determination of the concentration
of species from the ion exchange capacity and the water uptake of the membrane the mobility
can be determined [1.58, 1.78]. In addition diffusion coefficient of ions can be determined from
diffusion permeability experiments [1.79]. The great advantage of pure ionic conductors like
Nafion and other polyelectrolytes is that one type of carrier is present, making the analysis of
experimental data and modelling much more easier. The extensive structural characterization
of Nafion in combination with modeling and a variety of physical characterization gives a
certain understanding of ion transport.

24
1.4. Moving Front Experiment: A Platform for studying ion transport
in conducting polymers
Ion transport has been extensively studied in the context of liquid and polymer
electrolytes, using mostly conductivity and diffusion measurements. While these methods are
suitable for studying transport in a material that contains only ionic carriers, their application in
mixed conductors is challenging due to the simultaneous presence of electronic carriers. In
recent years, a promising technique was developed that involves measurements of changes in
the optical transmission of a film upon the injection of ions from an electrolyte. As organics are
electrochromic, ion injection and the resulting change in electronic carrier density alter the
optical absorption of the material. Transmission measurements can, therefore, be used to
follow the dynamics of injection and transport of ions in a polymer film. Aoki et al. [1.80],
Johansson et al. [1.81], and most recently Wang et al. [1.82, 1.83] have developed this
technique, called the “moving front” measurement. The geometries used in these experiments
were different, but were all 2D, meaning that ionic and electronic carriers moving in directions
perpendicular to each other. Below I give an overview of this work and how the moving front
experiment has evolved during the years.
Koichi Aoki in 1992 [1.80] introduced the moving front experiment to study transport
kinetics in polyaniline (PANI). The device geometry is shown in Fig. 1.12.
Figure 1.12 : Experimental set up for the moving front experiment of Aoki et al. (a) PANI film on a PMMA
substrate, (b) Pt plate, (c) H2SO4 solution, (d) counter electrode, (e) reference electrode, (f) microscope.
The electropolymerized film (0.5mm x 5mm) was detached from the conducting substrate and
mounted on a PMMA substrate. A Pt electrode was connected to the one side of the film that it
was immerse in an electrolyte (H2SO4) with a counter and a reference electrode. When positive
voltage was applied to the film in respect to the electrolyte, the film that was initially dedoped
(reduced), was doped (oxidized) with a doping front initiating from the electrode and
propagating along the film. The color of the film was becoming dark green. Using a microscope

25
on top of the electrochemical cell the propagation was monitored over time. They observed
that the kinetics of the front depend on the applied voltage having a faster propagation with
increasing potential. For voltage higher than 0.85V Vs SCE (Saturated Calomel Electrode)
overoxidation was observed. The shape of the boundary was not always parallel on the edge
complicating the analysis of the propagation kinetics. In addition the shaped varied with the
type of the contact and from sample to sample. This possibly had to do with edge effects. The
length of the conducting zone was proportional to time only at the very beginning and then
slowed down. The results were discussed in terms of charge transfer rate where the
propagation speed was treated as a rate constant of conversion and it was found equal to 5 10-
5 m/s. The speed was calculated using the electrochemical model of charge transfer (Butler-
Volmer and Tafel analysis). The formation of the boundary was discussed in terms of
intramolecular interface or intermolecular interface. The latter would suggest a diffusive
interface and not a sharp boundary indicating that intramolecular charge transfer is at least in
the same order of magnitude as intermolecular. In this work although the idea of the moving
front experiment and the use of electrchromism have been introduced there is no information
obtained about ion transport, but the results are mainly discusses in in terms of anodic process,
rate of oxidation of the film and electron transfer.

26
More than ten years of the initial work of Aoki and co workers, the group of Olle
Inganas published a work on the moving front experiment applied on poly(3-hexylthiophene)
P3HT [1.81]. In this work the film was not electropolymerized but solution processed. They used
the term lateral electrochemistry to describe their lateral configuration. The device geometry is
shown in Fig. 1.13.
Figure 1.13: Experimental set up of the moving front experiment by Johansson at al. (a) Top and (b) side
view. Typical dimension are: d (film thickness) 80 or 200nm, w (film width) 10-15 mm and xtot (total
length of the film) 5-15 mm. The Pt working electrode has a width of 1mm.
The polymer film is deposited on a glass substrate by spin casting after the pattering of a Pt
electrode at the side. The sample was mounted in an electrochemical cell that allowed the
recording of the moving front with a video camera. P3HT is a semiconductor but can reach high
conductivities when p-doped. In this work they examined the doping of the polymer starting
from the semiconducting state. When positive voltage is applied at the metal contact in respect
with the electrolyte holes are injected from the Pt to the film and at the same time negative
ions are injected in the film from the electrolyte in order to preserve electroneutrality. The film
from its dedoped state with red color was doped and its color became blue. This is a two
dimensional geometry. Ions and holes have different paths. Ions move perpendicular to the film
while holes move parallel to the film. The position of the front was determined by the obtained
images but with the subjectiveness of the experimentalist. They observed that the front was
initiating without any delay with the mid part of the front slightly ahead of the edges. The front
was not perfectly sharp between doped and dedoped area but the sharpness was more

27
prominent in higher voltages. Fig. 1.14 shows current density and front position as a function of
time respectively.
Figure 1.14: (a) Current density and (b) front position as a function of time for different applied
potentials. The arrows indicate the time when the front reaches the end of the polymer film.
They found a front speed proportional to t-γ
with γ (0.35-0.45) depending on the applied
potential. The results were discussed in terms of lateral electrochemistry where the
electrochemical model for charge transfer on the electrode was used to describe the current
dependence on voltage. In this work again there is no clear identification of ion transport.

28
Wang et al introduced a new geometry in the moving front experiment, still two
dimensional one [1.82, 1.83]. In this case the polymer film is polypyrrole doped with
dodecylbenzenesulfonate (PPyDBS). The film was deposited on an electrode and covered by an
ion barrier. Using photolithography a strip (0.3mm x 8mm) was patterned to ensure ion
transport only from the sides (Fig. 1.15a.).
Figure 1.15: (a) Device configuration that makes ion transport the rate limiting step during
electrochemical switching of a conjugated polymer. The polymer is patterned into a long, narrow stripe
over an electrode and is covered on the top side with a transparent ion-blocking layer. Ions enter and exit
the polymer from the long edges. The color of the film varies with its oxidation level, which cannot
change until charge-compensating ions arrive or leave. [1.83] (b) Intensity profiles at 30s intervals during
the first ever reduction at -1V vs Ag/AgCl. The arrow indicates the direction of the front movement over
time.[1.82]
The fact that this is a bottom electrode configuration means that the path of electronic carriers
is perpendicular to the film while ion’s path is parallel to the film and electrode. In this work
they examined both dedoping (reduction) and doping (oxidation) of the film. The sample was
mounted in an electrochemical cell with a counter and reference electrode. The film is in its
doped state and when voltage is applied is being dedoped by extraction o holes and injection of
cations in order to preserve electroneutrality. They assumed that the rate limiting process will
be the transport of cations in the film since holes have a much shorter path to traverse, (hole
path 300-400nm, ion path=0.3mm). The color of the film changes from dark red to transparent.
In this work the term of ion mobility is discussed showing the possibility of the moving front
experiment to extract useful quantities that will help in the development of ion transport

29
theories in conducting polymers. Nevertheless the two dimensionality does not allow a
straightforward estimation of the field in the film and thus extraction of parameters like
mobility. Doping and dedoping was studied in the first cycle as well as in sequential cycles, as
function of potential and as a function of the initial doped state of the polymer. In was
observed that the front at the first cycle was sharp and it was moving with a velocity of 1μm/s
[Fig. 1.15.b]. In later cycles more rapid movement was observed but the front was more
diffusive but still parallel to the edge. This is attributed to the opening of the polymer matrix
due to conformational changes of the polymer chains and due to hydration of the film. The
speed of the front varied with time between linear and √$ dependence. The dependence of the
speed of the front to the applied voltage is discussed as an indication that ions move in the film
under the influence of electric field, drift and not solely due to diffusion. They also studied the
doping process, where holes are injected and cations are extracted in order to preserve charge
neutrality. They observed fast expulsion of cations from the edges but in the mid area of the
film the color changes homogenously thus the determination of the front position was not
straightforward. Therefore no ion velocity could be determined. In this geometry during the
reduction, the extraction of holes changes over time since the whole film is getting reduced
thus the hole mobility changes. Although in this work they correlate the color change with ion
movement and not with electron transfer as in the previous works, the two dimensionality of
the experiment couples ion and hole transport and makes the analysis fairly complex.

30
1.5 Organic electronic devices that are based on mixed conductivity of
conducting polymers: focus on bioelectronics
The need of understanding ion transport in conducting polymers emerges from the
numerous applications that are based on the mixed conductivity of conducting polymers. Many
organic electronic devices for energy harvesting, storage, information display, sensing and
actuation rely on mixed (electronic and ionic) transport within a single organic layer. In
electrochromic displays, for example, ions injected from an electrolyte change the color of a
polymer film. The dimensional changes that arise from ion injection are used to build
mechanical actuators (artificial muscles). Ion redistribution within a film facilitates electronic
charge injection from metal electrodes, an effect utilized to achieve efficient
electroluminescence in light emitting electrochemical cells. Finally, ion diffusion across an
interface is used to control the energetics of the heterojunction, thus forming diodes. Mixed
electronic/ionic conductivity is of particular importance for devices that interface electronics
with biology, a subject that is currently attracting a great deal of attention. One example is the
organic electrochemical transistor (OECT), in which ions from an electrolyte enter a polymer
film and change its electronic conductivity. This results in ionic-to-electronic signal
transduction, and has found several applications in biosensors. A second example is the organic
electronic ion pump (OEIP), in which an electronic current in a conducting polymer film controls
the delivery of ions into an aqueous solution. These devices have been used in vivo for drug
delivery with unparalleled spatiotemporal resolution.
1.5.1 Organic electrochemical transistor (OECT)
The Organic Electrochemical Transistor is a three terminal device where the active layer
of the device is a conducting polymer in contact with an electrolyte. It was first presented by
White et al in 1984 [1.84] where the conductivity of a polypyrrole film was modulated by the
application of a gate voltage through an electrolyte. The vast majority of OECTs developed
today are based on poly(3,4-ethylenedioxythiophene) doped with poly(styrenesulfonate)
(PEDOT:PSS). Usually a Ag/AgCl electrode is used as the gate and is immersed in the electrolyte.
Source and drain electrodes measure the current that flows through the channel (source-drain
current, ID). Our current understanding of the mechanism of operation is the following: When a
positive bias is applied at the gate, cations from the electrolyte enter the PEDOT:PSS film and
compensate the pendant sulfonate anions on the PSS. This leads to a decrease of the hole
density in the PEDOT, as holes extracted at the drain are not re-injected at the source. The end

31
result is the decrease of the drain current. Therefore it can be considered as ion to electron
converter since an ionic current modulates the electronic current at the channel [1.14].
Recently we presented OECT with high transconductance yc[1.85], which is the main transistor
parameter that governs signal amplification. Transconductance is defined as the ratio of the
change in the drain current ∆uz divided by the change in the gate voltage ∆'{, yc =∆uz ∆'{⁄ . The high values of yc that we observed in OECTs are attributed to a volume effect.
The absence of a dielectric between channel and electrolyte in OECT allows ions to be injected
into the former and gives rise to a response that is determined by the volume of the channel.
This is in contrast to electrolyte-gated field-effect transistors, where accumulation of charge at
the interface between electrolyte and gate insulator (or semiconducting channel) determines
the response. As expected, the transistor performance can be tuned by adjusting the channel
volume. Making the channel thinner, for example, can lead to faster response, as dedoping it
requires a smaller number of ions. At the same time, the drain current (hence its modulation
upon gating) decreases, leading to a lower transconductance. These devices hold considerable
promise for technologies such as medical diagnostics and bioelectronics implants due to
improved biological and mechanical compatibility with tissue compared with traditional ‘hard’
electronic materials [1.8, 1.9]. OECTs have recently been employed in chemical and biological
sensing [1.86], and have also been interfaced with cells to control cell adhesion [1.20], and to
monitor cell viability [1.87] and barrier tissue integrity [1.13]. OECTs have been fabricated using
low-cost printing techniques [1.88], and integrated with natural [1.89] and synthetic fibers [1.90]
in powerful demonstrations of the unique form factors that can be achieved with these devices.
In addition, OECTs utilizing solid or gel electrolytes have widened the scope of application[1.91],
showing promise as printable logic circuits [1.92], and drivers for haptic sensors [1.93] and flat
panel display pixels[1.94].

32
Figure 1.16: (a) Schematic of an OECT cross-section and the wiring diagram for device operation. (b)
Optical micrograph of an individual transistor. Scale bar, 10 μm. Adapted from [1.85].
1.5.2 Ion pump
Ion pump is another example that utilizes the mixed conductivity of organic electronic
materials. It is a device where electronic current controls the delivery of ions [1.24]. A simple
geometry of an ion pump is shown in Fig. 1.17a. The device consists of two electrodes the
anode and the cathode that are made of PEDOT:PSS. The electrodes are link between an area
where PEDOT:PSS is overoxidized, hence it can transport only ions. The anode is in contact with
the source electrolyte while the cathode is in contact with the target electrolyte. The
electrolyte is insulated from the bridge and from an area on the electrode that will serve as a
connection to the external circuit. Applying positive voltage to the anode in respect with the
cathode, anode is getting oxidized and positive ions from the source electrolyte are pushed
through the anode to the bridge and end up at the source electrode where they cause
reduction and finally are released in the target electrolyte. The oxidation of the anode
electrode defines the maximum time of operation as PEDOT can reach a certain level of
oxidation before it overoxidizes irreversibly. The device can be fabricated using standard
microfabrication techniques. Spatial control can be realized through the pattering while
temporal control though the applied voltage and exact correlation between the addressing
signal and the delivery rate has been reported [1.95]. It can deliver not only ions but charged
biomolecules as well such as neurotransmitters. It has been used in order to regulate ion
signaling in individual neuronal cells. The ion pump has been fabricated in an encapsulated
device as well and tested in vivo and in vitro [1.24,1.25]. In vivo it was implanted in the auditory
system of a guinea pig and the ability to translate electronic addressing signals into brainstream

33
responses though neurotransmitter signaling was shown [1.25]. This can be extended into
implantable drug delivery systems for therapeutics or stimulation.
Figure 1.17: (a) Side view of the planar ion pump. The black arrow indicates the flow of charged
neurotransmitters from the source electrolyte, S, through the anode, then through the over-oxidized
channel and finally out into the target electrolyte, T, through the cathode. Layer thicknesses are
indicated in the material legend. (b) Photograph of the device mounted on the round window membrane
of the cochlea, with the two ion channels visible as dark blue strips on the transparent substrate. The
dashed lines indicate the obscured shape of the device leading back to the electrolyte reservoirs, seen in
the upper left of the image. (c) Illustration of the experimental scheme. The dotted line indicates a slice
through the cochlea, expanded below. The grey arrow indicates the diffusion of ions through the RWM,
scala tympani and finally to the hair cells. Adapted from [1.25]

34
1.6 References
[1.1] H. Shirakawa, E.J. Louis, A.G. MacDiarmid, C.K. Chiang, A.J. Heeger, Chem. Commun, 578
(1977)
[1.2] C.K. Chiang, C.R. Fincher Jr., Y.W. Park, A.J. Heeger, H. Shirakawa, E.J. Louis, Phys. Rev.
Lett. 39, 1098 (1977)
[1.3] Handbook of Conducting Polymers, Conjugated Polymers: Theories, Synthesis, Properties
and Characterization, Edited by Terje A. Skotheim and John R. Reynolds, CRC Press, Taylor and
Francis Group, New York, 2007
[1.4] Handbook of Oligo- and Polythiphenes, Edited by Denis Fichou, WILEY-VCH, Weinheim,
1999
[1.5]. P.M. Borsenberger, D.S. Weiss, Organic Photoreceptors for Xerography (Marcel Dekker,
NY, 1998).
[1.6] C.W. Tang, S.A. Vanslyke, Appl. Phys. Lett. 51 (12), 913 (1987).
[1.7]. R.H. Friend, R.W. Gymer, A.B. Holmes, J.H. Burroughes, R.N. Marks, C. Taliani, D.D.C.
Bradley, D.A. Dos Santos, J.L. Bredas, M. Logdlund, W.R. Salaneck, Nature 397 (6715), 121
(1999).
[1.8] Berggren, M. & Richter-Dahlfors, A. Organic bioelectronics. Advanced Materials 19, 3201-
3213 (2007).
[1.9] Owens, R.M. & Malliaras, G.G. Organic electronics at the interface with biology. Mrs
Bulletin 35, 449-456 (2010).
[1.10] Z.T. Zhu, J.T. Mabeck, C.C. Zhu, N.C. Cady, C.A. Batt, G.G. Malliaras, Chem. Commun. (13),
1556 (2004).
[1.11] D.A. Bernards, D.J. Macaya, M. Nikolou, J.A. DeFranco, S. Takamatsu, G.G. Malliaras, J.
Mater. Chem. 18 (1), 116 (2008).
[1.12] S.Y. Yang, J.A. DeFranco, Y.A. Sylvester, T.Gobert, D.J. Macaya, R.M. Owens, G.G.
Malliaras, Lab Chip 9 (5), 704 (2009).
[1.13] Jimison, L. H. et al. Measurement of barrier tissue integrity with an organic
electrochemical transistor. Adv. Mater. 24, 5919–5923 (2012).
[1.14] Bernards, D. A. & Malliaras, G. G. Steady-state and transient behavior of organic
electrochemical transistors. Adv. Funct. Mater. 17, 3538–3544 (2007).
[1.15] D.T. McQuade, A.E. Pullen, T.M. Swager, Chem. Rev. 100 (7), 2537 (2000).
[1.16] N.K. Guimard, N. Gomez, C.E. Schmidt, Prog. Polym. Sci. 32 (8–9), 876 (2007).
[1.17] K. Svennersten, M.H. Bolin, E.W.H. Jager, M. Berggren, A. Richter-Dahlfors, Biomaterials
30 (31), 6257 (2009).
[1.18]J. Y. Wong, R. Langer and D. E. Ingber, Electrically conducting polymers can noninvasively
control the shape and growth of mammalian cells, Proc. Natl. Acad. Sci. U. S. A., 1994, 91,
3201–3204.
[1.19] C. Salto, E. Saindon, M. Bolin, A. Kanciurzewska, M. Fahlman, E. W. H. Jager, P. Tengvall,
E. Arenas and M. Berggren, Control of neural stem cell adhesion and density by an electronic
polymer surface switch, Langmuir, 2008, 24, 14133–14138.
[1.20] M. H. Bolin , K. Svennersten , D. Nilsson , A. Sawatdee , E. W. H. Jager , A. Richter-Dahlfors
, M. Berggren , Adv. Mater. 2009 , 21 , 4379 .
[1.21] M.H. Bolin, K. Svennersten, X.J. Wang, I.S. Chronakis, A. Richter-Dahlfors, E.W.H. Jager,
M. Berggren, Sens. Actuators, B 142 (2), 451 (2009).
[1.22] A. M. D. Wan, D. J. Brooks, A. Gumus, C. Fischbach and G. G. Malliaras, Electrical control
of cell density gradients on a conducting polymer surface, Chem. Commun., 2009, 5278–5280.
[1.23] A. M. D. Wan , R. M. Schur , C. K. Ober , C. Fischbach , D. Gourdon , and G. G. Malliaras,
Electrical Control of Protein Conformation, Adv. Mater. 2012, 24, 2501–2505

35
[1.24] J. Isaksson, P. Kjall, D. Nilsson, N.D. Robinson, M. Berggren, A. Richter-Dahlfors, Nat.
Mater. 6 (9), 673 (2007).
[1.25] D.T. Simon, S. Kurup, K.C. Larsson, R. Hori, K. Tybrandt, M. Goiny, E.H. Jager, M. Berggren,
B. Canlon, A. Richter-Dahlfors, Nat. Mater. 8 (9), 742 (2009)
[1.25] K.A. Ludwig, J.D. Uram, J.Y. Yang, D.C. Martin, D.R. Kipke, J. Neural Eng. 3 (1), 59 (2006).
[1.26] T. Nyberg, O. Inganas, H. Jerregard, Biomed. Microdevices 4 (1), 43 (2002).
[1.27] D.H. Kim, M. Abidian, D.C. Martin, J.Biomed. Mater. Res., Part A 71A (4), 577 (2004).
[1.28] R.T. Richardson, A.K. Wise, B.C. Thompson, B.O. Flynn, P.J. Atkinson, N.J. Fretwell, J.B.
Fallon, G.G. Wallace, R.K. Shepherd, G.M. Clark, S.J. O’Leary, Biomaterials 30 (13), 2614 (2009).
[1.29] M.R. Abidian, K.A. Ludwig, T.C. Marzullo, D.C. Martin, D.R. Kipke, Adv. Mater. 21 (37),
3764 (2009)
[1.30] D. Khodagholy, T. Doublet, M. Gurfinkel, P. Quilichini, E. Ismailova, P. Leleux, T. Herve, S.
Sanaur, C. Bernard, and G.G. Malliaras, “Highly conformable conducting polymer electrodes for
in vivo recordings”, Adv. Mater. 36, H268 (2011).
[1.31] Khodagholy, D. et al. In vivo recordings of brain activity using organic transistors. Nat.
Commun. 4:1575 doi: 10.1038/ncomms2573 (2013).
[1.32] Hoffmann, R., Janiak, C. & Kollmar, C. A chemical approach to the orbitals of organic
polymers. Macromolecules 24, 3725-3746 (1991).
[1.33] Peierls RE, Quantum Theory of Solids, Oxford University Press, London (1955).
[1.34] A.J. Heeger, Semiconducting and metallic polymers: the fourth generation of polymeric
materials, Synth. Met. 125 (2002) 23-42
[1.35] J.L. Bredas and G.B. Street, Polarons, Bipolarons, and Solitons in Conducting Polymers,
Acc. Chem. Res. 1985,18, 309-315
[1.36] C. Kittel, Introduction to Solid State Physics, 8th
edition, John Wiley & Sons, 2001.
[1.37] R.H. Friend et al, Electronic properties of conjugated polymers, Phil. Trans. R. Soc. Lond.
A 314,37-49 (1985)
[1.38] M. Pfeiffer, T. Fritz, J. Blochwitz, A. Nollau, B. Plonnigs, A. Beyer, and K. Leo, Adv. Solid
State Phys. 39, 77 (1999)
[1.39] Elschner, A., Kirchmeyer, S., Lövenich, W., Merker, U. & Reuter, K. in PEDOT, Principles
and Applications of an Intrinsically Conductive Polymer (CRC Press, 2010).
[1.40] Malliaras, G. & Friend, R. An organic electronics primer. Physics Today 58, 53-58 (2005).
[1.41] W.R. Salaneck et al. / Physics Reports 319 (1999) 231}251
[1.42] A. L. Dyer and J. R. Reynolds, Electrochromism of Conjugated Conducting Polymers in
Handbook of Conducting Polymers, Conjugated Polymers, Eds by T.A. Skotheim and J. R.
Reynolds, CRC Press, Taylor and Francis Group, New York, 2007
[1.43] P. M. S. Monk, R. J. Mortimer, D. R. Rosseinsky, Electrochromism and Electrochromic
Devices, Cambridge University Press, UK 2007
[1.44] J.C. Gustafsson, B. Liedberg, O. Inganas, In situ spectroscopic investigations of
electrochromism and ion transport in a poly (3,4-ethylenedioxythiophene) electrode in a solid
state electrochemical cell, Solid State Ionics 69 (1994) 145-152
[1.45] J. C. Carlberg and O. Lnganas, Fast Optical Spectroscopy of the Electrochemical Doping of
Poly(3,4-ethyleneclioxythiophene), J Electrochem. Soc., Vol. 145, No. 11, 1998
[1.46] Bassler, H. Charge Transport in Disordered Organic Photoconductors. physica Status
Solidi B-Basic Solid State Physics 175, 15 (1993).
[1.47] Borsenberger, P.M. & Weiss, D.S. Organic Photoreceptors for Xerography (Marcel
Dekker, Inc., New York, NY, 1998).
[1.48] C. Tanase, E. J. Meijer, P.W.M. Blom, and D. M.de Leeuw, Phys. Rev. Lett. 91, 216601
(2003).

36
[1.49] W. F. Pasveer, J. Cottaar, C. Tanase, R. Coehoorn, P. A. Bobbert, P.W. M. Blom, D. M. de
Leeuw, and M. A. J. Michels, Phys. Rev. Lett. 94, 206601 (2005)
[1.50] C. Tanase, P.W. M. Blom, and D. M. de Leeuw, Phys. Rev. B 70, 193202 (2004).
[1.51] V. Coropceanu, J. Cornil, D. A. da Silva Filho, Y. Olivier, R. Silbey, and J-L. Bredas, Charge
Transport in Organic Semiconductors, Chem. Rev. 2007, 107, 926-952
[1.52] G. Juska, K. Arlauskas, and M. Viliunas, Extraction Current Transients: New Method of
Study of Charge Transport in Microcrystalline Silicon, Phys. Rev. Lett. 84, 21, 4946 (2000)
[1.53] K. Genevicius, R. Osterbacka, G. Juska, K. Arlauskas, H. Stubb, Charge transport in p-
conjugated polymers from extraction current transients, Thin Solid Films 403 –404 (2002) 415–
418
[1.54] Atkins, P. & de Paula, J. Atkins' Physical Chemistry. Oxford University Press, Great Britain
(2006).
[1.55] J. O’M. Bockris and A. K. N. Reddy, Modern Electrochemistry 1: Ionics, 2nd Edition,
Kluwer Academic Publishers, NY, 2002
[1.56] T.D. Gierke, W.Y. Hsu, in: A. Eisenberg, H.L. Yeager (Eds.), Perfluorinated Ionomer
Membranes, ACS Symposium Series No. 180, American Chemical Society, Washington, DC,
1982, p. 283.
[1.57] Hsu, W.Y. & Gierke, T.D. Ion transport and clustering in nafion perfluorinated
membranes. Journal of Membrane Science 13, 307-326 (1983).
[1.58] Okada, T. et al. Ion and water transport characteristics of Nafion membranes as
electrolytes. Electrochimica Acta 43, 3741-3747 (1998).
[1.59] M. Eikerling, A.A. Kornyshev, U. Stimming, J. Phys. Chem. B 101 (1997) 10807.
[1.60] Smitha, B., Sridhar, S. & Khan, A.A. Solid polymer electrolyte membranes for fuel cell
applications-a review. Journal of Membrane Science 259, 10-26 (2005).
[1.61] Gebel, G.; Aldebert, P.; Pineri, M. Polymer 1993, 34, 333.
[1.62] Gebel, G.; Lambard, J. Macromolecules 1997, 30, 7914.
[1.63] Gebel, G. Polymer 2000, 41, 5829.
[1.64] Rubalat, L.; Rollet, A. L.; Diat, O.; Gebel, G. J. Phys. IV 2002, 12 (PR6), 197.
[1.65] Ise, M. Ph.D. Thesis, University of Stuttgart, Stuttgart, Germany, 2000.
[1.66] Kreuer, K. D. J. Membr. Sci. 2001, 185, 29.
[1.67] Elliott, J. A.; Hanna, S.; Elliott, A. M. S.; Cooley, G. E. Macromolecules 2000, 33, 4161.
[1.68] Khalatur, P. G.; Talitskikh, S. K.; Khokhlov, A. R. Macromol. Theory Simul. 2002, 11, 566.
[1.69] Kreuer, K.-D., Paddison, S.J., Spohr, E. & Schuster, M. Transport in Proton Conductors for
Fuel-Cell Applications: Simulations, Elementary Reactions, and Phenomenology. Chemical
Reviews 104, 4637-4678 (2004).
[1.70] Paddison, S. J.; Pratt, L. R.; Zawodzinski, T. A., Jr. J. New Mater. Electrochem. Syst. 1999,
2, 183.
[1.71] Haubold, H. G.; Vad, T.; Jungbluth, H.; Hiller, P. Electrochim. Acta 2001, 46, 1559.
[1.72] Paddison, S. J.; Pratt, L. R.; Zawodzinski, T. A., Jr. In Proton Conducting Membrane Fuel
Cells II; Gottesfeld, S., Fuller, T. F., Eds.; The Electrochemical Society Proceedings Series 98-27;
The Electrochemical Society: Pennington, NJ, 1999; p 99.
[1.73] Paddison, S. J. J. New Mater. Electrochem. Syst. 2001, 4, 197.
[1.74] Paddison, S. J. Annu. Rev. Mater. Res. 2003, 33, 289.
[1.75] Sahu, A.K., Pitchumani, S., Sridhar, P. & Shukla, A.K. Nafion and modified-Nafion
membranes for polymer electrolyte fuel cells: An overview. Bulletin of Materials Science 32,
285-294 (2009).
[1.76] Anantaraman, A.V. & Gardner, C.L. Studies on ion-exchange membranes. Part 1. Effect of
humidity on the conductivity of Nafion®. Journal of Electroanalytical Chemistry 414, 115-120
(1996).

37
[1.77] Lehmani, A., Turq, P., Périé, M., Périé, J. & Simonin, J.-P. Ion transport in Nafion® 117
membrane. Journal of Electroanalytical Chemistry 428, 81-89 (1997).
[1.78] Knauth, P., Sgreccia, E., Donnadio, A., Casciola, M. & Vona, M.L.D. Water Activity
Coefficient and Proton Mobility in Hydrated Acidic Polymers. Journal of the Electrochemical
Society 158, B159-B165 (2011).
[1.79] Stenina, I.A., Sistat, P., Rebrov, A.I., Pourcelly, G. & Yaroslavtsev, A.B. Ion mobility in
Nafion-117 membranes. Desalination 170, 49-57 (2004).
[1.80] Aoki, K., Aramoto, T. & Hoshino, Y. Photographic measurements of propagation speeds of
theconducting zone in polyaniline films during electrochemical switching. Journal of
Electroanalytical Chemistry 340, 127-135 (1992).
[1.81] Johansson, T., Persson, N.-K. & Inganäs, O. Moving Redox Fronts in Conjugated Polymers
Studies from Lateral Electrochemistry in Polythiophenes. Journal of the Electrochemical Society
151, E119-E124 (2004).
[1.82] Wang, X. & Smela, E. Experimental Studies of Ion Transport in PPy(DBS). The Journal of
Physical Chemistry C 113, 369-381 (2008).
[1.83] Wang, X. & Smela, E. Color and Volume Change in PPy(DBS). The Journal of Physical
Chemistry C 113, 359-368 (2008).
[1.84] White, H.S., Kittlesen, G.P. & Wrighton, M.S. Chemical Derivatization of an Array of 3
Gold Microelectrodes with Polypyrrole - Fabrication of a Molecule-Based Transistor. Journal of
the American Chemical Society 106, 5375-5377 (1984).
[1.85] Khodagholy, D. et al. High transconductance organic electrochemical transistors. Nat.
Commun. 4:2133 doi: 10.1038/ncomms3133 (2013).
[1.86] Lin, P. & Yan, F. Organic thin-film transistors for chemical and biological sensing. Adv.
Mater 24, 34–51 (2012).
[1.87] Lin, P., Yan, F., Yu, J. J., Chan, H. L. W. & Yang, M. The application of organic
electrochemical transistors in cell-based biosensors. Adv. Mater 22, 3655–3660 (2010).
[1.88] Basirico, L., Cosseddu, P., Scida, A., Fraboni, B., Malliaras, G. G. & Bonfiglio, A. Electrical
characteristics of ink-jet printed, all-polymer electrochemical transistors. Organic Electron. 13,
244–248 (2012).
[1.89] Mattana, G., Cosseddu, P., Fraboni, B., Malliaras, G. G., Hinestroza, J. P. & Bonfiglio, A.
Organic electronics on natural cotton fibres. Organic Electron. 12, 2033–2039 (2011).
[1.90] Hamedi, M., Herlogsson, L., Crispin, X., Marcilla, R., Berggren, M. & Inganas, O. Fiber-
embedded electrolyte-gated field-effect transistors for e-textiles. Adv. Mater. 21, 573–577
(2009).
[1.91] Kim, S. H. et al. Electrolyte-gated transistors for organic and printed electronics. Adv.
Mater. 25, 1822–1846 (2013).
[1.92] Berggren, M., Nilsson, D. & Robinson, N. D. Organic materials for printed electronics. Nat.
Mater. 6, 3–5 (2007).
[1.93] Zirkl, M. et al. An all-printed ferroelectric active matrix sensor network based on only five
functional materials forming a touchless control interface. Adv. Mater. 23, 2069–2074 (2011).
[1.94] Braga, D., Erickson, N. C., Renn, M. J., Holmes, R. J. & Frisbie, C. D. High-transconductance
organic thin-film electrochemical transistors for driving low-voltage red-green-blue active
matrix organic light-emitting devices. Adv. Funct. Mater. 22, 1623–1631 (2012).
[1.95] Tybrandt, K. et al. Translating Electronic Currents to Precise Acetylcholine-Induced
Neuronal Signaling Using an Organic Electrophoretic Delivery Device. Advanced Materials 21,
4442-+ (2009).

38
Chapter 2
2. A simple model for ion injection and
transport in conducting polymers
This chapter deals with the development of a simple analytical model that describes ion
transport in a planar junction between an electrolyte and a conducting polymer film. When ions
are injected in the film, holes recede, leading to partial dedoping of the film. This is modeled by
two resistors in series, an ionic one for the dedoped part and an electronic one for the still-
doped part. Analytical predictions can be made for the temporal evolution of the drift length of
ions and the current, variables that could be assessed experimentally. A numerical model based
on forward time iteration of drift/diffusion equations is used to validate these predictions. Using
realistic materials parameters, I found that the analytical model can be used to obtain the ion
drift mobility in the film, and as such, it might be useful towards the development of structure
vs. ion transport properties relationships in this important class of electronic materials.
This chapter is based closely on previously published work: “A Simple Model for Ion Injection and
Transport in Conducting Polymers”, E. Stavrinidou, P. Leleux, H. Rajaona, M. Fiocchi, S. Sanaur,
and G. G. Malliaras, J. Appl. Phys. 113, 244501 (2013); doi: 10.1063/1.4812236
Contribution: Developed the analytical model with G.G.M., helped on the development of the
algorithm, run all simulations and all data analysis, wrote first draft and big part of the
manuscript and commented on the final version.
Note: The implementation of the algorithm was done by P.L. with LabView.

39
2.1 Introduction
Organic electronic materials exhibit mixed (electronic and ionic) conductivity [2.1, 2.2],
a key property for a variety of devices including light-emitting electrochemical cells [2.3, 2.4],
dye-sensitized solar cells [2.5], batteries [2.6], electrochromic devices [2.7] and devices for
bioelectronics [2.8, 2.9]. Our understanding of electronic carrier transport in organics has
reached a high level of sophistication, starting with studies conducted during the 70s and 80s,
when these materials were being considered for applications in electrophotography [2.10].
Although structure vs. electronic transport properties relationships in organics are still being
developed [2.11], there is a wealth of knowledge on factors that influence mobility in these
materials [2.12]. This is in contrast with ion transport, which has not received much attention in
organic electronic materials.
Ion transport has been extensively studied in the context of polymer electrolytes, using
mostly conductivity and diffusion measurements [2.13]. While these methods are suitable for
studying transport in a material that contains only ionic carriers, their application in mixed
conductors is challenging due to the simultaneous presence of electronic carriers. In recent
years, a promising technique was developed that involves measurements of changes in the
optical transmission of a film upon the injection of ions from an electrolyte. As organics are
electrochromic, ion injection and the resulting change in electronic carrier density alter the
optical absorption of the material. Transmission measurements can, therefore, be used to
follow the dynamics of injection and transport of ions in a polymer film. Aoki et al. [2.14],
Johansson et al. [2.15], and most recently Wang et al. [2.16, 2.17] have developed this
technique, called the “moving front” measurement. The geometries used in these experiments
were different, but were all 2D, meaning that ionic and electronic carriers moving in directions
perpendicular to each other.
These experiments stimulated a considerable modeling effort. Lacroix et al. [2.18]
developed a continuum model and showed that diffusion alone was not sufficient in order to
reproduce “moving front” behavior, and drift of ions in the polymer must be included in the
model. Miomandre et al. [2.19] arrived at a similar conclusion using Monte Carlo simulations:
Although ions in a solution are driven predominantly by concentration gradients, in conducting
polymers the field can be sufficient enough to support drift. The importance of drift was echoed
by Wang et al. [2.20], who presented a numerical model based on solution of drift/diffusion
equations. These models varied in degree of sophistication, assumptions made, and in
40
geometry (1D, where ionic and electronic carriers move along the same axis vs. 2D), and gave
different predictions regarding, e.g., the speed of the moving front vs. time.
The complexity of the doping process in a conducting polymer is difficult to capture in
any model. Changes in film morphology, for example, are expected upon injection of ions and
this certainly affects material properties. The challenges associated with this endeavor have
been recently reviewed by Inganäs [2.21]. There is, however, merit in exploring the basic
electrostatics which underlies the physics of ion injection and transport, as this would provide a
framework on which additional complexity can be superimposed. In this chapter I examine ion
injection and transport in a polymer film, assuming that ions move by drift alone. This allows
the formulation of analytical expressions for the temporal dependence of ion drift length and
current, variables that can be observed experimentally in a “moving front” experiment. The
application of the model in an appropriately designed (1D) experiment can therefore lead to
determination of ion drift mobility in the film. A numerical model based on forward time
iteration of drift/diffusion equations was used to check the accuracy of the analytical model,
using realistic materials parameters.
2.2 Analytical Model
The geometry considered is shown in Fig. 2.1. It consists of a solid film sandwiched
between an electrolyte, to the left, and a metal electrode, to the right. The film is modeled
after poly(3,4-ethylenedioxythiophene) poly(styrene sulfonate) (PEDOT:PSS) [2.22], which is a
commercially available polymer with state-of-the-art conductivity. PEDOT:PSS is a degenerately
doped organic semiconductor, in which the semiconductor chain (PEDOT) is doped p-type due
to the presence of uncompensated sulfonate anions on the PSS chain, which play the role of
acceptors (PSS is added in excess, and only a fraction of its sulfonate anions is compensated by
holes and hence contributes to doping. These are the acceptors considered in our model). The
sulfonate anions are linked to the polystyrene backbone, hence they are not mobile. The
model, therefore, considers a film that contains mobile holes and immobile acceptor anions of
equal density (Fig. 2.1a).

41
Figure 2.1: Schematic representation of the modeled device indicating the charge distribution in the film
at (a) t=0, when the film is fully doped, and (b) t>0, when the film is partially dedoped. The drift length, ℓ,
of injected ions and the total length of the film, L, are indicated. (c) Equivalent circuit diagram for t>0
where RI andRC are the resistors that correspond to the dedoped and the still-doped parts of the film,
respectively, and Vℓ is the voltage at ℓ.
A voltage applied between the metal electrode and a counter electrode immersed in
the electrolyte (not shown on Fig. 2.1), drives cations from the electrolyte into the film (Fig.
2.1b). At the same time, holes drift towards the metal electrode, where they are extracted.
Charge neutrality implies that cation injection is balanced by hole extraction, meaning that as
the acceptor anions are compensated by the injected cations, the excess holes are swept away
at the other end of the device. There is, therefore, a front between the dedoped part of the film
and the still-doped part of the film. The dedoped part extends a distance ℓ from the interface
with the electrolyte, where ℓ is the drift length of the injected cations. Accordingly, I model the
partially dedoped PEDOT:PSS film as two resistors in series (Fig. 2.1c), where RI corresponds to
the dedoped part and RC corresponds to the still doped part. The total resistance of the film is:
}~ = ��� ℓ + ��
� (" − ℓ) , (2.1)

42
where ρI and ρC are the resistivities of the dedoped and doped material, respectively, L is the
length of the film (distance between the electrolyte and the metal electrode), and S is its cross-
sectional area. I assume complete compensation of the acceptor anions by the injected cations,
hence, in the dedoped part, the hole density is zero and the cation density, P, is equal to the
acceptor density. This also means that the cation density in the undoped part of the film is
equal to the hole density in the doped part of the film. RI and RC are equal for ℓ = ℓ0:
ℓ/ = " ::;����
, (2.2)
where µh and µP are the hole and cation mobilities in the film, respectively. Assuming that the
cation mobility is much smaller than the hole mobility (hence �� ≪ �x), I find that ℓ/ ≪ ".
Therefore, for any drift length ℓ/ < ℓ < ", the dominant resistor will be RI. For typical values of
ion and hole mobilities (see below), Eq. (2.2) yields ℓ0=L/100, indeed small compared to the
total length of the film. Therefore, I assume that all the applied voltage drops on RI, hence
V(ℓ)≈Vappl, where Vappl is the applied voltage.
The dependence of drift length on time, t, can be calculated from the definition of drift
mobility:
� = [∙ℓ, =
�ℓ�*∙ℓ, ⇒ �ℓ�ℓ = �� ∙ '�$ ⇒ ℓ� = 2 ∙ � ∙ ' ∙ $ (2.3)
where u is the drift velocity and V is the applied bias.
The current density can be calculated using the usual derivation of Ohm’s law, assuming that
since Vℓ≈Vappl, the current is determined by cation drift in the dedoped part:
. = T ∙ � ∙ = T ∙ � ∙ 7ℓ7% =F�����,5���
�√% (2.4)
where e is the charge of an electron. Equations (2.3) and (2.4) are the main predictions of the
analytical model, and could be used to derive ion mobility and injected cation density in a 1D
experimental configuration (ion and hole motion along the same axis). In deriving these
equations, I ignored the effects of carrier diffusion and assumed that the applied voltage drops
exclusively in the dedoped part of the film. The impact of these assumptions was investigated
by numerical modeling.
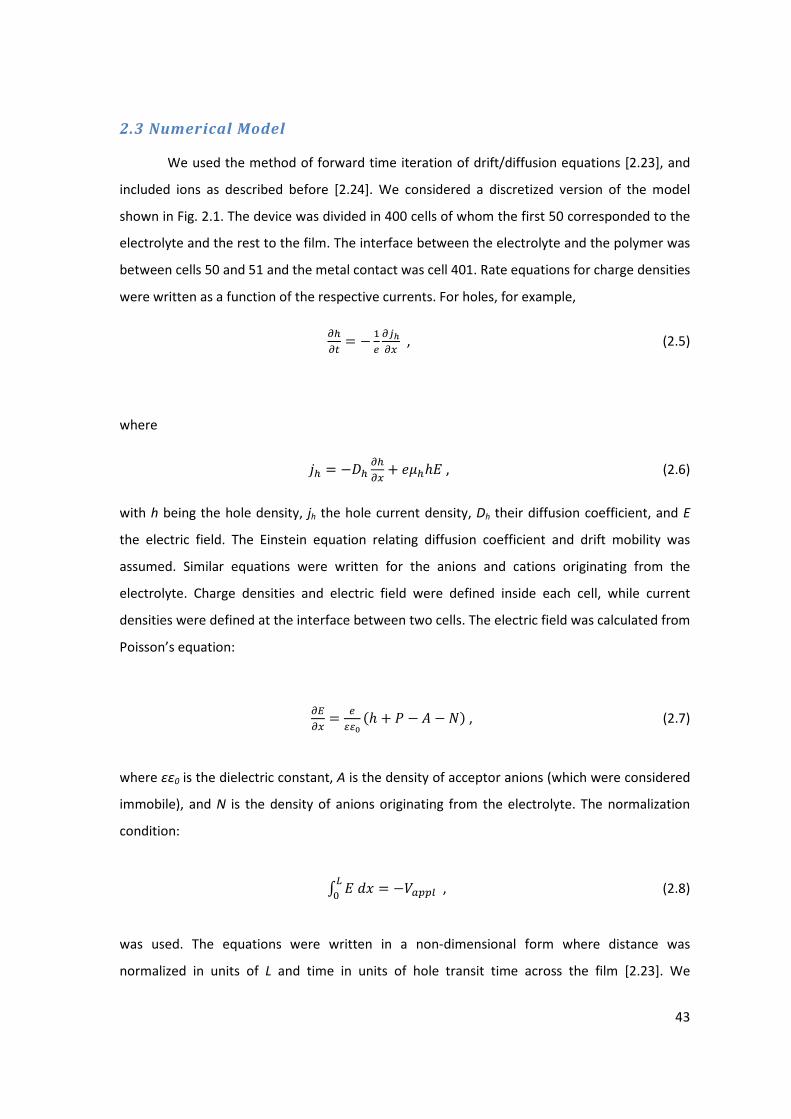
43
2.3 Numerical Model
We used the method of forward time iteration of drift/diffusion equations [2.23], and
included ions as described before [2.24]. We considered a discretized version of the model
shown in Fig. 2.1. The device was divided in 400 cells of whom the first 50 corresponded to the
electrolyte and the rest to the film. The interface between the electrolyte and the polymer was
between cells 50 and 51 and the metal contact was cell 401. Rate equations for charge densities
were written as a function of the respective currents. For holes, for example,
���% = − :
F�3��� , (2.5)
where
.� = −Q� ���� + T��ℎ� , (2.6)
with h being the hole density, jh the hole current density, Dh their diffusion coefficient, and E
the electric field. The Einstein equation relating diffusion coefficient and drift mobility was
assumed. Similar equations were written for the anions and cations originating from the
electrolyte. Charge densities and electric field were defined inside each cell, while current
densities were defined at the interface between two cells. The electric field was calculated from
Poisson’s equation:
�\�� = F
112 (ℎ + � − � − �) , (2.7)
where εε0 is the dielectric constant, A is the density of acceptor anions (which were considered
immobile), and N is the density of anions originating from the electrolyte. The normalization
condition:
� ���(/ = −' ��� , (2.8)
was used. The equations were written in a non-dimensional form where distance was
normalized in units of L and time in units of hole transit time across the film [2.23]. We

44
assumed no injection barrier for ions from the electrolyte into the polymer, and no extraction
barrier for holes from the polymer to the metal electrode. Holes were not allowed to go into
the electrolyte. Ion densities were kept constant in the “bulk” of the electrolyte by pinning their
values at the 1st
cell. An electric field was applied and time was increased in steps that were
short compared to the carrier transit time across a single cell. For each time step, charge
densities, currents, and finally the electric field were calculated from Eqs. (2.5)-(2.8) above and
the calculation was stopped before the injected cations reached the metal contact.

45
2.4 Results and Discussion
I chose input values that describe realistic materials parameters, and varied applied
voltage, ion mobility (to simulate different types of ions) and ion density. I sought to explore a
reasonable parameter space that helps understand trends, while at the same time I sought to
avoid large differences in input parameters, as that would lead to excessively long runs. The
hole density in the film (hence the density of acceptor anions) was set to 1019
cm-3
. This is an
order of magnitude smaller than in common PEDOT:PSS dispersions [2.22], but it is a more
easily-achievable value of doping in organic electronic materials. The cation (hence anion)
density in the electrolyte was varied between 1018
-1020
cm-3
, in order to be smaller, equal, and
larger than the hole density in the film. These values would correspond to electrolytes of 0.002-
0.2 M. The hole mobility in the film, μh, was set to 10-3
cm2 V
-1 s
-1, within the range of values
estimated from PEDOT:PSS transistor measurements [2.25]. Ion mobilities in the electrolyte
were set to 10-3
cm2 V
-1 s
-1, consistent with values for small metal ions in water [2.26]. As little is
known regarding the magnitude of ion mobilities in conducting polymers, I considered the
range μP=μN=10-4
-10-6
cm2 V
-1 s
-1. The total length of the device was assumed to be 200 nm (175
nm for the film). Although it is shorter than what would be used in a “moving front”
experiment, it allows efficient computation while at the same time captures the essential
physics. Moreover, the effect of diffusion is expected to be more pronounced than in a longer
film, so it consists of a more stringent test for the analytical model. Finally, the applied voltage
was varied from 0.01 V to 1 V, keeping in mind that larger voltages are not used in aqueous
electrolytes as they may cause electrolysis.
Fig. 2.2 shows snapshots of the spatial distribution of ion density, hole density and
voltage across the device for ion densities in the electrolyte equal to 1019
cm-3
, ion mobilities in
the film of 10-5
cm2 V
-1 s
-1, and Vappl=1 V. Ions from the electrolyte are injected in the film where
they move by drift and diffusion. The applied voltage “pulls” cations into the film, and “pushes”
anions back. As a result, the net injected ion density, P-N, is dominated by the drift of cations.
The profiles of holes are complementary to the profiles of P-N, indicating that charge neutrality
is maintained throughout the sample. As the holes recede, complete dedoping occurs in that
part of the film, with injected cations compensating the acceptor anions. The applied voltage
drops linearly and entirely within the dedoped area of the film, with no voltage drop at the
electrolyte or at the still-doped part of the film. This validates a key assumption of the analytical
model, and means that, for practical purposes, the current is dominated by the drift of injected

46
cations. The latter drift under the influence of an electric field that is spatially uniform, but its
magnitude decreases with time as the length of the dedoped part of the film increases.
Figure 2.2: Spatial distribution of (a) P (blue dotted line), N (grey dotted line) and P-N (solid line), (b) hole
density, and (c) voltage across the device. The perpendicular dotted line marks the interface between the
electrolyte and film. The ion densities in the electrolyte were set to P=N=1019
cm-3
, the ion mobilities in
the film to μP=μN=10-5
cm2 V
-1 s
-1, and Vappl=1 V. The snapshots shown are for t=2, 4, 6, 8, and 10 μs.
Fig. 2.3a shows the temporal evolution of drift length that corresponds to the data of
Fig. 2.2. The numerical data (open circles) follow the ℓ2 vs. t relationship predicted by the
analytical model. The latter was used to fit the data and extract the drift mobility of injected
cations in the film. A fit using Eq. (2.3), shown as the solid line in Fig. 2.3a, yields a value of
1.004 10-5
cm2 V
-1 s
-1, in excellent agreement with the input value used to generate the
numerical data. Fig. 2.3b shows that the prediction of the analytical model regarding the
temporal evolution of current density is also accurate. The numerical data follow the predicted j
vs. t-1/2
dependence, and a fit using Eq. (2.4) yields an ion density of P=9.8·1018
cm-3
, a value
which is only 2% different than the input value used to generate the numerical data.

47
Figure 2.3: Temporal dependence of (a) drift length and (b) current density. The open circles are the
results of the numerical model, and the lines are fits to the predictions of the analytical model.
The results above show that the analytical model can be used to fit experimental data from a
1D geometry and extract ion mobilities. The set of parameters used for the calculations of Fig.
2.2 define the reference sample. In what follows, I explore excursions from this set of
parameters by changing applied voltage, ion density in the electrolyte, and ion mobility in the
film.
2.4.1 Voltage Dependence
In order to get a better understanding of the limitations of the analytical model I run
the numerical model for different values of applied voltage, and fit Eq. (2.3) to the temporal
dependence of the calculated drift length. Table 2.1 shows the results of the fit for the different
applied voltages ranging from 0.01 – 1 V. In all cases the input ion mobility was 10-5
cm2 V
-1 s
-1
and all the other parameters correspond to the reference sample modeled in Fig. 2.2. Although
in general the analytical model provides a good estimate of ion mobility in the film, the error
increases for low values of applied voltage. For Vappl=0.01 V, the analytical model returns a
mobility that is more than 3 times bigger than the input value.

48
Table 2.1. Input and extracted [from Eq. (2.3)] values of the cation drift mobility in the film for
various applied voltages.
Voltage (V) Input Mobility (cm2 V
-1 s
-1) Extracted Mobility (cm
2 V
-1 s
-1)
0.01 1 ·10-5
3.21 ·10-5
0.05 1 ·10-5
1.04 ·10-5
0.1 1 ·10-5
0.99 ·10-5
0.5 1 ·10-5
1.004 ·10-5
1 1 ·10-5
1.004 ·10-5
In order to understand the origin of this trend, the calculated carrier density and
voltage profiles in Fig. 2.4 are shown. The latter were normalized to their maximum value to
allow an easy comparison. As it can be seen from the carrier density profiles, the assumption of
complete dedoping is not satisfied for low applied voltages. The injected cation density for
Vappl=0.01 V is about 20% of the hole density in the film and as a result, there is a voltage drop
at the interface with the electrolyte and at the still-doped part of the sample. The analytical
model is simply not valid in this case. In a “moving front” experiment, one would need to
ensure that complete dedoping occurs by increasing the applied voltage until saturated carrier
density profiles are achieved.

49
Figure 2.4: (a) Spatial distribution of P-N for an applied voltage of 0.01, 0.05, 0.1, 0.5, and 1 V (violet to
black line), at t=10 μs. (b) Corresponding voltage profiles, normalized to 1 at X=200 nm. The
perpendicular dotted lines mark the interface between the electrolyte and film.
2.4.2 Ion Density Dependence
The numerical model was run for different concentrations of ions in the electrolyte,
keeping all other parameters the same as in the reference sample. I examined the
concentration range from 1018
- 1020
cm-3
, one order of magnitude smaller and larger than the
density of holes in the film. As previously, I fit Eq. (2.3) of the analytical model to the numerical
data. The extracted ion drift mobilities are given in Table 2.2. When the density of ions in the
electrolyte is different than that of holes in the film an error appears. The analytical model
underestimates the mobility by 9% for P=1018
cm-3
, and overestimates it by 20% for P=1020
cm-3
.
Table 2.2 Input and extracted [from Eq. (2.3)] values of the cation drift mobility in the film for
various ion densities in the electrolyte.
Ion Density (cm-3
) Input Mobility (cm2 V
-1 s
-1) Extracted Mobility (cm
2 V
-1 s
-1)
1018
1 ·10-5
0.910 ·10-5
1019
1 ·10-5
1.004 ·10-5
1020
1 ·10-5
1.200 ·10-5

50
The nature of this error can be understood by taking a closer look at the voltage
profiles that correspond to these three cases (Fig. 2.5b). When the concentration of ions in the
electrolyte is the same as the concentration of holes in the film, the voltage drops linearly
across the dedoped area, as discussed before (reference case, Fig. 2.2). For electrolytes of
lower ionic strength, a voltage drop appears at the interface between the electrolyte and the
film. This voltage drop arises from the mismatch between the cation concentration in the
electrolyte and the hole concentration (hence the acceptor anion concentration) in the film: As
injected cations have to compensate acceptor anions, their concentration needs to increase 10
times going from the electrolyte to the film. This allows ion accumulation in the electrolyte,
near the interface with the film, and leads to a voltage drop. As a result, a smaller fraction of
the applied voltage is available to drop inside the film, which leads to a shorter drift length,
hence a smaller ion mobility is extracted from Eq. (2.3). For experimental design, this implies
that one should avoid using dilute electrolytes, in which the ion density is considerably smaller
than the hole density in the film.
Figure 2.5: (a) Spatial distribution of P-N for an ion density equal to 1018
cm-3
, 1019
cm-3
, and 1020
cm-3
(black to blue line), at t=10 μs. (b) Corresponding voltage profiles. The perpendicular dotted lines mark
the interface between the electrolyte and film.
For P=1020
cm-3
, the concentration of cations in the electrolyte is ten times bigger than
that of ions in the film, so compensation of the acceptor anions is easily achieved. At the same
time, diffusive transport of ions across the interface becomes more important. The voltage
profile reveals a region of low field inside the film and close to the interface with the electrolyte

51
(X=25-50 nm), where diffusive transport of ions dominates. Drift dominates in the rest of the
dedoped region, in which the field is higher than that in the reference sample. This leads to
faster transport of cations and results to an overestimate of the mobility by the analytical
model. It should be noted that this effect is diminished as L increases, and hence the region in
which diffusion dominates gets proportionally smaller. In an experiment, therefore, the
influence of diffusion can be minimized by increasing the length of the film.
2.4.3 Ion Mobility Dependence
As a last step, I vary the mobility of ions in the film in order to simulate the effect of
different ions. I start with the reference case and decrease/increase ion mobility in the film by
an order of magnitude. In the first case, the input mobility was set to 10-6
cm2 V
-1 s
-1 and the
mobility extracted from Eq. (2.3) was 1.01 10-6
cm2 V
-1 s
-1 (Table 2.3). The analytical model gives,
therefore, an accurate prediction in this case as well. In the second case, the input mobility was
10-4
cm2 V
-1 s
-1 and the extracted value was 0.93 10
-4 cm
2 V
-1 s
-1, indicating that the analytical
model underestimates mobility. This originates from the fact that the assumption that the hole
mobility is much larger than the ion mobility in the film is not valid in this case. Indeed, in Fig.
2.6b we see that the applied voltage drops in both parts of the film, dedoped and still-doped, as
a result of the similar resistivities of the ionic and electronic resistors. In general, the analytical
model is valid for a range of mobilities, under the condition that the ion mobility is more than
ten times smaller than the hole mobility.
Table 2.3 Extracted [from Eq. (2.3)] values of the cation drift mobility in the film for different
input values.
Input Mobility (cm2 V
-1 s
-1) Extracted Mobility (cm
2 V
-1 s
-1)
1 ·10-4
0.930 ·10-4
1 ·10-5
1.004 ·10-5
1 ·10-6
1.010 ·10-6

52
Figure 2.6: Spatial distribution of P-N for a cation mobility in the film equal to 10-6
, 10-5
and 10-4
cm2 V
-1 s
-
1 (blue to black line), for times stated near the plots. (b) Corresponding voltage profiles. The
perpendicular dotted lines mark the interface between the electrolyte and film.

53
2.5 Conclusions
I presented a simple model that describes ion injection and transport from electrolytes
into conducting polymer films. The model gives analytical predictions for the temporal
evolution of the drift length of ions and the current – variables that can be checked
experimentally using an appropriate configuration and be used to extract ion drift mobility in
the film. I explored the validity of this model using forward time iteration of drift/diffusion
equations, and under a set of realistic materials parameters the model gave accurate
predictions. By looking at the influence of applied voltage, ion concentration in the electrolyte
and ion mobility in the film, I developed a set of rules that can guide the design of the
experiment: First, a sufficiently high voltage needs to be applied to yield complete
compensation of the acceptor anions in the polymer. Second, the ion density in the electrolyte
must not be too small compared to the hole density in the film. Third, increasing the length of
the film (distance between electrolyte and metal contact) reduces the impact of diffusive
transport, which is important when electrolytes with high ionic strength are used. Finally, the
ion mobility must be smaller than the hole mobility. This model will be a guide for the design of
an experiment that will be based on the moving front in one dimensional geometry, in order to
measure ion mobilities in conducting polymers. The ultimate goal is to help elucidate structure
vs. ion transport properties relationships in this important class of electronic materials.

54
2.6 References
[2.1] J. M. Leger, Adv. Mater. 20 (4), 837-841 (2008).
[2.2] J. Leger, M. Berggren and S. A. Carter, Iontronics : Ionic carriers in organic electronic
materials and devices. (CRC Press, Boca Raton, 2011).
[2.3] Q. Pei, G. Yu, C. Zhang, Y. Yang and A. J. Heeger, Science 269 (5227), 1086-1088 (1995).
[2.4] J. C. deMello, N. Tessler, S. C. Graham and R. H. Friend, Physical Review B 57 (20), 12951-
12963 (1998).
[2.5] M. Gratzel, Journal of Photochemistry and Photobiology C-Photochemistry Reviews 4 (2),
145-153 (2003).
[2.6] H. D. Abruna, Y. Kiya and J. C. Henderson, Physics Today 61 (12), 43-47 (2008).
[2.7] R. J. Mortimer, A. L. Dyer and J. R. Reynolds, Displays 27 (1), 2-18 (2006).
[2.8] M. Berggren and A. Richter-Dahlfors, Adv. Mater. 19 (20), 3201-3213 (2007).
[2.9] R. M. Owens and G. G. Malliaras, MRS Bull. 35, 449-456 (2010).
[2.10] P. M. Borsenberger and D. S. Weiss, Organic Photoreceptors for Xerography. (Marcel
Dekker, Inc., New York, NY, 1998).
[2.11] J. Rivnay, S. C. B. Mannsfeld, C. E. Miller, A. Salleo and M. F. Toney, Chem. Rev. 112 (10),
5488-5519 (2012).
[2.12] V. Coropceanu, J. Cornil, D. A. da Silva, Y. Olivier, R. Silbey and J. L. Bredas, Chem. Rev.
107 (4), 926-952 (2007).
[2.13] M. A. Ratner and D. F. Shriver, Chem. Rev. 88 (1), 109-124 (1988).
[2.14] K. Aoki, T. Aramoto and Y. Hoshino, Journal of Electroanalytical Chemistry 340 (1–2),
127-135 (1992).
[2.15] T. Johansson, N. K. Persson and O. Inganas, Journal of the Electrochemical Society 151
(4), E119-E124 (2004).
[2.16] X. Wang and E. Smela, The Journal of Physical Chemistry C 113 (1), 369-381 (2009).
[2.17] X. Wang and E. Smela, The Journal of Physical Chemistry C 113 (1), 359-368 (2009).
[2.18] J. C. Lacroix, K. Fraoua and P. C. Lacaze, Journal of Electroanalytical Chemistry 444 (1),
83-93 (1998).
[2.19] F. Miomandre, M. N. Bussac, E. Vieil and L. Zuppiroli, Chemical Physics 255 (2–3), 291-
300 (2000).
[2.20] X. Wang, B. Shapiro and E. Smela, The Journal of Physical Chemistry C 113 (1), 382-401
(2009).
[2.21] O. Inganas, in Iontronics : Ionic carriers in organic electronic materials and devices,
edited by J. Leger, M. Berggren and S. A. Carter (CRC Press, Boca Raton, 2011), pp. 29-41.
[2.22] A. Elschner, S. Kirchmeyer, W. Lövenich, U. Merker and K. Reuter, in PEDOT, Principles
and Applications of an Intrinsically Conductive Polymer (CRC Press, 2010), pp. 113-166.
[2.23] G. G. Malliaras and J. C. Scott, J. Appl. Phys. 83 (10), 5399-5403 (1998).
[2.24] D. A. Bernards, S. Flores-Torres, H. D. Abruna and G. G. Malliaras, Science 313 (5792),
1416-1419 (2006).
[2.25] D. A. Bernards and G. G. Malliaras, Adv. Funct. Mater. 17 (17), 3538-3544 (2007).
[2.26] P. Atkins and J. de Paula, Physical Chemistry, 8th ed. (Oxford University Press, Great
Britain, 2006).

55
Chapter 3
3. Direct measurement of ion mobility in
a conducting polymer
Many organic electronic devices for energy harvesting, storage, information display, sensing
and actuation rely on mixed (electronic and ionic) transport within a single organic layer.
Although electronic transport in these materials is relatively well understood, a fundamental
understanding of ion transport is missing, mainly due to the lack of a direct method to assess
ion mobility in the simultaneous presence of electronic conduction. Using planar junctions
between the prototypical conducting polymer film poly(3,4-ethylenedioxythiophene) doped with
poly(styrene sulfonate) (PEDOT:PSS) and various electrolytes I was able to inject common ions
and directly observe their transit through the film. The one-dimensional geometry of the
experiment allowed a straightforward estimate of the ion drift mobilities. PEDOT:PSS was found
to support efficient transport of protons, potassium, sodium and choline ions, consistent with
the observation of extensive swelling of the film in water. Crosslinking the film decreased its
swelling and the ion mobility. The method presented here, therefore, paves the way for
establishing the relationship between structure and ion transport properties in this important
class of electronic materials.
This chapter is based closely on previously published work: “Direct measurement of ion mobility
in a conducting polymer”, E. Stavrinidou, P. Leleux, H. Rajaona, D. Khodagholy, J. Rivnay, M.
Lindau, S. Sanaur, and G. G. Malliaras, Adv. Mater. 2013, DOI: 10.1002/adma.201301240
Contribution: All experimental work and data analysis, wrote first draft of the manuscript and
commented on the final version.

56
3.1 Introduction
A key difference between organic electronic materials and inorganic ones such as
silicon lies in the ability of the former to transport ions with significant mobilities at room
temperature. This important property, which arises from the “soft” nature of van der Waals-
bonded organics, is leveraged in a variety of devices that utilize mixed electronic/ionic
conduction [3.1]. In electrochromic displays [3.2], for example, ions injected from an electrolyte
change the color of a polymer film. The dimensional changes that arise from ion injection are
used to build mechanical actuators (artificial muscles) [3.3]. Ion redistribution within a film
facilitates electronic charge injection from metal electrodes, an effect utilized to achieve
efficient electroluminescence in light emitting electrochemical cells [3.4, 3.5]. Finally, ion
diffusion across an interface is used to control the energetics of the heterojunction, thus
forming diodes [3.6, 3.7]. Mixed electronic/ionic conductivity is of particular importance for
devices that interface electronics with biology, a subject that is currently attracting a great deal
of attention [3.8, 3.9]. One example is the organic electrochemical transistor (OECT), in which
ions from an electrolyte enter a polymer film and change its electronic conductivity [3.10]. This
results in ionic-to-electronic signal transduction, and has found several applications in
biosensors [3.11]. A second example is the organic electronic ion pump (OEIP), in which an
electronic current in a conducting polymer film controls the delivery of ions into an aqueous
solution [3.12]. These devices have been used in vivo for drug delivery with unparalleled
spatiotemporal resolution [3.13].
Despite the emerging importance of ionic transport in organic electronics, very little is
known about the fundamentals of ion transport in these materials, and there has not been a
concerted effort towards the rational design of materials which simultaneously optimize
electronic and ionic transport. Ion transport has been studied in polymer electrolytes such as
Nafion using conductivity or diffusion measurements [3.14]. The simultaneous presence of
electronic carriers in mixed conductors, however, greatly complicates the analysis of data and
renders these techniques unusable. As a result, even for common materials used in mixed
conductor devices, such as PEDOT:PSS, ion mobility values are largely unknown. This is in sharp
contrast with electronic transport in organics, which has been under intense scrutiny since the
1970s, motivated largely by the application of organics in electrophotography [3.15]. The time-
of-flight technique, which measures the transit of photo-injected carriers through a thick film,
played a key role in enabling a better fundamental understanding of electronic transport in

57
organics [3.16]. This in turn led to the development of state-of-the-art materials, which helped
advance the emergence of organic electronics [3.17]. An equivalent technique for measuring
ionic transport would constitute a major step towards the development of mixed conductor
materials and devices.
Organic electronic materials are inherently electrochromic, meaning that the presence
of free electronic carriers creates states in the optical gap and changes the color of the film
[3.18]. This phenomenon has been used to monitor doping/dedoping effects in conducting
polymer films [3.19-3.21]. A variety of experimental configurations including injection of ions
from an electrolyte and injection or extraction of holes from a metal electrode, have been
employed. Depending on the exact geometry, ion or hole transport was the rate-limiting step in
the doping/dedoping process. In all of these experiments, however, ions and holes were
transported in directions that were perpendicular to each other. This 2-dimensional geometry
made it difficult to calculate the field inside the polymer film and to determine the ion mobility.
I was able to overcame this hurdle by developing a novel experimental set up to perform
measurements on planar electrolyte/PEDOT:PSS junctions, in which the one-dimensional
geometry of the experiment allows a straightforward estimation of the ion drift mobility.
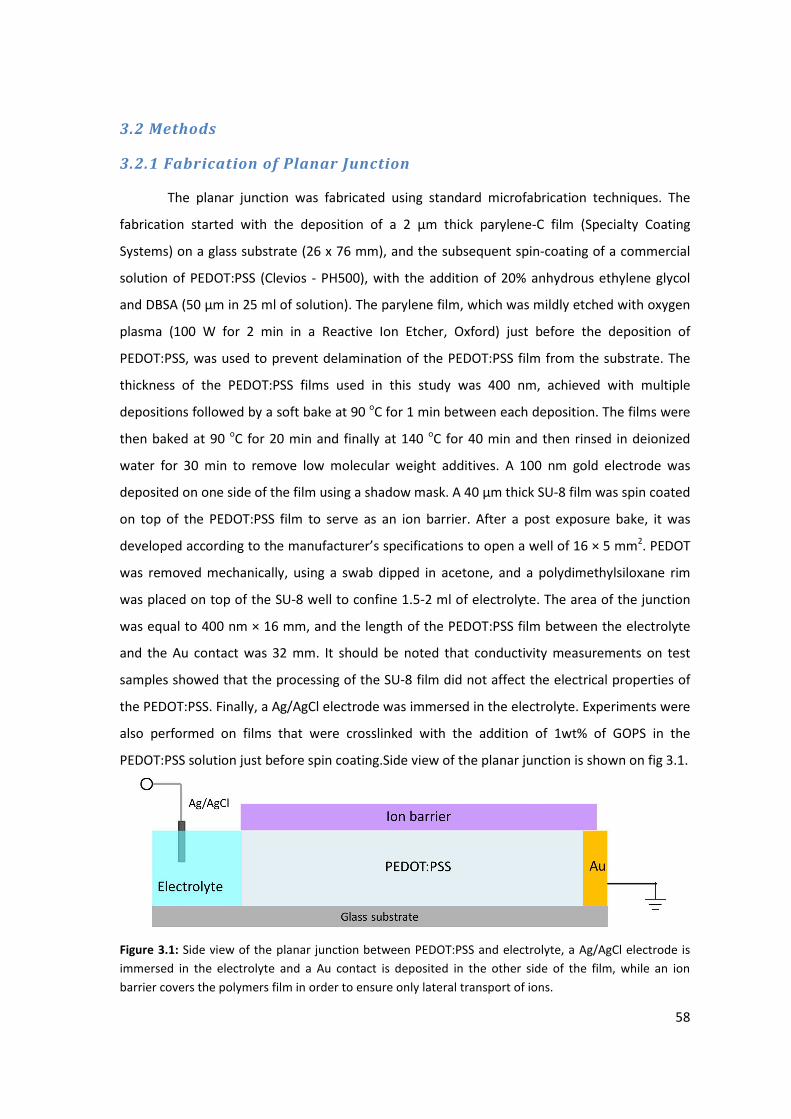
58
3.2 Methods
3.2.1 Fabrication of Planar Junction
The planar junction was fabricated using standard microfabrication techniques. The
fabrication started with the deposition of a 2 μm thick parylene-C film (Specialty Coating
Systems) on a glass substrate (26 x 76 mm), and the subsequent spin-coating of a commercial
solution of PEDOT:PSS (Clevios - PH500), with the addition of 20% anhydrous ethylene glycol
and DBSA (50 μm in 25 ml of solution). The parylene film, which was mildly etched with oxygen
plasma (100 W for 2 min in a Reactive Ion Etcher, Oxford) just before the deposition of
PEDOT:PSS, was used to prevent delamination of the PEDOT:PSS film from the substrate. The
thickness of the PEDOT:PSS films used in this study was 400 nm, achieved with multiple
depositions followed by a soft bake at 90 oC for 1 min between each deposition. The films were
then baked at 90 oC for 20 min and finally at 140
oC for 40 min and then rinsed in deionized
water for 30 min to remove low molecular weight additives. A 100 nm gold electrode was
deposited on one side of the film using a shadow mask. A 40 μm thick SU-8 film was spin coated
on top of the PEDOT:PSS film to serve as an ion barrier. After a post exposure bake, it was
developed according to the manufacturer’s specifications to open a well of 16 × 5 mm2. PEDOT
was removed mechanically, using a swab dipped in acetone, and a polydimethylsiloxane rim
was placed on top of the SU-8 well to confine 1.5-2 ml of electrolyte. The area of the junction
was equal to 400 nm × 16 mm, and the length of the PEDOT:PSS film between the electrolyte
and the Au contact was 32 mm. It should be noted that conductivity measurements on test
samples showed that the processing of the SU-8 film did not affect the electrical properties of
the PEDOT:PSS. Finally, a Ag/AgCl electrode was immersed in the electrolyte. Experiments were
also performed on films that were crosslinked with the addition of 1wt% of GOPS in the
PEDOT:PSS solution just before spin coating.Side view of the planar junction is shown on fig 3.1.
Figure 3.1: Side view of the planar junction between PEDOT:PSS and electrolyte, a Ag/AgCl electrode is
immersed in the electrolyte and a Au contact is deposited in the other side of the film, while an ion
barrier covers the polymers film in order to ensure only lateral transport of ions.

59
3.2.2 Experimental Set Up
The experimental set up includes the planar junction, an inverted Carl Zeiss Axio
Observer Z1 microscope and a KEITHLEY 2612A source-measure unit (SMU). The planar junction
was placed on a sample holder where connection with the metal electrode and Ag/AgCl with
the external circuit can be realized. The sample holder was placed on the inverted microscope
stage and was connected with the SMU. The SMU is controlled though a computer by a custom
LabView program while the microscope though the AxioVision Rel. 4.8 software of Zeiss. The
experiment was carried out by applying a positive bias at the Ag/AgCl electrode (which drove
cations from the electrolyte into the PEDOT:PSS film leading to its gradual dedoping) while
simultaneously measuring the current flow in the device and the electrochromic changes
associated with the propagation of the dedoping front though time lapse images, Fig. 3.2. The
time lapse images were recorded in the bright-field mode with a 1× objective. The images were
corrected to assure uniform light intensity throughout the field of view. Grey level profiles
along the x direction (from the electrolyte to the Au electrode) were calculated using a custom
MatLab program. For each Grey Level profile of time t the Grey Level Profile of t=0s (before
application of voltage) was subtracted. Therefore the data correspond to the change of
transmitted light intensity (ΔT) with respect to the zero bias state. Typical data for potassium
cations are shown in Fig. 3.3. Time t=0 s corresponds to the application of a bias, and x=0 mm
corresponds to the electrolyte/conducting polymer interface. The dedoping profiles exhibit a
clear saturation, indicating that a maximum level of dedoping was reached. The leading front
exhibits the typical shape associated with diffusive spread of the carriers. The drift length, ℓ, of
ions was obtained from the position of half-maximum change in ΔT, as indicated in Fig. 3.2b.
The dedoping front was not allowed to reach the Au electrode. The device was then short-
circuited to return to its doped state. This defined one cycle. The dedoping was found to be
reversible and the film returned to its doped state upon removal of the applied bias. I found a
few dedope/re-dope cycles were required in order to reach a reproducible temporal
dependence of the current during a dedoping cycle. This is consistent with previous
measurements in conducting polymer films and has been attributed to hydration of the
polymer film during the first cycles [3.22]. All the data discussed from this point on were
obtained on films that were appropriately cycled to reach this reproducible behavior. It should
be noted that the well was made large enough to ensure that ion depletion of the electrolyte
was not an issue during the experiment. The device-to-device reproducibility was found to be

60
better than 15%, which permitted a pristine device to be used for each type of electrolyte. The
latter were freshly made before each measurement by adding the appropriate amounts of HCl,
KCl, NaCl, and choline chloride (Sigma Aldrich) in deionized water.
Figure 3.2: Time lapse images, where the evolution of the dedoping front in PEDOT:PSS during the
injection of potassium cations is recorded, upon application of 2V. The time interval is 5s and the first
image corresponds to the zero bias state.
Figure 3.3: Evolution of the dedoping front in PEDOT:PSS during the injection of potassium cations where
ΔT is the change of transmitted light intensity with respect to the zero bias state. Time t=0 corresponds
to the application of a bias voltage, and x=0 mm corresponds to the interface with the electrolyte. The
applied bias was 2 V. The red arrow indicates the drift length of ions at t=5 s.

61
3.3 Results and Discussion
The data obtained from these experiments were further analyzed using a simple
analytical model. The analytical model as well its validation with numerical simulations has
been described in Chapter 2. Briefly the model is based on the following physical mechanism:
PEDOT:PSS is a degenerately doped organic semiconductor, in which the semiconductor chain
(PEDOT) is p-type doped due to the presence of uncompensated sulfonate anions on the PSS
chain (PSS is added in excess, and only a fraction of its sulfonate anions is compensated by
holes and hence contributes to doping. These are the sulfonate anions considered here) Fig.
3.4a. When a positive bias is applied to the Ag/AgCl electrode, cations are injected into the
PEDOT:PSS film and drift towards the Au electrode, while holes drift towards the Au electrode.
Charge neutrality implies that cation injection is balanced by hole extraction, meaning that as
the sulfonate anions are compensated by the injected cations, the excess holes are swept away
by the hole drift current, Fig. 3.4b. The one-dimensional geometry of the experiment permits
the direct observation of the front between the dedoped part of the film, where the current is
dominated by cation drift, and the still-doped part of the film, where the current is dominated
by hole drift. The dedoped part extends a distance ℓ from the interface with the electrolyte,
where ℓ is the drift length of the injected cations. Accordingly, I model the partially dedoped
PEDOT:PSS film as two resistors in series (Fig. 3.4c) where RIcorresponds to the dedoped part
and RC corresponds to the still doped part. I assume that the cation mobility in the film is lower
than that of holes, hence the conductivity of the dedoped part of the film is lower than that of
the doped part of the film. Based on these assumptions one can show that V(ℓ)≈V, meaning
that the applied potential drops exclusively on the dedoped part. Accordingly, the drift length
increases with time as:
ℓ� = 2 ∙ � ∙ ' ∙ $ , (3.1)
where V is the applied bias and t is time, and μ is the mobility of the injected cations. The
current density, j, decreases with time as:
. = F∙� �∙�∙,�√% , (3.2)

62
where e is the elementary charge and P is the injected cation density in the dedoped part of the
film. The latter is assumed to be equal to the density of the sulfonate ions, as indicated in the
schematic of Fig. 3.4b.
Figure 3.4: (a) Schematic of the device indicating the charge distribution in the polymer film when it is in
its doped state (before application of voltage). The sulfonate groups are compensated by holes. (b)
Schematic of the device indicating the charge distribution when the polymer film is partially dedoped,
after application of voltage. In the dedoped area the sulfonate groups are compensated by the injected
cations. The drift length, ℓ, of injected ions, the total length, L , of the PEDOT:PSS film, and the area, A , of
the electrolyte/conducting polymer junction are indicated. (c) The equivalent circuit diagram, where RI and RC are the equivalent resistors corresponding to the dedoped and the still-doped parts of the
PEDOT:PSS film, respectively, and 'ℓ is the voltage at ℓ.

63
3.3.1 Measurement of Potassium mobility in PEDOT:PSS
Equation (3.1) allows a straightforward determination of the cation drift mobility from
the dedoping fronts. The solid circles in Fig. 3.5a show the temporal evolution of the drift length
of potassium cations in a PEDOT:PSS film. The line is a fit of the model, yielding a potassium
mobility of 1.4·10-3
cm2 V
-1 s
-1. This value is higher than the electrophoretic mobility of
potassium cations in bulk water at the limit of infinite dilution (7.6·10-4
cm2 V
-1 s
-1) [3.23],
implying first and foremost that the film is highly hydrated. Mobilities close to water are known
in gels as well as in polymers such as Nafion [3.24] and PSS [3.25] and are associated with
extensive hydration which leads to the formation of channels of water that occupy most of the
film volume. Indeed, the volume increase during swelling of a PEDOT:PSS film that was
appropriately cycled was measured using optical profilometry to be 155% (Fig. 3.6).
Figure 3.5: Temporal evolution of the drift length, ℓ, of potassium cations (a) and of the corresponding
current density, j, (b) in PEDOT:PSS and in crosslinked PEDOT:PSS films.
Exactly how water is distributed within (and how it alters) the physical microstructure
of PEDOT:PSS films is not fully understood. In PEDOT:PSS dispersions, PEDOT and PSS form a
poly-ion complex. The polyanion (PSS) is in excess and forms a PSS-rich shell around a poly-ion
rich core, yielding colloidal gel particles in suspension [3.26]. After proper shearing and
sonication, such colloidal particles are known to be in the range of 5-30 nm [3.27]. A commonly
agreed model of the film microstructure is the physical interconnection and flattening of these
colloidal gel particles upon film casting, whereby the channels for ion/electron motion are
predetermined by the colloids that were in suspension [3.27, 3.28]. Addition of a co-solvent,
such as the ethylene glycol in this work, is thought to invert or homogenize the content of the
colloidal particles, bringing more PEDOT to the surface, and enhancing the molecular scale
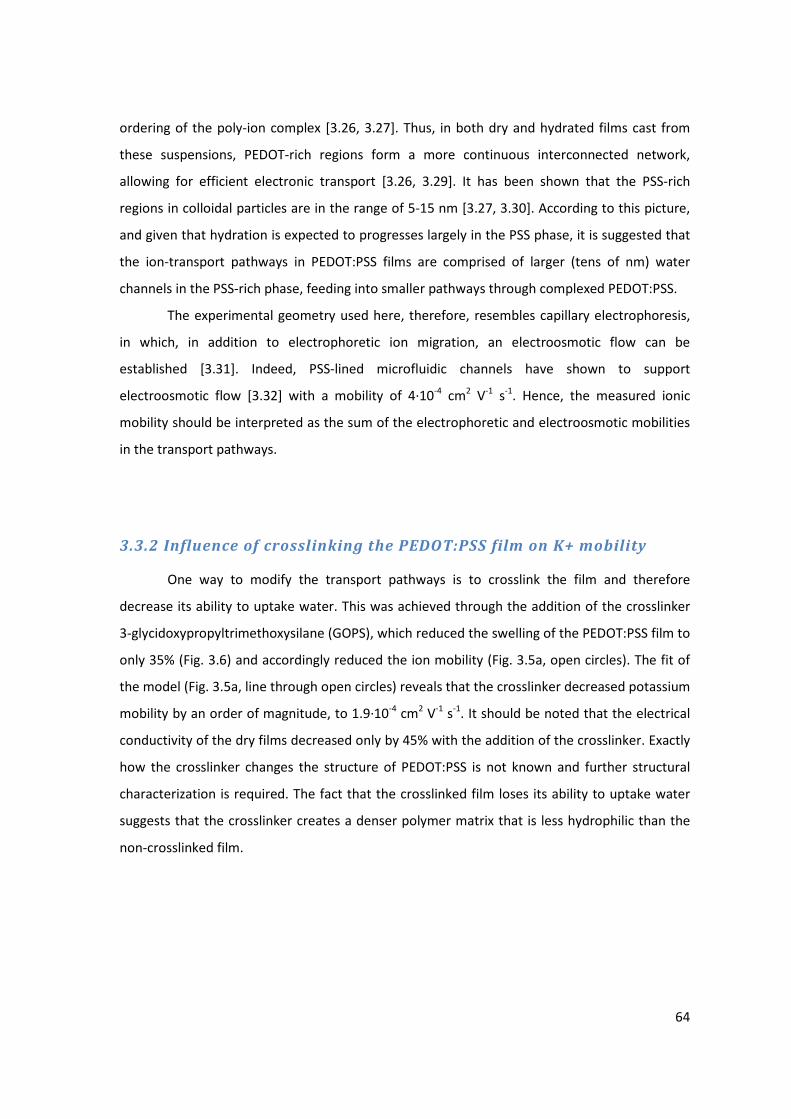
64
ordering of the poly-ion complex [3.26, 3.27]. Thus, in both dry and hydrated films cast from
these suspensions, PEDOT-rich regions form a more continuous interconnected network,
allowing for efficient electronic transport [3.26, 3.29]. It has been shown that the PSS-rich
regions in colloidal particles are in the range of 5-15 nm [3.27, 3.30]. According to this picture,
and given that hydration is expected to progresses largely in the PSS phase, it is suggested that
the ion-transport pathways in PEDOT:PSS films are comprised of larger (tens of nm) water
channels in the PSS-rich phase, feeding into smaller pathways through complexed PEDOT:PSS.
The experimental geometry used here, therefore, resembles capillary electrophoresis,
in which, in addition to electrophoretic ion migration, an electroosmotic flow can be
established [3.31]. Indeed, PSS-lined microfluidic channels have shown to support
electroosmotic flow [3.32] with a mobility of 4·10-4
cm2 V
-1 s
-1. Hence, the measured ionic
mobility should be interpreted as the sum of the electrophoretic and electroosmotic mobilities
in the transport pathways.
3.3.2 Influence of crosslinking the PEDOT:PSS film on K+ mobility
One way to modify the transport pathways is to crosslink the film and therefore
decrease its ability to uptake water. This was achieved through the addition of the crosslinker
3-glycidoxypropyltrimethoxysilane (GOPS), which reduced the swelling of the PEDOT:PSS film to
only 35% (Fig. 3.6) and accordingly reduced the ion mobility (Fig. 3.5a, open circles). The fit of
the model (Fig. 3.5a, line through open circles) reveals that the crosslinker decreased potassium
mobility by an order of magnitude, to 1.9·10-4
cm2 V
-1 s
-1. It should be noted that the electrical
conductivity of the dry films decreased only by 45% with the addition of the crosslinker. Exactly
how the crosslinker changes the structure of PEDOT:PSS is not known and further structural
characterization is required. The fact that the crosslinked film loses its ability to uptake water
suggests that the crosslinker creates a denser polymer matrix that is less hydrophilic than the
non-crosslinked film.
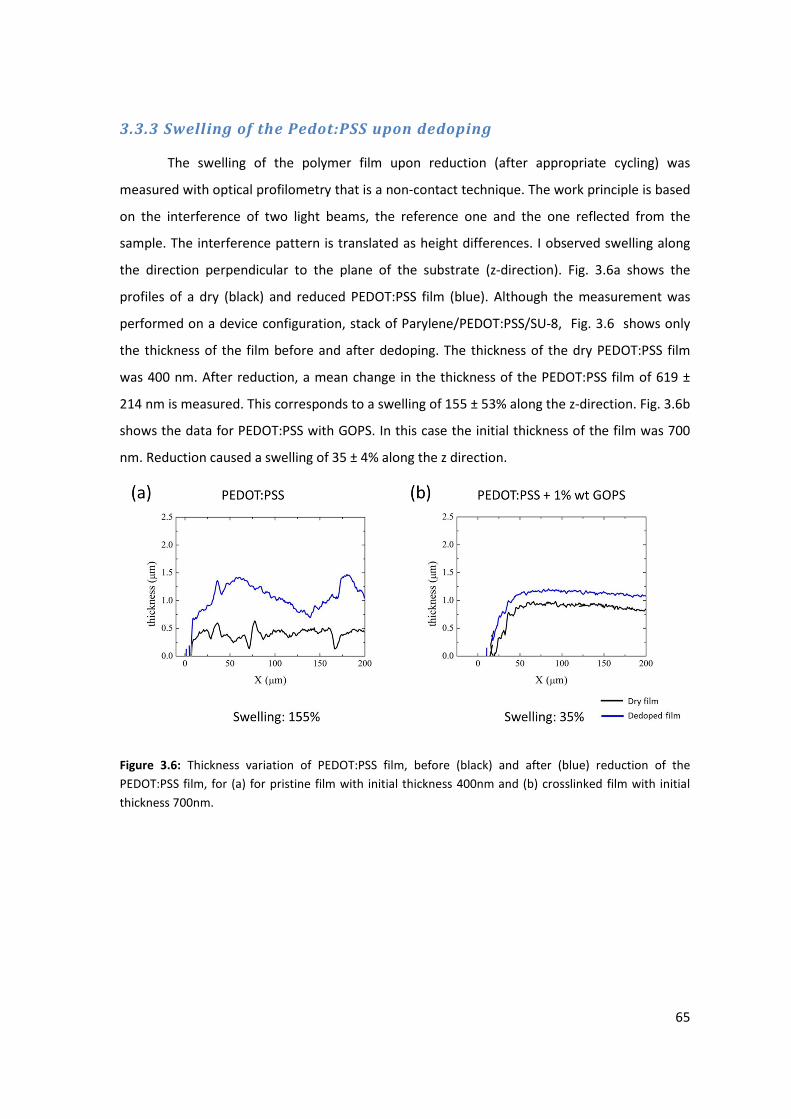
65
3.3.3 Swelling of the Pedot:PSS upon dedoping
The swelling of the polymer film upon reduction (after appropriate cycling) was
measured with optical profilometry that is a non-contact technique. The work principle is based
on the interference of two light beams, the reference one and the one reflected from the
sample. The interference pattern is translated as height differences. I observed swelling along
the direction perpendicular to the plane of the substrate (z-direction). Fig. 3.6a shows the
profiles of a dry (black) and reduced PEDOT:PSS film (blue). Although the measurement was
performed on a device configuration, stack of Parylene/PEDOT:PSS/SU-8, Fig. 3.6 shows only
the thickness of the film before and after dedoping. The thickness of the dry PEDOT:PSS film
was 400 nm. After reduction, a mean change in the thickness of the PEDOT:PSS film of 619 ±
214 nm is measured. This corresponds to a swelling of 155 ± 53% along the z-direction. Fig. 3.6b
shows the data for PEDOT:PSS with GOPS. In this case the initial thickness of the film was 700
nm. Reduction caused a swelling of 35 ± 4% along the z direction.
Figure 3.6: Thickness variation of PEDOT:PSS film, before (black) and after (blue) reduction of the
PEDOT:PSS film, for (a) for pristine film with initial thickness 400nm and (b) crosslinked film with initial
thickness 700nm.

66
3.3.4 Determination of injected cation density in PEDOT:PSS
The model can be further validated by analyzing the time dependence of current
density, j, which provides an estimate of the injected ion density, P, in the film (Fig. 3.5b). The
data for PEDOT:PSS films with and without crosslinker are well fitted by Eq. (3.2). As for the
drift length, the model predicts the correct time dependence of current density, indicating that
it captures the essential physics of ion injection in conducting polymers. For films with and
without crosslinker the fits yielded ion densities of 3.2·1020
cm-3
and 5.9·1020
cm-3
, respectively.
A key assumption of the model is that the injected cations compensate the sulfonate anions,
henceP is equal to the sulfonate anion density. The latter is estimated to be of the order of 3-
4·1020
cm-3
, assuming a sulfonate group for every 3-4 PEDOT monomer units [3.27], a 1:2.5 w/w
ratio of PEDOT to PSS (for Clevios PH500), and a density of 1 g/cm3 for the film. The good
agreement between the obtained values of P and sulfonate anion density lends additional
support to the model.
3.3.5 Effect of electrolyte concentration on ion mobility in PEDOT:PSS
The measurements above were carried out in electrolytes with a concentration of 10
mM. Measurements were also conducted with electrolyte concentrations spanning two orders
of magnitude, ranging from 1 mM to 100 mM. Saturated optical transmission profiles were
observed and Eq. (3.1) was found to hold in this concentration range allowing the mobility to be
determined (Fig. 3.7). For potassium the mobilities were found 3.6·10-4
cm2 V
-1 s
-1, 1.4·10
-3 and
2.0·10-3
cm2 V
-1 s
-1 for concentration of KCl electrolyte 0.001M, 0.01M and 0.1 M respectively. A
slight increase of the mobility with concentration was observed, indicating that mild heating of
the film might be taking place [3.33]. In electrolytes with concentrations of 1 M and higher, ℓ2
exhibited a sub-linear time dependence, which is not captured by our model. Such a deviation
can be described by strong ion-ion interactions, which render ion transport more dependent on
the coupling to the counter ions and invalidate the assumption that the ions are fully
dissociated. Ion concentrations lower than 1 mM were not investigated, as the potential drop
at the electrolyte becomes non-negligible.

67
Figure 3.7: Dependence of the drift length of K+ on time for various electrolyte (KCl) concentrations.
3.3.6 Effect of applied voltage on ion mobility in PEDOT:PSS
The ion mobility values were found independent of voltage in the range of 2-4V. In this
voltage range saturation of the optical profiles is observed and therefore full dedoping occurs
as the front is moving, completely in agreement with the model. In lower voltages I observed
non saturated profiles; the color continues changing as the front passes. This is not capture by
the model therefore the ion mobilities calculated will include an error.
3.3.7 Measuring the mobility of various cations in PEDOT:PSS
I subsequently evaluated the transport of different cations in PEDOT:PSS films. Fig. 3.8
shows the drift length of protons, potassium, sodium and choline (C5H14NO+) cations, at a
concentration of 10 mM. The data for all ions follow the ℓ2 vs. t dependence, allowing the
determination of mobilities, shown in Table 3.1. As with potassium, the mobilities of these ions
in PEDOT:PSS were found to be a bit higher that the electrophoretic mobilities measured in bulk
water, indicating that electroosmosis plays a role in ion transport in PEDOT:PSS. These results
emphasize that PEDOT:PSS is an efficient ion transporter for applications in bio-interfacing,
where the film is in direct contact with and hence takes up water. However, PEDOT:PSS is not
stable over long times to immersion in water and dissolves or delaminates upon agitation.
Addition of a crosslinker such as GOPS [3.34] or the use of a vapor-phase deposited PEDOT

68
[3.35] have been used as alternatives that enable long-term operation of devices. This work
implies that such approaches trade, to a certain extent, ion mobility for stability, and that
further understanding and engineering of the polymer microstructure is needed to allow co-
optimization of stability, electronic transport and ion transport.
Figure 3.8: Temporal evolution of the drift length, ℓ, of various cations in PEDOT:PSS during a dedoping
cycle.
Table 3.1: Mobility of various cations in PEDOT:PSS (measured with 10 mM solutions) and in
water at the limit of infinite dilution.
Ion Mobility in PEDOT:PSS
( ¢£¤¥N¦§N¦)
Electrophoretic mobility in bulk
water
(¢£¤¥N¦§N¦)
H+
3.9 ± 0.2 ∙ 10N0(N = 3) 3.6 ∙ 10N0 (from [3.23])
K+
1.4 ± 0.2 ∙ 10N0(N = 8) 7.6 ∙ 10NG (from [3.23])
Na+
9.3 ± 0.4 ∙ 10NG(N = 3) 5.2 ∙ 10NG (from [3.23])
C5H
14NO
+
4.5 ± 0.4 ∙ 10NG(N = 3) 3.9 ∙ 10NG (calculated from [3. 36])

69
Of particular interest is the fact that choline, an organic cation that is an essential
nutrient, is transported efficiently in PEDOT:PSS. This implies that the size of water channels in
PEDOT:PSS is larger than the size of the choline ion, and prompts the question of what the
maximum ion size is for efficient transport through this material. This question has important
technological ramifications for the design of OEIPs, which employ electrophoretic transport of
ions in a conducting polymer film. It has been shown that these devices can deliver a variety of
neurotransmitters [3.13], including acetylcholine [3.37]. The method described here can help
answer this question by quantifying the mobility of biologically-relevant ions.
3.3.8 Determination of hole mobility in PEDOT:PSS
Furthermore, estimation the hole mobility in PEDOT:PSS can be made. According to the
model, the extrapolated current at t=0 s is dominated by hole transport (resistor RC is dominant
in the equivalent circuit diagram of Fig. 3.4c), and hence reflects the hole conductivity in the
film. Assuming that the hole density (which is equal to the sulfonate density) is equal to the
injected ion density, a hole mobility of approximately 0.06 cm2 V
-1 s
-1 is obtained for both the
pristine and the crosslinked films, respectively. These values are considerably higher than the
values determined for the potassium mobility, which is consistent with the key assumption of
the model, namely that the conductivity of the dedoped part of the film is lower than that of
the doped part of the film. It should be noted that the hole mobility can be independently
determined by analyzing the response of OECTs to constant gate current [3.10]. Devices made
from the same PEDOT:PSS film were fabricated and a hole mobility of 0.01 cm2 V
-1 s
-1 was
obtained (see Appendix A1). This value is in good agreement with the one estimated by ion
injection, which further supports for the validity of the model.
3.4 Conclusions-Outlook
In this chapter I presented a method that enables direct measurement of ion mobilities
in conducting polymers. By utilizing the electrochromic property of conducting polymers I was
able to monitor the transit of ions though the film upon injection from an electrolyte and define
their drift length in the conducting polymer at each time. The one dimensionality of the device
allows the use of a simple analytical model based on two resistors in series that leads to
extraction of ion mobility and injected ion density. I measured the mobilities of proton,
potassium, sodium and choline in PEDOT:PSS. In all cases the mobilities were found a bit higher

70
than the electrophoretic mobilities in bulk water suggesting first that PEDOT:PSS can efficiently
transport ions and second that electroosmosis plays a role in ion transport by adding a
component in their electrophoretic speed. Hydration plays a primary role in ion transport as the
films volume increases more than 100%. Crosslinking the film, reduced its ability to uptake
water and hence the ion mobility.
In this work I focused on ions that are injected in the film from aqueous solutions,
which is of particular interest to bio-interfacing. In other applications of mixed ionic/electronic
transporters, such as in light-emitting electrochemical cells, the organic layer is not in contact
with an electrolyte and hence ion transport occurs in a dry film. This limit can also be
approached with the method described here, if an ionic liquid is used to supply the ions instead
of an electrolyte solution. As solvent-free ion solutions, ionic liquids can inject non-solvated
ions into a conducting polymer, which creates an opportunity to study ion transport in a
different regime. Ionic liquids have already been used as a source of mobile ions in ionic
polymer transducers [3.38]. Alternatively, a solid electrolyte can be used as a source of ions in
order to avoid hydration and allow a measurement of ion transport in a dry film. The results
presented above show that mobility decreases when hydration is decreased, which brings up
the question of what is the “sensitivity” of this method. Eq. (3.1) shows that for a mobility of 10-
8 cm
2 V
-1 s
-1 and an applied bias of 2 V, the front moves 2 μm in the first 1 s of the
measurement. Given that PEDOT:PSS can be patterned with <<1 μm line edge roughness using
photolithography [3.39], the method described here appears to be suitable for such
measurements. Finally, the model can be easily adapted to other configurations such as the
doping of intrinsic organic semiconductors, or the dedoping of n-type organic semiconductors,
broadening the matrix of materials in which ion transport can be measured. As interest in
organic electronic materials that support both electronic and ionic transport increases, the
method developed here will play an important role in establishing structure vs. ion transport
properties relationships.

71
3.5 References
[3.1] Leger, J.M. Organic Electronics: The Ions Have It. Advanced Materials 20, 837-841 (2008).
[3.2] Mortimer, R.J., Dyer, A.L. & Reynolds, J.R. Electrochromic organic and polymeric materials
for display applications. Displays 27, 2-18 (2006).
[3.3] Smela, E. Conjugated polymer actuators. Mrs Bulletin 33, 197-204 (2008).
[3.4] Pei, Q., Yu, G., Zhang, C., Yang, Y. & Heeger, A.J. Polymer Light-Emitting Electrochemical
Cells. Science 269, 1086-1088 (1995).
[3.5] deMello, J.C., Tessler, N., Graham, S.C. & Friend, R.H. Ionic space-charge effects in polymer
light-emitting diodes. Physical Review B 57, 12951-12963 (1998).
[3.6] Cheng, C.H.W. & Lonergan, M.C. A Conjugated Polymer pn Junction. Journal of the
American Chemical Society 126, 10536-10537 (2004).
[3.7] Bernards, D.A., Flores-Torres, S., Abruna, H.D. & Malliaras, G.G. Observation of
electroluminescence and photovoltaic response in ionic junctions. Science 313, 1416-1419
(2006).
[3.8] Berggren, M. & Richter-Dahlfors, A. Organic bioelectronics. Advanced Materials 19, 3201-
3213 (2007).
[3.9] Owens, R.M. & Malliaras, G.G. Organic electronics at the interface with biology. Mrs
Bulletin 35, 449-456 (2010).
[3.10] Bernards, D.A. & Malliaras, G.G. Steady-state and transient behavior of organic
electrochemical transistors. Advanced Functional Materials 17, 3538-3544 (2007).
[3.11] Lin, P. & Yan, F. Organic Thin-Film Transistors for Chemical and Biological Sensing.
Advanced Materials 24, 34-51 (2012).
[3.12] Isaksson, J. et al. Electronic control of Ca2+ signalling in neuronal cells using an organic
electronic ion pump. Nature Materials 6, 673-679 (2007).
[3.13] Simon, D.T. et al. Organic electronics for precise delivery of neurotransmitters to
modulate mammalian sensory function. Nature Materials DOI: 10.1038/nmat2494 (2009).
[3.14] Smitha, B., Sridhar, S. & Khan, A.A. Solid polymer electrolyte membranes for fuel cell
applications—a review. Journal of Membrane Science 259, 10-26 (2005).
[3.15] Borsenberger, P.M. & Weiss, D.S. Organic Photoreceptors for Xerography (Marcel
Dekker, Inc., New York, NY, 1998).
[3.16] Bässler, H. Charge Transport in Disordered Organic Photoconductors a Monte Carlo
Simulation Study. physica status solidi (b) 175, 15-56 (1993).
[3.17] Malliaras, G. & Friend, R. An organic electronics primer. Physics Today 58, 53-58 (2005).
[3.18] Friend, R.H. Conjugated Polymer Semiconductor-Devices - Characterization of Charged
and Neutral Excitations. Synthetic Metals 51, 357-371 (1992).
[3.19] Aoki, K., Aramoto, T. & Hoshino, Y. Photographic measurements of propagation speeds of
theconducting zone in polyaniline films during electrochemical switching. Journal of
Electroanalytical Chemistry 340, 127-135 (1992).
[3.20] Johansson, T., Persson, N.-K. & Inganäs, O. Moving Redox Fronts in Conjugated Polymers
Studies from Lateral Electrochemistry in Polythiophenes. Journal of the Electrochemical Society
151, E119-E124 (2004).
[3.21] Wang, X. & Smela, E. Experimental Studies of Ion Transport in PPy(DBS). The Journal of
Physical Chemistry C 113, 369-381 (2009).
[3.22] Wang, X. & Smela, E. Color and Volume Change in PPy(DBS). The Journal of Physical
Chemistry C 113, 359-368 (2009).
[3.23] Atkins, P. & de Paula, J. Physical Chemistry (Oxford University Press, Great Britain, 2006).

72
[3.24] Knauth, P., Sgreccia, E., Donnadio, A., Casciola, M. & Di Vona, M.L. Water Activity
Coefficient and Proton Mobility in Hydrated Acidic Polymers. Journal of the Electrochemical
Society 158, B159-B165 (2011).
[3.25] Tybrandt, K., Forchheimer, R. & Berggren, M. Logic gates based on ion transistors. Nature
Communications 3, 871 (2012).
[3.26] Okuzaki, H. in Active-Matrix Flatpanel Displays and Devices (AM-FPD), 2012 19th
International Workshop on 53-56 (2012).
[3.27] Elschner, A., Kirchmeyer, S., Lövenich, W., Merker, U. & Reuter, K. in PEDOT, Principles
and Applications of an Intrinsically Conductive Polymer 113-166 (CRC Press, 2010).
[3.28] Nardes, A.M. et al. Microscopic Understanding of the Anisotropic Conductivity of
PEDOT:PSS Thin Films. Advanced Materials 19, 1196-1200 (2007).
[3.29] Ashizawa, S., Horikawa, R. & Okuzaki, H. Effects of solvent on carrier transport in
poly(3,4-ethylenedioxythiophene)/poly(4-styrenesulfonate). Synthetic Metals 153, 5-8 (2005).
[3.30] Jukes, P.C. et al. Controlling the Surface Composition of Poly(3,4-ethylene
dioxythiophene)–Poly(styrene sulfonate) Blends by Heat Treatment. Advanced Materials 16,
807-811 (2004).
[3.31] Weinberger, R. Practical Capillary Electrophoresis, Second Edition (Academic Press, San
Diego, CA, 2002).
[3.32] Barker, S.L.R., Tarlov, M.J., Canavan, H., Hickman, J.J. & Locascio, L.E. Plastic Microfluidic
Devices Modified with Polyelectrolyte Multilayers. Analytical Chemistry 72, 4899-4903 (2000).
[3.33] Ding, W., Thornton, M.J. & Fritz, J.S. Capillary electrophoresis of anions at high salt
concentrations. Electrophoresis 19, 2133-2139 (1998).
[3.34] Khodagholy, D. et al. Highly Conformable Conducting Polymer Electrodes for In Vivo
Recordings. Advanced Materials 23, H268-+ (2011).
[3.35] Winther-Jensen, B. & West, K. Stability of highly conductive poly-3,4-ethylene-
dioxythiophene. Reactive & Functional Polymers 66, 479-483 (2006).
[3.36] Ng, B. & Barry, P.H. The measurement of ionic conductivities and mobilities of certain
less common organic ions needed for junction potential corrections in electrophysiology.
Journal of Neuroscience Methods 56, 37-41 (1995).
[3.37] Tybrandt, K. et al. Translating Electronic Currents to Precise Acetylcholine-Induced
Neuronal Signaling Using an Organic Electrophoretic Delivery Device. Advanced Materials 21,
4442-+ (2009).
[3.38] Bennett, M.D. & Leo, D.J. Ionic liquids as stable solvents for ionic polymer transducers.
Sensors and Actuators A: Physical 115, 79-90 (2004).
[3.39] DeFranco, J.A., Schmidt, B.S., Lipson, M. & Malliaras, G.G. Photolithographic patterning
of organic electronic materials. Organic Electronics 7, 22-28 (2006).

73
Chapter 4
4. Engineering ion transport in
conducting polymers
Although tuning the electronic properties of conducting polymers has been addressed in
numerous ways not a lot has been done to refine the ionic properties of these materials.
Understanding the high correlation of hydration and ionic conductivity enables us to engineer
materials with high and defined ion mobilities. As an example collaborators from Monash
University developed composites of poly(3,4-ethylenedioxythiophene) doped with tosylate
(PEDOT:TOS) and the hydrogel protein Gelatin. I characterized ion transport in these composites
and found that they show enhanced ion mobility in comparison with the neat PEDOT:TOS film.
We were able to tune the value of ion mobility by adjusting the relative ratio of the hydroscopic
phase to PEDOT:TOS. Surprisingly the electronic conductivity of the samples remain fairly
unaffected, ensuring that the PEDOT:TOS-Gelatin composites can efficiently support mixed
conduction. We expect that the method presented in this chapter will contribute towards the
rational design of materials that simultaneously optimize electronic and ionic transport.
This chapter is based closely on submitted to be published work: “Engineering hydrophilic and
biocompatible conducting composites with enhanced and tunable ion mobility”, E. Stavrinidou,
O. Winther-Jensen, B. S. Shekibi, V. Armel, J. Rivnay, E. Ismailova, S. Sanaur, G. G. Malliaras and
B. Winther-Jensen
Contribution: Ion transport characterization, wrote big part of introduction and ion transport
results and discussion.
Note: Development of the composites, EQCM and DCS characterization was performed by
collaborators in Monash University (O. W.-J., B. S. S., V. A., B. W.-J.)

74
4.1 Introduction
Conducting polymers (CP) can support both electronic and ionic transport making them
attractive for a variety of applications [4.1]. The operation mechanism of electrochromic
displays [4.2], fuel cells [4.3], light emitting electrochemical cells [4.4, 4.5] and organic
bioelectronic devices [4.6, 4.7] relies on the mixed conductivity of CP. While tuning their
electronic properties has been addressed in numerous ways for example by tuning the doping,
the macromolecular chemistry, or the solid state/structure film morphology not a lot has been
done to refine the ionic properties of these materials. The main reason is our poor
understanding on the mechanism of ion transport in organic mixed conductors. A method for
studying ion transport in CPs, the so called moving front experiment, is based on their
electrochromic property. The doping state of the film changes upon injection / extraction of
ions from/into an electrolyte with a consequent change in the color of the film. Monitoring the
change on the optical transmission intensity can be used to follow the kinetics of injection and
transport of ions in the polymer film. This technique has been introduced by Aoki at al. [4.8]
and has been applied later by Johansson et al. [4.9] and Wang et al. [4.10, 4.11]. In the previous
chapter I presented a one-dimensional configuration of the moving front experiment that
allows straightforward measurement of ion mobilities in CP [4.12]. Mobilities of common metal
ions were measured in poly(3,4-ethylenedioxythiophene) poly(styrenesulfonate) (PEDOT:PSS)
and were found comparable with their mobilities in water. This suggests that PEDOT:PSS is
highly hydrated, a finding which was confirmed by swelling measurements. Crosslinking the film
reduced its ability to uptake water and decrease the ion mobilities. Therefore, there is a strong
correlation between ion mobility and hydration of the film. In PEDOT:PSS it is thought that
hydration takes place in the PSS phase, but it’s challenging to systematically change the ratio of
PSS and it can only be done in synthesis level. In the work presented in this chapter we
overcame this hurdle by incorporating a water transport phase in the precursor mixture of
Vapor Phase Polymerized (VPP) PEDOT.
We engineer mixed conductors by adding a biological matrix in poly(3,4-
ethylenedioxythiophene):(tosylate) (PEDOT:TOS). These biocompatible composites show
improved and tunable ionic conductivity while they largely retain their electronic properties.
We introduce a new route for the incorporation of hydrophilic polymers like gelatin by utilizing
non-traditional solvents for the precursor solution. Solvents that are commonly used like
butanol can cause denaturation of biomolecules or can contribute to their gelation when in the

75
oxidant solution (iron para-toluene sulphonate (Fe(III)TOS)). Acetic acid is found to be a suitable
replacement. It is a weak acid, thereby it doesn’t cause denaturation of the biomolecules and it
preferably coordinates to Fe(III) preventing their gelation. Gelatin has the ability to uptake
water [4.13] and thus will create hydrophilic pathways through the film that will facilitate ion
transport. The composites show improved ion transport compared with neat PEDOT:TOS and
the value of ion mobility can be tuned by adjusting the relative ratio of the components. At the
same time the electronic conductivity does not vary significantly with the addition of gelatin.
Previously it has been reported that these composites are biocompatible and facilitate the
proliferation of brain barrier cells since these cells cannot produce their own ECM (Extra
Cellular Matrix) [4.14]. Therefore the biocompatible PEDOT:TOS-Gelatin composites that
support efficiently ionic and electronic transport are ideal for interfacing with biological
systems.

76
4.2 Methods
4.2.1 PEDOT:TOS-Gelatin composites preparation
PEDOT:TOS-Gelatin films were deposited on glass substrates by Vapor Phase Polymerization in
the presence of an oxidant solution. Vapor phase polymerization (VPP) is a synthesis method
that can be used to form thin homogenous, highly conducting polymers film on various
substrates and geometries and was originally described by Mohammadi et al. [4.15]. It is a
chemical polymerization method where an oxidant solution is deposited on a substrate and the
substrate is exposed to a monomer vapour. The oxidant solution was prepared as follows: 419
mg Fe(III)TOS were dissolved in 0.80 ml of 1:1.67 water:acetic acid (v/v) mixture in a vial and 24
μl pyridine were added and vigorously stirred. In a separate vial, gelatin (17, 26, 33mg and 67
mg for PEDOT:TOS-33% Gelatin, PEDOT:TOS-44%Gelatin, PEDOT:TOS -50% Gelatin, PEDOT:TOS
-67% Gelatin was dissolved in 0.625 ml of 1:1.5 water:acetic acid (v/v). The percentage of
Gelatin in the sample corresponds to the w/w ratio of the PEDOT:TOS resulting from them
amount of Fe(III)TOS and the added Gelatin in the oxidant solution. The gelatin was omitted for
neat PEDOT:TOS. The oxidant mixture was then added to the gelatin solution and stirred to mix
thoroughly. The mixture was immediately spin-coated on the substrate at 1500 rpm for 30 s.
The coated substrate was then placed in the preheated monomer chamber at 70 oC. The
chamber was placed in an oven at 70 oC for a time period ranging between 30 min and one
hour, depending on the ratio. A higher additive content requires a longer polymerization time
e.g. 45 min for PEDOT:TOS-50%Gelatin and 1 h for PEDOT:TOS-67%Gelatin. Following
polymerization, the film was cooled to room temperature and rinsed with ethanol three times.
4.2.2 Fabrication of planar junction
The fabrication procedure of the planar junction is based on the one described in the
previous chapter with some modifications. The PEDOT:TOS and PEDOT:TOS-Gelatin films were
deposited on a glass substrate with a thin layer of plasma polymerized maleic anhydride coating
to serve as an adhesion layer between the substrate and the PEDOT in order to avoid
delamination of the polymer film during the experiment. The films were dried in a vacuum oven
for 48 hours to remove any remaining water molecules. A 100 nm gold electrode was
evaporated on one side of the film using a shadow mask. A 40 μm thick SU-8 film was spin
coated on top of the PEDOT:TOS film to serve as an ion barrier. After post exposure bake, it was

77
developed according to the manufacturer specifications to open a well of 16 × 5 mm2. To
enhance the adhesion of the ion barrier and polymer film, the samples were hard baked for 5
min at 100°C and for 5 min at 105°C. The exposed PEDOT in the well was removed mechanically
using a swab dipped in de-ionized water. A polydimethylsiloxane rim was placed on top of the
SU-8 well to confine 1.5-2 ml of electrolyte. The area of the junction was equal to thickness of
each film (~300 nm) × 16 mm, and the length of the PEDOT:TOS film between the electrolyte
and the Au contact was 3.2 cm. It should be noted that conductivity measurements on test
samples showed that the processing of the SU-8 film did not affect the electrical properties of
the PEDOT:TOS.

78
4.3 Measuring ion mobility in PEDOT:TOS-Gelatin composites
I measured ion mobility in the PEDOT:TOS-Gelatin composites, using planar junctions
between the PEDOT:TOS-Gelatin composite and the NaTOS (sodium p-toluenatesulfonate)
electrolyte. The method I developed is described in detailed the previous chapter. In this case
dedoping was achieved by applying a positive bias of 2.5V to a Pt electrode in respect to the
film. This voltage ensures saturation of the optical transmission profiles indicating full dedoping
of the area. The device, in order to return to the doped state, was then reversely biased at -
0.5V and finally at -1V. This defined one cycle. The current vs. time curves were found to reach
a reproducible behavior after the first 2-3 cycles.
When positive voltage is applied in the electrolyte with respect with the film, the
tosylate anions are extracted from the film into the electrolyte and at the same time holes are
extracted from the film through a Au electrode in order to preserve electroneutrality in the
film. The film is being dedoped and due to electrochromism the color changes, allowing
monitoring of the optical transmission of the film. From the change of the optical transmitted
intensity with respect with the initial state I define the drift length of ions at each time. The one
dimensional geometry, ions and holes moving in the same direction, allows the determination
of ion mobility using the relationship
ℓ� = 2 ∙ � ∙ ' ∙ $ (4.1),
where ℓ is the drift length of ions, µ the mobility of ions in the film and V is the applied
voltage.
When composite films were made by the addition of gelatin, a moving dedoping front was
observed. For PEDOT:TOS-33% Gelatin composite, the front was parallel to the electrolyte/film
interface. However, the dedoping front was found to exhibit zig-zag-like features which imply
non-uniform dedoping (at the scale of the optical microscopy, Fig. 4.1a), most likely arising from
non-uniform gelatin distribution. The mean displacement of the front that corresponds to the
drift length of ions is calculated from the change of the transmitted light intensity (ΔT). ΔT
profiles are calculated along the x-direction (from the electrolyte/film interface towards the Au
electrode) after averaging the y-axis values. The averaging ensures that the extracted value for
mobility is that of an average lateral ion transport. By fitting the experimental data to equation
(4.1) the mobility of the tosylate ions in the film can be calculated. For the PEDOT:TOS-(33%

79
Gelatin) composite the mobility was found to be 1.2.10
-5 cm
2V
-1s
-1. When we increased the
relative amount of gelatin the front edge was uniform (fig 4.1a.) and the ion mobility was found
to be 2.8.10
-5 cm
2V
-1s
-1, 4.0
.10
-5 cm
2V
-1s
-1 and 7.8
.10
-5 cm
2V
-1s
-1 for PEDOT:TOS-Gelatin films with
44% Gelatin, 50% Gelatin and 67% Gelatin respectively (Fig. 4.1b). The reproducibility of
multiple replicates was better than 15%. It should be noted that I was not able to measure the
mobility of ions in neat PEDOT:TOS since the dedoping front was pinned at the interface (Fig.
4.1a.). This can be attributed to collapsing of the CP film after initial dopant removal as has
been reported elsewhere [4.16], which constricts ion transport pathways. The mobility of
tosylate anions in PEDOT:TOS-67% Gelatin is only one order of magnitude lower than reported
values for mobility of common metal ions in water. Higher concentrations of Gelatin led to an
excess of gelatin that couldn’t be incorporated to the polymer matrix and no further
enhancement in ion mobility was observed. Lower concentrations were not tested since the
PEDOT:TOS-33% Gelatin seems to be the threshold of percolating gelatin domains.

80
4.4 Electronic conductivity of PEDOT:TOS-Gelatin composites
By adding an electrical insulator in a conducting matrix one would expect the electrical
conductivity to decrease. However it has been reported that incorporation of the non-
conducting PEG in PEDOT:TOS matrix enhanced its electronic properties [4.17]. Clearly in the
case of Gelatin we see a different trend. The electrical properties of the PEDOT:TOS-Gelatin
composites were tested with four probe measurement using a Jandel tool. Four probe
measurement is commonly used for determining conductivity of thin films and has the
advantage that the contact resistances are not taken into account. From the measurement the
sheet resistance }² is determined and the conductivity can be extracted from the relationship
(4.2)
= :� = :
³´∙7 (4.2)
Where d is the thickness of the film and was measured using the mechanical profilometer
Veeco Dektak 150.
The conductivities of the composites are in the same range as neat PEDOT:TOS. For the
composite up to 50%Gelatin the conductivity is around 300S/cm, 25% less than neat
PEDOT:TOS but still a high value for CP Fig. 1c. The dilution effect, by the increase of the non-CP
content, was more obvious with PEDOT:TOS-67%Gelatin where a further decrease in
conductivity of the composite was observed . Gelatin does not seem to affect the electronic
transport implying that its role is more passive and does not disturb the electronic overlap of
the PEDOT:TOS structure. More detailed analysis requires structural characterization and goes
beyond the scope of this work.

81
Figure 4.1: (a) Micrographs of the dedoped area (initiating from the electrolyte/film interface) at t=100s
for neat PEDOT:TOS and PEDOT:TOS-Gelatin composites, scale bar 0.5mm. With increasing amount of
Gelatin the drift length of ions is larger for the same time. (b) Ion mobility of tosylate anions as a function
of the amount of gelatin in the composites. (c) Electrical conductivity as a function of the amount of
gelatin in the composites.

82
4.5 Characterization of thermal behavior of the PEDOT:TOS-Gelatin
composites by Differential Scanning Calorimetry
In order to further investigate the interaction of PEDOT:TOS with gelatin, we performed
differential scanning calorimetry (DSC). Samples of various PEDOT:TOS-Gelatin ratios were
scanned from -80 oC to 200
oC using TA-Q100 DSC to study the glass transition temperature
(Tg), the PEDOT solid-solid state transition temperature and the water loss from gelatin. The
heating and cooling rate was 10°C/min with N2 purge at 50 ml/min. The solid-solid phase
transition and water loss component didn’t appear on subsequent scans on the same day. This
phenomenon is well understood as the (re-)uptake of water in gelatin and reordering of PEDOT
that occurs over several days. Practically a week was allowed between measurements of the
same samples and these showed reproducible traces. Typical DSC traces for PEDOT:TOS-Gelatin
composites are shown in Appendix A2 Fig. A.2 while the Tg, solid-solid state transition/water
loss peak positions and transition energies are summarized in Table 4.1. Changes of the Tg of a
polymer composite is a common tool used to determine the interaction between the
constituent polymers. An interaction is typically observed as a change in Tg of one polymer
component towards the Tg of the other. The almost unchanged Tg (~ -4 oC, Table 4.1) for all
gelatin-containing samples strongly indicates that a significant part of the gelatin in the
composites is in its “original” configuration not interacting with PEDOT. The transition energy
for water (liquid to vapor) is approximately 2260 J/g [4.18]. For a water content of 15%, as is
typical of gelatin [4.19], a peak around 100 oC [4.20] with a transition energy of ~340J/g would
be expected for pure gelatin, fitting well with the experimental data. The water loss peak from
gelatin and the solid-solid state transition from PEDOT (at ~ 137 oC with ~ 117 J/g for neat
PEDOT:TOS [4.21]) have merged into one peak for all composite samples. Considering the
different content of gelatin in the composites, the transition energy of the composites varied
proportionally. This indicates that gelatin in the PEDOT:TOS-Gelatin composites maintains the
same ability to take up water, and there is thus little interaction between PEDOT and gelatin.

83
Table 4.1: Glass transition temperature, water loss peak temperature and water loss energy for
Gelatin and PEDOT:TOS-Gelatin composites
Sample Tg (oC) Water loss peak T (
oC) Water loss energy (J/g)
PEDOT:TOS-33%Gelatin -4.3 101 162
PEDOT:TOS-50%Gelatin -3.7 82 267
PEDOT:TOS-67%Gelatin -3.5 102 304
100% Gelatin -4.4 109 351
4.6 Characterization of mass exchange with Electrochemical Quartz
Crystal Microbalance
The presence of Gelatin influenced the overall mass-movement in and out of the
composite films as measured using electrochemical quartz crystal microbalance (EQCM). EQCM
is versatile tool that allows monitoring of mass exchange between a sample and electrolyte
while redox reaction is taking place or in the case of conducting polymers a doping-dedoping
process with the application of voltage. A QCM sensor consists of a thin quartz disc sandwiched
between a pair of electrodes. Due to the piezoelectric properties of quartz, it is possible to
excite the crystal to oscillation by applying an AC voltage across its electrodes. The resonance
frequency of the sensor depends on the total oscillating mass. When a thin film is deposited to
the sensor, the frequency decreases. If the film is thin and rigid the decrease in frequency (Δf) is
proportional to the mass of the film (Δm) and the Sauerbrey equation is valid
∆� = −·O ∙ ∆¸ (4.3)
where Cf is the sensitivity factor of the crystal.
Although qualitative behavior can be easily extracted from the measurements,
quantitative behavior for soft matter requires parallel determination of the dissipation factor
that determines the change in the viscosity of system. In this case of soft and not rigid films the
Sauerbrey relation becomes invalid. A film that is "soft" (viscoelastic) will not fully couple to the
oscillation of the crystal but it will cause damping of the sensor’s oscillation by absorbing
energy. The EQCM system used in this work was the QCM200 from Stanford Research Systems.
This system takes information only from the fundamental frequency which has a more
dispersive behavior than the other harmonics and gives no information for the dissipation
factor rending the quantification of the results impossible. Therefore the results will be

84
discussed in qualitative manner. The QCM system is connected with a potensiostat (Bio-Logic-
Science Instrument) where the crystal acts as the working electrode. A Pt counter electrode and
a Ag/AgCl reference electrode are immersed in the liquid cell. Through the potensiostant we
apply a potential sweep to the film and through the QCM we monitor the frequency change of
the crystal/film system.
In figure 4.2 we show the resonance frequency of the film during a potential scan from
-1V to +0.5V (vs Ag/AgCl) in respect to the electrolyte. In neat PEDOT:TOS the resonance
frequency increases as the material is de-doped (from oxidized to reduced, from +0.5 to -1V)
confirming that the mass of the film is decreasing since the tosylate anions are extracted from
the film [4.22]. This is in contrast to PEDOT:PSS, where the dedoping shows an associated
increase in mass due to the injection of cations in the film (Appendix A3 Fig A.3). In PEDOT:TOS
even if some cations are injected from the electrolyte (Na+) the mass loss indicates that the
extraction of tosylate ions is the dominant process. However, increasing the gelatin content,
the EQCM trace gradually change with the PEDOT:TOS-67% Gelatin showing mass gain and loss
during dedoping. During reduction scanning from +0.4V to -0.2V the sample loses mass in
agreement with the dedoping process. For potentials more negative than -0.2 V a mass-gain is
observed, which can be explained by the potential dependent water-uptake of Gelatin. Gelatin,
as a derivative of the protein collagen, is characterized by an iso-electric point. The iso-electric
point covers both sides of neutral [4.23, 4.24], and can vary significantly depending on the
origin and production method of the gelatin used. The increase in pH (or in our case a more
negative applied potential) past the iso-electric point is known to increase the swelling of
gelatin (gels) significantly – in some cases by more than 1000% [4.23, 4.24]. This charge-induced
swelling results in an increase in the mass of the composite materials with high gelatin content.
When the gelatin content is sufficiently high, this effect becomes more dominant than the mass
loss associated with the de-doping of the CP. Therefore the limited interaction between PEDOT
and gelatin allows the gelatin domains to swell as a function of electrochemical potential.

85
Figure 4.2: Frequency change (inversely proportional to mass change) as a function of the applied voltage
for neat PEDOT:TOS and PEDOT:TOS-Gelatin composites (from bottom to top curve the gelatin content is:
0%, 33%, 44%, 50% and 67%) in 0.05M NaPTS electrolyte. Doping and dedoping direction are marked.
The scanning rate is 20mV/s.

86
4.7 Conclusions
We show that ion transport is improved in PEDOT:TOS with the addition of the hydrogel
protein gelatin. The PEDOT:TOS-Gelatin composite films showed a systematic increase in ion-
mobility with increasing gelatin content. The unchanged position of the gelatin Tg, the
systematic increase in water loss during DSC measurements, and the dependence of the gelatin
swelling on gelatin ratio at negative applied voltages all support the idea that gelatin forms
segregated hydrophilic domains that act as an ion “highway” within in the composite. A higher
concentration of gelatin, up to a point, provides easier movement of the dopant ions through
the CP matrix thereby resulting in higher ion mobility. This is supported by the increased ability
to uptake water as the gelatin amount increases and as a function of electrochemical potential
as QCM data suggest. Therefore gelatin forms hydrophilic segregated domains that act as an
ion “highway” in the composite and more gelatin provides easier movement of the dopant ions
through the CP matrix resulting in higher ion mobility.
In conclusion, we have developed a new method using acetic acid as a solvent in order
to prepare vapor-phase polymerized PEDOT composite films with hydrophilic biomolecules that
show enhanced and tunable ion mobility. Gelatin improves ion mobility in composites with
PEDOT:TOS, with DSC and EQCM results supporting a model whereby the gelatin creates
pathways that facilitate ion transport. The electronic properties of the samples remain fairly
unaffected, ensuring that the PEDOT:TOS-Gelatin composites can efficiently support mixed
conduction. We expect that the method developed and described in this work will contribute
towards the rational design of materials that simultaneously optimize electronic and ionic
transport.

87
4.8 References
[4.1] Leger, J.M. Organic Electronics: The Ions Have It. Advanced Materials 20, 837-841 (2008).
[4.2] Mortimer, R.J., Dyer, A.L. & Reynolds, J.R. Electrochromic organic and polymeric materials
for display applications. Displays 27, 2-18 (2006).
[4.3] A. K. Sahu, S. Pitchumani, P. Sridhar and A. K. Shukla, Bull Mater Sci 32 (3), 285-294 (2009).
[4.4] Pei, Q., Yu, G., Zhang, C., Yang, Y. & Heeger, A.J. Polymer Light-Emitting Electrochemical
Cells. Science 269, 1086-1088 (1995).
[4.5] deMello, J.C., Tessler, N., Graham, S.C. & Friend, R.H. Ionic space-charge effects in polymer
light-emitting diodes. Physical Review B 57, 12951-12963 (1998).
[4.6] Berggren, M. & Richter-Dahlfors, A. Organic bioelectronics. Advanced Materials 19, 3201-
3213 (2007).
[4.7] Owens, R.M. & Malliaras, G.G. Organic electronics at the interface with biology. Mrs
Bulletin 35, 449-456 (2010).
[4.8] K. Aoki, T. Aramoto and Y. Hoshino, Journal of Electroanalytical Chemistry 340 (1–2), 127-
135 (1992).
[4.9] T. Johansson, N. K. Persson and O. Inganas, Journal of the Electrochemical Society 151 (4),
E119-E124 (2004).
[4.10] X. Wang and E. Smela, The Journal of Physical Chemistry C 113 (1), 369-381 (2009).
[4.11] X. Wang and E. Smela, The Journal of Physical Chemistry C 113 (1), 359-368 (2009).
[4.12] E. Stavrinidou, P. Leleux, H. Rajaona, D. Khodagholy, J. Rivnay, M. Lindau, S. Sanaur and
G. G. Malliaras, Adv. Mater. 25 (32), 4488-4493 (2013).
[4.13] S. Fakirov, Handbook of Engineering Biopolymers: Homopolymers, Blends and
Composites; Carl Hanser Verlag: Munich, 2007.
[4.14] M. Bongo, O. Winther-Jensen, S. Himmelberger, X. Strakosas, M. Ramuz, A. Hama,
E. Stavrinidou, G. G. Malliaras, A. Salleo, B. Winther-Jensen and R. Owens, J. Mater. Chem.
B 2013, 1, 3860.
[4.15] Mohammadi, A., et al., Chemical vapor deposition (CVD) of conducting polymers:
Polypyrrole. Synthetic Metals, 1986. 14(3): p. 189-197.
[4.16] T. F. Otero, H. Grande and J. Rodríguez, J. Phys. Chem. B 1997, 101, 8525.
[4.17] L. H. Jimison, A. Hama, X. Strakosas, V. Armel, D. Khodagholy, E. Ismailova, G. G.
Malliaras, B. Winther-Jensen and R. M. Owens, J. Mater. Chem. 2012, 22, 19498.
[4.18] J. H. Lienhard, A Heat Transfer Textbook Third Edition; Phlogiston Press: Cambridge,
Massachusetts, U.S.A., 1981.
[4.19] S. Fakirov, Handbook of Engineering Biopolymers: Homopolymers, Blends and
Composites; Carl Hanser Verlag: Munich, 2007.
[4.20] C. Peña, K. de la Caba, A. Eceiza, R. Ruseckaite and I. Mondragon, Bioresour.
Technol. 2010, 101, 6836.
[4.21] B. Winther-Jensen, M. Forsyth, K. West, J. W. Andreasen, P. Bayley, S. Pas and D. R.
MacFarlane, Polymer 2008, 49, 481.
[4.22] D. Orata and D. A. Buttry, J. Am. Chem. Soc. 1987, 109, 3574.
[4.23] K. De Wael, S. De Belder, S. Van Vlierberghe, G. Van Steenberge, P. Dubruel and A.
Adriaens, Talanta 2010, 82, 1980.
[4.24] A. I. Raafat, J. Appl. Polym. Sci. 2010, 118, 2642.
88
Chapter 5
A Physical Interpretation of Impedance
at Conducting Polymer/Electrolyte
Junctions
In this chapter I monitor the process of dedoping in a planar junction between an electrolyte and
a conducting polymer using electrochemical impedance spectroscopy performed during moving
front measurements. The impedance spectra are consistent with an equivalent circuit of a time
varying resistor in parallel with a capacitor. I show that the resistor corresponds to ion transport
in the dedoped region of the film, and can be quantitatively described using ion density and drift
mobility obtained from the moving front measurements. The capacitor, on the other hand, does
not depend on time and is associated with charge separation at the moving front. This work
offers a physical description of the impedance of conducting polymer/electrolyte interfaces
based on materials parameters.
This chapter is based closely on to be submitted for publication work: “A Physical Interpretation
of Impedance at Conducting Polymer/Electrolyte Junctions”, E. Stavrinidou, M. Sessolo, B.
Winther-Jensen, S. Sanaur, and G. G. Malliaras
Contribution: Performed all experimental work and data modeling and analysis, wrote most of
the manuscript.
Note: Special thanks to Germà Garcia-Belmonte (Universitat Jaume I), Nicholas Melosh
(Stanford University), and Yvan Bonnassieux (Ecole Polytechnique) for fruitful discussions.

89
5.1 Introduction
Conjugated polymers represent an important class of organic electronic materials partly
because of their ability to conduct both electronic and ionic carriers [5.1, 5.2]. A variety of
(opto-)electronic devices rely on this key property of mixed conductivity for their operation
[5.3-5.9]. Of particular contemporary interest is the electrically doped form of these materials
(called conducting polymers). These materials are finding a host of applications in
bioelectronics, as transducers and actuators of biological phenomena [5.9-5.13]. A widely used
conducting polymer is PEDOT:PSS, in which the semiconducting poly(3,4-
ethylenedioxythiophene) (PEDOT) is heavily doped p-type by the sulfonate anions (acceptors)
of the poly(styrene sulfonate) (PSS) [5.14]. Although our understanding of electronic transport
in conjugated polymers has reached a high level of sophistication [5.15, 5.16], ion transport has
not received the same amount of attention, mainly due to the lack of suitable characterization
techniques. While conductivity or diffusion measurements can be used to study ion transport in
materials that conduct only ions (such as polymer electrolytes [5.17]), these techniques are
difficult to apply in mixed conductors because the simultaneous presence of electronic carriers
greatly complicates data analysis. There is a need, therefore, for new experimental approaches
that provide insight on the fundamentals of ion transport in conjugated polymers.
Electrochemical impedance spectroscopy (EIS) is a common technique for studying
charging and transport phenomena in conjugated polymers [5.18], despite the fact that the
interpretation of the obtained data can be model-dependent. In the most usual configuration, a
thin polymer film is deposited on a metallic substrate (working electrode) and is placed in an
electrochemical cell. A dc bias applied between the electrolyte and the electrode leads to ion
injection from the electrolyte into the polymer and sets the doping level (redox state) of the
latter. The injection of cations in PEDOT:PSS, for example, will decrease the hole density and
dedope the film. Once the desired doping level is reached, a small ac modulation is applied and
the impedance spectrum is recorded. Impedance is essentially the phase lag in the movement
of charge carriers upon the application of the ac voltage. Since both ionic and electronic carriers
move simultaneously, the analysis becomes complicated [5.19]. In the simplest case, an
equivalent circuit consisting of several elements is used to fit the data, considering the path of
an ion moving from the electrolyte to the bulk of the polymer. These elements include a
resistor to describe transport in the electrolyte, a capacitor (usually modeled with a constant
phase element) in parallel with a charge transfer resistor to model the process of ion injection

90
into the film, and a diffusion element (modeled with a Warburg or a constant phase element)
to capture ion diffusion inside the polymer [5.20].
An alternative approach to study ion injection and transport in conjugated polymers is
the so-called “moving front” experiment [5.21-5.23], which relies on the fact that the optical
absorption spectra of these materials change upon doping (electrochromism). In this
experiment, changes in the optical density are spatially and temporally resolved in order to
infer the injection and transport of ions inside a polymer film. A key difference between EIS and
the moving front experiment is that in the former doping undergoes a small ac modulation
around a fixed level, while in the latter there exist two regions in the film with distinctly
different doping levels. In chapter 3 I presented the realization of the moving front experiment
in a planar electrolyte/PEDOT:PSS/Au device, in which injected cations compensate the
sulfonate acceptors and lead to hole depletion (the holes are extracted at the Au electrode). As
a result, a dedoped region forms inside the PEDOT:PSS film that extends a distance ℓ(t) from
the interface with the electrolyte, where ℓ(t) is the drift length of the injected cations at time t.
The one-dimensional geometry of the planar junction allowed a straightforward visualization of
ion drift inside the polymer, and enabled the extraction of the drift mobility of various cations
[5.24]. Ion mobilities measured in PEDOT:PSS were found to be similar to values measured in
water, consistent with transport in water channels inside a highly hydrated film [5.24].
In this chapter I report on electrochemical impedance spectroscopy performed during a
moving front experiment on a planar electrolyte/PEDOT:PSS junction. Impedance spectra
acquired during the propagation of the dedoping front are modeled by an equivalent circuit of a
resistor in parallel with a capacitor. I show that the resistor corresponds to ion transport in the
dedoped region of the film, and can be quantitatively described using ion density and drift
mobility, while the capacitor is associated with doping/dedoping processes at the moving front.

91
5.2. Methods
5.2.1 Experimental configuration
Figure 5.1 shows a schematic of the experimental configuration. A PEDOT:PSS film,
deposited on a parylene-coated glass substrate, was coated with a layer of SU-8. The latter
served as an ion barrier and prohibited ion injection into the PEDOT:PSS film from the top.
Using photolithography, a well was created in the SU8/PEDOT:PSS stack and filled with an
electrolyte, forming a planar electrolyte/PEDOT:PSS junction. The thickness of the PEDOT:PSS
film was 400 nm, and its width was 26 mm. A polydimethylsiloxane rim was placed on top of
the SU-8 well to confine 1.5–2 mL of electrolyte. A large area Pt counter electrode and a
saturated Ag/AgCl (3M KCl) reference electrode were immersed into the electrolyte (0.01 M KCl
in deionized water), while a Au electrode, positioned at a distance L= 32 mm from the
electrolyte interface, provided electrical contact to the PEDOT:PSS film. The PEDOT:PSS/Au
structure was connected with the potensiostat (Bio-Logic-Science Instruments) as the working
electrode. The experiment was carried out as follows: Starting with the film in the p-doped
state, a DC bias of 1 V was applied between the electrolyte and the Au contact, injecting K+
cations and beginning the dedoping of the PEDOT:PSS film. As the dedoping front propagates,
we added an ac modulation with an amplitude of 100 mV and a frequency that was scanned
from 100 kHz to 100 Hz, and obtained the impedance spectra. Each spectrum took
approximately 5 s to acquire and there was a “dead” time of 12 s before a subsequent
acquisition, during which time the dedoping front continued to progress inside the polymer
film. A total of 8 spectra were acquired, well before the dedoping front reached the Au
electrode. Consequently the applied voltage was set to zero and the film is allowed to return to
its initial p-doped state. This defined one cycle; we performed a couple of cycles to a pristine
device in order to allow the film to properly hydrate and the measurements to become
reproducible. The data shown hereafter correspond to appropriate cycled films.
.

92
Figure 5.1: Schematic representation of the device indicating the charge distribution in the film
during the propagation of the dedoping front, at a distance ℓ from the interface with the
electrolyte.
5.3. A physical model of impedance spectra at conducting
polymer/electrolyte junction
Impedance spectra are shown on the Nyquist plot of Fig. 5.2 as solid points. Each
spectrum shows the typical semicircle behavior associated with an equivalent circuit of a
resistor, R, in parallel with a capacitor, C. As time moves forward and the moving front
propagates inside the film, the diameter of the semicircles increases. The right hand side (low
frequency) end of a semicircle corresponds to the value of the resistor. It can be immediately
seen that this value depends on time in a sub-linear fashion, as the distance between the low-
frequency ends of successive semicircles decreases with each time scan. The value of the
capacitor, on the other hand, is not as straightforward to appreciate from the Nyquist plots. In
order to extract the exact time dependence of the resistor and the capacitor, a fit to an
equivalent circuit consisting of R and C in parallel was performed for each spectrum (solid lines
in Fig. 5.2). The extracted values for R and C are shown in Fig. 5.3. Each data point in these plots
is associated with the time corresponding to the end of the scan, as this condition reflects more
accurately the point in time where the resistor is determined. The error bar on the x-axis
reflects the duration of a scan. The error bars on the y-axis, on the other hand, were estimated
+V
Au
Ion barrier
Electrolyte
Substrate
Au
+SO3
-
+SO3
-
+
SO3-
+SO3
-
SO3-
+
SO3-
+
SO3-
+
SO3-
+
Sulfonate anionInjected cation
ℓ
+
SO3-
+
SO3-
SO3- +
SO3-
+
Hole

93
from the high frequency end of the semicircles of Fig. 5.2, which show negative values for the
real part of the impedance. This is due to an experimental artifact and these values were taken
to represent the error in R, while the error in C was subsequently calculated from the fit.
Figure 5.2: Nyquist representation of eight impedance spectra (solid circles) recorded during a moving
front experiment. The solid lines are fits to an equivalent circuit model of a resistor in parallel with a
capacitor.
The resistor in Fig. 5.3a is shown to increase with the square root of time, a trend that
can be understood by means of the physical picture developed from the moving front
experiment: Given that the dedoped region of the film is the least conducting element of the
whole device, and given that its length grows with time, the resistor must be associated with
this region. As a matter of fact, the length of the dedoped region grows as [5.25]:
tVtl ⋅⋅⋅= µ2)( , (5.1)

94
where µ is the K+ drift mobility inside the PEDOT:PSS film and V is the applied dc voltage.
Assuming that the K+ cations are the only mobile charges in the dedoped region, the
corresponding resistance is equal to:
APe
tVtR
⋅⋅⋅⋅
=µ
2)( , (5.2)
whereP is theK+ density inside the PEDOT:PSS film, A is its cross section of the film, and e is the
charge of an electron. The fact that the resistor in Fig. 5.3a follows the predicted R(t)~√t behavior supports the proposed physical interpretation. Namely, the resistive part of the
impedance spectra is consistent with the temporal evolution of the moving front and is
therefore associated with ion drift in the dedoped region of the film. The line in Fig. 5.3a is a fit
to Eq. (5.2), yielding √μ.P=6.6.1019V-1s-1cm-1. This value is within order of magnitude and only
three times different of the one determined from the moving front experiment (√μ.P=2.2.1019V-1s-1cm-1), indicating that experimental values of ion density and mobility can be used to
estimate the resistive part of the impedance. In fact, the agreement is even better if we
account for the fact that the cross section A in Eq. (5.2) is underestimated, as PEDOT:PSS swells
in contact with the electrolyte [5.24].
Contrary to the resistor, the capacitor is shown in Fig 5.3b to remain constant and equal
to ~3 nF. This suggests that the capacitor cannot be attributed to the dedoped region of the
film, but rather to an interfacial capacitance. We attribute this capacitance to the leading front
of the dedoped region, at which holes recede towards the Au electrode while K+ cations move
in to take their place. Given that holes in PEDOT:PSS are considerably more mobile than K+
cations [5.24], a thin region develops right at the moving front interface in which holes are
extracted but cations are not yet been injected. This region contains net negative charge due to
uncompensated sulfonate acceptors. Considering the cations as slow moving compared to the
holes, leads to a configuration that is analogous to charge redistribution near an
electrode/electrolyte interface and hence leads to capacitance of the same magnitude as that
of a double layer. Indeed, normalizing the experimental values for the cross section of the
PEDOT:PSS film yields a capacitance per unit area of ~30μF/cm2, a value consistent with
double layer capacitance.

95
Figure 5.3: Temporal evolution of the resistor (a) and the capacitor (b) determined from the impedance
spectra. The line in (a) is a fit to Eq. (2).
The moving front experiment has shown that drift of ions is important for
understanding electrochemical doping/dedoping in conjugated polymer films [5.25-5.28], a fact
that is often neglected in the interpretation of electrochemical impedance data. The latter
describe ion transport in the film primarily as a result of diffusion, driven by the accumulation
of ions at the electrolyte/polymer interface. According to this picture the applied potential
drops partially at the electrolyte/polymer interface and determines in a self-consistent way the
ion concentration at this interface. Ions then enter the film, driven by the concentration
gradient between interface and bulk. In hydrated films that support high ion mobilities,
however, ions enter the film with ease, leading to negligible potential drop at the
electrolyte/polymer interface [5.25]. As a result, drift plays a significant role in bringing ions in
the film and changing the doping level. In this work impedance spectra were determined solely
on the basis of drift.
Electrochemical impedance is usually measured in thin films deposited on a metallic
electrode. Given an ion mobility of 10-3
cm2 V
-1s
-1 (consistent with small metal cations injected
in a highly hydrated film) and ac modulation of 10 mV, and a film thickness of 100 nm, it can be
shown that for frequencies below ~100 kHz the ions are able to reach the back contact within a
half-cycle. This leads to accumulation of ionic charge at the interface with the back contact and
complicates the field distribution inside the film. It also limits the amount of ionic charge that

96
can be stored in the film and may lead to a capacitance that depends on the thickness of the
polymer film. Planar junctions in which the ions can travel for several mm before reaching the
back contact avoid these complications, and represent therefore a better experimental
geometry for studying ion transport phenomena.
Finally, it should be mentioned that in the analysis presented here I make two
assumptions, namely that there is no barrier for ion injection at the electrolyte/PEDOT:PSS
interface and no barrier for hole extraction at the PEDOT:PSS/Au interface. The former is
justified by the high ion mobilities measured with the moving front measurements, while the
latter by the fact that the film is highly doped near the Au contact. These assumptions might
not hold in the case of non-doped conjugated polymer films which are usually hydrophobic and
depleted of electronic charge. Still, the methodology of combining moving front measurements
and electrochemical impedance spectroscopy in planar junctions represents a powerful
experiment that can help understand the impact of such barriers on ion transport.

97
5.4. Conclusions
In this work I performed electrochemical impedance spectroscopy during a moving
front experiment in a planar junction between an electrolyte and PEDOT:PSS. The impedance
spectra were consistent with an equivalent circuit of a time varying resistor in parallel with a
capacitor. The resistor was found to correspond to ion transport in the dedoped region of the
film, and was in good agreement with values of ion density and drift mobility obtained from the
moving front measurements. The capacitor, on the other hand, was found to be constant with
time, implying that it is associated with charge separation at the moving front. The
interpretation given here helps demystify electrochemical impedance by describing it in the
language of solid-state physics, using parameters such as ion density and drift mobility.

98
5.5 References
[5.1] J. M. Leger, Adv. Mater. 20 (4), 837-841 (2008).
[5.2] J. Leger, M. Berggren and S. A. Carter, Iontronics : Ionic carriers in organic electronic
materials and devices. (CRC Press, Boca Raton, 2011).
[5.3] Q. Pei, G. Yu, C. Zhang, Y. Yang and A. J. Heeger, Science 269 (5227), 1086-1088 (1995).
[5.4] J. C. deMello, N. Tessler, S. C. Graham and R. H. Friend, Physical Review B 57 (20), 12951-
12963 (1998).
[5.5] D. A. Bernards, S. Flores-Torres, H. D. Abruna and G. G. Malliaras, Science 313 (5792),
1416-1419 (2006).
[5.6] R. J. Mortimer, A. L. Dyer and J. R. Reynolds, Displays 27 (1), 2-18 (2006).
[5.7] H. D. Abruna, Y. Kiya and J. C. Henderson, Physics Today 61 (12), 43-47 (2008).
[5.8] D. Khodagholy, J. Rivnay, M. Sessolo, M. Gurfinkel, P. Leleux, L. H. Jimison, E. Stavrinidou,
T. Herve, S. Sanaur, R. M. Owens and G. G. Malliaras, Nat Commun 4 (2013).
[5.9] E. Smela, MRS Bull. 33 (3), 197-204 (2008).
[5.10] J. Rivnay, R. M. Owens and G. G. Malliaras, Chemistry of Materials (2013).
[5.11] J. Isaksson, P. Kjall, D. Nilsson, N. D. Robinson, M. Berggren and A. Richter-Dahlfors, Nat.
Mater. 6 (9), 673-679 (2007).
[5.12] P. Lin and F. Yan, Adv. Mater. 24 (1), 34-51 (2012).
[5.13] D. Khodagholy, T. Doublet, P. Quilichini, M. Gurfinkel, P. Leleux, A. Ghestem, E.
Ismailova, T. Hervé, S. Sanaur, C. Bernard and G. G. Malliaras, Nat Commun 4, 1575 (2013).
[5.14] A. Elschner, S. Kirchmeyer, W. Lövenich, U. Merker and K. Reuter, in PEDOT, Principles
and Applications of an Intrinsically Conductive Polymer (CRC Press, 2010), pp. 113-166.
[5.15] H. T. Nicolai, M. Kuik, G. A. H. Wetzelaer, B. de Boer, C. Campbell, C. Risko, J. L. Bredas
and P. W. M. Blom, Nat. Mater. 11 (10), 882-887 (2012).
[5.16] A. J. Kronemeijer, E. H. Huisman, I. Katsouras, P. A. van Hal, T. C. T. Geuns, P. W. M.
Blom, S. J. van der Molen and D. M. de Leeuw, Physical Review Letters 105 (15) (2010).
[5.17] B. Smitha, S. Sridhar and A. A. Khan, Journal of Membrane Science 259 (1–2), 10-26
(2005).
[5.18] J. O. M. Bockris, A. K. N. Reddy and M. E. Gamboa-Aldeco, Modern electrochemistry, 2nd
ed. (Plenum Press, New York, 1998).
[5.19] M. A. Vorotyntsev, J. P. Badiali and G. Inzelt, Journal of Electroanalytical Chemistry 472
(1), 7-19 (1999).
[5.20] R. Hass, J. Garcia-Canadas and G. Garcia-Belmonte, Journal of Electroanalytical
Chemistry 577 (1), 99-105 (2005).
[5.21] K. Aoki, T. Aramoto and Y. Hoshino, Journal of Electroanalytical Chemistry 340 (1–2),
127-135 (1992).
[5.22] T. Johansson, N.-K. Persson and O. Inganäs, Journal of the Electrochemical Society 151
(4), E119-E124 (2004).
[5.23] X. Wang and E. Smela, The Journal of Physical Chemistry C 113 (1), 369-381 (2008).
[5.24] E. Stavrinidou, P. Leleux, H. Rajaona, D. Khodagholy, J. Rivnay, M. Lindau, S. Sanaur and
G. G. Malliaras, Adv. Mater. 25 (32), 4488-4493 (2013).

99
[5.25] E. Stavrinidou, P. Leleux, H. Rajaona, M. Fiocchi, S. Sanaur and G. G. Malliaras, J. Appl.
Phys. 113 (24) (2013).
[5.26] J. C. Lacroix, K. Fraoua and P. C. Lacaze, Journal of Electroanalytical Chemistry 444 (1),
83-93 (1998).
[5.27] F. Miomandre, M. N. Bussac, E. Vieil and L. Zuppiroli, Chemical Physics 255 (2–3), 291-
300 (2000).
[5.28] X. Wang, B. Shapiro and E. Smela, The Journal of Physical Chemistry C 113 (1), 382-401
(2008).

100
Chapter 6
6. Conclusions – Outlook
The work presented in this thesis contributed to the greater goal of understanding and
engineering ion transport in conducting polymers. Conducting polymers are mixed conductors
and have found application in organic electronics and bioelectronics. Although the electronic
properties of these materials have been studied extensively ion transport has not been
addressed in the same detail. Ion transport has been studied in liquid electrolytes and in
polymeric ionic conductors but the simultaneous presence of electronic carriers in conducting
polymers greatly complicates the system rendering the techniques used in only ionic
conductors unusable. Electrochemical approaches for studying ion transport in conducting
polymers are more in the context of dopant, as reactive redox specie, or dopant compensator
during electrochemical doping and not in the sense of an active carrier. Until now there was no
method that enables determination of ion mobility in conducting polymers, a figure of merit
that will navigate the development of ion transport theories.
The first chapter served as an introduction to this work. An overview of the theory and
background necessary for understanding the scientific achievements of this thesis was given. I
presented the electronic properties of conducting polymers, charge transport theories,
experimental techniques for measuring electronic mobility, the physicochemical description of
ion conduction in liquid electrolytes and an overview of ion transport in polymer electrolytes.
Emphasis was given to the moving front experiment, major part of this thesis, with a review of
the work done by others. Finally I presented devices that are based on the mixed conductivity
of conducting polymers with focus on bioelectronics. The main conclusion that can be extracted
from this introductory chapter is that there are still a lot of things to be learned! There is no
solid theory describing ion transport in conducting polymers and new physical approaches are

101
necessary in experiment and in modeling in order to illuminate the mechanism of these
processes.
In the second chapter I presented a simple model that describes ion injection and
transport from electrolytes into conducting polymer films. The model gives analytical
predictions for the temporal evolution of the drift length of ions and the current – variables
that can be assessed experimentally using an appropriate configuration and can be used to
extract ion drift mobility in the film. I explored the validity of this model using forward time
iteration of drift/diffusion equations, and under a set of realistic materials parameters the
model gave accurate predictions. The influence of applied voltage, ion concentration in the
electrolyte and ion mobility in the film was explored. The purpose of this work was to develop a
set of rules that can guide the design of an experiment that will allow the determination of ion
drift mobility.
Having explored the basic electrostatics of the 1D geometry I took my research a step
further by developing a method for determining ion mobilities in conducting polymers. It
should be noted that is the first method developed that directly enables measurement of ion
mobilities in conducting polymers. In Chapter 3 I presented the experimental set up and the
application of the method in PEDOT:PSS, a widely used, commercially available conducting
polymer with record conductivity. By utilizing the electrochromic property of conducting
polymers I was able to monitor the transit of ions though the film upon injection from an
electrolyte and define their drift length in the conducting polymer at each time. Using the
analytical model presented in the previous chapter I was able to extract ion mobility and
injected ion density. I measured the mobilities of proton, potassium, sodium and choline in
PEDOT:PSS. In all cases the mobilities were found a bit higher than the electrophoretic
mobilities in bulk water suggesting first that PEDOT:PSS can efficiently transport ions and
second that electroosmosis plays a role in ion transport by adding a component in their
electrophoretic speed. Hydration plays a primary role in ion transport as the film’s volume
increases more than 100%. Crosslinking the film, reduced its ability to uptake water and hence
the ion mobility. The technique described in chapter 3 can be easily adapted to other
configurations such as the doping of intrinsic organic semiconductors, or the dedoping of n-
type organic semiconductors, broadening the matrix of materials in which ion transport can be
measured. As interest in organic electronic materials that support both electronic and ionic
transport increases, the method developed here will play an important role in establishing
structure vs. ion transport properties relationships.

102
Understanding the correlation between ion transport and hydration of the film we
engineered materials with enhanced and tunable ion mobility. These materials are based on
PEDOT:TOS and the hydrogel protein gelatin and were developed by collaborators in Monash
University. Gelatin creates hydrophilic pathways that facilitate ion transport and the amount of
gelatin added defines the mobility of the ion. In order to incorporate the gelatin, that is a
sensitive protein, in the polymer matrix without destroying it, a “milder” solvent was used
during VPP. This polymerization route can be applied for the incorporation of other
biomolecules as well. Interestingly the electronic properties of the composites remained fairly
unaffected, ensuring that the PEDOT:TOS-Gelatin composites can efficiently support mixed
conduction. In chapter 4 first and foremost I show that the method to measure ion mobility can
be applied in other systems, confirming its potential application to a variety of materials.
Secondly in PEDOT:TOS, the dopant (tosylate) is mobile, therefore I am studying its transport
through the film. This can be applied in systems where the dopant is the molecule of interest
such as biodoped polymers for delivery of biomolecules. I believe this work will contribute
towards the rational design of materials that simultaneously optimize electronic and ionic
transport.
The fifth chapter is devoted to an approach towards electrochemistry. I combined the
moving front experiment with electrochemical impedance spectroscopy. I performed
electrochemical impedance spectroscopy during a moving front experiment in a planar junction
between an electrolyte and PEDOT:PSS. The impedance spectra were consistent with an
equivalent circuit of a time varying resistor in parallel with a capacitor. The resistor was found
to correspond to ion transport in the dedoped region of the film, and was in good agreement
with values of ion density and drift mobility obtained from the moving front measurements.
The capacitor, on the other hand, was found to be constant with time, implying that it is
associated with charge separation at the moving front. The interpretation given here helps
demystify electrochemical impedance by describing it in the language of solid-state physics,
using parameters such as ion density and drift mobility.
The work presented in this thesis gives a physical approach for studying ion transport in
conducting polymers. The method I developed for measuring ion mobility in conducting
polymers can be easily adapted to other configurations broadening the matrix of materials in
which ion transport can be measured. One limitation of the method is the use of the
electrochromism in the visible (VIS) part of the spectrum. Materials that exhibit
electrochromism in other parts of the spectrum, UV or IR can be studied by changing

103
appropriately the detection system. If no electrochromism is observed then alternatives can be
found in fluorescent dyes or radiotracers. Another limitation is that the model fails to capture
the behavior of very concentrated electrolytes (experimentally greater of 1M), possibly due to
strong ion –ion interaction. More detailed model that can takes into account ion-ion interaction
should be developed.
There is a straightforward relation between water uptake and ion conduction but a
great deal needs to be done in the structural characterization of these materials in length scales
relevant to ion transport. Characterization should be realized in dry and hydrated state of the
material and correlation between ion mobility and different structures as well as different
hydration states of these structures should be established.
Ions are charged species with a finite mass and volume therefore injection and
transport can be limited by the free volume in the polymer matrix. It is generally accepted that
there is enough free space in the polymer matrix for ions to move, due to their soft nature. One
parameter that is unexploited is if an energetic barrier of injection exist and in case how this
correlates with the state of the material, (polymer matrix), its hydration level and the ion
source, (from infinite diluted to highly concentrated to solvent free electrolytes).
By understanding the fundamental processes of ion transport in conducting polymers
we will eventually be able to rationally design materials with optimized mixed conductivity. This
will lead to better design of existing devices and will open routes to new types of devices.
Last but not least there is a major need to bridge electrochemistry with solid state
physics. Due to the different formalism and language a difficulty in communication between the
two fields is usually observed. The development of a universal theory for ion transport and
mixed conductivity in conducting polymers, that is accepted by both fields will be a result of
common effort.

104
Appendix
A1. Determination of hole mobility from transistor measurements
Bernards et al. [3.10] showed that the mobility of a conducting polymer film can be extracted
from measurements in organic electrochemical transistors (OECTs). We fabricated PEDOT:PSS
OECTs using the exact same solution and film casting process as for the measurement of ion
transport. The architecture of the transistors was the same as reposted previously [A.1], with a
channel length of 6 µm. The measurements were carried out by supplying a drain voltage of -
0.4 V, and measuring the response of the drain current to gate current pulses of 1, 2 and 4 nA
(Fig. A.1a). The first derivative of the drain current was then plotted as a function of gate
current (Fig. A.1b). A linear relationship was observed, with a slope corresponding to a hole
mobility in PEDOT:PSS of 1.1·10-2
cm2 V
-1 s
-1.
Figure A.1: Temporal response of drain current to gate current pulses (a) and resulting gradient vs. gate
current plot for the determination of hole mobility (b).
[A.1] Khodagholy, D. et al. High speed and high density organic electrochemical transistor
arrays. Applied Physics Letters 99 (2011).

105
A2. DSC traces for PEDOT:TOS-Gelatin composites
Figure A2: Typical DSC data for Gelatin, PEDOT:TOS-33%Gelatin, PEDOT:TOS-50%Gelatin, PEDOT:TOS-
67%Gelatin composites.

106
A3. EQCM characterization of PEDOT:PSS films
In PEDOT:PSS the dedoping correlates with injection of cations from an electrolyte and
therefore with an increase in the mass of the film. With EQCM we monitored the mass change
during the dedoping of the film and its return to the initial state, (only qualitatively as explained
in detail in section 4.6). As we see from Fig. A.3 when the PEDOT:PSS film is dedoped ( from
0.4V –to -0.8V) an increase of the mass is observed in accordance with our understanding of the
dedoping process: Holes are extracted and positive ions (in this case Na+) are injected from the
electrolyte into the film in order to compensate the sulfonate groups on the PSS chain and
preserve electroneutrality. When the film is returning to its initial doping state the positive ions
are expelled (loss in the total mass of the film) and holes are re-injected.
Figure A.3: Frequency change (opposite to mass change) as a function of the applied voltage for
PEDOT:PSS in 0.01M KCl electrolyte. Doping and dedoping direction are marked. The scanning rate is
20mV/s.

107
Publication List
This thesis is based on the following publications:
• “A Simple Model for Ion Injection and Transport in Conducting Polymers”, E.
Stavrinidou, P. Leleux, H. Rajaona, M. Fiocchi, S. Sanaur, and G. G. Malliaras, J. Appl.
Phys. 113, 244501 (2013); doi: 10.1063/1.4812236 (Chapter 2)
• “Direct measurement of ion mobility in a conducting polymer”, E. Stavrinidou, P.
Leleux, H. Rajaona, D. Khodagholy, J. Rivnay, M. Lindau, S. Sanaur, and G. G. Malliaras,
Adv. Mater. 2013, DOI: 10.1002/adma.201301240 (Chapter 3)
• “Engineering hydrophilic and biocompatible conducting composites with enhanced and
tunable ion mobility”, E. Stavrinidou, O. Winther-Jensen, B. S. Shekibi, V. Armel, J.
Rivnay, E. Ismailova, S. Sanaur, G. G. Malliaras and B. Winther-Jensen, To be submitted
(Chapter 4)
• “A Physical Interpretation of Impedance at Conducting Polymer/Electrolyte Junctions”,
E. Stavrinidou, M. Sessolo, B. Winther-Jensen, S. Sanaur, and G. G. Malliaras, To be
submitted (Chapter 5)
• “High speed and high density organic electrochemical transistor arrays”, D.
Khodagholy, M. Gurfinkel, E. Stavrinidou, P. Leleux, T. Herve, S. Sanaur, and G. G.
Malliaras, Appl. Phys. Lett. 99, 163304 (OECT part of Chapter 1)
• “High transconductance organic electrochemical transistors”, D. Khodagholy, J. Rivnay,
M. Sessolo, M. Gurfinkel, P. Leleux, L. H. Jimison, E. Stavrinidou, T. Herve, S. Sanaur, R.
M. Owens, and G. G. Malliaras, 2013 Nat. Comm., DOI: 10.1038/ncomms3133 (OECT
part of Chapter 1)
Publications not included in the thesis:
• “PEDOT:Gelatin composites mediate brain endothelial cell adhesion”, M. Bongo, O.
Winther-Jensen, S. Himmelberger, X. Strakosas, M. Ramuz, A. Hama, E.
Stavrinidou, G. G. Malliaras, A. Salleo, B. Winther-Jensen and R. M. Owens, J.
Mater. Chem.,J. Mater. Chem. B, 2013, 1, 3860

École Nationale Supérieure des Mines
de Saint-Étienne
NNT : 2013 EMSE 0711
Eleni STAVRINIDOU
UNDERSTANDING AND ENGINEERING ION TRANSPORT IN
CONDUCTING POLYMERS
Speciality : Microelectronics
Keywords : Organic bioelectronics, Conducting Polymers, Ion Transport
Abstract :
Many organic electronic and bioelectronics devices rely on mixed (electronic and ionic)
transport within a single organic layer. Although electronic transport in these materials is
relatively well understood, a fundamental understanding of ion transport is missing. I
developed a simple analytical model that describes ion transport in a planar junction between
an electrolyte and a conducting polymer film. The model leads to predictions of the temporal
evolution of drift length of ions and current. These predictions are validated by numerical
simulations and by using realistic parameters, I show that the analytical model can be used to
obtain the ion mobility in the film. Furthermore, I developed an experimental method which
allows the application of the analytical model and leads to a straightforward estimation of the
ion drift mobilities in conducting polymers. PEDOT:PSS was found to support efficient
transport of common ions, consistent with extensive swelling of the film in water.
Crosslinking the film decreased its swelling and the ion mobility. Understanding the high
correlation of hydration and ionic conductivity enables us to engineer materials with high and
defined ion mobilities. As an example tuning of ion mobility by adjusting the relative ratio of
the hydroscopic phase to PEDOT:TOS is presented. Finally I performed electrochemical
impedance spectroscopy during a moving front experiment, in order to give a physical
interpretation of the impedance spectra at a conducting polymer/electrolyte junction.

École Nationale Supérieure des Mines
de Saint-Étienne
NNT : 2013 EMSE 0711
Eleni STAVRINIDOU
LA COMPRÉHENSION ET L’ AMÉLIORATION DU TRANSPORT
IONIQUE DANS LES POLYMÉRES CONDUCTEURS
Spécialité: Microélectronique
Mots clefs : bioélectronique organique, polymères conducteurs, transport ionique
Résumé :
De nombreux dispositifs pour l’électronique organique et la bioélectronique reposent sur le
transport mixte (électronique et ionique) au sein d'une seule couche organique. Le transport
électronique dans ces matériaux est relativement bien compris, mais une compréhension
fondamentale du transport des ions est manquante. J'ai développé un modèle analytique
simple qui décrit le transport d'ions dans une jonction planaire entre un électrolyte et un film
de polymère conducteur. Le modèle permet des prédictions de l'évolution temporelle du
courant et de la «drift length» des ions. Ces prédictions sont validées par des simulations
numériques et en utilisant des paramètres réalistes, je montre que le modèle analytique peut
être utilisé pour obtenir la mobilité des ions dans le film. De plus, j'ai développé une méthode
expérimentale qui permet l'application du modèle analytique et conduit à une estimation
simple de la mobilité de différents ions dans les polymères conducteurs. Le PEDOT : PSS
offre un transport efficace pour les ions les plus communs, qui peut être mis en relation avec
le gonflement important du film dans l'eau. De plus, je montre que la réticulation du film
diminue son gonflement ainsi que la mobilité des ions. Comprendre la forte corrélation entre
l'hydratation et la conductivité ionique nous permet alors de développer des matériaux à
mobilité ionique définie et importante. A titre d'exemple, le réglage de la mobilité ionique du
PEDOT:TOS est présenté en ajustant le rapport relatif de la phase hygroscopique. Pour finir,
j'ai effectué des mesures de spectroscopie d'impédance électrochimique au cours d'une
expérience de «moving front», afin de proposer une interprétation physique des spectres
d'impédance mesurés à une jonction polymère conducteur / électrolyte.