understanding asean consumer markets through country
TRANSCRIPT
Understanding ASEAN Consumer Markets through Country-Specific
Questionnaires—Based on Results of “ASEAN Family Income and
Expenditure Survey”—
Takayuki KURABAYASHI, Yu NIIMI and Satoru YATSUNAMI
No. 192 December 1, 2013

1Copyright 2013 by Nomura Research Institute, Ltd.
Understanding ASEAN Consumer Markets through Country-Specific
Questionnaires—Based on Results of “ASEAN Family Income and
Expenditure Survey”—
Takayuki KURABAYASHI, Yu NIIMI and Satoru YATSUNAMI
I DifferencesinConsumerAttitudesandBehaviorbetweenASEANCountries
II CorrelationsExistingbetweentheStageofEconomicDevelopmentand Consumption
III SuggestionsforJapaneseCompaniesPlanningtoEntertheASEANMarket
W ith the goal of identifying consumer attitudes and behavior in Malaysia, Thailand, Indone-
sia, Vietnam and Myanmar, which are the five ASEAN (Association of Southeast Asian
Nations) countries that are currently attracting increased attention as consumer markets, Nomura
Research Institute (NRI) undertook an “ASEAN Family Income and Expenditure Survey.” Based
on the results of this survey, it was possible to quantitatively evaluate situations that differ from
country to country, which include consumer behavior such as product ownership, service utiliza-
tion, sales channels that consumers use and the sources of information that influence consumers’
purchase decisions, as well as consumer attitudes.
While it is important for any business development to carefully identify the actual situation of
each country and adopt a strategy that is finely tuned to each market, it would be highly inefficient
to respond separately to the distinctiveness of each country. As such, attention was paid to the
stage of economic development of each country, and an analysis was made of the relationship
between the stage of economic development and consumer attitudes/behavior. The analysis re-
vealed certain correlations showing common trends that are found in all countries that were
surveyed.
If consideration is given to these correlations, it should be possible to eliminate much of the
inefficiencies related to business development in the ASEAN countries. Specifically, for Japanese
companies to efficiently develop their business in the ASEAN countries, they should consider their
strategies in two directions, namely, “focusing on the degree of consumer maturity” and “making
use of experience gained in one ASEAN country to move on into another ASEAN country.”
NRI Papers No. 192December 1, 2013

2
Understanding ASEAN Consumer Markets through Country-Specific Questionnaires
Copyright 2013 by Nomura Research Institute, Ltd.
NRI Papers No. 192 December 1, 2013
1 Overview of “ASEAN Family Income and Expenditure Survey”
These days, the ASEAN (Association of Southeast Asian Nations) countries are attracting increased atten-tion not only as manufacturing centers but also as promising consumer markets. While the ASEAN region as a whole presents a large-scale, attractive market, the individual countries making up the region differ consid-erably in terms of political systems as well as in cultural aspects such as race, religion and language. This “mo-saic” of markets makes market entry difficult.
Nomura Research Institute (NRI) looked at the ten ASEAN countries making up this “mosaic” market and,
I Differences in Consumer Attitudes and Behavior between ASEAN Countries
from these countries, selected Malaysia, Thailand, Indo-nesia, Vietnam and Myanmar as the targets of the “ASEAN Family Income and Expenditure Survey” in order to identify the actual status of consumer attitudes and behavior in these countries (Table 1).
This questionnaire survey was conducted in the most populous cities (Tier 1 cities) in each of the five coun-tries. In addition, the survey was also conducted in some cities and areas other than Tier 1 cities in Thailand, In-donesia and Vietnam. However, because the purpose of this paper is to compare Tier 1 cities of each country, the results of the analyses presented here are based on a sample size of 2,398 responses collected in Tier 1 cities of each country, although 4,153 responses were collect-ed in total. Furthermore, from the perspective of “attractiveness to Japanese companies,” the survey tar-geted the upper 50 percent segment in terms of household income. It should be noted that the less affluent 50 per-cent was not included in the scope of the survey. Moreover, the survey targeted individuals aged between
Note: Sample weighting: Samples were weighted to reflect the actual market structure.
Table 1. Overview of “ASEAN Family Income and Expenditure Survey”
Note: In this paper, only respondents in Tier 1 cities (dark shaded cities) in each country were extracted, and analyses were made based on a population of 2,398 respondents.
Item
Age
Respondent requirements
Survey period
Survey method
Allocation and sample weighting
Content of questions
Description
Males and females aged between 17 and 59
• Person who has resided in a target city for at least one year and who actually lives there at least five days a week
• Person who has not participated in market research activities during the past six months
• Person who does not work in related industries (advertising agencies, market research, consulting, etc.)
• The upper 50 percent segment in terms of household income was targeted in each city
August – December 2012
• Door-to-door interview survey by researchers• After area sampling, visits were made to households located at equal
intervals
• Sample size was equally allocated by gender and age (five groups)• For analyses, samples were weighted according to the population
distribution of each country
• About 40 questions were asked, which were related to consumer attitudes and behavior
Overview of survey
Number of responses collected in each country
Malaysia 507
Thailand 1,100
Indonesia 1,234
Vietnam 812
Myanmar 500
Total 4,153
Number of responses collected in each city (area)
Kuala Lumpur 507
Bangkok 400
Area surrounding Bangkok 400 (excluding Bangkok)
Khon Kaen 300
Jakarta 485
Area surrounding Jakarta 425 (excluding Jakarta)
Surabaya 324
Ho Chi Minh City 506
Hanoi 306
Yangon 500
Total 4,153
Number of responses collected in each country/city (area)

3
Understanding ASEAN Consumer Markets through Country-Specific Questionnaires
Copyright 2013 by Nomura Research Institute, Ltd.
NRI Papers No. 192 December 1, 2013
percent of Malaysian households, which is again the highest rate among the five countries and is much higher than the figure for a “CRT TV,” which is owned by 26.8 percent of Malaysian households. It should be noted that among the five countries, only in Malaysia does the rate of ownership of LCD TVs exceed that of CRT TVs.
Malaysia’s advancement is seen not only in product ownership but also in the sales channels that consumers use. For example, for food purchases, 71.8 percent of Malaysian consumers shop at “hypermarkets” as typi-fied by TESCO and Big C, which is the highest rate among the five countries. This percentage is much high-er than the figure for “privately owned small retailers” (53.9 percent) such as “mom and pop stores” that are often seen in ASEAN countries.
It would be reasonable to assume that Malaysia’s ad-vancement is a result of the efforts of its government and companies. For many years, Malaysia has been putting considerable effort into developing its automobile in-dustry as part of national policy. In fact, the two government-funded automobile manufacturers, Proton and Perodua, have long been supported by a policy that protects domestic car production. At the beginning of the 1980s, Malaysia’s Look East policy was launched with the aim of learning from the experiences of Japan and other East Asian countries. Based on this policy, various efforts were made including those for the devel-opment of large-scale shopping centers.
The results of the questionnaire survey also show that Malaysia’s advancement, described above, also extends to the attitudes of its consumers. Figure 1 illustrates the answers to a question about “attitudes in trying new products/services.” In response to this question, the percentage of respondents who selected “I would try new products/services or go to new shops faster than anyone else” was the highest in Malaysia, at 26.0 per-cent. It appears that behind the advanced level of consumer behavior lies an advanced level of consumer attitudes.
17 and 59, and did not seek responses from people aged 60 and over. The survey was not Internet-based, which would require the respondents to have access to a net-work environment and be IT literate. Rather, a door-to-door interview survey was conducted by re-searchers in order to ensure survey accuracy.
The questionnaire was designed so as to determine “consumer behavior” based on the 4Ps, namely:
• Product: Product ownership and service use• Price: Price sensitivity• Place: Purchase channels• Promotion: Sources of information used when mak-
ing a purchase
At the same time, because the survey also aimed at iden-tifying “consumer attitudes” such as consumer mindset and values as related to consumption, in addition to ba-sic attribute information that affects consumer behavior, such as gender, age (which was divided into five groups), occupation and income, the questionnaire consisted of about 40 questions.
The next section describes the characteristics of indi-vidual countries as determined from the results of this questionnaire survey.
2 Actual status of consumer attitudes and behavior in each country
(1)Malaysia:Mostadvancedconsumerbehavioramongfivecountriesintermsofproductownershipandsaleschannelsthatconsumersuse
One feature of Malaysia (Kuala Lumpur) is the “ad-vanced product ownership stage.” For example, among the five countries for which an analysis was made, the percentage of households that own an “automobile” is highest in Malaysia, at 93.4 percent. The same is true for an “LCD TV” with this type of TV being found in 68.7
0 20 40 60 80 100 (%)
Source: “ASEAN Family Income and Expenditure Survey” conducted by Nomura Research Institute in 2012.
Figure 1. Attitudes in trying new products/services
I would try new products/services or go to new shops faster than anyone else
I would wait and see for a while before trying new products/services or going to new shops
I would try new products/services or go to new shops only after products/services became popular
I’m not interested in new products/services or new shops
Malaysia (Kuala Lumpur)N = 507
Thailand (Bangkok)N = 400
Indonesia (Jakarta)N = 485
Vietnam (Ho Chi Minh City)N = 506
Myanmar (Yangon)N = 500
26.0 51.0 17.4 5.6
9.0 44.7 41.7 4.6
23.5 42.7 22.4 11.4
11.1 42.7 41.4 4.7
12.6 41.5 28.5 17.4

4
Understanding ASEAN Consumer Markets through Country-Specific Questionnaires
Copyright 2013 by Nomura Research Institute, Ltd.
NRI Papers No. 192 December 1, 2013
(2)Thailand:Uniqueeatinghabitsandpurchasedecisionsmadeprimarilyatshops
One of the characteristics of consumer behavior in Thai-land stems from the uniqueness of the country’s eating habits. For example, 53.6 percent of Thai consumers use a “food delivery service.” Second to Thailand in this as-pect is Malaysia, where the percentage of respondents using this service is only 19.6 percent, that is, less than half the number of such respondents in Thailand. In fact, restaurants in Thailand provide delivery service as a matter of course, such that the Japanese company, Ootoya, already operating in the Thai market, offers de-livery service.
The main reasons behind this situation are related to the level of prices charged by restaurants and the female employment rate. Normally, the cost for eating out is higher than that of cooking at home. However, in Thai-land, because the cost for eating out is relatively low, doing so incurs relatively small financial burden. In ad-dition, the survey results revealed that the employment rate (both part-time and full-time) of married women in Thailand is high at about 70 percent, with very few of them cooking at home. Together, these factors have led to the increased use of food delivery services in Thai-land.
Another distinctive feature of the Thai market is that most consumers become aware of the products at shops as a source of information in the process of consump-tion. Figure 2 shows responses to questions about the “sources of information that made you aware of the product” and the “sources of information that made you decide on the purchase of the product” when buying foodstuffs. In Thailand, in response to the question about the “sources of information that made you aware of the product,” 84.2 percent of the respondents selected “at the shop, showroom,” while 72.0 percent gave this answer for the “sources of information that made you
decide on the purchase of the product.” Both figures are the highest among the five countries. Furthermore, both figures exceeded the percentage of respondents who se-lected “TV, radio,” which are representative of mass media. These findings suggest that when buying a prod-uct, Thai people tend to go to the shop or showroom, and choose to make a purchase only after seeing the product with their own eyes.
(3)Indonesia:“Lowprice”isanimportantfactorwhenpurchasingaproduct
A characteristic of product purchasing in Indonesia is that price is more important than in any of the other four countries. The upper part of Figure 3 shows the answers to the question about consumer attitudes toward price. The percentage of respondents who selected “I think so” or “Not sure but I think so” to the question of whether you “buy things cheap and in an economical way” was compared by country. By far, Indonesia recorded the highest with 81.2 percent of respondents answering in this way. In addition, in response to the question of whether you “consider whether price is commensurate with quality,” 91.7 percent of respondents in Indonesia said that they did so, which again is the highest among the five countries (lower part of Figure 3).
In fact, in Indonesia, even for a 1,000 rupiah differ-ence in price, it is not uncommon for consumers to compare prices in several stores before making a pur-chase. For example, in the Indonesian LCD TV market, Toshiba introduced its Power TV brand that is price competitive in the ASEAN region and is exclusively de-signed for the region. As a result, the company was able to increase its market share from 5.5 percent in 2009 to 12.9 percent in 2011 (based on a survey by Euromonitor International). Given that Indonesian consumers are very sensitive to price, Toshiba’s success in increasing its market share is considered to stem from its strategy
50 100(%) 00 50 100(%) 0 50 100(%) 0 50 100(%) 0 50 100(%)
52.3
33.5
48.0
37.2
16.0
9.7
36.4
35.8
68.2
33.2
38.0
9.6
49.3
14.084.2
72.0
74.6
52.4
43.1
24.9
23.0
10.5
37.5
28.6
69.9
49.1
54.5
28.9
10.8
5.8
45.0
38.5
72.0
7.2
40.0
2.5
14.8
0.0
38.8
48.1
Source: “ASEAN Family Income and Expenditure Survey” conducted by Nomura Research Institute in 2012.
Figure 2. Sources of information that makes consumers aware of the product and that makes them decide on the purchase of the product when buying foodstuffs
At the shop, showroom
TV, radio
Newspapers, magazines
Transit advertising, outdoor advertising
Sources of information that made you aware of the product
Sources of information that made you decide on the purchase of the product
Malaysia (Kuala Lumpur)
N = 507
Thailand (Bangkok)N = 400
Indonesia (Jakarta)N = 485
Myanmar (Yangon)N = 500
Vietnam (Ho Chi Minh City)
N = 506

5
Understanding ASEAN Consumer Markets through Country-Specific Questionnaires
Copyright 2013 by Nomura Research Institute, Ltd.
NRI Papers No. 192 December 1, 2013
washing machine will most likely be operated by a maid, such that purchasers do not look for a wide range of functions at the time of purchase.
(4)Vietnam:Highhealthconsciousnessanddeep-rooted,traditionaldistributionchannels
One notable characteristic of the Vietnamese market is the higher health consciousness of its consumers. Figure 4 presents health-related responses that are compiled by country to the question of “What purchases do you think you will make in the future?” Among Vietnamese con-sumers, 60.0 percent responded with “medicine and drugs,” 55.1 percent stated “doctors and medical ser-vices” and 42.8 percent said “sports and health related costs,” all of which are far in excess of the percentages for the other four countries. It is said that Vietnamese
to limit the functions to the minimum necessary en-abling a reduction in price.
The rate of penetration of large household electrical appliances also points to Indonesia’s unique culture. For example, only 68.3 percent of households own a wash-ing machine. Of the five countries, only in Myanmar is this figure lower. It is thought that this is a result of In-donesia’s “maid culture.” The fact that the functions of washing machines can be replaced by manual work done by maids could lead to a relatively low penetration rate of washing machines. In fact, the washing machines that one sees lined up in Indonesian electrical stores in-clude very few of the fully automatic variety that are common in Japan, but rather are more likely to be sim-ple twin-tub washers without any drying function. Again, the reason for this is considered to be that a
0 20 40 60 80 100 (%)
67.160.0
81.257.4
38.8
60.982.9
91.754.9
39.3
Note: The above figures represent the percentages of respondents who selected “I think so” or “Not sure but I think so.”Source: “ASEAN Family Income and Expenditure Survey” conducted by Nomura Research Institute in 2012.
Figure 3. Attitudes toward price when purchasing a product
Malaysia (Kuala Lumpur) N = 507
Thailand (Bangkok) N = 400
Vietnam (Ho Chi Minh City) N = 506
Myanmar (Yangon) N = 500
Indonesia (Jakarta) N = 485
Buy things cheap and in an economical way
Consider whether price is commensurate with quality
0 20 40 60 80(%)
16.7
42.3
19.260.0
18.9
16.6
26.4
31.7
55.1
7.8
10.526.8
9.9
42.8
8.4
Source: “ASEAN Family Income and Expenditure Survey” conducted by Nomura Research Institute in 2012.
Figure 4. What purchases do you think you will make in the future (health-related areas)?
Malaysia (Kuala Lumpur) N = 507
Thailand (Bangkok) N = 400
Vietnam (Ho Chi Minh City) N = 506
Myanmar (Yangon) N = 500
Indonesia (Jakarta) N = 485
Medicine, drugs
Doctors, medical services
Sports and health-related costs

6
Understanding ASEAN Consumer Markets through Country-Specific Questionnaires
Copyright 2013 by Nomura Research Institute, Ltd.
NRI Papers No. 192 December 1, 2013
people are basically at their happiest when they are moving their bodies. The parks feature exercise equip-ment and, every early morning, they are filled with people exercising. Health foods and supplements are also popular—a major Japanese health food retailer, Ya-zuya, started doing business in the country in April 2012.
Another characteristic of the Vietnamese market is the firmly established, traditional distribution channels of privately owned small retailers. In these private stores, the goods on sale are often not marked with a price, rather the price is determined by negotiation be-tween storekeeper and consumer. Stores of the same type tend to cluster together, enabling people to ex-change information easily. Active information exchange among consumers at storefronts also constitutes a char-acteristic of the Vietnamese market. When buying food, 81.5 percent of respondents shop at “privately owned small retailers.” Given that Vietnam has experienced fi-nancial collapse in the past, there is a distrust of banks and a tendency towards relying on “physical assets.” Such assets are typified by “land” and “buildings,” such that for an owner, the operation of a personal store also means asset management.
From the perspective of policy, the Vietnamese gov-ernment has placed an emphasis on social security (in particular, employment). To this end, the government has strictly regulated the entry of foreign capital chains into the retail market. As such, the attitudes of Vietnam-ese people towards the management of their assets, coupled with regulations imposed by the government, are considered to enable the traditional distribution channels to continue to exist.
(5)Myanmar:Nothighlydemandingconsumers,butarapidtake-upofadvancedproducts/servicessuchassmartphones
Myanmar is known as the “last untapped ASEAN mar-ket.” While its consumers are not highly demanding, the markets for advanced products and services such as smartphones have been growing rapidly to the point where the same products as those offered in developed countries can be found despite the country’s relatively undeveloped economy.
Figure 5 compares the percentage for Myanmar and that for the average of the five countries with respect to consumer attitudes and behavior. The results clearly show that for every item from “Buy things cheap and in an economical way,” through “I follow the trends/I keep up with the styles,” to “I often select and buy products that have a good reputation among the people around me,” Myanmar scores lower than the average of the five countries.
One way of interpreting these results is that stores in Myanmar do not stock a wide variety of goods, such that, to begin with, consumers have only a limited selection.
If that is the case, is the motivation of Myanmar con-sumers to spend low? Not quite. For example, “smartphones” have already achieved a market penetra-tion of 35.2 percent, which is the almost same level as that for basic mobile phones (34.1 percent). As such, many consumers in Myanmar, despite never having owned any kind of communications equipment in the past, are buying smartphones as their first such pur-chase. To a question about the use of paid services, 47.3 percent selected “Cinema” and 15.8 percent answered “Foreign language lessons.” These figures compare very
0 20 40 60 80 100 (%)
38.8
26.8
39.3
36.1
40.4
33.3
49.2
16.1
11.6
4.0
19.4
60.9
45.9
65.9
47.1
64.1
67.1
67.8
54.8
35.2
24.8
49.0
Note: “Average of five ASEAN cities” refers to the average of the following five cities: Kuala Lumpur (Malaysia), Bangkok (Thailand), Jakarta (Indonesia), Ho Chi Minh City (Vietnam) and Yangon (Myanmar).Source: “ASEAN Family Income and Expenditure Survey” conducted by Nomura Research Institute in 2012.
Figure 5. Comparison of consumer attitudes and behavior between Myanmar and the average of five ASEAN cities
Buy things cheap and in an economical way
Consider whether price is commensurate with quality
I follow the trends/I keep up with the styles
Buy branded products over unbranded products
I can accept higher prices if the product is from well-known brands or manufacturers
Research and gather information on various products before purchase
I often select and buy products that have a good reputation among the people around me
Consider a product's reputation among people using it
Pay to get good information
Buy goods that make others envy you
Prioritize getting products at the cheapest price, sparing no time or effort (for example, traveling farther for cheaper products)
Myanmar (Yangon)N = 500
Average of five ASEAN citiesN = 2,398

7
Understanding ASEAN Consumer Markets through Country-Specific Questionnaires
Copyright 2013 by Nomura Research Institute, Ltd.
NRI Papers No. 192 December 1, 2013
questionnaire survey and universally applying such rules and elements to the entire ASEAN market could be of some help in establishing strategy. As the basis for the analysis, the hypothesis that “some correlations exist be-tween the stage of economic development, as represented by per capita GDP (gross domestic product), and con-sumer attitudes and behavior” was established, and studies were made based on this hypothesis.
If the hypothesis is correct, by looking at the stages of economic development that advanced countries such as Japan have gone through, it may be possible to predict how the ASEAN consumer market will develop, as well as gaining valuable insights into possible ways that Jap-anese companies could enter the market.
2 Items that have a positive correlation with the stage of economic development
Because, as mentioned in Chapter I, the ASEAN region presents a “mosaic” market, the analysis of the relation-ship between the results of the questionnaire survey on consumer attitudes and behavior and the stage of economic development of the surveyed cities revealed no correlation between the survey results and the economic development stage for many items. Nevertheless, for some items, a positive correlation was found, and some correlations that had not initially been expected were observed.
The first example of an item that shows a positive cor-relation with the stage of economic development is the use of “sports and fitness clubs” as leisure activities. The living standards and income levels of people increase in step with economic development. As they increase, the use of such facilities also increases linearly (Figure 6). Another such example is the ownership of “airline mile-age cards,” which again increases linearly in step with the stage of economic development.
favorably with those for the other four countries. Al-though the market is not crowded with competing products, leading-edge products and services have al-ready made their appearance, and have penetrated the market to some degree, which can be said to be a char-acteristic of the Myanmar market.
As explained so far in Section 2, the spread of prod-ucts, price sensitivity, the distribution channels used by consumers and the main sources of information, not to mention consumer attitudes that constitute the back-ground to these factors, are all different depending on the country. Such marked differences clearly illustrate the “mosaic” market presented by ASEAN countries.
For Japanese companies planning to enter ASEAN markets, it is necessary to accept that each of the mem-ber countries has its distinctiveness. Based on such distinctiveness, a carefully tuned marketing strategy must be established for each country.
II Correlations Existing betweenthe Stage of Economic Development and Consumption
1 Hypothesis regarding correlations
Within the ASEAN market, consumer attitudes and be-havior vary considerably by country. Therefore, creating a strategy from scratch that is tailored to each country would likely incur a major burden in terms of both time and money.
As such, it was hoped that extracting rules and ele-ments that are common to the consumer market of each of the countries through the analysis of the results of this
(%)
0
5
10
15
20
Sources: Compiled based on “ASEAN Family Income and Expenditure Survey” conducted by Nomura Research Institute in 2012 and “World Economic Outlook Database 2012,” IMF.
Figure 6. Correlation between ranking of countries by per capita GDP and “use of sports and fitness clubs” as leisure activities
Malaysia(Kuala Lumpur)
Thailand(Bangkok)
Indonesia(Jakarta)
Vietnam(Ho Chi Minh City)
Myanmar(Yangon)
Use of sports and fitness clubs
Scale of per capita GDP (ordinal scale)
8
Understanding ASEAN Consumer Markets through Country-Specific Questionnaires
Copyright 2013 by Nomura Research Institute, Ltd.
NRI Papers No. 192 December 1, 2013
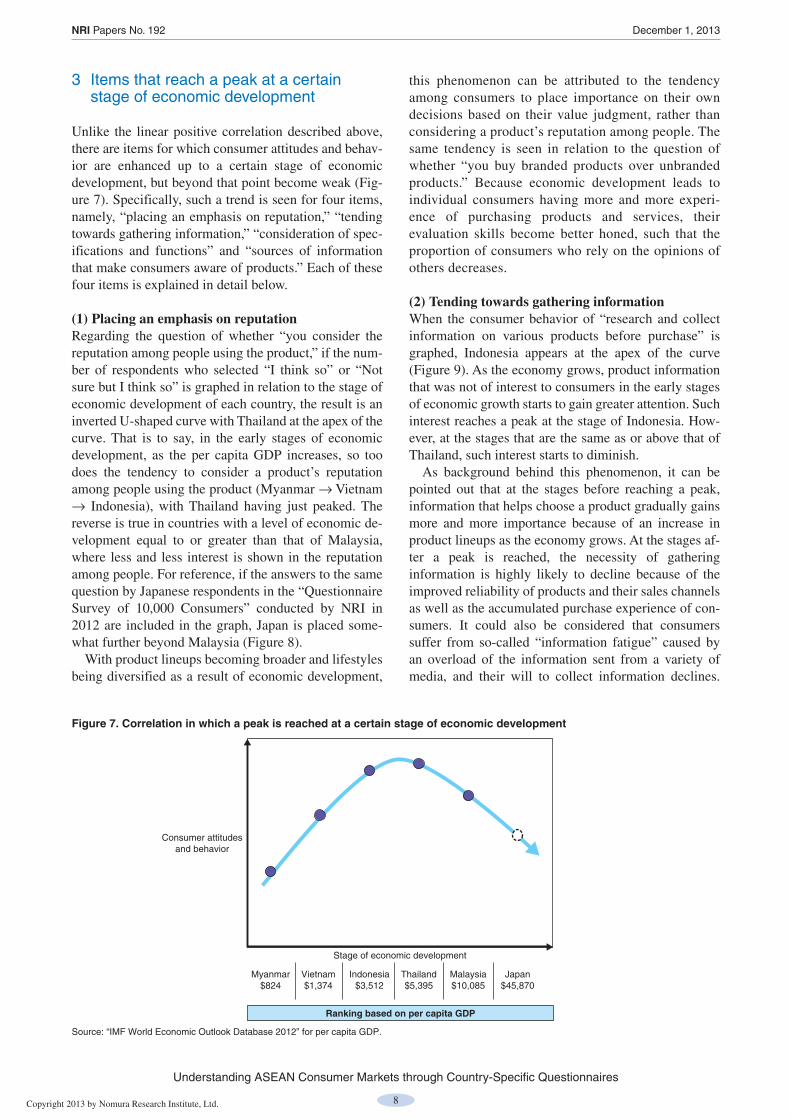
3 Items that reach a peak at a certain stage of economic development
Unlike the linear positive correlation described above, there are items for which consumer attitudes and behav-ior are enhanced up to a certain stage of economic development, but beyond that point become weak (Fig-ure 7). Specifically, such a trend is seen for four items, namely, “placing an emphasis on reputation,” “tending towards gathering information,” “consideration of spec-ifications and functions” and “sources of information that make consumers aware of products.” Each of these four items is explained in detail below.
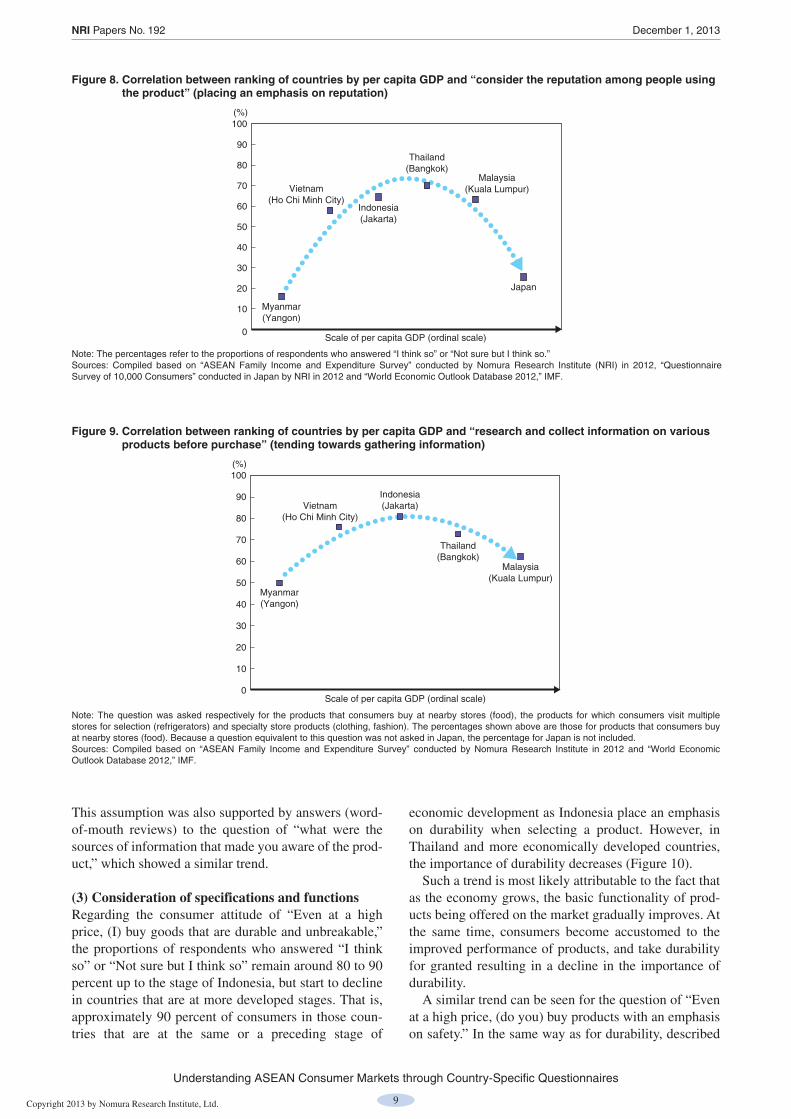
(1)PlacinganemphasisonreputationRegarding the question of whether “you consider the reputation among people using the product,” if the num-ber of respondents who selected “I think so” or “Not sure but I think so” is graphed in relation to the stage of economic development of each country, the result is an inverted U-shaped curve with Thailand at the apex of the curve. That is to say, in the early stages of economic development, as the per capita GDP increases, so too does the tendency to consider a product’s reputation among people using the product (Myanmar → Vietnam → Indonesia), with Thailand having just peaked. The reverse is true in countries with a level of economic de-velopment equal to or greater than that of Malaysia, where less and less interest is shown in the reputation among people. For reference, if the answers to the same question by Japanese respondents in the “Questionnaire Survey of 10,000 Consumers” conducted by NRI in 2012 are included in the graph, Japan is placed some-what further beyond Malaysia (Figure 8).
With product lineups becoming broader and lifestyles being diversified as a result of economic development,
this phenomenon can be attributed to the tendency among consumers to place importance on their own decisions based on their value judgment, rather than considering a product’s reputation among people. The same tendency is seen in relation to the question of whether “you buy branded products over unbranded products.” Because economic development leads to individual consumers having more and more experi-ence of purchasing products and services, their evaluation skills become better honed, such that the proportion of consumers who rely on the opinions of others decreases.
(2)TendingtowardsgatheringinformationWhen the consumer behavior of “research and collect information on various products before purchase” is graphed, Indonesia appears at the apex of the curve (Figure 9). As the economy grows, product information that was not of interest to consumers in the early stages of economic growth starts to gain greater attention. Such interest reaches a peak at the stage of Indonesia. How-ever, at the stages that are the same as or above that of Thailand, such interest starts to diminish.
As background behind this phenomenon, it can be pointed out that at the stages before reaching a peak, information that helps choose a product gradually gains more and more importance because of an increase in product lineups as the economy grows. At the stages af-ter a peak is reached, the necessity of gathering information is highly likely to decline because of the improved reliability of products and their sales channels as well as the accumulated purchase experience of con-sumers. It could also be considered that consumers suffer from so-called “information fatigue” caused by an overload of the information sent from a variety of media, and their will to collect information declines.
Source: “IMF World Economic Outlook Database 2012” for per capita GDP.
Figure 7. Correlation in which a peak is reached at a certain stage of economic development
Consumer attitudes and behavior
Stage of economic development
Myanmar$824
Vietnam$1,374
Indonesia$3,512
Thailand$5,395
Malaysia$10,085
Japan$45,870
Ranking based on per capita GDP
9
Understanding ASEAN Consumer Markets through Country-Specific Questionnaires
Copyright 2013 by Nomura Research Institute, Ltd.
NRI Papers No. 192 December 1, 2013
economic development as Indonesia place an emphasis on durability when selecting a product. However, in Thailand and more economically developed countries, the importance of durability decreases (Figure 10).
Such a trend is most likely attributable to the fact that as the economy grows, the basic functionality of prod-ucts being offered on the market gradually improves. At the same time, consumers become accustomed to the improved performance of products, and take durability for granted resulting in a decline in the importance of durability.
A similar trend can be seen for the question of “Even at a high price, (do you) buy products with an emphasis on safety.” In the same way as for durability, described
This assumption was also supported by answers (word- of-mouth reviews) to the question of “what were the sources of information that made you aware of the prod-uct,” which showed a similar trend.
(3)ConsiderationofspecificationsandfunctionsRegarding the consumer attitude of “Even at a high price, (I) buy goods that are durable and unbreakable,” the proportions of respondents who answered “I think so” or “Not sure but I think so” remain around 80 to 90 percent up to the stage of Indonesia, but start to decline in countries that are at more developed stages. That is, approximately 90 percent of consumers in those coun-tries that are at the same or a preceding stage of
(%)
0
10
20
30
40
50
60
70
80
90
100
Note: The percentages refer to the proportions of respondents who answered “I think so” or “Not sure but I think so.”Sources: Compiled based on “ASEAN Family Income and Expenditure Survey” conducted by Nomura Research Institute (NRI) in 2012, “Questionnaire Survey of 10,000 Consumers” conducted in Japan by NRI in 2012 and “World Economic Outlook Database 2012,” IMF.
Figure 8. Correlation between ranking of countries by per capita GDP and “consider the reputation among people using the product” (placing an emphasis on reputation)
Japan
Malaysia(Kuala Lumpur)
Thailand(Bangkok)
Vietnam(Ho Chi Minh City)
Indonesia(Jakarta)
Myanmar(Yangon)
Scale of per capita GDP (ordinal scale)
(%)
0
10
20
30
40
50
60
70
80
90
100
Note: The question was asked respectively for the products that consumers buy at nearby stores (food), the products for which consumers visit multiple stores for selection (refrigerators) and specialty store products (clothing, fashion). The percentages shown above are those for products that consumers buy at nearby stores (food). Because a question equivalent to this question was not asked in Japan, the percentage for Japan is not included.Sources: Compiled based on “ASEAN Family Income and Expenditure Survey” conducted by Nomura Research Institute in 2012 and “World Economic Outlook Database 2012,” IMF.
Figure 9. Correlation between ranking of countries by per capita GDP and “research and collect information on various products before purchase” (tending towards gathering information)
Malaysia(Kuala Lumpur)
Thailand(Bangkok)
Vietnam(Ho Chi Minh City)
Indonesia(Jakarta)
Myanmar(Yangon)
Scale of per capita GDP (ordinal scale)

10
Understanding ASEAN Consumer Markets through Country-Specific Questionnaires
Copyright 2013 by Nomura Research Institute, Ltd.
NRI Papers No. 192 December 1, 2013
above, it is considered that as a country’s economy grows, consumers come to regard safety as being a “giv-en” that attracts less of their attention.
(4)Sourcesofinformationthatmakeconsumersawareofproducts
Looking at the proportions of respondents who selected “TV and radio” as “sources of information that made you aware of products,” in the same way as for the above-mentioned “consideration of specifications and functions,” the level remains relatively constant up to Indonesia, but drops off in more economically devel-oped countries. In specific terms, in Indonesia and those countries that are still working towards the stage of
Indonesia, around 70 percent of respondents stated that they relied on “TV and radio” as their sources of infor-mation. However, in Thailand and more economically developed countries, this figure gradually drops away. The figure for Japan supports this trend (Figure 11).
The main reason for this drop could be that as the economic level of a country increases, in addition to mass media such as TV and radio, other forms of me-dia such as the Internet and social networking services (SNS) start to make inroads to the point at which the importance of mass media is relatively reduced. Not only do “TV and radio,” but also “Transit advertis-ing and outdoor advertising” exhibit this downward trend.
(%)
0
10
20
30
40
50
60
70
80
90
100
Note: The percentages refer to the proportions of respondents who answered “I think so” or “Not sure but I think so.” Because a question equivalent to this question was not asked in Japan, no percentage for Japan is shown.Sources: Compiled based no “ASEAN Family Income and Expenditure Survey” conducted by Nomura Research Institute in 2012 and “World Economic Outlook Database 2012,” IMF.
Figure 10. Correlation between ranking of countries by per capita GDP and “Even at a high price, (I) buy goods that are durable and unbreakable” (consideration of specifications and functions)
Malaysia(Kuala Lumpur)
Thailand(Bangkok)
Vietnam(Ho Chi Minh City)
Indonesia(Jakarta)Myanmar
(Yangon)
Scale of per capita GDP (ordinal scale)
(%)
0
10
20
30
40
50
60
70
80
90
100
Note: The question was asked respectively for the products that consumers buy at nearby stores (food), the products for which consumers visit multiple stores for selection (refrigerators) and specialty store products (clothing, fashion). The percentages shown above are those for products that consumers buy at nearby stores (food).Sources: Compiled based on “ASEAN Family Income and Expenditure Survey” conducted by Nomura Research Institute in 2012, “Questionnaire Survey of 10,000 Consumers” conducted in Japan by NRI in 2012, and “World Economic Outlook Database 2012,” IMF.
Figure 11. Correlation between ranking of countries by per capita GDP and “TV and radio” (sources of information that made consumers aware of products)
Malaysia(Kuala Lumpur)
Thailand(Bangkok)
Vietnam(Ho Chi Minh City)
Indonesia(Jakarta)
Myanmar(Yangon)
Scale of per capita GDP (ordinal scale)
Japan

11
Understanding ASEAN Consumer Markets through Country-Specific Questionnaires
Copyright 2013 by Nomura Research Institute, Ltd.
NRI Papers No. 192 December 1, 2013
take proactive measures. The specific approaches that could be adopted include “use of the Japan brand” and “use of values presented by real channels.” These ap-proaches are explained in Sections 2 and 3.
The second direction involves “making use of experi-ence gained in one ASEAN country to move on into another ASEAN country.” Because consumers mature in step with the development of the economy, some of the experience and knowledge gained in the markets of those ASEAN countries that are relatively advanced ec-onomically could be applied to the markets of the countries where the stage of economic development is still relatively low. If a company plans to enter multiple ASEAN countries, it should be possible to draw on the experience and knowledge gained in moving into one country when moving into the next. Specific measures would include “knowledge management across coun-tries,” which will be explained in Section 4.
2 Use of the Japan brand
If the correlations described above are followed, the “im-portance of specifications and functions” declines in step with economic growth. Instead, there is a growing trend for consumers, when purchasing a product, to consider the values of the product extensively—not only the val-ues of the performance and functions of the product but also the emotional values such as image and branding.
In response to the question2 “Would you like to buy foreign-made food or a refrigerator even if it costs 20 to 30 percent more or even higher than locally made equiv-alents,” the proportion of respondents who answered that they would prefer to buy “Japanese brand products” from among Japanese, Korean, European and American brand products was relatively high in many countries and product areas (Figure 13). In product areas where the Japan brand is relatively strong in comparison to Eu-rope, the U.S. and Korea, it would be possible to utilize this strength to differentiate products.
The correlations explained above can be interpreted as suggesting that in every country, while the economy grows and the consumer environment and the media that people use change, the consumer market becomes more mature as consumer attitudes and behavior become di-versified and/or more sophisticated. If this is the case, these correlations suggest that there are situations where the experience gained in Japan, in which the consumer market has already matured, can be used. The correla-tions also indicate that it would be effective to use Malaysia’s market, which has a relatively well-developed economy within the ASEAN region, as the market for test marketing by Japanese companies intending to enter the ASEAN market.
III Suggestions for Japanese Companies Planning to Enter the ASEAN Market
1 Measures in two directions based on correlations
A major premise for entering the ASEAN market, which consists of the widely varying markets of each country, is to establish a strategy that is tailored to each individu-al country. At the same time, if the correlations that have been described up to this point are followed, it could be possible to create an efficient and effective strategy by paying attention to these correlations that commonly ap-ply to each country. Specifically, the correlations suggest the following two directions (Figure 12).
The first direction is to “focus on the degree of con-sumer maturity.” Given that consumers in some ASEAN countries have already begun to enter the mature phase, using the experience and expertise gained in the Japa-nese market, which has already reached the mature phase, in these countries would enable companies to
Figure 12. Correlations existing between stages of economic development and consumer attitudes/behavior, and suggestions for entry into the ASEAN market
Correlations existing between economic development and the degree of consumer maturity
Suggestions for entry into the ASEAN market
Consumer attitudes and behavior
Stage of economic development
Direction of focusing on the degree of consumer maturity
⇒ In anticipation of consumers becoming mature, experience gained in the Japanese market (that is already mature) is used
Direction of making use of experience gained in one ASEAN country to move on into another ASEAN country
⇒ The experience gained in one economically advanced country is applied to other countries where the stage of economic development is relatively low

12
Understanding ASEAN Consumer Markets through Country-Specific Questionnaires
Copyright 2013 by Nomura Research Institute, Ltd.
NRI Papers No. 192 December 1, 2013
3 Use of values presented by “real channels”
According to the correlations described in Chapter II, the importance of mass media such as TV and radio in recognizing and purchasing products and services de-clines as a country’s economic development progresses, such that the value of “real channels” such as bricks and mortar stores could become relatively more significant. From this point of view, in Malaysia, which is the most economically advanced of the surveyed countries, an analysis was made to see whether there is any difference between the “upper 50-percent segment in terms of in-come” and the “lower 50-percent segment in terms of income” in placing importance on these “real channels.” As a result, it was found that the importance attached to “shops and showrooms” by the upper 50 percent was 4.7 points higher than the lower 50 percent for “being aware of the product,” and 15.8 percent higher for “deciding to purchase the product.”
Actually, in Japan as well, the value attached to “real channels” such as bricks and mortar stores is high, with the “Questionnaire Survey of 10,000 Consumers” re-vealing that approximately 70 percent of consumers stated that “even if they make a purchase online, they will check the product in a store or showroom first.”
In the future, ASEAN countries might follow the same path as Japan, with the appearance of mass retail-ers leading to the formation of oligopolies in sales channels, which shifts the balance of power between manufacturers and retailers. As a result, manufacturers
However, in the five countries considered in this pa-per, the strength of the Japan brand varies between the countries. In Thailand and Indonesia, there is not much of a tendency to pay a premium for foreign goods. Therefore, even though the Japan brand has a more fa-vorable image than that of Europe, the U.S. and Korea, in these countries it is not possible to charge higher pric-es for Japanese products.
Given this situation, the strategy that Japanese com-panies should adopt can go in two directions.
①Strategy that is aimed at acquiring price premiums by setting high prices in consideration of the strength of the Japan brand
②Strategy that is aimed at gaining market share without relying on the Japan brand to acquire price premiums
An example of Strategy ① is “Sapporo Premium” beer made by Sapporo Vietnam. Within the beer market, the company is leveraging the upscale, high-quality image of the Japan brand to charge prices that are more than 30 percent higher than those of local competitors. An ex-ample of Strategy ② is the “Power TV” line of LCD TVs offered by Toshiba, which was explained in Chap-ter I. Despite carrying the Toshiba brand, by stripping these models of advanced functions and providing the minimum necessary functionality, as well as by custom-izing them to suit the ASEAN market, Toshiba has managed to drive down their prices and thus double its market share.
0 20 40 60 80
49.1
14.6
17.7
65.6
68.9
36.6
8.4
6.7
15.7
37.1
39.6
20.0
9.1
40.0
35.7
0 20 40 60 80 0 20 40 60 80
44.4
10.1
13.0
13.9
18.9
32.4
6.2
4.3
7.7
13.9
39.1
16.4
8.7
23.8
13.0
38.2
8.2
8.0
11.6
25.1
29.1
9.8
4.7
14.7
26.6
35.0
16.8
6.6
30.6
26.2
(%) (%) (%)
Note: The figures in circles refer to the ranking of Japanese brand products.Sources: Compiled based on “ASEAN Family Income and Expenditure Survey” conducted by Nomura Research Institute in 2012.
Figure 13. Percentages of consumers who “would pay 20 to 30 percent higher prices or more for Japanese, Korean, European and American brand products than locally made equivalents”
Japanese brand products Korean brand products European or American brand products
Products that consumers buy at nearby stores (food)
Products for which consumers visit multiple stores for selection (refrigerators)
Specialty store products (clothing, fashion)
Malaysia(Kuala Lumpur)
N = 507
Thailand(Bangkok)N = 400
Indonesia(Jakarta)N = 485
Vietnam(Ho Chi Minh City)
N = 506
Myanmar(Yangon)N = 500
1st
2nd 2nd
2nd
1st
1st
1st
1st
1st
3rd
3rd
3rd
1st
1st
1st

13
Understanding ASEAN Consumer Markets through Country-Specific Questionnaires
Copyright 2013 by Nomura Research Institute, Ltd.
NRI Papers No. 192 December 1, 2013
having experience in conducting business in Malaysia to other ASEAN countries as responsible personnel, there-by sharing knowledge through sharing personnel. In specific terms, by dispatching the local head of mer-chandising from Malaysia to another country, business knowledge and expertise is transplanted.
In addition, as a means of sharing knowledge using a meeting structure, the company provides a venue where responsible personnel in each country exchange opin-ions and views on a regular basis. In these meetings, the persons in charge of various departments in Malaysia discuss business deployment and operation methods with their counterparts in other countries, thus promot-ing the sharing of knowledge throughout the different countries.
The “2012 ASEAN Family Income and Expenditure Survey” conducted in five ASEAN countries revealed that even though each country has a high degree of dis-tinctiveness, certain correlations that can be commonly applied to all countries can be discovered if attention is paid to the stage of economic development to which a country has progressed. In addition to understanding the distinctiveness of each country, the authors believe that an effective strategy for entering an ASEAN market would take these correlations into account.
Notes:1 NRI conducted its “Questionnaire Survey of 10,000 Con-
sumers” six times, in 1997, 2000, 2003, 2006, 2009 and 2012, for the purpose of identifying the basic sense of val-ue, behavior and attitudes of Japanese consumers.
2 Questions were asked about how much more than the pric-es of local equivalents consumers would pay respectively for Japanese brand products, Korean brand products, Euro-pean and American brand products in the three product categories of products that consumers buy at nearby stores (food), products for which consumers visit multiple stores for selection (refrigerators) and specialty store products (clothing, fashion).
Takayuki KURABAYASHI is Group Manager in NRI’s Consumer Goods/Service & Healthcare Industry Consulting Department. His specialties include consumer industries in-cluding consumer goods, distribution and services; supporting the formulation and implementation of management strategy and business strategy; recently being involved in support for overseas business development with a focus on Asia.YuNIIMI is Consultant in NRI’s Consumer Goods/Service & Healthcare Industry Consulting Department. His specialties include management strategy, business strategy and marketing strategy in consumer industries as well as overseas business development with a focus on ASEAN.Satoru YATSUNAMI is Consultant in NRI’s Consumer Goods/Service & Healthcare Industry Consulting Depart-ment. His specialties include consumer goods marketing strat-egy and analysis of consumer attitudes and behavior.
might find it difficult to exercise control over the stores.
In view of these circumstances, manufacturers will want to increase the degree of control that they have over stores. For example, by increasing the ratio of com-pany stores under a company’s direct management, it becomes possible to more effectively and efficiently publicize a product’s performance, its functions and brand image. In fact, Samsung Electronics has increased the proportion of its company stores in the course of de-veloping new stores and has improved the levels of service offered by the store staff. By so doing, the com-pany has successfully enhanced its brand image in the ways it intended.
4 Knowledge management across countries
The correlations described above also suggest that an effective approach involves making use of the experi-ence gained in a particular country with an advanced level of economic development, and applying such ex-perience to another market. To this end, one effective method is to establish a regional headquarters (RHQ) within the ASEAN region that is to be responsible for coordinating and supporting the operations of subsidiar-ies in multiple countries close to the country where the RHQ is located. The role of the RHQ must be clearly defined as “providing knowledge management func-tions whereby the experience gained in penetrating and developing the market in one country can be transplant-ed to other countries.” Specifically, the roles that should be filled by the RHQ include:
• A “marketing strategy planning function” for for-mulating both specific and common policies for each country through the analysis of the distinctive-ness of each country and the commonality among them all
• A “meeting structure design and management func-tion” to promote the sharing of information among the persons in charge in each country
• A “personnel management system design function (rotation, etc.)” for designing the optimum person-nel reassignment from the viewpoint of transferring expertise
• An “education and training planning function” for planning human resource development to learn from successful experiences gained in each country
For example, AEON Malaysia has established a mecha-nism whereby the knowledge and expertise gained in Malaysia can be shared among AEON subsidiaries and their staff members in other ASEAN countries. To achieve this purpose, the company dispatches people

As a leading think tank and system integrator in Japan, Nomura Research Institute is opening new perspectives for the social paradigm by creating intellectual property for the benefit of all industries. NRI’s services cover both public and private sectors around the world through knowledge creation and integration in the three creative spheres: “Research and Consulting,” “Knowledge Solutions” and “Systems Solutions.”
The world economy is facing thorough structural changes led by the dramatic growth of IT industries and the rapid expansion of worldwide Internet usage—the challenges of which require new concepts and improvement of current systems. NRI devotes all its efforts to equipping its clients with business strategies for success by providing the best in knowledge resources and solutions.
NRI Papers present selected works of NRI Group’s 7,000 professionals through its worldwide research network. The mission of NRI Papers is to contribute new ideas and insights into business management and future policy planning, which are indispensable for overcoming obstacles to the structural changes in our society.
All copyrights to NRI Papers are reserved by NRI. No part of this publication may be reproduced in any form without the prior written consent of NRI.
Inquiries to: Corporate Communications Department Nomura Research Institute, Ltd. E-mail: [email protected]