understanding ayp and the assessment process luella middle school: a success story presenter: aaryn...
TRANSCRIPT
Understanding AYP and Understanding AYP and the Assessment Processthe Assessment Process
Luella Middle School:Luella Middle School:A Success StoryA Success Story
Presenter: Aaryn Schmuhl, PrincipalPresenter: Aaryn Schmuhl, Principal
Prime Time:Prime Time:Please write your answers on the index card Please write your answers on the index card provided.provided.
• What is FAY and how does it apply to What is FAY and how does it apply to academic performance and AYP academic performance and AYP determinations?determinations?
• If Luella Middle School had 44.5% of If Luella Middle School had 44.5% of SWD meet and exceed in Math in SWD meet and exceed in Math in 2009, what percentage of students 2009, what percentage of students need to meet and exceed to make need to meet and exceed to make Safe Harbor in 2010?Safe Harbor in 2010?

PT AnswersPT Answers
1. Full Academic Year- Currently, it is 1. Full Academic Year- Currently, it is students enrolled continuously from FTE students enrolled continuously from FTE 1 in October through the Spring Testing 1 in October through the Spring Testing Window. In addition, any student who Window. In addition, any student who received special education services at received special education services at any time during the year is in SWD.any time during the year is in SWD.
2. LMS needs 40% of students in the Did 2. LMS needs 40% of students in the Did Not Meet category to make AYP through Not Meet category to make AYP through Safe Harbor.Safe Harbor.44.5 – 44.5(.10) = 40%44.5 – 44.5(.10) = 40%

Essential QuestionsEssential Questions
• How can the AYP process help inform How can the AYP process help inform continuous school improvement?continuous school improvement?
• Is AYP data enough to drive Is AYP data enough to drive improvement in my school?improvement in my school?
• What ways can AYP be used as a What ways can AYP be used as a catalyst for changing the way we do catalyst for changing the way we do school?school?
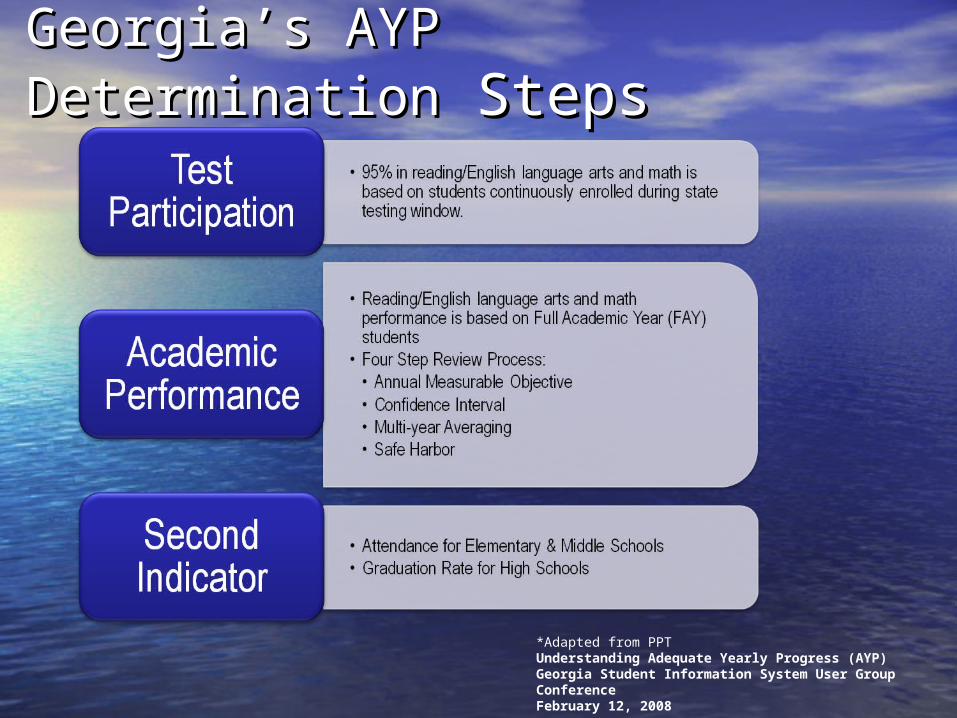
Georgia’s AYP DeterminationGeorgia’s AYP Determination StepsSteps
*Adapted from PPT Understanding Adequate Yearly Progress (AYP)Georgia Student Information System User Group ConferenceFebruary 12, 2008
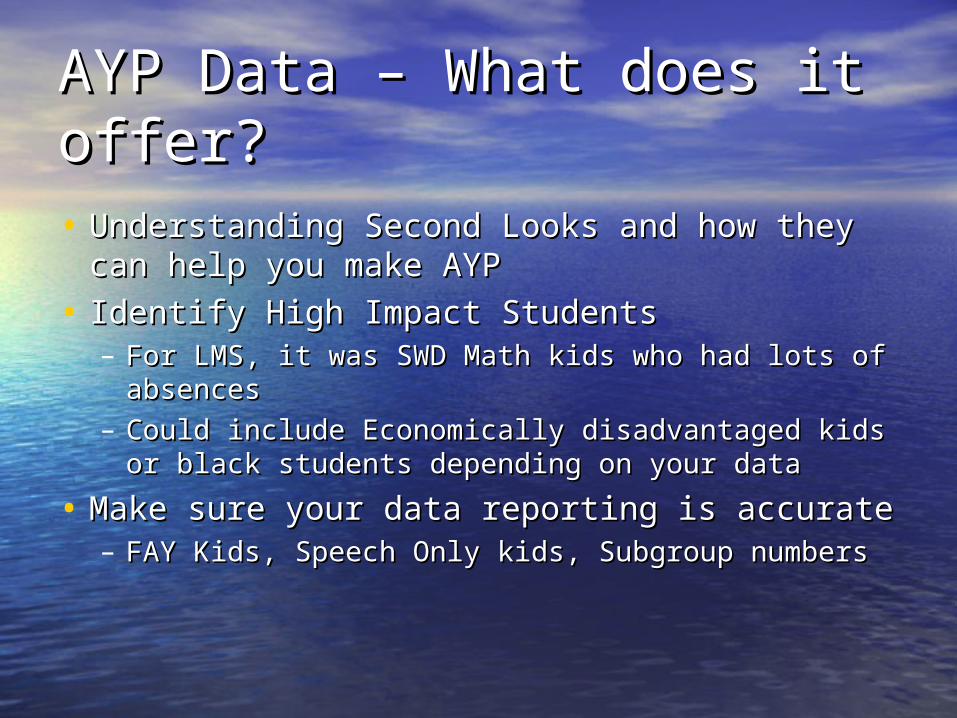
AYP Data – What does it AYP Data – What does it offer?offer?• Understanding Second Looks and how Understanding Second Looks and how
they can help you make AYPthey can help you make AYP
• Identify High Impact StudentsIdentify High Impact Students– For LMS, it was SWD Math kids who had lots of For LMS, it was SWD Math kids who had lots of
absences absences – Could include Economically disadvantaged kids Could include Economically disadvantaged kids
or black students depending on your dataor black students depending on your data
• Make sure your data reporting is accurateMake sure your data reporting is accurate– FAY Kids, Speech Only kids, Subgroup numbersFAY Kids, Speech Only kids, Subgroup numbers
Luella Middle Luella Middle SchoolSchool
Where were we?Where were we?
• In 2005-2006 School Year we were in NI-In 2005-2006 School Year we were in NI-22
• 1800 students and 50 portable classes1800 students and 50 portable classes• We served a diverse and transient We served a diverse and transient
population.population.• 50% of teaching staff in 05/06 were new 50% of teaching staff in 05/06 were new
to LMS and HCS.to LMS and HCS.• High Staff Turnover RateHigh Staff Turnover Rate• Low credibility in the communityLow credibility in the community

2005-20062005-2006Community and CollaborationCommunity and CollaborationFinding out who we are and where we want to goFinding out who we are and where we want to go
• Developed Belief and Vision StatementsDeveloped Belief and Vision Statements
• Needs Assessment of faculty skill and knowledge of Needs Assessment of faculty skill and knowledge of GPS curriculum and Assessment For Learning best GPS curriculum and Assessment For Learning best practicespractices
• Began to engage teachers in collaborative planning Began to engage teachers in collaborative planning processes and looking at only AYP Data.processes and looking at only AYP Data.
• Established B-Teams to build community and buy-inEstablished B-Teams to build community and buy-in– Better Seeking (Instruction)Better Seeking (Instruction)– Better Communication (PR with parents/comm.)Better Communication (PR with parents/comm.)– Behavior Management Team (4 step and referral review)Behavior Management Team (4 step and referral review)– Building Operations Team (managing flow of students)Building Operations Team (managing flow of students)
LMS-Our BeliefsLMS-Our Beliefs
• All learners learn best when they are engaged, All learners learn best when they are engaged, motivated, and intellectually challenged. motivated, and intellectually challenged.
• All learners learn best when they feel safe both All learners learn best when they feel safe both physically and mentally. physically and mentally.
• All learners need effective, timely, and specific All learners need effective, timely, and specific feedback to meet mastery learning targets based feedback to meet mastery learning targets based on performance standards. on performance standards.
• All learners need to feel ownership and All learners need to feel ownership and membership in a community that they are both a membership in a community that they are both a part of and contributor to in tangible and part of and contributor to in tangible and intangible ways. intangible ways.

LMS-Our VisionLMS-Our Vision• We will utilize technology as a means of organization, We will utilize technology as a means of organization,
communication, and creativity to close the feedback communication, and creativity to close the feedback loop, monitor and track student progress toward mastery loop, monitor and track student progress toward mastery targets, and to engage students in meaningful standards-targets, and to engage students in meaningful standards-based learning projects. based learning projects.
• We will make demonstrating mastery learning the We will make demonstrating mastery learning the primary and ultimate focus of everything we do and primary and ultimate focus of everything we do and constantly measure our actions against the question; constantly measure our actions against the question; How will it help my students to demonstrate mastery How will it help my students to demonstrate mastery learning? learning?
• We will make learning constant and time flexible. By We will make learning constant and time flexible. By utilizing block scheduling, flexible grouping strategies, utilizing block scheduling, flexible grouping strategies, and pyramids of academic intervention we will meet and pyramids of academic intervention we will meet students where they are and move them to mastery of students where they are and move them to mastery of the performance standards. the performance standards.
2006-2007 NI 3 2006-2007 NI 3 When AYP Data isn’t enough When AYP Data isn’t enough
• Large School in NI-3Large School in NI-3
• Still high turnover on staff, but lower Still high turnover on staff, but lower rate of 30%rate of 30%
• Only 26% of SWD Meet/Exceeded in Only 26% of SWD Meet/Exceeded in Math CRCTMath CRCT
• We didn’t know why our kids weren’t We didn’t know why our kids weren’t meeting expectations, just that they meeting expectations, just that they weren’tweren’t
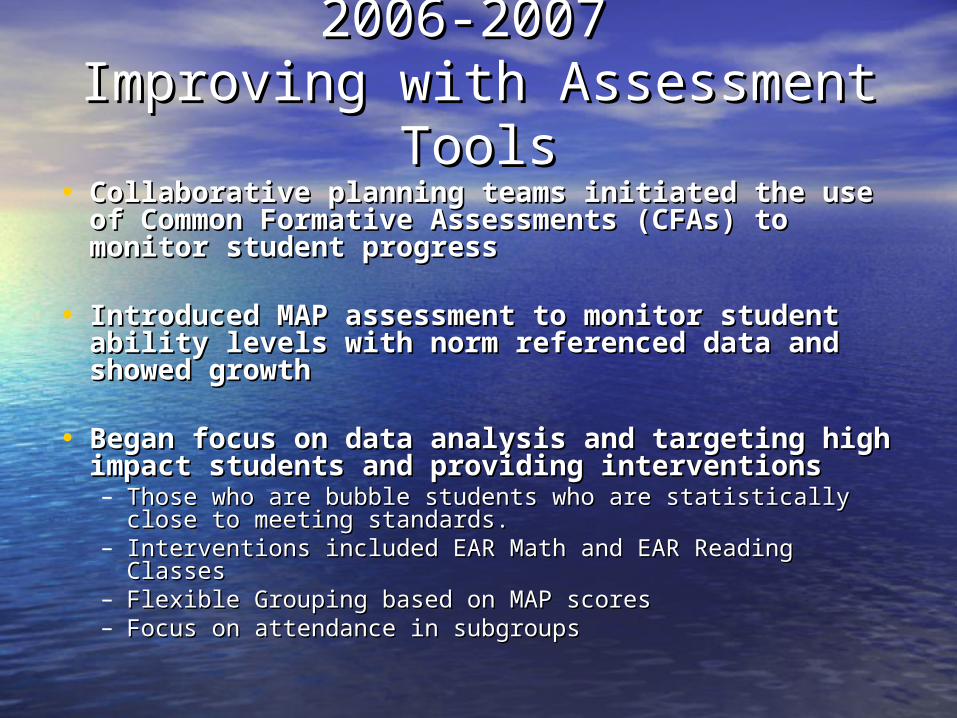
2006-2007 2006-2007 Improving with Assessment Improving with Assessment
ToolsTools• Collaborative planning teams initiated the use Collaborative planning teams initiated the use
of Common Formative Assessments (CFAs) to of Common Formative Assessments (CFAs) to monitor student progressmonitor student progress
• Introduced MAP assessment to monitor Introduced MAP assessment to monitor student ability levels with norm referenced student ability levels with norm referenced data and showed growthdata and showed growth
• Began focus on data analysis and targeting Began focus on data analysis and targeting high impact students and providing high impact students and providing interventionsinterventions– Those who are bubble students who are statistically close to Those who are bubble students who are statistically close to
meeting standards.meeting standards.– Interventions included EAR Math and EAR Reading ClassesInterventions included EAR Math and EAR Reading Classes– Flexible Grouping based on MAP scoresFlexible Grouping based on MAP scores– Focus on attendance in subgroupsFocus on attendance in subgroups
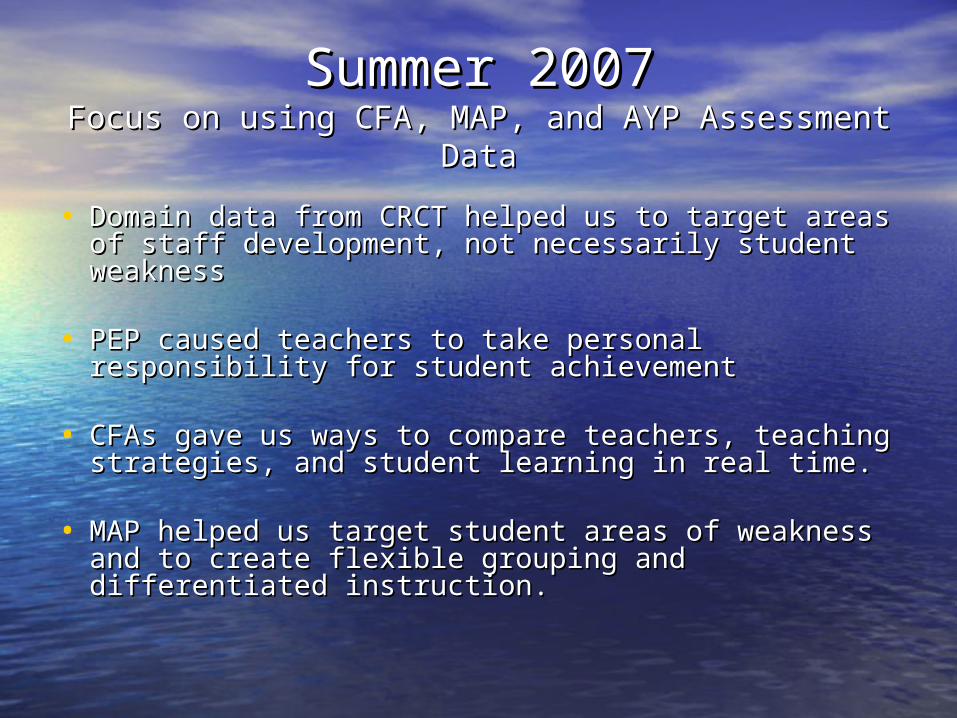
Summer 2007Summer 2007Focus on using CFA, MAP, and AYP Assessment DataFocus on using CFA, MAP, and AYP Assessment Data
• Domain data from CRCT helped us to target areas Domain data from CRCT helped us to target areas of staff development, not necessarily student of staff development, not necessarily student weaknessweakness
• PEP caused teachers to take personal PEP caused teachers to take personal responsibility for student achievementresponsibility for student achievement
• CFAs gave us ways to compare teachers, teaching CFAs gave us ways to compare teachers, teaching strategies, and student learning in real time.strategies, and student learning in real time.
• MAP helped us target student areas of weakness MAP helped us target student areas of weakness and to create flexible grouping and differentiated and to create flexible grouping and differentiated instruction.instruction.
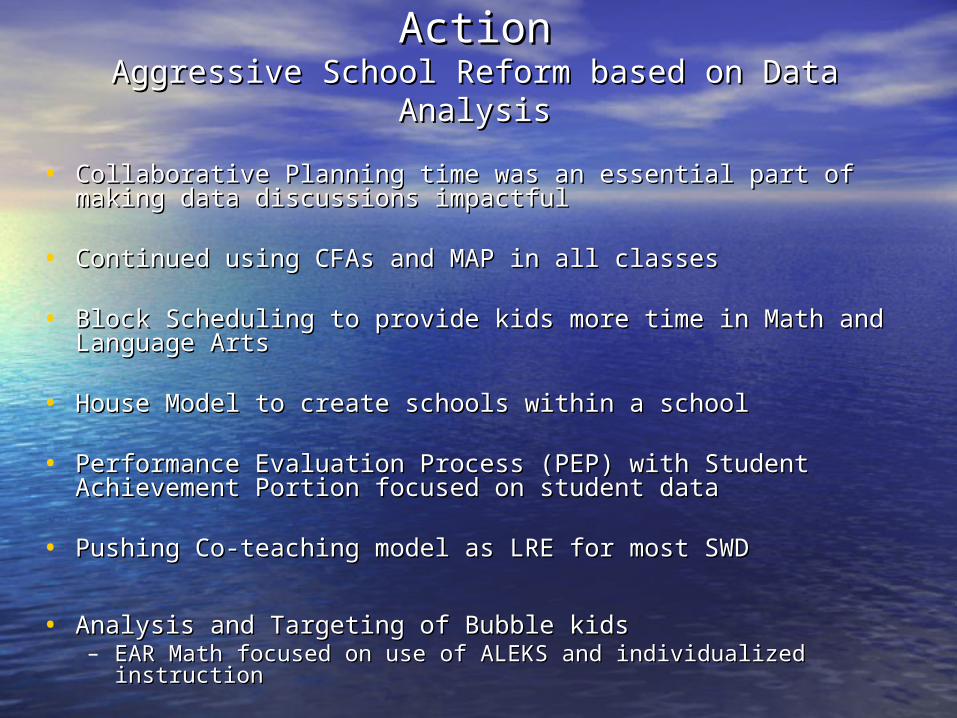
2007-2008 - NI 4 and Corrective Action2007-2008 - NI 4 and Corrective ActionAggressive School Reform based on Data AnalysisAggressive School Reform based on Data Analysis
• Collaborative Planning time was an essential part of making Collaborative Planning time was an essential part of making
data discussions impactfuldata discussions impactful
• Continued using CFAs and MAP in all classesContinued using CFAs and MAP in all classes
• Block Scheduling to provide kids more time in Math and Block Scheduling to provide kids more time in Math and Language Arts Language Arts
• House Model to create schools within a schoolHouse Model to create schools within a school
• Performance Evaluation Process (PEP) with Student Performance Evaluation Process (PEP) with Student Achievement Portion focused on student dataAchievement Portion focused on student data
• Pushing Co-teaching model as LRE for most SWDPushing Co-teaching model as LRE for most SWD
• Analysis and Targeting of Bubble kidsAnalysis and Targeting of Bubble kids– EAR Math focused on use of ALEKS and individualized instructionEAR Math focused on use of ALEKS and individualized instruction
2007-2008 Results are In!2007-2008 Results are In!
Made AYP with Safe Harbor!Made AYP with Safe Harbor!

2008-2009 2008-2009 Continue and RefineContinue and Refine
• Continue Collaborative Planning Time and ExpectationsContinue Collaborative Planning Time and Expectations
• Refine and extend use of CFAs, MAP and PEPRefine and extend use of CFAs, MAP and PEP– Monitor student progressMonitor student progress– Catalyst for identifying weak points of instruction for discussion Catalyst for identifying weak points of instruction for discussion
in CAMin CAM
• Targeted students were given additional interventionsTargeted students were given additional interventions– Working Lunches, SIEP before and after school, mandatory Working Lunches, SIEP before and after school, mandatory
intervention classesintervention classes
• SWD Specific ChangesSWD Specific Changes– Co-Teaching increased and reduced resource model Co-Teaching increased and reduced resource model – Converted 2 regular education math teachers to special Converted 2 regular education math teachers to special
education teachers to co-teach matheducation teachers to co-teach math– Full Time Math Coach focused training on performance tasks and Full Time Math Coach focused training on performance tasks and
students making meaning of math concepts, not just practicing students making meaning of math concepts, not just practicing basic skillsbasic skills
• Continued Block Schedule and House Model Continued Block Schedule and House Model
2008-2009 Results are In!2008-2009 Results are In!
Made AYP for the second year Made AYP for the second year with Safe Harbor!with Safe Harbor!
We are off the NI LIST!!!We are off the NI LIST!!!

Historical Perspective: DemographicsHistorical Perspective: Demographics
0102030405060708090
2002
2004
2005
2006
2007
2008
2009
2010
Black
White
Hispanic
Free andReduced
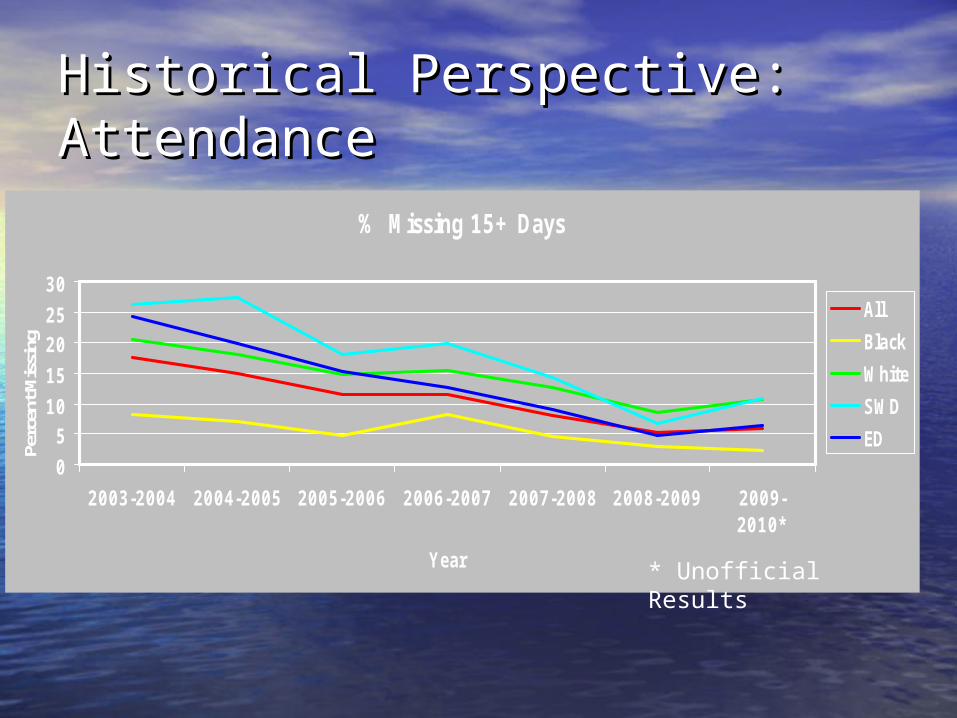
Historical Perspective: Historical Perspective: AttendanceAttendance
% Missing 15+ Days
0
510
15
2025
30
2003-2004 2004-2005 2005-2006 2006-2007 2007-2008 2008-2009 2009-2010*
Year
Perc
ent M
issi
ng
All
Black
White
SWD
ED
* Unofficial Results
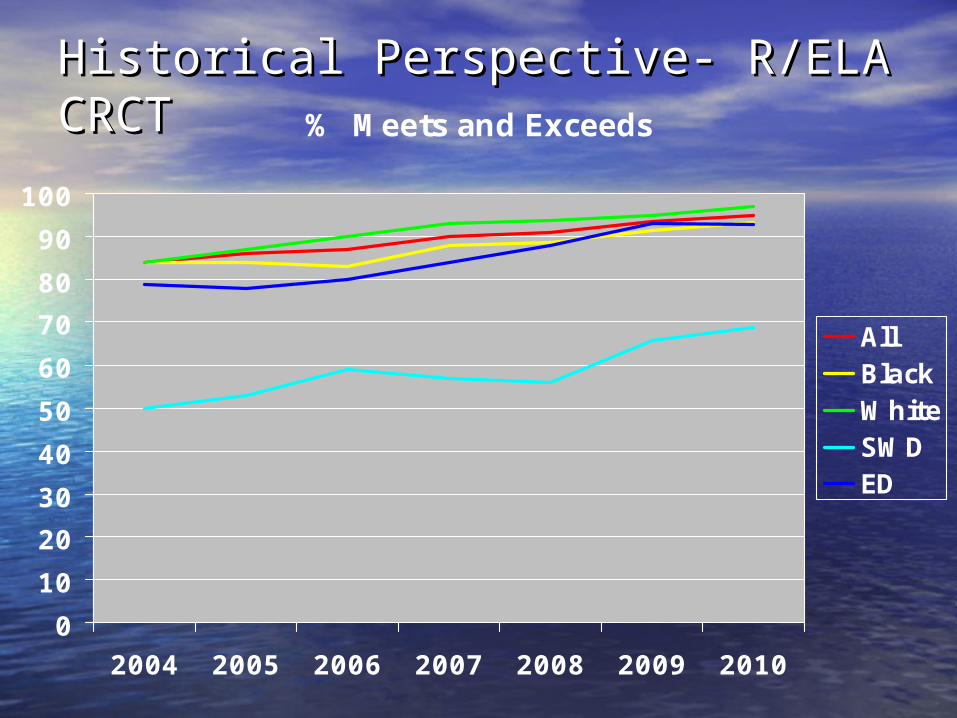
Historical Perspective- R/ELA CRCTHistorical Perspective- R/ELA CRCT% Meets and Exceeds
0
10
20
30
40
50
60
70
80
90
100
2004 2005 2006 2007 2008 2009 2010
AllBlackWhiteSWDED
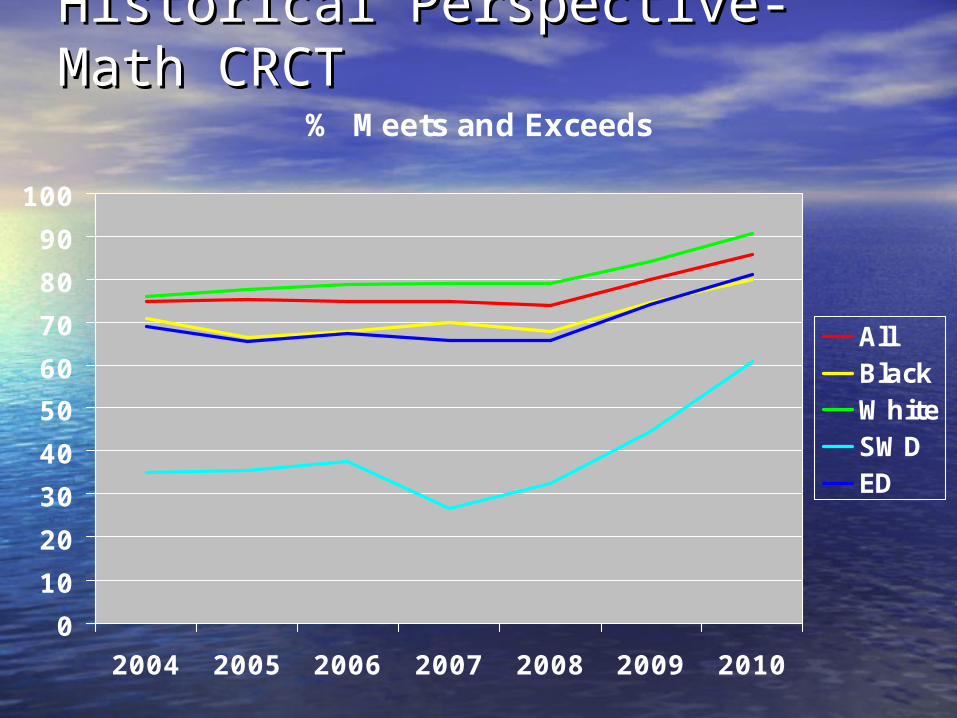
Historical Perspective- Math Historical Perspective- Math CRCTCRCT
% Meets and Exceeds
0
10
20
30
40
50
60
70
80
90
100
2004 2005 2006 2007 2008 2009 2010
AllBlackWhiteSWDED
Essential QuestionsEssential Questions
• How can the AYP process help inform How can the AYP process help inform continuous school improvement?continuous school improvement?
• Is AYP data enough to drive Is AYP data enough to drive improvement in my school?improvement in my school?
• What ways can AYP be used as a What ways can AYP be used as a catalyst for changing the way we do catalyst for changing the way we do school?school?

Summary PointsSummary Points
• Understanding who your kids are and Understanding who your kids are and what they need/don’t have to be what they need/don’t have to be successfulsuccessful
• Understanding who your teachers are Understanding who your teachers are and what they need/don’t have to be and what they need/don’t have to be successful.successful.
• Understanding what the available data Understanding what the available data tells you and what it doesn’t.tells you and what it doesn’t.
• Creating your own assessment data Creating your own assessment data points if you don’t have what you points if you don’t have what you want/need.want/need.