understanding basic oil analysis - royal … · understanding basic oil analysis ... optimum film...
TRANSCRIPT

Introduction to Shell LubeAnalyst
Understanding the basic tests Page 1 of 24
UUNNDDEERRSSTTAANNDDIINNGG BBAASSIICC OOIILL AANNAALLYYSSIISS
OOiill AAnnaallyyssiiss pprroovviiddeess iinnffoorrmmaattiioonn on:
Notes: There are 3 main areas about which oil analysis provides information. Shell LubeAnalyst focuses on all 3. However, the ultimate output from Shell LubeAnalyst is centred around equipment condition & remedial action when things are starting to go wrong.
EEVVAALLUUAATTIINNGG FFLLUUIIDD AANNAALLYYSSIISS TTEESSTT DDAATTAA
WWhhaatt’’ss NNeeeeddeedd::
• Sampling Consistency and Regularity ensures that trending will be relevant
• Proper test package selection provides the most revealing data to evaluate
• Knowledge About the Equipment
• Knowledge About the Fluid
• Knowledge About the Tests Employed
• Input and Feedback from the Operator/User
Notes: In order for a sample to be diagnosed efficiently, there is some fundamental information, which needs to be known. We have covered the importance of proper sampling techniques. The proper test package is extremely important. Why? Because the test package must match the criticality of the machine. The more information the Laboratory Diagnostician knows about the equipment, oil, operating conditions, etc, the better will be his diagnosis.
Fluid Properties
Contamination
Equipment Condition
Slide 3
Slide 4
Introduction to Shell LubeAnalyst
Understanding the basic tests Page 2 of 24
TThhee BBaassiicc tteessttss IInnvvoollvveedd
AAnnaallyyssiiss • Appearance
• ICP
• Viscosity
• Water
• Blotter spot
• Flash point
• TAN
• TBN
• Millipore sludges
• Particles counting
• ISU
• PQ
• Ferrography
BBAASSIICC EEXXPPLLAANNAATTIIOONN OOFF CCOOMMMMOONN TTEESSTTSS:: AAppppeeaarraannccee
What Is It? Perhaps the simplest of all tests, but the appearance test can provide a number of distinct clues about the oils conditions. What Causes Changes? Many New oils are "golden" coloured, clear and bright, and free from suspended solids. A hazy or cloudy appearance indicates water contamination. A milky appearance indicates emulsified (mixed) water in large quantities. Gradual darkening of the sample indicates oxidation of the oil (in conjunction with a strong smell). Particles as small as 40 microns can be detected by the unaided eye.
Notes: Lets now look at some of the basic tests performed which can establish the condition of the oil: Appearance is the first test usually performed by the laboratory & to a “trained eye” the appearance can say a lot about the oils condition
Slide 5
Slide 6

Introduction to Shell LubeAnalyst
Understanding the basic tests Page 3 of 24
AAppppeeaarraannccee // CCoolloouurr
Appearance: It is estimated visually: clear, cloudy, presence of sediments… Colour: It is measured by optical comparison. The interpretation is given by comparing with the fresh oil (colour 1.0 or 2.0). For instance, an oxidized oil will have a colour of 5.0 or 6.0.
BBAASSIICC EEXXPPLLAANNAATTIIOONN OOFF CCOOMMMMOONN TTEESSTTSS:: VViissccoossiittyy
What Is It? Viscosity is a measure of oil’s resistance to flow at a particular temperature Where Does It Come From?
1. Viscosity lowered by dilution with unburnt fuel 2. Viscosity lowered or increased by contamination with a lighter or heavier
grade of oil, respectively 3. Viscosity increased by the accumulation of soluble and semi-soluble products
of partial decomposition of oil and fuel, together with carbon, wear particles and water
4. Contamination by other products, e.g. antifreeze in engine oils
Notes: Viscosity is the most important property of the oil. Oil of the correct viscosity will provide optimum film strength in bearing clearance with minimum friction losses and leakage. Consequently the viscosity test can be one of the most important tests; however, it is often not very useful on its own. This is because there are numerous causes for the viscosity of oil to change for instance: Viscosity can DECREASE due to:
• Fuel Dilution
• Refrigerant Dilution(if a re-fridge compressor)
• Low viscosity oil has been added
• Viscosity can INCREASE due to:
• Oxidation
• Water Ingress
• Soot Build Up
• Antifreeze (glycol)
• High viscosity oil has been added
Slide 7
Slide 8

Introduction to Shell LubeAnalyst
Understanding the basic tests Page 4 of 24
VViissccoossiittyy ((ooiill tthhiicckknneessss mmeeaassuurreemmeenntt)) of new and used oils characterise the lubricant as to its grade. Viscosity grades are listed as SAE or ISO.
IISSOO ggrraaddeess are specified at 4400ooCC in centistokes (cSt) or mm2/s as +/- 10% of the
nominated value. For example ISO 46 has a viscosity range of 41.4 to 50.6 cSt (46 +/- 10%)
SSAAEE ggrraaddeess are specified at 110000ooCC. For example, SAE 40 grade oil has a viscosity
range of 12.5 to 16.3 cSt, with the next grade following on ie SAE 50 range is 16.3 to 21.4 cSt etc.
A set volume of lubricant to be tested is introduced by vacuum into specially designed Houillon tubes. After soaking at the required temperature, the oil is allowed to flow. The time taken for the oil to pass indicated calibration points is automatically measured and the time in seconds is multiplied by the calibration factor for the appropriate tube to give the viscosity in cSt or mm2/s. BBAASSIICC EEXXPPLLAANNAATTIIOONN OOFF CCOOMMMMOONN TTEESSTTSS:: WWaatteerr %%
What Is It? Water, either salt or fresh, may find its way into the sump. Where Does It Come From? Under "normal" operating conditions there should not be any appreciable amount of water in the system oil. Water, which does enter, usually comes from condensation or contamination/ improper storage and handling of lubricants or, in engines, from cooling system leaks, seal failure or cylinder head gaskets.
Notes: Water ingress should be avoided at all costs as it can cause oxidation (blackening) of the oil, additive depletion, acidity destruction, rust and scuffing. Water is a harmful contaminant in many lube oil systems because of its potential to cause failure via a number of mechanisms. Water will:
• corrode unprotected metal surfaces and attack bearing substrates
• cause instability of chemical additives in the lubricants
• encourage the formation of emulsions
Slide 9

Introduction to Shell LubeAnalyst
Understanding the basic tests Page 5 of 24
• alter the lubrication vapour pressure There are many potential sources of water contamination in any system including:
• leakage from oil coolers
• condensation of atmospheric humidity
• blow-by gases from diesel engine combustion spaces or past compressor ring packs
• leakage at tank vents (especially those exposed to weather)
• coolant jacket leaks through cracks, gaskets or seals
WWaatteerr bbyy ccrraacckkllee tteesstt
The "crackle" test indicates the presence of water. The principle is to pull a small amount of sample on a hot plate and do a visual determination. This technique is correlated to a reaction test called “aquatest”.
WWaatteerr bbyy KKaarrll FFiisshheerr
The accurate measurement of water in lubricants is critical. In instances where the water content must be of a low level such as in hydraulic systems and turbines, the method used uses a method called Coulometric Karl Fisher. The method can detect water in the parts per million (ppm) range and is accurate to +/- 0.5 ppm. This method is used to standardise the FTIR Method for water contents greater than 200 ppm (0.02%). Water can be separated from the lubricant at normal operating temperatures by the frictional heat of the moving surfaces and if it is present in sufficient quantities can lead to the water boiling off and causing
metal to metal contact in these lubricated areas which can lead to seizure of bearings, pistons etc.
Slide 10
Slide 11
Slide 12

Introduction to Shell LubeAnalyst
Understanding the basic tests Page 6 of 24
BBAASSIICC EEXXPPLLAANNAATTIIOONN OOFF CCOOMMMMOONN TTEESSTTSS:: FFuueell DDiilluuttiioonn ((EEnnggiinnee OOiillss OOnnllyy)) What Is It? The percentage of volatile components (presumably fuel) in the used oil. What Causes It? Leaking fuel lines, dribbling injectors, leaking transfer pump, defective spray patterns, worn injector pump, worn rings. Notes: Fuel is another contaminant that should be prevented from entering engine oils as it can cause additive depletion, lowers the flash point, introducing sulphur into the oil which when mixed with water / condensation sulphuric acid can be formed which is extremely corrosive. Fuel ingress can also reduce the film strength & viscosity of the oil leading to film breakdown & eventual engine failure.
FFllaasshh ppooiinntt
It is only measured for diesel engine oils using a "SETA FLASH" (closed cup). The first test is made on a "go / no go" principle at 180°C (190°C for bigger diesel engines). A more precise determination is made when the test is positive. A drop in the flash point value is indicative of a significant fuel dilution.
BBAASSIICC EEXXPPLLAANNAATTIIOONN OOFF CCOOMMMMOONN TTEESSTTSS:: IInnssoolluubblleess –– EEnnggiinnee OOiillss OOnnllyy What Is It? A measure of the "unburnt" products of fuel and oil, i.e. soot, fine solids such as silica (dirt), core sand, rust, dust, wear particles, incompletely burnt lubricating oil. What Causes It? Carbon, amongst other items, is a by-product of combustion from all diesel engines. Carbon will have a thickening effect on the oil, therefore it must be monitored to ensure the level remains acceptable.
Slide 13
Slide 14

Introduction to Shell LubeAnalyst
Understanding the basic tests Page 7 of 24
Engine condition will affect the rate of carbon generation, e.g. poor combustion, excessive blow-by.
Notes: Insolubles measure the element of unburnt products in the oil. High percentages of insolubles will eventually effect the oils dispersancy ability This test is really only applicable to diesel engine oils where the typical contamination levels far exceed those of any other lubricant system. High insoluble levels will cause:
• increased oil viscosity
• wear of bearings and running surfaces
• blockage of oil ways and filters
• fouling around the piston ring pack and piston top land The dispersancy and detergency of the lubrication oil will be effected and this will quicken the tendency for deposit build-up around the upper piston and piston ring pack.
BBAASSIICC EEXXPPLLAANNAATTIIOONN OOFF CCOOMMMMOONN TTEESSTTSS:: DDiissppeerrsseennccyy What Is It? The oil's ability to hold carbon (soot) in suspension. What Affects It? Additives, called dispersants, are added to engine oils to hold carbon in suspension - they do this by enveloping the carbon molecules and thereby not allowing them to join together and form sludge. The rate of depletion of these additives is related to time and the rate of carbon generation by the engine, i.e. engine health, degree of blow-by, fuel injection rates, etc. Notes: The dispersency tests measures the oils ability to hold carbon (soot) in suspension. As we saw in the previous slide insolubles can effect the dispersency ability of the oil
BBllootttteerr SSppoott
This test consists in measuring the opacity of an oil spot. This spot is obtained by depositing on a special filter paper a gouged oil drop first heated and then dried. I.C.: Contamination Index It represents the concentration of insolubles (combustion soots) expressed in percent. M.D.: Dispersancy It is the residual ability of the oil to disperse insolubles. - M.D. = 0 The dispersion is poor. The
insolubles are all concentrated in the centre of the spot. The residues are flocculated. - M.D. = 100 The dispersion is excellent. The distribution of the insolubles on the filter paper is homogeneous.
Slide 15
Slide 16

Introduction to Shell LubeAnalyst
Understanding the basic tests Page 8 of 24
D.P. : Demerit points It is the result of the following calculation : D.P. = (100 - M.D.) x I.C. It shows the overall condition of the spot since it combines at the same time the contamination (I.C.) and the dispersancy (M.D.). - D.P. = 0 or close è Very low contamination and excellent dispersancy. - D.P. approaching 100 or more è Strong contamination and poor dispersancy.
BBAASSIICC EEXXPPLLAANNAATTIIOONN OOFF CCOOMMMMOONN TTEESSTTSS:: OOxxiiddaattiioonn What Is It? A measure of the oxidation or nitration of engine or turbine oils. What Causes It? Extreme operating conditions, e.g. abnormally high temperature. Excessive oxidation or nitration generally results in increased oil viscosity. High rates may occur in engines fuelled with natural gas as combustion temperatures can be much higher than in equivalent diesel engines.
Notes: Oxidation or blackening of the oil is often as a result of a machine running at abnormally high temperatures. It generally results in a thickening of the oil.
BBAASSIICC EEXXPPLLAANNAATTIIOONN OOFF CCOOMMMMOONN TTEESSTTSS:: TToottaall BBaassee NNuummbbeerr ((TTBBNN)) EEnnggiinnee OOiillss OOnnllyy
What Is It? A measure of the oil's ability to neutralise acidic products of combustion, i.e. a measure of the remaining functional additive reserve. What Causes It? Engine oils (specifically Diesel oils) contain detergent / dispersant additives. These additives control oxidation, deposits, and the tendency of the oil to sludge. These same additives will be "used up" as the oil neutralises the acidic by-products of combustion, and consequently the TBN value will fall. Conversely the TBN will rise when top-up oil is added. Higher Sulphur levels in fuel increase the acidity of by-products. Low TBN may also be associated with poor combustion, excessive blow-by, low oil make-up, or dilution with a low TBN oil. Notes: The Total Base Number (TBN) is mainly applied to crankcase oils. The TBN level is a measure of reserve alkalinity of an oil . Engine oils are equipped with additives that provide reserve alkalinity to neutralise the acids generated during combustion. Put simply, the governing factor for the rate of decay of TBN is the fuel sulphur level and the initial sump volume. The governing factor for the stable final TBN level is the oil consumption rate and the fuel sulphur level. Rapid TBN decrease is caused by:
• low oil consumption
• small sump volumes
• high fuel sulphur levels Low TBN reserves provide insufficient neutralisation capacity leading to corrosion of engine components particularly around the piston ring pack, piston ring lands and top end bearing.
Slide 17
Slide 18
Slide 19

Introduction to Shell LubeAnalyst
Understanding the basic tests Page 9 of 24
TTBBNN
Engine oil formulations generally will include additive, which impart a basic nature to the oil. When analysed, this is known as the TOTAL BASE NUMBER (TBN) by test method ASTM D2896 and is measured by the amount of acid it takes to neutralise the base present in the oil.
The value is expressed in mgKOH/g, ie milligrams of potassium hydroxide per gram of oil that is equivalent to the amount of acid needed to the react with the base present. The TBN is included in the formulation to counteract acid formation due to oil oxidation and more particularly the acids formed on combustion of fuels. The analysis for TBN is similar and uses the same equipment as the analysis for TAN
BBAASSIICC EEXXPPLLAANNAATTIIOONN OOFF CCOOMMMMOONN TTEESSTTSS:: TToottaall AAcciidd NNuummbbeerr ((TTAANN)) ((HHyyddrraauulliicc,, CCoommpprreessssoorr,, TTuurrbbiinnee,, aanndd AAiirr CCoonnddiittiioonniinngg CCoommpprreessssoorr
OOiillss,, pplluuss TTrraannssmmiissssiioonn FFlluuiiddss)) What Is It? A measure of the acidity of a lubricant, which gives an indication of the deterioration of oil in service due to oxidation. Increased acidity will contribute to component corrosion. What Causes It? Oxidation of the oil will be accelerated by high temperature operation and high exposure to oxygen through aeration, etc. The presence of wear metals, e.g. copper, iron, etc. can increase the rate of oxidation. In advanced stages of oxidation the oil will show an increase in viscosity. Notes: Total Acid Number or TAN is the measure of both the weak organic and strong inorganic acids present in oil. It is applicable to gearbox, gas turbine and hydraulic lubricants. TAN is not generally associated with engine crankcase lubricants unless they are severely contaminated. The singular exception to this may be crankcase lubricants for gas engines. In this instance, TBN can deplete very rapidly and high operating temperatures can rapidly generate high levels of weak organic acids. A rise in TAN is generally associated with oil oxidation due to time and or operating temperature. Trend as well as absolute values should monitor TAN. Lubricants used in applications other than engines are often slightly acidic for a number of reasons including improved water shedding ability. Some oils are supplied with an initial ‘high’ TAN number. This can drop with use, then slowly rise again as the effects of ageing becomes apparent. TAN increase is due to:
• Oxidation producing polymers and weak organic acids High TAN will cause:
Slide 20

Introduction to Shell LubeAnalyst
Understanding the basic tests Page 10 of 24
• the formation of gums and lacquers on metal surfaces
• associated with increased viscosity of pumping losses
• a gradual speed up in the rate of TAN increase
• system corrosion, particularly if water is present
TTAANN
Oil formulations generally will have some acidic properties. The acidity determination is known as Total Acid Number (TAN) and is measured by the amount of base it takes to neutralise the acid present in the oil. The value is expressed in mgKOH/g, ie milligrams of potassium hydroxide per gram of oil that is needed to the react with the acid present. Acid in systems can lead to corrosion products if left too long in the system and is counteracted by adding anti-oxidants into the oil’s formulation at manufacture which prevent the acid forming by being preferentially used up during service. When the antioxidant has been consumed the TAN will start to rise.
WWEEAARR MMEETTAALLSS AANNAALLYYSSIISS
Guidelines for Wear Metals: "Normal" wear metal levels may vary significantly between different types of equipment and different applications. The true value of oil analysis is in establishing a wear trend for each piece of machinery, which will be specific to that item of machinery, its operating cycle, and its operating environment. Remember, the absolute value of wear metals will vary with:
• oil drain intervals
• oil top-up rate Notes: So as we have seen different working environments can bring with them their own distinct contaminants & remember the length of time the oil has been in service can also have an influence of contamination levels. Recently changed oil can’t always reflect a machines TRUE operation condition. Why, because the majority of the contaminants were dumped when the oil was changed.
Slide 21
Slide 22
Slide 23

Introduction to Shell LubeAnalyst
Understanding the basic tests Page 11 of 24
IICCPP –– IInndduuccttiivveellyy CCoouupplleedd PPllaassmmaa The oil sample mixed with a solvent, to thin the sample allowing it to be pumped, is burnt in a plasma torch, which is basically superheated gas (argon) at
approximately 10000oC. The light emitted from the sample during burning is a mixture of the light given off by each of the metals present. This mixture of light is separated into the individual metals and the amount of light is equivalent to the amount of metal present. Each metal has a specific light
wavelength, which identifies it from other metals
Iron, Chromium, Copper, Lead, Tin and Aluminium are some of the usual wear metals expected from compartment components Sodium, Potassium and Silicon are typically contaminants metals from environment or cooling system Calcium, Magnesium, Zinc, Molybdenum and Phosphorus are typical of the different additive metals found in lubricants
WWEEAARR MMEETTAALL AANNAALLYYSSIISS
WEAR PARTICLE ANALYSIS
Wear particle analysis techniques give information about:
• Particle size and distribution
• Concentration of particles (i.e. quantity)
• The elements present and the concentration
• What the particles look like (i.e. their morphology) and how hot they've been. This information can be helpful in:
• Forecasting wear-related problems before they lead to expensive failure
• Quantifying contaminants and thereby identifying components where wear is taking place.
Notes: By analysing the type of wear metal a lot of information can be gained as we can see on this slide
Slide 24
Slide 25

Introduction to Shell LubeAnalyst
Understanding the basic tests Page 12 of 24
OORRIIGGIINN OOFF WWEEAARR MMEETTAALLSS –– EENNGGIINNEE OOIILLSS
Notes: As we have mentioned before, the type of metal can indicate where the debris is coming from & consequently the diagnostician can ascertain which parts/s of the machine is possibly wearing. This slide shows wear metals sources associated with engines
G U ID E L IN E S F O R T H E O R IG IN O F W E A R M E T AL S E N G IN E O IL S
W E AR M E T AL S P O T E NT IAL O R IG IN O F P ART ICL E S
F e (Iron ) C y linde r wa lls/ liners, c rank and cam shafts, v alv e guides, rockers, r ings, bearings, gears, shaf ts.
P b (Lead) G ene ra lly used as an a l loy (B abb it, C opper-Lead) in bearings. B ig -end and c rankshaf t bearings, th rust wa she rs.
C u (C opper) U sua lly a lloyed in the fo rm of b rass, b ronze or as s in tered copper-lead. B ig -end and crankshaf t bearings, bush ings, o il coo lers and coo ler core tubes, o r copper-type anti-se ize com pounds, th rust wa sters. F uel transfer pum p, gov erno r bush ings and w rist p in bush ing s.
C r (C h rom ium ) C om m only used as p la ting m etal- chrom e-pla ted cy linder line rs and p iston rings, v alv e stem s. C hrom ate trea ted coo ling system s.
S i (S ilicon) D irt. H ighly ab rasive . S ources include inadequa te ly f il te red a ir due to c racked induc tion p iping or hose s, de fectiv e o r incorrec tly f itted a ir f il te rs and gaske ts. D irty oil f illing or sam pling equ ipm en t. Incorrec tly f it ted or m issing o il f il le r cap. Ineffec tiv e reserv oir b reather. M ay a lso be S ilicone-based ga ske t/ jo in ing m a teria l. A lso anti-foam add itiv e.
N a (S od ium ) C oo lant leakage, wa ter o r using the sam e conta iner fo r coo lan t as fo r o il.
A l (A lum inium ) P istons (scu ff ing , scoring or bu rn ing). A lum inium bearings. A lloy housing wear. In tu rbo-charge rs it can be housing o r ro tor wear. M ay a lso be assoc ia ted w ith h igh S i lev els in the fo rm of clay o r stone du st con tam ination .
S n (T in ) T op bearing o r slide bearing . C am shaf t bush ings.
N B : U ppe r eng ine wea r is cha rac terised by h igh lev e ls of F e, C r, A l, S i. Lower eng ine wea r is charac terised by P b, S n, C u.
Slide 26

Introduction to Shell LubeAnalyst
Understanding the basic tests Page 13 of 24
OORRIIGGIINN OOFF WWEEAARR MMEETTAALLSS –– TTRRAANNSSMMIISSSSIIOONN && GGEEAARR OOIILLSS
Notes: This slide gives the wear metals sources associated with gearboxes.
OORRIIGGIINN OOFF WWEEAARR MMEETTAALLSS –– HHYYDDRRAAUULLIICC OOIILLSS
WEAR METAL
POTENTIAL ORIGIN OF PARTICLES
Iron Pumps, valve s, oil reservoirs
Lead Copper
Pump bearings, solder in coil coolers Pump bearings, oil return lines, oil coolers.
Silicon Dirt - highly abrasive. May come from:
• Oil filling
• Built-in dirt from construction
• Breather in reservoir
• Return line filter
• Cylinder ram seals
• Pump
Notes: This slide gives the wear metal sources associated with hydraulic systems
TRANSMISSIONS; FINAL DRIVES; DIFFERENTIALS
WEAR METAL POTENTIAL ORIGIN OF PARTICLES
Iron Gear teeth, splines, bearings, shafts. Brake drums (wet brake transmission fluids)
Lead Bearings
Copper Bearings, thrust washers (final drive and diffs.)
Transmission discs }
Powershift transmission } transmission Steering clutch discs }
Gear bushings in direct drive transmission }
Oil tubes and pump bushings in track type Tractor final drives
Aluminium Pump housing }
Torque converter, } transmission impeller or turbine }
Oil pump drive gear (Cat D8 final drives)
Dirt (see Silicon)
Silicon Brake linings - transmissions. Dirt - contamination from external sources (check condition of
breathers) or contamination through poor housekeeping. Increases
in levels of Si may be accompanied by increases in Al which is an additional element in clay and stone dust.
Slide 27
Slide 28

Introduction to Shell LubeAnalyst
Understanding the basic tests Page 14 of 24
FILTRE
VIDE
Millipore Sludges
This method consists of filtering 100 ml of fluid through a membrane with a specified pore size. There are different types of membranes and the porosity varies, depending on the type of product. 0,8 µm for hydraulic and turbine oils. 5 µm Teflon for HF fluids (type C). 5 µm for gear oils.
The membrane filter (Millipore) is first dried and weighed. After filtration, the membrane is dried and weighed again. The difference in weight gives an accurate indication of the weight of the sediments, which remain on the membrane. According to the standard, the result should be expressed in mg/100 ml but to make things easier and more practical, we have chosen to give the result in mg/l. This gives an indication of the overall contamination. This method is very easy to implement but can be
tricky. The reproducibility of this measurement is more or less 20 %.
Particles Sizes Analysis
By passing a laser beam though a moving stream of the lubricant, particles of the various sizes present will stop the laser light getting to the sensor in proportion to the size of each particle (that is the larger the particle the larger the “shadow” and the less energy getting to the sensor and vice versa). These “shadows” are counted and the sizes, based on the above principle, are computed and reported for predetermined size ranges that have been established for cleanliness of lubricants. Results can be presented utilising Aerospace Standards (SAE AS 4059), ISO 4406, or any other standard appropriate for determining oil cleanliness after calibration
to ISO11171. Particle sizing is useful mainly in forced lubrication systems, where the cleanliness can be controlled by filtration. Splash lubricated applications are not ideally suited because the sample in all likelihood would not be representative and there generally are no controllable means of reducing the particle count.
Slide 29
Slide 30
Introduction to Shell LubeAnalyst
Understanding the basic tests Page 15 of 24
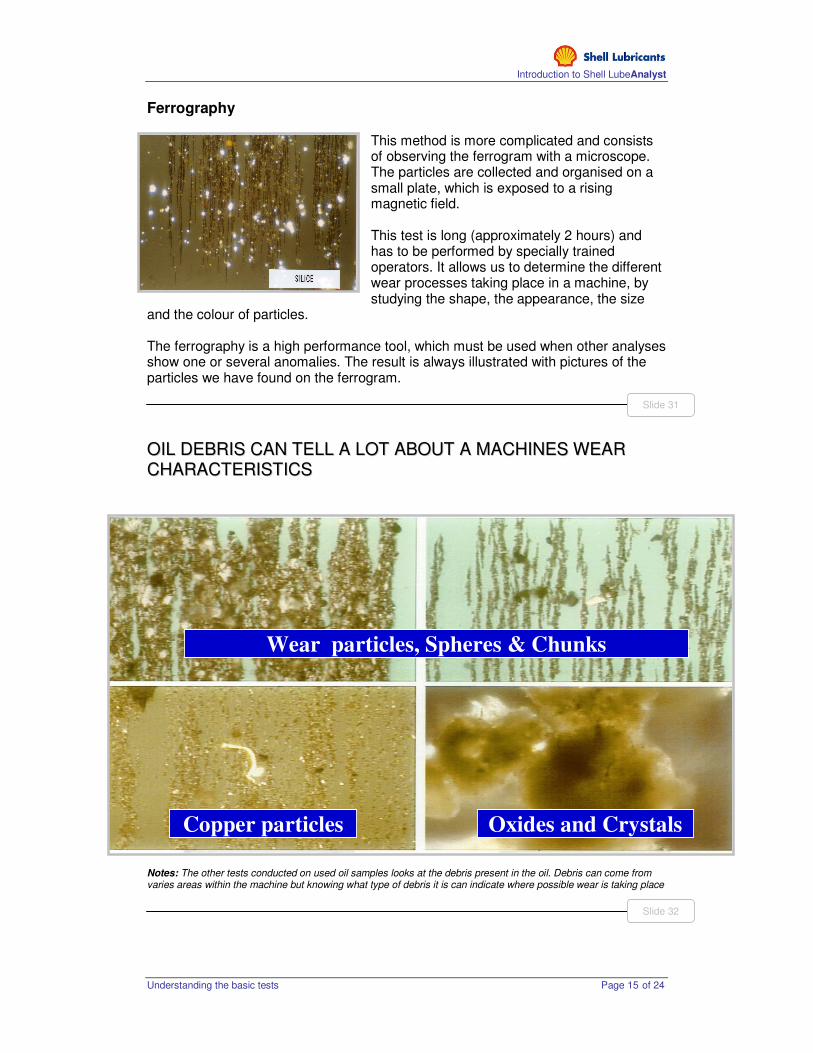
Ferrography This method is more complicated and consists of observing the ferrogram with a microscope. The particles are collected and organised on a small plate, which is exposed to a rising magnetic field. This test is long (approximately 2 hours) and has to be performed by specially trained operators. It allows us to determine the different wear processes taking place in a machine, by studying the shape, the appearance, the size
and the colour of particles. The ferrography is a high performance tool, which must be used when other analyses show one or several anomalies. The result is always illustrated with pictures of the particles we have found on the ferrogram.
OOIILL DDEEBBRRIISS CCAANN TTEELLLL AA LLOOTT AABBOOUUTT AA MMAACCHHIINNEESS WWEEAARR CCHHAARRAACCTTEERRIISSTTIICCSS Notes: The other tests conducted on used oil samples looks at the debris present in the oil. Debris can come from varies areas within the machine but knowing what type of debris it is can indicate where possible wear is taking place
Slide 31
Wear particles, Spheres & Chunks
Copper particles Oxides and Crystals
Slide 32

Introduction to Shell LubeAnalyst
Understanding the basic tests Page 16 of 24
Direct Reading Ferrography
In normal working conditions, each machine generates its own quantity of wear particles and the distribution in size of all particles can be considered as constant. If an anomaly occurs, there is an imbalance between the number of large particles (DL) and the small ones (DS). This is the sign of a wear problem. It is important to note that the limit between large and small particles is situated around 2 microns. The direct reading ferrography (I.S.U. : Wear Severity Index) is a simple method to monitor the evolution of the wear for a moderate cost. The calculation is: (DL + DS) x (DL - DS) = I.S.U. Quantity Wear of wear severity
PQ Index
Particle Quality (PQ) measures the effect of the wear particles on a magnetic field. When calibrated on known standards, index or relationship number can be produced
N Large particles
indicate abnormal wear and have
greater effect on magnetic field.
Smaller ferrous particles have lesser effect on magnetic field and are typical
of normal wear.
Slide 33

Introduction to Shell LubeAnalyst
Understanding the basic tests Page 17 of 24
and from this criteria for satisfactory, significant and severe wear can be determined and reported as the PQ Index. The effect of the particles on a magnetic field can be used to detect the type of wear. Small fragments (<10 micron) would have the least effect on a magnetic field, while larger chips (>35 micron) would have a larger effect increasing with chip size increases.
Normal Wear: Small wear particles due to typical welding/breaking cycle. (PQ
< 200) Significant Wear: Medium sized particles causing gouging of metal and resulting
in large than normal particles being generated. These in turn become the cause of even larger particle generation. (PQ > 200 but < 600)
Severe Wear: Large particle occurrence which may reflect presence of metal
particles due to fatigue fracture or pitting of the metal components. This production of large metal chips can in turn induce enough wear to cause further disintegration and rapid onset of failure. (PQ > 600)
Slide 34

Introduction to Shell LubeAnalyst
Understanding the basic tests Page 18 of 24
LLUUBBIICCAANNTTSS CCOONNTTAAMMIINNAATTIIOONN CCOONNTTRROOLL
CONTAMINATION
The centre for Hazardous Materials Research, Harvard, USA observed that oil does not wear out. Oil maintains its integrity indefinitely and the only reason it ever needs to be changed is contamination from internal or external sources. This contamination causes 60% of friction wear and tear problems in lubricated machines.
IInntteerrnnaall eexxtteerrnnaall 6600%% ooff ffrriiccttiioonn wweeaarr
Notes: As this slide demonstrates, contamination is the prime cause of Lubricants degradation. Contamination comes from internal & external sources, as we shall see in the forthcoming slides. Contamination is often defined as anything that pollutes, infects or has an undesirable affect on something else. Though contamination can exist in several states, they all have detrimental effects on lubrication & machine surfaces in one way or another. Generally, oil contamination will modify the physical & chemical properties of the lubricant & chemically attack & destroy machine surfaces
CCOONNTTAAMMIINNAATTIIOONN MMUUSSTT BBEE CCOONNTTRROOLLLLEEDD!!!!
Reasons for Equipment Problems
NNoottee tthhee mmaajjoorriittyy ooff pprroobblleemmss ((6600%%)) aarree dduuee ttoo ccoonnttaammiinnaattiioonn aanndd ppoooorr ffiillttrraattiioonn
Notes: 60% of machinery problems are related to contamination, so we & our customers must ensure that we prevent contamination whenever possible. This can be achieved by improved housekeeping & filtration.
Slide 36
66%%
S
2222%% 6600%%
1122%%
Contamination
Abnormal Wear
Oil Degradation
Oil Properties
Slide 37

Introduction to Shell LubeAnalyst
Understanding the basic tests Page 19 of 24
CCOONNTTAAMMIINNAATTIIOONN SSOOUURRCCEESS
Notes: This graph lists the sources of contamination. It helps to demonstrate the numerous forms of contamination. The “built in” contamination is created by the manufacturer of the equipment either at the time of manufacture or shipping. However, manufacturers have managed to restrict this form of contamination to a minimum. Ingested contamination can be controlled to a large extent by the operator of the equipment & in most cases can be reduced by adopting better maintenance practices. Emphasise again that oil life is dependent on the effects of contamination.
Slide 38

Introduction to Shell LubeAnalyst
Understanding the basic tests Page 20 of 24
LLUUBBRRIICCAANNTTSS SSTTOORRAAGGEE && HHAANNDDLLIINNGG Notes: Every day maintenance personnel in plants across the world fill or top-up systems with new lubricants. Their intention is to positively impact the life and performance of the equipment. Yet, unknowingly they often add, chemically depleted lubricants containing particulate, chemical and moisture contamination. Poor in-plant storage often lies at the root of these occurrences. Just like bearings, gears or valves, lubricants should be considered working components in mechanical systems. Just as one would not install a dirty or damaged bearing on a piece of equipment using the wrong tools, "damaged" lubricants should not be added to the machine. The first step toward achieving proactive maintenance of your customers’ lubricants, and ultimately their equipment, begins with proper in-plant storage and handling. Lubricants are often contaminated before it enters the machine. It is our duty as a responsible oil company to ensure our customers keep contamination to a minimum. The next few slides demonstrate some of the fundamental storage & handling practices we should be encouraging our customers to adopt.
PPRROOPPEERR LLUUBBRRIICCAANNTTSS SSTTOORRAAGGEE RROOOOMM
Notes: We must of course assume that the product delivered to our customers is contamination free. However, this could be a wrong assessment if the contractors we (Shell) employ, don’t know how to handle the product. Do they just drop drums on the ground from a lorry or do they use proper offloading equipment. Similarly, can we guarantee that our contractors bulk oil tankers are as clean & contamination free, as we would like them? It might be worth checking with your distribution colleagues about the regulations they lay down regarding the transportation of packed & bulk lubricants. Once the product has been delivered to the customers’ premises, here are some basic tips when storing packed lubricants:
• Pails & drums must be stored in a clean and dry location
Slide 39

Introduction to Shell LubeAnalyst
Understanding the basic tests Page 21 of 24
• Storage temperatures should remain moderate at all times
• The storeroom should be properly ventilated. Lubricants in storage should be located away from all types of industrial contamination including dust and humidity
• Bungs must be kept tight at all times and drum covers should be used whenever drums are stored in the upright position. Ideally, lubricants should be stored in the horizontal position (with bungs at 3 and 9 o'clock positions). on proper storage racks allowing the containers to be rotated and used on a first-in, first-out basis
LLUUBBEE SSTTOORRAAGGEE –– TTHHIINNGGSS TTOO AAVVOOIIDD Notes: Contamination can enter drums both sealed & unsealed. Try & avoid your customers adopting these practices. Always ensure that lubricants are located away from ALL types of industrial contamination including dust & humidity. Bungs should be kept tight at all times.
Slide 40
Unsealed
DrumPumps
Pumps
withoutFilters
Unsealed
DrumPumps
Pumps
withoutFilters
Outdoor Storage
Poor
House - Keeping
Outdoor Storage
Poor
House - Keeping
Slide 41

Introduction to Shell LubeAnalyst
Understanding the basic tests Page 22 of 24
EENNSSUURREE CCUUSSTTOOMMEERRSS SSTTOORREE DDRRUUMMSS CCOORRRREECCTTLLYY –– NNOOTT LLIIKKEE TTHHIISS!!!!
Notes: Drums are particularly vulnerable when stored outside. Do not allow this to happen (slide picture). Always ensure that drums are stored on their side with the bungs at “a quarter to three”. This will prevent water or condensation entering the drum because the bungs are covered with oil & therefore preventing any form of contamination ingress. If lubricants must be stored outside try & minimise exposure to adverse conditions. Shelter from rain, snow, direct sunlight & other similar elements.
Slide 42
Introduction to Shell LubeAnalyst
Understanding the basic tests Page 23 of 24
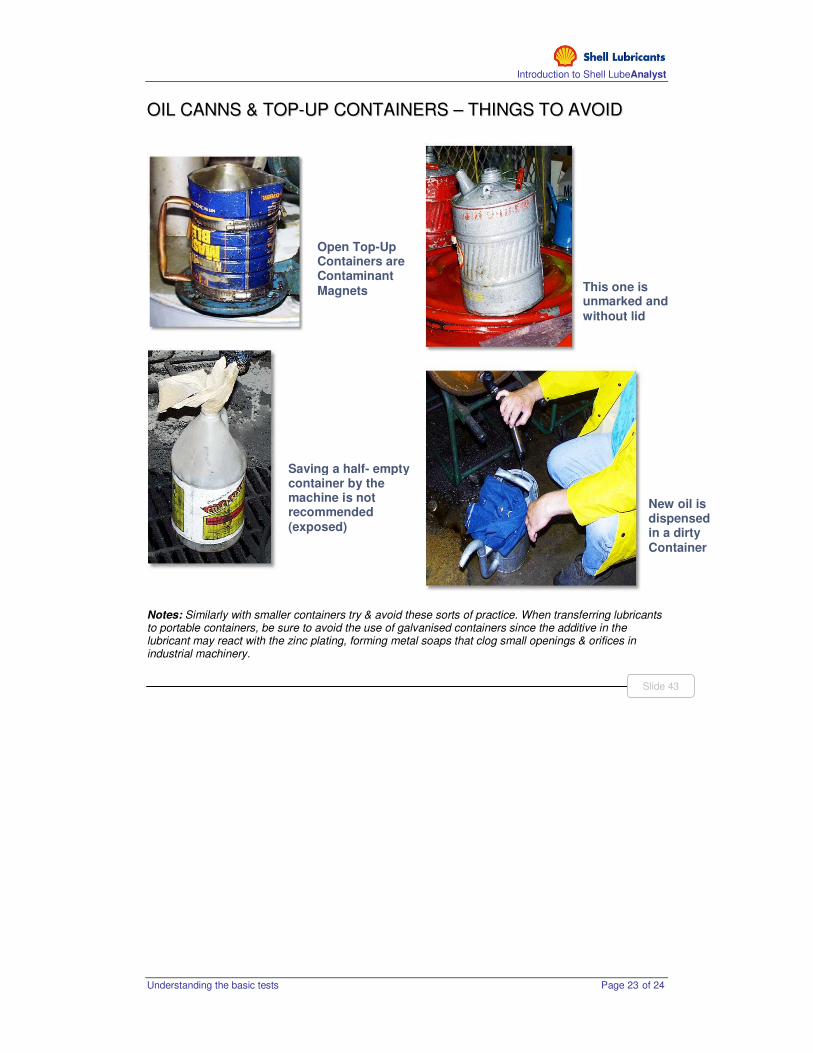
OOIILL CCAANNNNSS && TTOOPP--UUPP CCOONNTTAAIINNEERRSS –– TTHHIINNGGSS TTOO AAVVOOIIDD
Notes: Similarly with smaller containers try & avoid these sorts of practice. When transferring lubricants to portable containers, be sure to avoid the use of galvanised containers since the additive in the lubricant may react with the zinc plating, forming metal soaps that clog small openings & orifices in industrial machinery.
This one is unmarked and
without lid
New oil is dispensed in a dirty Container
Saving a half- empty container by the machine is not recommended (exposed)
Open Top-Up Containers are Contaminant
Magnets
Slide 43

Introduction to Shell LubeAnalyst
Understanding the basic tests Page 24 of 24
EENNSSUURREE GGOOOODD QQUUAALLIITTYY RREE--FFIILLLLIINNGG EEQQUUIIPPMMEENNTT IISS UUSSEEDD
Notes: Ensure proper containers are used when transporting lubricants from storage to machine. Oil safe in particular is a company, which produces containers for this purpose. They can be supplied branded in Shell colours. Here are just some of the customers’ comments about Oil safe products: “Easy to operate, less possibility of contamination, can be left out on the plant area." "We...have reduced lube related failures from 32/year to 8/year in just two years." "...I have reduced the oil refill time of gearboxes on packaging machinery from 1 hour to 10 minutes.“ If you would like to know more then contact the Oil safe website:http://www.oilsafe.com/
CCOONNTTAAMMIINNAATTIIOONN MMAANNAAGGEEMMEENNTT SSUUMMMMAARRYY Ensure
• All Containers & Storage Tanks are Clean & Inspected Regularly
• All tank hatch Covers are Closed & Tank Tops are Clean
• Drums are Stored Correctly (on their side, bungs a “quarter to three”)
• All Pumps have filters
• Dedicated Clean Containers are Used for Topping Up
• All Vents, Breather Caps are kept clean & unrestricted
• All Filters are Functioning Correctly & Replace if necessary
Notes: So lets summaries the main points. A quick tour around the oil storage & handling facilities will highlight a few contamination problems. This opens the door to suggesting improved storage & handling practices & thereby improving customer intimacy.
Transfer System
Pre-cleans the Oil
Combo Drum Dolly/Filter
Transfer Cart
High Quality Reusable
Containers (Shell Safe Containers)
Slide 44
Slide 45