understanding capacity-driven scale-out neural
TRANSCRIPT

Understanding Capacity-Driven Scale-Out NeuralRecommendation Inference
Michael Lui†∗, Yavuz Yetim∗, Ozgur Ozkan∗, Zhuoran Zhao∗, Shin-Yeh Tsai∗,Carole-Jean Wu∗, Mark Hempstead∗†
∗Facebook, †Drexel University, †Tufts University
Abstract—Deep learning recommendation models have grownto the terabyte scale. Traditional serving schemes–that load entiremodels to a single server–are unable to support this scale. Oneapproach to support this scale is with distributed serving, ordistributed inference, which divides the memory requirements ofa single large model across multiple servers.
This work is a first-step for the systems research communityto develop novel model-serving solutions, given the huge systemdesign space. Large-scale deep recommender systems are a novelworkload and vital to study, as they consume up to 79% ofall inference cycles in the data center. To that end, this workdescribes and characterizes scale-out deep learning recommen-dation inference using data-center serving infrastructure. Thiswork specifically explores latency-bounded inference systems,compared to the throughput-oriented training systems of otherrecent works. We find that the latency and compute overheadsof distributed inference are largely a result of a model’s staticembedding table distribution and sparsity of input inferencerequests. We further evaluate three embedding table mappingstrategies of three DLRM-like models and specify challengingdesign trade-offs in terms of end-to-end latency, compute over-head, and resource efficiency. Overall, we observe only a marginallatency overhead when the data-center scale recommendationmodels are served with the distributed inference manner–P99latency is increased by only 1% in the best case configuration.The latency overheads are largely a result of the commodityinfrastructure used and the sparsity of embedding tables. Evenmore encouragingly, we also show how distributed inferencecan account for efficiency improvements in data-center scalerecommendation serving.
Index Terms—recommendation, deep learning, distributed sys-tems
I. INTRODUCTION
Deep learning recommendation models play an importantrole in providing high-quality internet services, and has re-cently started receiving attention from the systems commu-nity [1]–[8]. Recommendation workloads have been shownto consume up to 79% of all AI inference cycles at Face-book’s data-centers [1] in 2019 and have been added to theMLPerf benchmarking effort [9]–[11]. The significance ofthis data-center workload warrants increased attention to itsperformance, throughput, and scalability. A major challengefacing this distinct class of deep learning workload is theirgrowing size. Figure 1 shows the rate of recommendationmodel growth at Facebook. Further models at the 1-10TBscale have also been deployed at Baidu and Google [12]–[14]. This growth is spurred by the desire for increasedaccuracy. Increasing model size, as number of parameters, iswell known to improve generalization and accuracy and is
Fig. 1: Historical model growth of significant production rec-ommendation model. Both number of features and embeddingshave grown an order of magnitude in only three years.
necessary to achieve optimal results given larger training datasets [15]–[20]. This is true across of a variety of deep learningapplications, including language models with large embeddingtables–similar to deep recommendation systems. This workdoes not explore the accuracy effects of increasing model sizeand instead focuses on system and performance implicationsof supporting the massive models used in production deeprecommendation systems.
Deep recommendation model size, and by proxy memorycapacity, is dominated by embedding tables, which representlearned sparse parameters. Each sparse input is hashed toone or more indices in its corresponding embedding table,where each index maps to a vector. Indexed embedding vectorsare then combined in a pooling operation, such as a vectorsummation. Increasing hash bucket size and the number ofembedding tables increase the information captured by theembeddings and thus is a straightforward method to improvethe accuracy of recommendation models, but is constrainedby the commensurate increase in memory footprint [21].Reducing hash bucket size will constrain model size, and somust be performed with care to maintain model accuracy.
As memory requirements for large recommendation modelssurpass the memory capacity of a single server, solutions are
arX
iv:2
011.
0208
4v2
[cs
.DC
] 1
1 N
ov 2
020
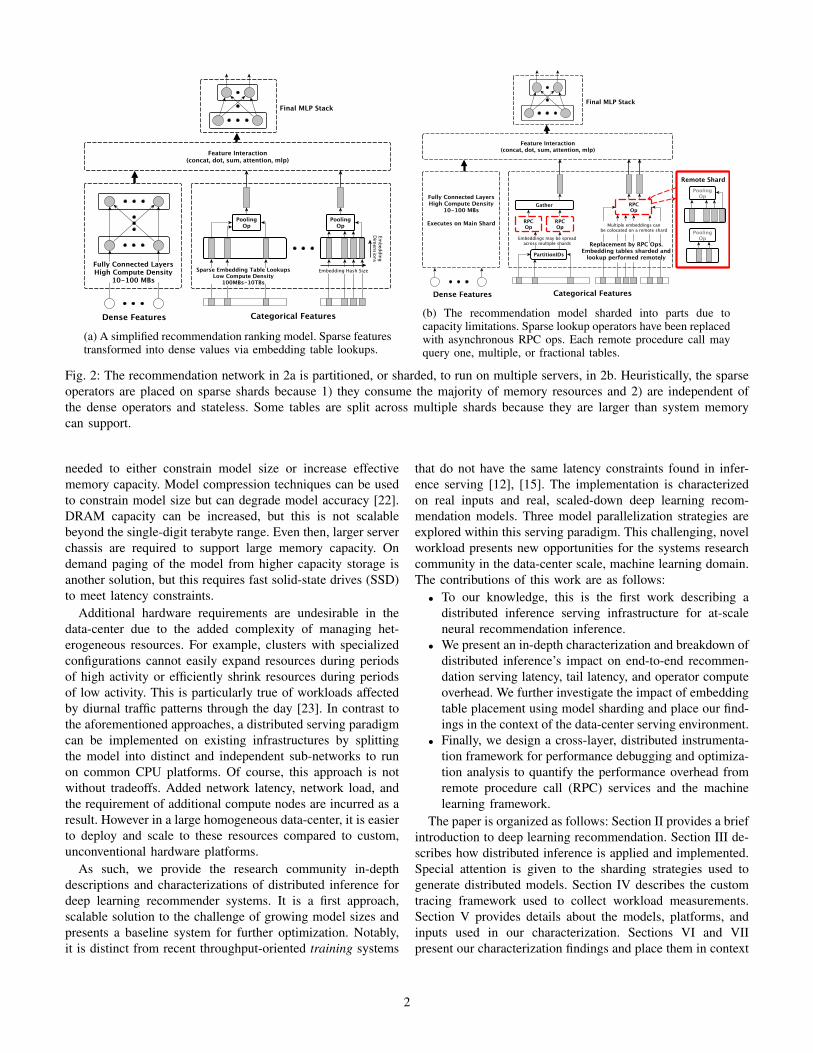
(a) A simplified recommendation ranking model. Sparse featurestransformed into dense values via embedding table lookups.
(b) The recommendation model sharded into parts due tocapacity limitations. Sparse lookup operators have been replacedwith asynchronous RPC ops. Each remote procedure call mayquery one, multiple, or fractional tables.
Fig. 2: The recommendation network in 2a is partitioned, or sharded, to run on multiple servers, in 2b. Heuristically, the sparseoperators are placed on sparse shards because 1) they consume the majority of memory resources and 2) are independent ofthe dense operators and stateless. Some tables are split across multiple shards because they are larger than system memorycan support.
needed to either constrain model size or increase effectivememory capacity. Model compression techniques can be usedto constrain model size but can degrade model accuracy [22].DRAM capacity can be increased, but this is not scalablebeyond the single-digit terabyte range. Even then, larger serverchassis are required to support large memory capacity. Ondemand paging of the model from higher capacity storage isanother solution, but this requires fast solid-state drives (SSD)to meet latency constraints.
Additional hardware requirements are undesirable in thedata-center due to the added complexity of managing het-erogeneous resources. For example, clusters with specializedconfigurations cannot easily expand resources during periodsof high activity or efficiently shrink resources during periodsof low activity. This is particularly true of workloads affectedby diurnal traffic patterns through the day [23]. In contrast tothe aforementioned approaches, a distributed serving paradigmcan be implemented on existing infrastructures by splittingthe model into distinct and independent sub-networks to runon common CPU platforms. Of course, this approach is notwithout tradeoffs. Added network latency, network load, andthe requirement of additional compute nodes are incurred as aresult. However in a large homogeneous data-center, it is easierto deploy and scale to these resources compared to custom,unconventional hardware platforms.
As such, we provide the research community in-depthdescriptions and characterizations of distributed inference fordeep learning recommender systems. It is a first approach,scalable solution to the challenge of growing model sizes andpresents a baseline system for further optimization. Notably,it is distinct from recent throughput-oriented training systems
that do not have the same latency constraints found in infer-ence serving [12], [15]. The implementation is characterizedon real inputs and real, scaled-down deep learning recom-mendation models. Three model parallelization strategies areexplored within this serving paradigm. This challenging, novelworkload presents new opportunities for the systems researchcommunity in the data-center scale, machine learning domain.The contributions of this work are as follows:
• To our knowledge, this is the first work describing adistributed inference serving infrastructure for at-scaleneural recommendation inference.
• We present an in-depth characterization and breakdown ofdistributed inference’s impact on end-to-end recommen-dation serving latency, tail latency, and operator computeoverhead. We further investigate the impact of embeddingtable placement using model sharding and place our find-ings in the context of the data-center serving environment.
• Finally, we design a cross-layer, distributed instrumenta-tion framework for performance debugging and optimiza-tion analysis to quantify the performance overhead fromremote procedure call (RPC) services and the machinelearning framework.
The paper is organized as follows: Section II provides a briefintroduction to deep learning recommendation. Section III de-scribes how distributed inference is applied and implemented.Special attention is given to the sharding strategies used togenerate distributed models. Section IV describes the customtracing framework used to collect workload measurements.Section V provides details about the models, platforms, andinputs used in our characterization. Sections VI and VIIpresent our characterization findings and place them in context
2
of a data-center serving environment. We identify guidancesand key takeaways for system designers. Section VIII providesa discussion of related works. Finally, Sections IX and X offersour concluding thoughts.
II. RECOMMENDATION INFERENCE AT-SCALE
Recommendation is the task of recommending, or suggest-ing, product or content items from a set that are of interest to auser. For example, a service may recommend new video clips,movies, or music based on a user’s explicitly liked contentand implicitly consumed content. Accuracy of the model isan abstract measure of a user’s interest and satisfaction inthe recommended results. Traditionally, neighborhood basedtechniques like matrix factorization have been used to goodeffect by providing recommendation based on similarity toother users or similarity of preferred items [24], [25]. However,more recent recommender systems have used deep neuralnetworks to combine a variety of dense and sparse inputfeatures into a more generalized predictive model [1], [3],[26]–[29]. An example of a dense feature is a user’s age; anexample of a sparse, or categorical, feature is web pages theuser likes, and the output of the model are rankings of thecandidate item inputs. Figure 2a shows a simplified overviewof this deep learning recommendation model architecture.
Today, recommendation inference is performed on the CPU,compared to the heterogeneous systems popular with otherdeep learning workloads [1], [2]. This is because, as com-pared to GPUs and other AI accelerators leveraged in otherinference tasks, the (1) sparsity in recommendation models,(2) evolving nature of recommendation algorithms, and (3)latency-bounded throughput constraints make it challengingfor recommendation inference be served on AI acceleratorsefficiently at-scale. Throughput, or queries per second (QPS),is a paramount target for inference, but just as importantare latency constraints. In order to provide a satisfactoryuser experience, recommendation results are expected withina timed window. This strict latency constraint defines theservice-level agreement (SLA) [1]. If SLA targets cannotbe satisfied, the inference request is dropped in favor of apotentially lower quality recommendation result, which couldworsen user experience. To maximize throughput within therespective SLA constraints, various techniques are applied,such as batch sizing and model hyperparameter tuning.
1) Sparse Feature Operation: Dense features are processedwith fully-connected (FC) layers, while sparse features, shownin Figure 2a, go through a transformation before further featureinteraction. The sparse inputs are transformed into a list ofaccess IDs, or hash indices, which index into an embeddingtable. The size of the embedding table–the number of bucketsand the vector dimension–is a tunable hyperparameter. Usu-ally, there is one embedding table per sparse feature, but it ispossible for features to share tables to save memory resources.For example, in a N × M table, with embedding dimensionM , a sparse feature input with K indices will produce Kembedding vectors of length M . A pooling operation, suchas summation or concatenation, will collapse the matrix along
the first dimension to produce a 1 ×M or 1 × (MK) resultfor use in the feature interaction. In the Caffe2 framework,used in this work, the embedding table operator is calledSparseLengthsSum, or SLS. It is typical to refer to the familyof related operators also as SLS. Because of the sheer numberof possible inputs, the embedding tables are constrained insize and hash collisions may occur. For example, one FP32embedding table with a dimension of 32, for 3-billion uniqueusers, will consume over 347GB. The table size would needto be reduced to tractably use on a single server.
2) Substantial Model Growth and Large Embedding Tables:To improve model accuracy and capitalize on the rich, latentinformation in sparse features, deep learning recommendationmodels have exploded in size as shown in Figure 1 andrecent works [12], [14]. The embedding tables dominate thesize of recommendation models and are responsible for thesignificant growth in model size. As rapid as this growthappears, it is still constrained by the commensurate increasein the memory capacity requirement. In an effort to furtherimprove the accuracy of recommendation models, the totalcapacity of embedding tables has grown larger than can besupported on a single server node, motivating the need fordistributed serving paradigms.
III. DISTRIBUTED INFERENCE
This is the first work to describe distributed, neural networkinference in detail for the unique goals and characteristics ofdeep recommendation systems. Because this initial implemen-tation targets deployability and scalability over performanceand efficiency, many optimization opportunities exist acrossthe systems design space, including algorithms, software, mi-croarchitecture, system configuration, and task mapping. Thus,in this section, we provide an overview of the general systemdesign and structure for the research community. At minimum,a distributed inference solution for neural recommendationmust enable (1) a greater variety and a larger number of sparsefeatures and (2) larger embedding tables, i.e. larger embeddingdimensions, less hash collisions, and/or less compression.
A. Distributed Model Execution
Consider that a deep learning model can be represented bya directed control and dataflow graph. A distributed modelsimply partitions a neural network into subnets, where eachsubnet can operate independently. Treating each subnet inde-pendently provides desirable flexibility in deployment, sinceall the infrastructure for serving the model already exists. Anexample of such partitioning is shown in Figure 2b. This istraditionally referred to as model or layer parallelism.
1) Model Sharding: We call each independent, partitionedsubnet a shard, and the process of creating shards, sharding.Sharding occurs both before and after training. Before training,parameter server shards are generated to hold model parame-ters for distributed training. After training, during model pub-lishing, parameters are resharded and serialized from param-eter servers to the respective inference shard based on a prior
3
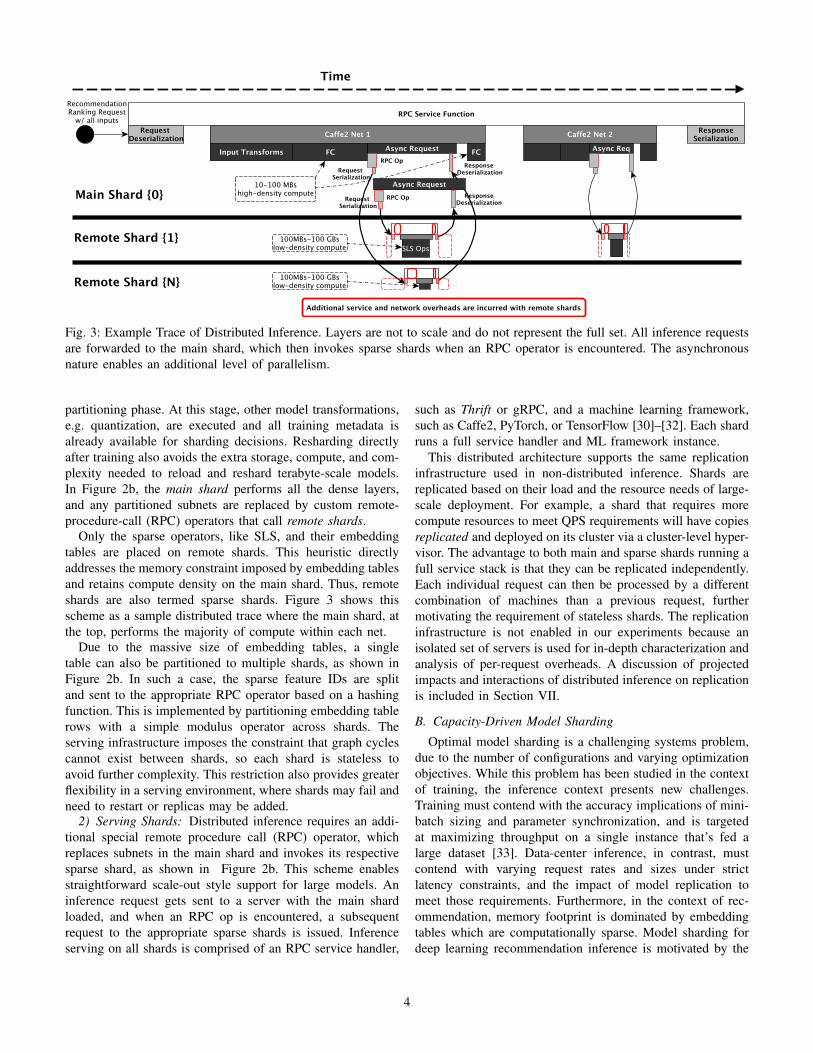
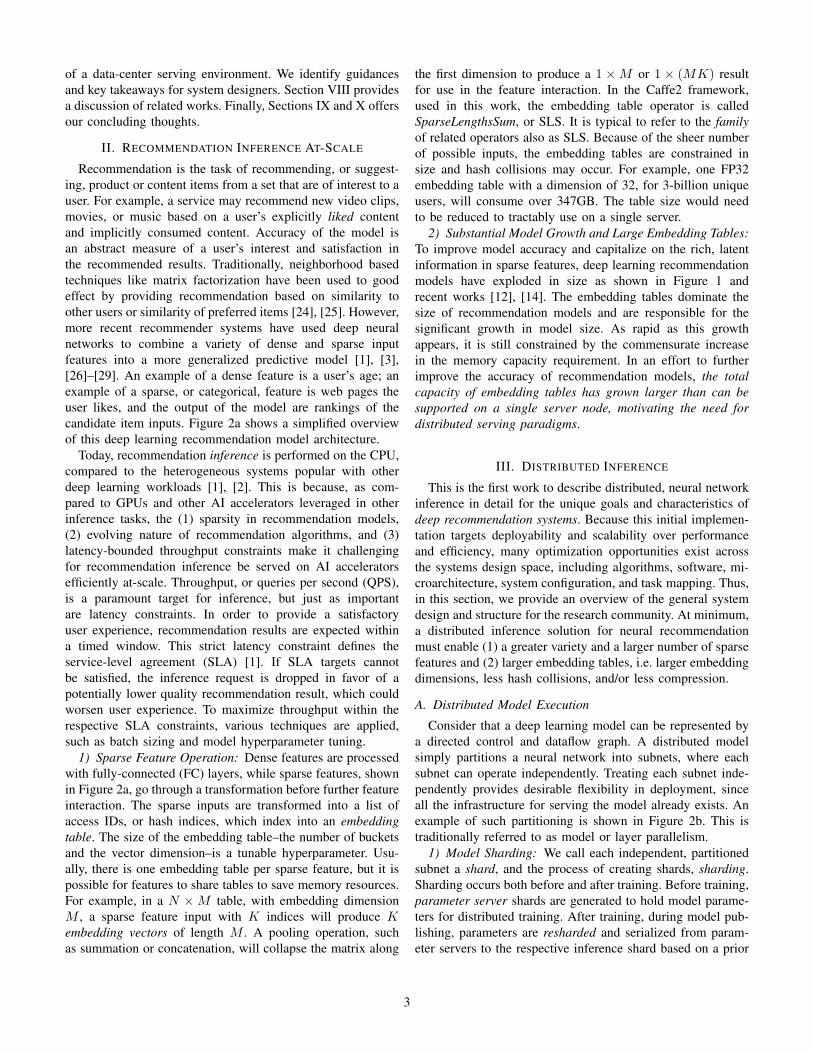
Fig. 3: Example Trace of Distributed Inference. Layers are not to scale and do not represent the full set. All inference requestsare forwarded to the main shard, which then invokes sparse shards when an RPC operator is encountered. The asynchronousnature enables an additional level of parallelism.
partitioning phase. At this stage, other model transformations,e.g. quantization, are executed and all training metadata isalready available for sharding decisions. Resharding directlyafter training also avoids the extra storage, compute, and com-plexity needed to reload and reshard terabyte-scale models.In Figure 2b, the main shard performs all the dense layers,and any partitioned subnets are replaced by custom remote-procedure-call (RPC) operators that call remote shards.
Only the sparse operators, like SLS, and their embeddingtables are placed on remote shards. This heuristic directlyaddresses the memory constraint imposed by embedding tablesand retains compute density on the main shard. Thus, remoteshards are also termed sparse shards. Figure 3 shows thisscheme as a sample distributed trace where the main shard, atthe top, performs the majority of compute within each net.
Due to the massive size of embedding tables, a singletable can also be partitioned to multiple shards, as shown inFigure 2b. In such a case, the sparse feature IDs are splitand sent to the appropriate RPC operator based on a hashingfunction. This is implemented by partitioning embedding tablerows with a simple modulus operator across shards. Theserving infrastructure imposes the constraint that graph cyclescannot exist between shards, so each shard is stateless toavoid further complexity. This restriction also provides greaterflexibility in a serving environment, where shards may fail andneed to restart or replicas may be added.
2) Serving Shards: Distributed inference requires an addi-tional special remote procedure call (RPC) operator, whichreplaces subnets in the main shard and invokes its respectivesparse shard, as shown in Figure 2b. This scheme enablesstraightforward scale-out style support for large models. Aninference request gets sent to a server with the main shardloaded, and when an RPC op is encountered, a subsequentrequest to the appropriate sparse shards is issued. Inferenceserving on all shards is comprised of an RPC service handler,
such as Thrift or gRPC, and a machine learning framework,such as Caffe2, PyTorch, or TensorFlow [30]–[32]. Each shardruns a full service handler and ML framework instance.
This distributed architecture supports the same replicationinfrastructure used in non-distributed inference. Shards arereplicated based on their load and the resource needs of large-scale deployment. For example, a shard that requires morecompute resources to meet QPS requirements will have copiesreplicated and deployed on its cluster via a cluster-level hyper-visor. The advantage to both main and sparse shards running afull service stack is that they can be replicated independently.Each individual request can then be processed by a differentcombination of machines than a previous request, furthermotivating the requirement of stateless shards. The replicationinfrastructure is not enabled in our experiments because anisolated set of servers is used for in-depth characterization andanalysis of per-request overheads. A discussion of projectedimpacts and interactions of distributed inference on replicationis included in Section VII.
B. Capacity-Driven Model Sharding
Optimal model sharding is a challenging systems problem,due to the number of configurations and varying optimizationobjectives. While this problem has been studied in the contextof training, the inference context presents new challenges.Training must contend with the accuracy implications of mini-batch sizing and parameter synchronization, and is targetedat maximizing throughput on a single instance that’s fed alarge dataset [33]. Data-center inference, in contrast, mustcontend with varying request rates and sizes under strictlatency constraints, and the impact of model replication tomeet those requirements. Furthermore, in the context of rec-ommendation, memory footprint is dominated by embeddingtables which are computationally sparse. Model sharding fordeep learning recommendation inference is motivated by the
4

desire to enable huge models, and thus we consider this newchallenge capacity-driven sharding.
Due to the number of shard configurations, an exhaustivesearch for an optimal sharding scheme is intractable. Instead,heuristics are used, which depend on the model architectureand include measurements or estimates of model capacity,compute resources, and communication costs. Naively, theheuristic should aim to minimize the number of shards due tothe additional compute and network resources consumed withmore shards. We study the resulting impact of this assumptionin Section VI. The heuristics are guided by the followingobservations:
1) Embedding tables used in sparse layers contribute to thevast majority (> 97%) of model size.
2) Sparse layers are memory and communication bound,while dense layers are compute bound.
3) Existing server infrastructure cannot support memory re-quirements of sparse layers but can support the computeand latency requirements of dense layers.
4) Deep recommendation model architectures, as in Fig-ure 2, can execute sparse operators in parallel, whichfeed successive dense layers.
Because the dense layers do not benefit from additionalcompute or parallelism provided by distributed inference, oursharding strategies are constrained to only move sparse layersto remote shards. This is specific to the architecture of deeprecommendation models. Figure 2 shows that, after embeddingtable lookup and pooling, all of the resulting embeddingvectors and dense features are combined in a series of featureinteraction layers. Placing the interaction layer on its ownshards results in an undesirable increase of communication andlessening of compute density. Placing this layer with existingsparse shards also increases communication and violates thestateless shard constraint. Alternate architectures may benefitfrom sharding interaction layers. Consider a model architecturethat has dedicated feature interaction layers for specific setsof embedding tables. Such an architecture could shard thosefeature interaction layers with their respective sparse layersand indeed see performance benefits. While an intriguingmodel architecture, we are limited to models that are currentlyavailable, thus this work chooses to focus on the more tradi-tional model in Figure 2a.
Thus, sharding the sparse layers (1) directly addressescapacity concerns of the largest parameters, (2) effectivelyparallelizes sparse operators which otherwise execute sequen-tially, and (3) enables better resource provisioning by isolatingthe communication- and compute-bound portions of inference.Note that inference is not traditionally operator-parallel be-cause operators do not typically produce enough work tooffset scheduling overheads. Extra computing cores are insteadutilized by increasing batch-level parallelism.
Three sharding strategies, using the above heuristic, areevaluated in this work (Table I). These strategies address thenew and distinct challenges of huge deep learning recom-mendation models: the varied number and size of embeddingtables, non-uniformity of sparsity, and the challenge of the
TABLE I: Sharding Strategy Summary
Sharding Strategy NotesSingular Distributed inference disabled.
Entire model loaded on one server.1 Shard - All Tables Only one sparse shard with all em-
bedding tables.{2, 4, 8} Shards Capacity-balanced Table placement ensures similar to-
tal embedding table size per shard{2, 4, 8} Shards Load-balanced Table placement ensures similar
pooling work per shard{2, 4, 8} Shards Net-specific bin-packing (NSBP)
Tables are grouped by ML net, andpacked into shards until a size limitis reached. Tables larger than thislimit are effectively given an entireshard.
real-time serving environment. Two trivial cases of (1) non-distributed inference, or singular, and (2) a single shard withall embedding tables are also presented in Table I.
1) Capacity-balanced: An intuitive strategy is to spreadembedding tables evenly across many shards. Capacity-balanced sharding ensures that each sparse shard has the samememory requirements. This serves to minimize the number ofshards, with the goal to achieve the least compute resourceoverhead for a singly served model.
2) Load-balanced: Each sparse feature is represented asa multi-hot encoded vector, which transforms to a multi-index lookup into the embedding table and a final poolingoperation. Because the expected number of lookups per tableis dependent on specific feature and how often it appearsin request inputs, capacity-balanced sharding may result inimbalanced shards that perform signficantly different amountsof work. Additionally, the number of lookups is proportionalto the network bandwidth used to send table indices. Thisaggregate imbalance can cause certain shards to become acritical path bottleneck, degrading latency compared to theload-balanced sharding configuration.
The distributed trace shown in Figure 3 demonstrates howone sparse shard may become on the critical path, albeit unpre-dictable variance in network latency must also be considered.Remote shard 1 and 2 are queried asynchronously, in parallel.Because remote shard 1 performs significantly more work,more latency overhead is incurred. To reduce the likelihood ofone shard consistently increasing latency, the load-balancingstrategy places embedding tables based on their pooling factor,or expected number of lookups. The pooling factor is estimatedby sampling 1000 requests from the evaluation dataset andobserving the number of lookups per table.
3) Net-specific bin-packing: Recommendation models fre-quently separate the user features and content/product featuresinto distinct nets to more effectively batch user-content pairstogether [1]. In the models chosen for this work, output of theuser net is fed into the content/product net, so they must beexecuted sequentially. An example of this is shown in Figure 3,where Net 2 is dependent on Net 1. Separate RPC operatorswill be called when each net is executed to access theirrespective embedding tables. If tables are not grouped by net,
5

DRM1 DRM2 DRM30.0
0.2
0.4
0.6
0.8
1.0N
orm
aliz
ed O
pera
tor
Com
pute Hash
FillScale/ClipActivationsSparseFeatureTransformsMemoryTransformationsDense
Fig. 4: Operator compute attributions for DRM1, DRM2, andDRM3. The models are architecturally similar, but have dif-ferent characteristics. DRM1 and DRM2 differ sparse featuresand average request size. DRM3 is more sparse than DRM1and DRM2
the same shard may be accessed multiple times per batch, foreach net. This is undesirable because 1) in Figure 3, three RPCoperators are invoked, compared to two (one RPC per shard),and 2) as servers are replicated in a data center environmentto handle increased requests, tables for both nets will beduplicated regardless of which net receives more inputs.
This is particularly undesirable if, in Figure 3, serverreplication of remote shard 1 is triggered by high computecharacteristic of Net 1’s pooling. All of Net 2’s embeddingtables, which may be 10s of GBs sharded, will consumeadditional, under-utilized memory resources. To account forthis and target more efficient resource usage, a net-specific bin-packing (NSBP) strategy is evaluated, which first groups tablesby net, and then packs them into bins based on a given sizeconstraint. To reduce data-center resources incurred duringsharding, each bin starts out as the existing sparse parameterservers used during training. If a parameter server’s bin isalready full, it is considered a full shard. This reduces networkbandwidth and compute orchestration required for sharding.
C. Distributed Inference Implementation
We present an in-depth description of the customized open-source frameworks used in this work. This provides the readerwith a concrete implementation to frame our results andprovides guidance for implementation with other frameworks.For this work, distributed inference is built on top of a highlycustomized variant of Thrift and Caffe2, however the method-ology is generalizable to any RPC or ML framework [30],[31]. While PyTorch has absorbed and succeeded Caffe2 as thestate-of-the-art moving forward, the Caffe2 infrastructure usedin this work is shared between both frameworks. Thrift servesranking requests by loading models and appropriately splittingreceived requests to inference batches to the appropriate net. Amodified version of Caffe2 is used that includes RPC operatorsthat issues Thrift requests. The intermediate requests to sparseshards are routed via a universal service discovery proto-col. All inter-server communication occurs through standardTCP/IP stack over Ethernet. The model is transformed fordistributed inference after training. A custom partitioning tool
D
D
D
Fig. 5: Embedding Table Size Distribution. DRM3’s size isdominated by a single large table, compared to the heaviertails exhibited by DRM1 and DRM2.
employs a user-supplied configuration to group embeddingtables and their operators, insert RPC operators, generate newCaffe2 nets, and then serialize the model to storage.
IV. CROSS-LAYER ML OPERATOR- ANDCOMMUNICATION-AWARE CHARACTERIZATION
The performance of distributed inference is determined bychoices at multiple layers of the system, in particular, the data-center service level (scheduling, discovery, and networking),the machine learning framework-level, and then the machinelearning operators themselves. Measuring a workload acrossthese layers is important for understanding overheads, attribut-ing costs, targeting components for optimization, and makinghigh-level system design decisions. Because no profiling toolsexist to perform such a cross-layer characterization, we builta custom cross-layer distributed tracing framework for mea-suring distributed inference workloads.
A. Workload Capture via Distributed Tracing
Distributed tracing is a proven technique for debuggingand performance investigations across inter-dependent services[34], [35]. We leverage this technique to investigate theperformance impact of the distributed inference infrastructure.Custom instrumentation was added at multiple layers in theproduction service stack to provide a complete view of costsfor request/response serialization, RPC service boilerplatesetup, and model execution for each request.
Thrift and Caffe2 both provide instrumentation hooks tocapture salient points in execution, leaving the service handlerto be more intrusively modified, albeit still lightweight. Sourceinstrumentation was chosen over other binary instrumentationapproaches because it’s lighter weight and can interface withThrift’s RequestContext abstraction to propagate contextualdata for distributed tracing. At each trace point, metadataspecific to the layer and a wall-clock timestamp are loggedto a lock-free buffer and then asynchronously flushed to disk.Wall-clock time is desirable because its ordering helps achievea useful trace visualization. Furthermore, most spans are small
6
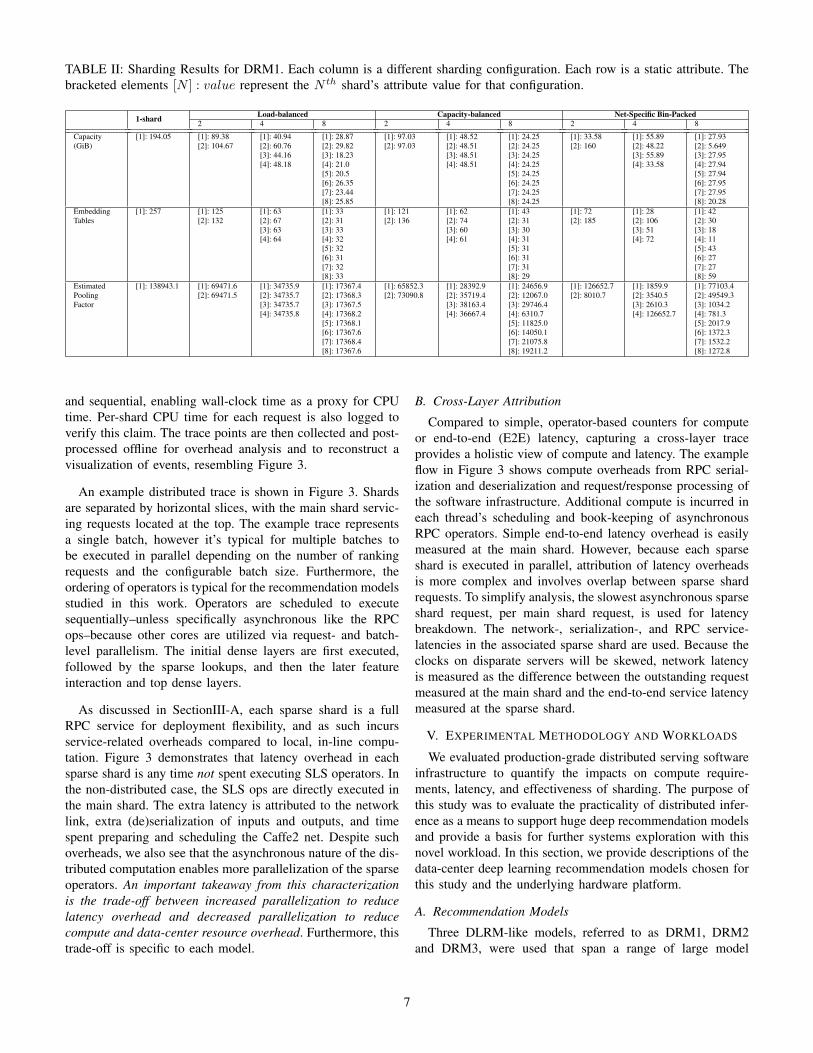
TABLE II: Sharding Results for DRM1. Each column is a different sharding configuration. Each row is a static attribute. Thebracketed elements [N ] : value represent the N th shard’s attribute value for that configuration.
1-shard Load-balanced Capacity-balanced Net-Specific Bin-Packed2 4 8 2 4 8 2 4 8
Capacity(GiB)
[1]: 194.05 [1]: 89.38[2]: 104.67
[1]: 40.94[2]: 60.76[3]: 44.16[4]: 48.18
[1]: 28.87[2]: 29.82[3]: 18.23[4]: 21.0[5]: 20.5[6]: 26.35[7]: 23.44[8]: 25.85
[1]: 97.03[2]: 97.03
[1]: 48.52[2]: 48.51[3]: 48.51[4]: 48.51
[1]: 24.25[2]: 24.25[3]: 24.25[4]: 24.25[5]: 24.25[6]: 24.25[7]: 24.25[8]: 24.25
[1]: 33.58[2]: 160
[1]: 55.89[2]: 48.22[3]: 55.89[4]: 33.58
[1]: 27.93[2]: 5.649[3]: 27.95[4]: 27.94[5]: 27.94[6]: 27.95[7]: 27.95[8]: 20.28
EmbeddingTables
[1]: 257 [1]: 125[2]: 132
[1]: 63[2]: 67[3]: 63[4]: 64
[1]: 33[2]: 31[3]: 33[4]: 32[5]: 32[6]: 31[7]: 32[8]: 33
[1]: 121[2]: 136
[1]: 62[2]: 74[3]: 60[4]: 61
[1]: 43[2]: 31[3]: 30[4]: 31[5]: 31[6]: 31[7]: 31[8]: 29
[1]: 72[2]: 185
[1]: 28[2]: 106[3]: 51[4]: 72
[1]: 42[2]: 30[3]: 18[4]: 11[5]: 43[6]: 27[7]: 27[8]: 59
EstimatedPoolingFactor
[1]: 138943.1 [1]: 69471.6[2]: 69471.5
[1]: 34735.9[2]: 34735.7[3]: 34735.7[4]: 34735.8
[1]: 17367.4[2]: 17368.3[3]: 17367.5[4]: 17368.2[5]: 17368.1[6]: 17367.6[7]: 17368.4[8]: 17367.6
[1]: 65852.3[2]: 73090.8
[1]: 28392.9[2]: 35719.4[3]: 38163.4[4]: 36667.4
[1]: 24656.9[2]: 12067.0[3]: 29746.4[4]: 6310.7[5]: 11825.0[6]: 14050.1[7]: 21075.8[8]: 19211.2
[1]: 126652.7[2]: 8010.7
[1]: 1859.9[2]: 3540.5[3]: 2610.3[4]: 126652.7
[1]: 77103.4[2]: 49549.3[3]: 1034.2[4]: 781.3[5]: 2017.9[6]: 1372.3[7]: 1532.2[8]: 1272.8
and sequential, enabling wall-clock time as a proxy for CPUtime. Per-shard CPU time for each request is also logged toverify this claim. The trace points are then collected and post-processed offline for overhead analysis and to reconstruct avisualization of events, resembling Figure 3.
An example distributed trace is shown in Figure 3. Shardsare separated by horizontal slices, with the main shard servic-ing requests located at the top. The example trace representsa single batch, however it’s typical for multiple batches tobe executed in parallel depending on the number of rankingrequests and the configurable batch size. Furthermore, theordering of operators is typical for the recommendation modelsstudied in this work. Operators are scheduled to executesequentially–unless specifically asynchronous like the RPCops–because other cores are utilized via request- and batch-level parallelism. The initial dense layers are first executed,followed by the sparse lookups, and then the later featureinteraction and top dense layers.
As discussed in SectionIII-A, each sparse shard is a fullRPC service for deployment flexibility, and as such incursservice-related overheads compared to local, in-line compu-tation. Figure 3 demonstrates that latency overhead in eachsparse shard is any time not spent executing SLS operators. Inthe non-distributed case, the SLS ops are directly executed inthe main shard. The extra latency is attributed to the networklink, extra (de)serialization of inputs and outputs, and timespent preparing and scheduling the Caffe2 net. Despite suchoverheads, we also see that the asynchronous nature of the dis-tributed computation enables more parallelization of the sparseoperators. An important takeaway from this characterizationis the trade-off between increased parallelization to reducelatency overhead and decreased parallelization to reducecompute and data-center resource overhead. Furthermore, thistrade-off is specific to each model.
B. Cross-Layer Attribution
Compared to simple, operator-based counters for computeor end-to-end (E2E) latency, capturing a cross-layer traceprovides a holistic view of compute and latency. The exampleflow in Figure 3 shows compute overheads from RPC serial-ization and deserialization and request/response processing ofthe software infrastructure. Additional compute is incurred ineach thread’s scheduling and book-keeping of asynchronousRPC operators. Simple end-to-end latency overhead is easilymeasured at the main shard. However, because each sparseshard is executed in parallel, attribution of latency overheadsis more complex and involves overlap between sparse shardrequests. To simplify analysis, the slowest asynchronous sparseshard request, per main shard request, is used for latencybreakdown. The network-, serialization-, and RPC service-latencies in the associated sparse shard are used. Because theclocks on disparate servers will be skewed, network latencyis measured as the difference between the outstanding requestmeasured at the main shard and the end-to-end service latencymeasured at the sparse shard.
V. EXPERIMENTAL METHODOLOGY AND WORKLOADS
We evaluated production-grade distributed serving softwareinfrastructure to quantify the impacts on compute require-ments, latency, and effectiveness of sharding. The purpose ofthis study was to evaluate the practicality of distributed infer-ence as a means to support huge deep recommendation modelsand provide a basis for further systems exploration with thisnovel workload. In this section, we provide descriptions of thedata-center deep learning recommendation models chosen forthis study and the underlying hardware platform.
A. Recommendation Models
Three DLRM-like models, referred to as DRM1, DRM2and DRM3, were used that span a range of large model
7
attributes, such as varying input features and embedding tablecharacteristics. The D-prefix is to contrast the distributedmodels to the specific models discussed in recent deep learningrecommendation works [1]–[3]. The DRM* models are asubset of many possible, evolving models and chosen as earlycandidates for distributed inference given their sparse featurecharacteristics. The goal of studying these models is to presenta basis for evaluating overheads of distributed inference viaour cross-layer distributed trace analysis, and they should notbe interpreted as canonical benchmark models such as thoseincluded in the MLPerf benchmark suite [9].
Figure 4, Figure 5, and Table II demonstrate the vari-ety within large neural recommendation models. DRM1 andDRM2 have two nets, each having their own respectivesparse features, while DRM3 has a single net. Because real,sampled requests were used for each model, the inferencerequest size and corresponding compute and latency alsovaried between models. All parameters were uncompressedas single-precision floating point. Section VII-D discussesthe impact of compression. Per-operator group attributionsfor each model are shown in Figure 4, as a simple meanaverage across all sampled requests for the non-distributedmodel. DRM1 and DRM2 are the most similar architectures,reflected in Figure 4. Compared to DRM3, DRM1 and DRM2have a more complex structure evidenced by additional tensortransform costs. More relevant to this work, sparse operatorsconsume a much larger portion of all operators comparedto DRM3. Specifically, sparse operators contribute to 9.7%,9.6%, and 3.1% of all operator time, in DRM1, DRM2, andDRM3 respectively. Despite their low proportional compute,the sparse operators account for >97% of model capacityin DRM1 and DRM2, and >99.9% of capacity for DRM3.Embedding tables larger than a given threshold were scaleddown by a proportional factor to fit the entire model on asingle 256GB server. This provided a straight comparison ofcompute and latency overheads across all sharding strategieslisted in Table I, including singular. The original data-centerscale models are many times larger.
The distribution of embedding tables sizes within eachmodel is shown in Figure 5. DRM1 was sized to 200GB with257 embedding tables and the largest table is at 3.6GB. DRM2was proportionately sized to 138GB with 133 embeddingtables and the largest table at 6.7GB. Lastly, DRM3 was sizedto 200GB with 39 embedding tables and the largest table at178.8GB. DRM1 and DRM2 demonstrate a long tail of embed-ding table size compared to DRM3, explaining the additionalsparse operator cost shown in Figure 4. Comparatively, DRM3is dominated by a single large table. The embedding tables arerepresentative versions of the tables discussed in prior deeplearning recommendation work [1], [3], [9].
For DRM1 and DRM2, ten sharding configurations wereevaluated. Sharding strategy results for DRM1 are describedin Table II. For the load-balanced configuration, per-shardcapacities varied up to 50% compared to capacity-balancedwhere each shard is the same total capacity. For the capacity-balanced configuration, per-shard estimated load varied up to
371%, between shards 4 and 3 with eight shards, compared toload-balanced where each shard had the same total poolingfactor. Lastly, the net-specific bin-packing (NSBP) strategyrestricted each shard’s tables to a single net. This is mostnoticeable at the 2-shard configuration, where each net isplaced on its own shard. Shard 2 consumes 4.75× as muchmemory capacity as Shard 1, yet is estimated to perform just6.3% of Shard 1’s compute work.
DRM3 is only sharded with NSBP, and not capacity-balanced or load-balanced strategy, due to existing technicalchallenges of sharding huge tables. Because it is dominated bya single large table, for each additional shard the largest tableis further split, while the smaller tables remained grouped asone shard. The dominating table has a pooling factor of 1, thusonly one of the shards spanning the table will be accessed.For example, given four sparse shards, the largest table ispartitioned into three shards and the remaining tables groupedtogether into one shard. Each inference, only two shard wouldbe accessed: one for the sharded large table and one for thesmaller tables.
B. Test Platform
Two classes of servers, representative of the data-centerenvironment, were used for characterization. SC-Large isrepresentative of a typical large server in a data-center andhas 256GB of DRAM and two 20-core Intel CPUs. SC-Smallis representative of a typical, more efficient web server andhas 64GB of DRAM and two, slower clocked, 18-core IntelCPUs, and less network bandwidth than SC-Large. Becauseof the limited DRAM available on SC-Small, only a subset ofconfigurations could be tested on this platform. The majorityof results discussed in Section VI were collected on SC-Large platforms for an apples-to-apples comparison with thenon-distributed models. A discussion on the impact of serverplatform follows in Section VII.
All inference experiments were run on CPU platforms, asdiscussed in Section II. The reserved, bare-metal servers werelocated in the same data centers as production recommendationranking and utilized the same intranet. Their locations withinthe data center was representative of a typical inference servingtier. Shards were assigned to unique servers and not co-located.Shard-to-server mappings were randomized across repeatedtrials. Recommendation ranking requests were sampled fromproduction servers and replayed on the test infrastructure;a database of de-identified requests were sampled evenlyacross a five-day time period in order to capture any diurnalbehavior within the requests. The production replayer thenpre-processed and cached the requests before sending them tothe inference servers using the same networking infrastructureused in online production ranking.
For the majority of experimental runs, batch sizes forinference were set to production defaults, where each batchrepresents a number of recommendation items to rank and isexecuted in parallel. In Section VI requests were sent serially,to isolate inherent overheads. In Section VII-A requests were
8
0.5 0.9 0.99Quantile
0.0000.1250.2500.3750.500
Cha
nge
vs S
ingu
lar 1 shard
0.5 0.9 0.99Quantile
load-bal2 Shards
0.5 0.9 0.99Quantile
load-bal4 Shards
0.5 0.9 0.99Quantile
load-bal8 Shards
0.5 0.9 0.99Quantile
cap-bal2 Shards
0.5 0.9 0.99Quantile
cap-bal4 Shards
0.5 0.9 0.99Quantile
cap-bal8 Shards
0.5 0.9 0.99Quantile
NSBP2 Shards
0.5 0.9 0.99Quantile
NSBP4 Shards
0.5 0.9 0.99Quantile
NSBP8 Shards
OverheadLatencyCompute
(a) DRM1
0.5 0.9 0.99Quantile
0.0000.1250.2500.3750.500
Cha
nge
vs S
ingu
lar 1 shard
0.5 0.9 0.99Quantile
load-bal2 Shards
0.5 0.9 0.99Quantile
load-bal4 Shards
0.5 0.9 0.99Quantile
load-bal8 Shards
0.5 0.9 0.99Quantile
cap-bal2 Shards
0.5 0.9 0.99Quantile
cap-bal4 Shards
0.5 0.9 0.99Quantile
cap-bal8 Shards
0.5 0.9 0.99Quantile
NSBP2 Shards
0.5 0.9 0.99Quantile
NSBP4 Shards
0.5 0.9 0.99Quantile
NSBP8 Shards
OverheadLatencyCompute
(b) DRM2
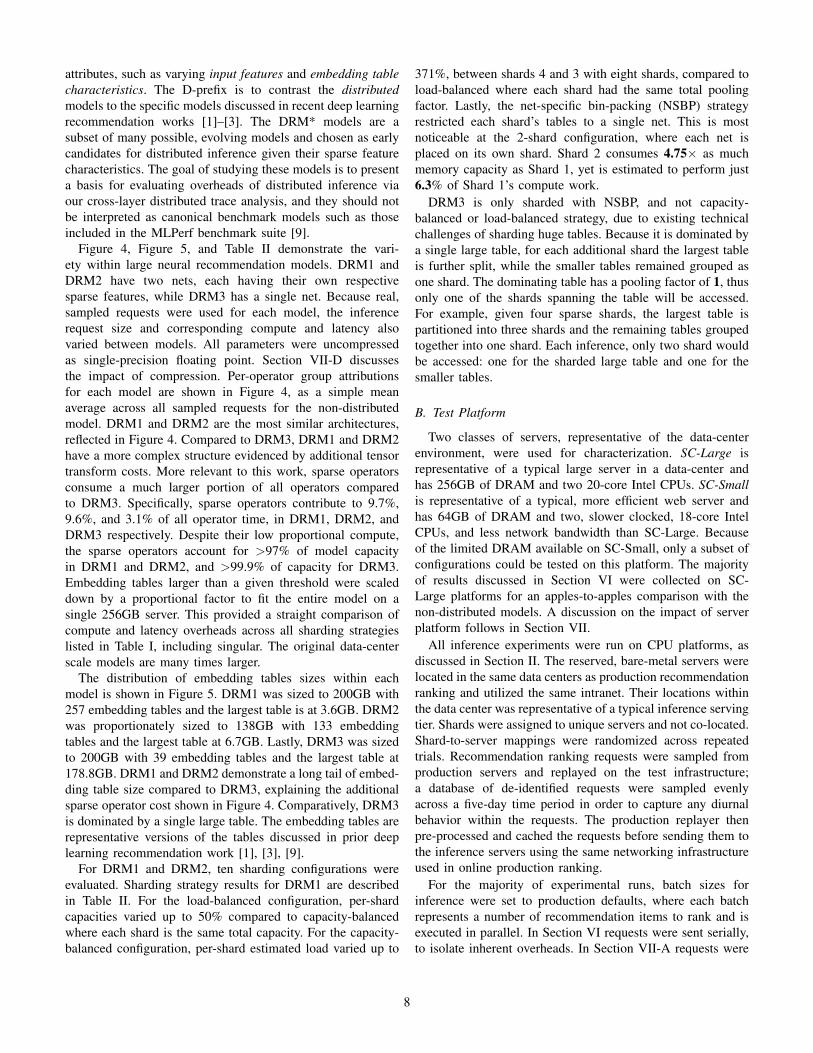
Fig. 6: P50, P90, and P99 latency and compute overheads compared to the singular model. Latency and compute have aninverse relationship due to additional asynchronous scheduling overheads. Increasing shards effectively increases parallelization.
0.5 0.9 0.99Quantile
0.0000.1250.2500.3750.500
Cha
nge
vs S
ingu
lar 1 shard
0.5 0.9 0.99Quantile
NSBP4 Shards
0.5 0.9 0.99Quantile
NSBP8 Shards
OverheadLatencyCompute
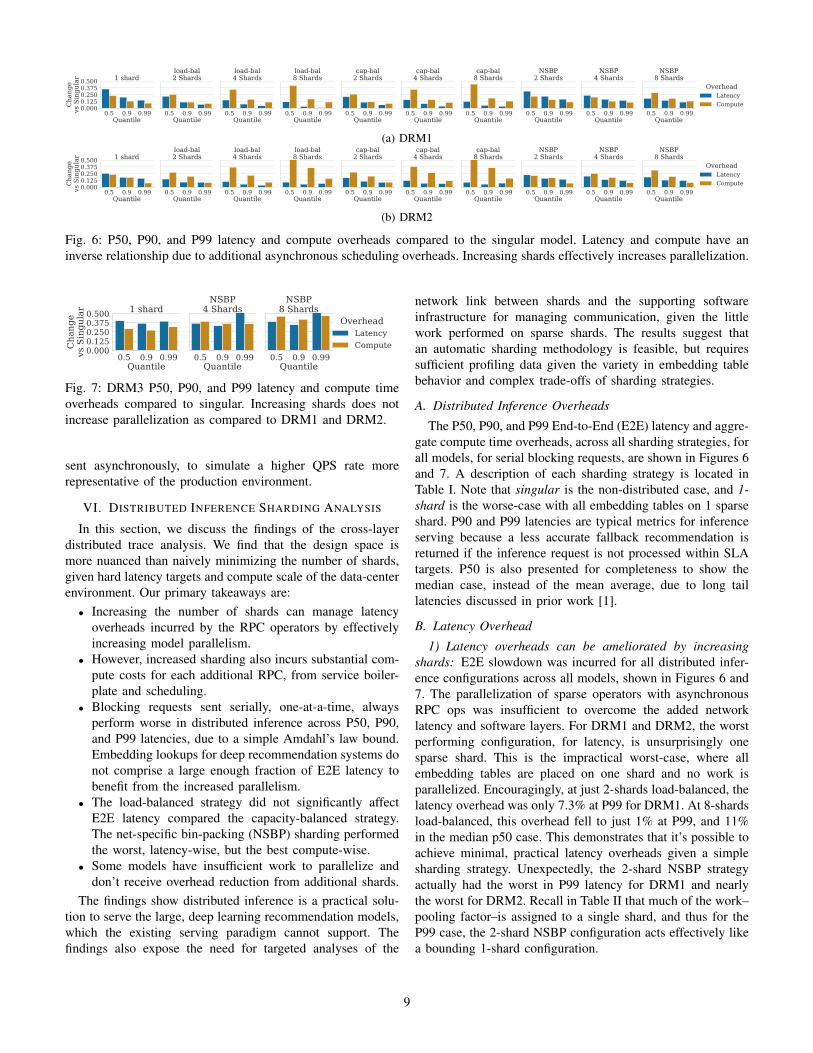
Fig. 7: DRM3 P50, P90, and P99 latency and compute timeoverheads compared to singular. Increasing shards does notincrease parallelization as compared to DRM1 and DRM2.
sent asynchronously, to simulate a higher QPS rate morerepresentative of the production environment.
VI. DISTRIBUTED INFERENCE SHARDING ANALYSIS
In this section, we discuss the findings of the cross-layerdistributed trace analysis. We find that the design space ismore nuanced than naively minimizing the number of shards,given hard latency targets and compute scale of the data-centerenvironment. Our primary takeaways are:
• Increasing the number of shards can manage latencyoverheads incurred by the RPC operators by effectivelyincreasing model parallelism.
• However, increased sharding also incurs substantial com-pute costs for each additional RPC, from service boiler-plate and scheduling.
• Blocking requests sent serially, one-at-a-time, alwaysperform worse in distributed inference across P50, P90,and P99 latencies, due to a simple Amdahl’s law bound.Embedding lookups for deep recommendation systems donot comprise a large enough fraction of E2E latency tobenefit from the increased parallelism.
• The load-balanced strategy did not significantly affectE2E latency compared the capacity-balanced strategy.The net-specific bin-packing (NSBP) sharding performedthe worst, latency-wise, but the best compute-wise.
• Some models have insufficient work to parallelize anddon’t receive overhead reduction from additional shards.
The findings show distributed inference is a practical solu-tion to serve the large, deep learning recommendation models,which the existing serving paradigm cannot support. Thefindings also expose the need for targeted analyses of the
network link between shards and the supporting softwareinfrastructure for managing communication, given the littlework performed on sparse shards. The results suggest thatan automatic sharding methodology is feasible, but requiressufficient profiling data given the variety in embedding tablebehavior and complex trade-offs of sharding strategies.
A. Distributed Inference Overheads
The P50, P90, and P99 End-to-End (E2E) latency and aggre-gate compute time overheads, across all sharding strategies, forall models, for serial blocking requests, are shown in Figures 6and 7. A description of each sharding strategy is located inTable I. Note that singular is the non-distributed case, and 1-shard is the worse-case with all embedding tables on 1 sparseshard. P90 and P99 latencies are typical metrics for inferenceserving because a less accurate fallback recommendation isreturned if the inference request is not processed within SLAtargets. P50 is also presented for completeness to show themedian case, instead of the mean average, due to long taillatencies discussed in prior work [1].
B. Latency Overhead
1) Latency overheads can be ameliorated by increasingshards: E2E slowdown was incurred for all distributed infer-ence configurations across all models, shown in Figures 6 and7. The parallelization of sparse operators with asynchronousRPC ops was insufficient to overcome the added networklatency and software layers. For DRM1 and DRM2, the worstperforming configuration, for latency, is unsurprisingly onesparse shard. This is the impractical worst-case, where allembedding tables are placed on one shard and no work isparallelized. Encouragingly, at just 2-shards load-balanced, thelatency overhead was only 7.3% at P99 for DRM1. At 8-shardsload-balanced, this overhead fell to just 1% at P99, and 11%in the median p50 case. This demonstrates that it’s possible toachieve minimal, practical latency overheads given a simplesharding strategy. Unexpectedly, the 2-shard NSBP strategyactually had the worst in P99 latency for DRM1 and nearlythe worst for DRM2. Recall in Table II that much of the work–pooling factor–is assigned to a single shard, and thus for theP99 case, the 2-shard NSBP configuration acts effectively likea bounding 1-shard configuration.
9
singu
lar
1 sha
rd
load-b
al 2 s
hard
s
load-b
al 4 s
hard
s
load-b
al 8 s
hard
s
cap-b
al 2 s
hard
s
cap-b
al 4 s
hard
s
cap-b
al 8 s
hard
s
NSBP 2 sh
ards
NSBP 4 sh
ards
NSBP 8 sh
ards
0.0
0.2
0.4
0.6
0.8
1.0N
orm
aliz
ed E
2E L
aten
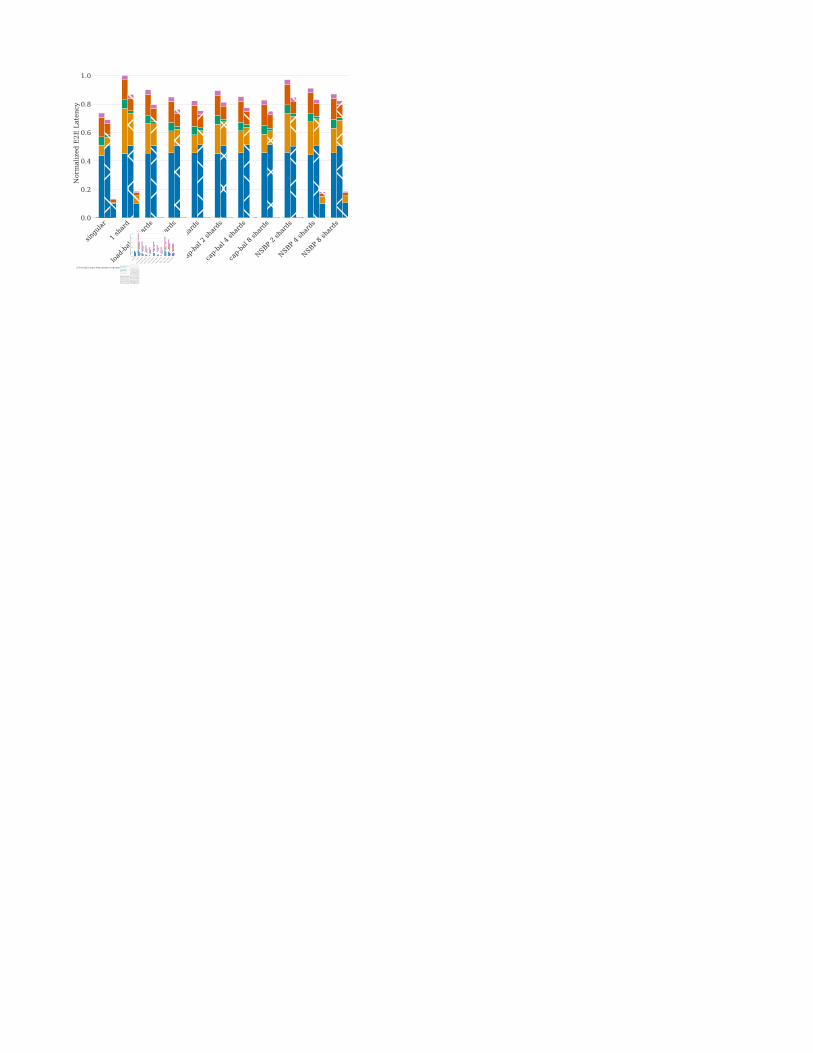
cyDense OpsEmbeddedPortionRPC Ser/DeRPC ServiceFunctionCaffe2 NetOverhead
DRM1DRM2DRM3
(a) Total E2E Latency Stack, measured at the main shard.
singu
lar
1 sha
rd
load-b
al 2 s
hard
s
load-b
al 4 s
hard
s
load-b
al 8 s
hard
s
cap-b
al 2 s
hard
s
cap-b
al 4 s
hard
s
cap-b
al 8 s
hard
s
NSBP 2 sh
ards
NSBP 4 sh
ards
NSBP 8 sh
ards
0.0
0.2
0.4
0.6
0.8
1.0
Nor
mal
ized
Em
bedd
ed L
ooku
p La
tenc
y
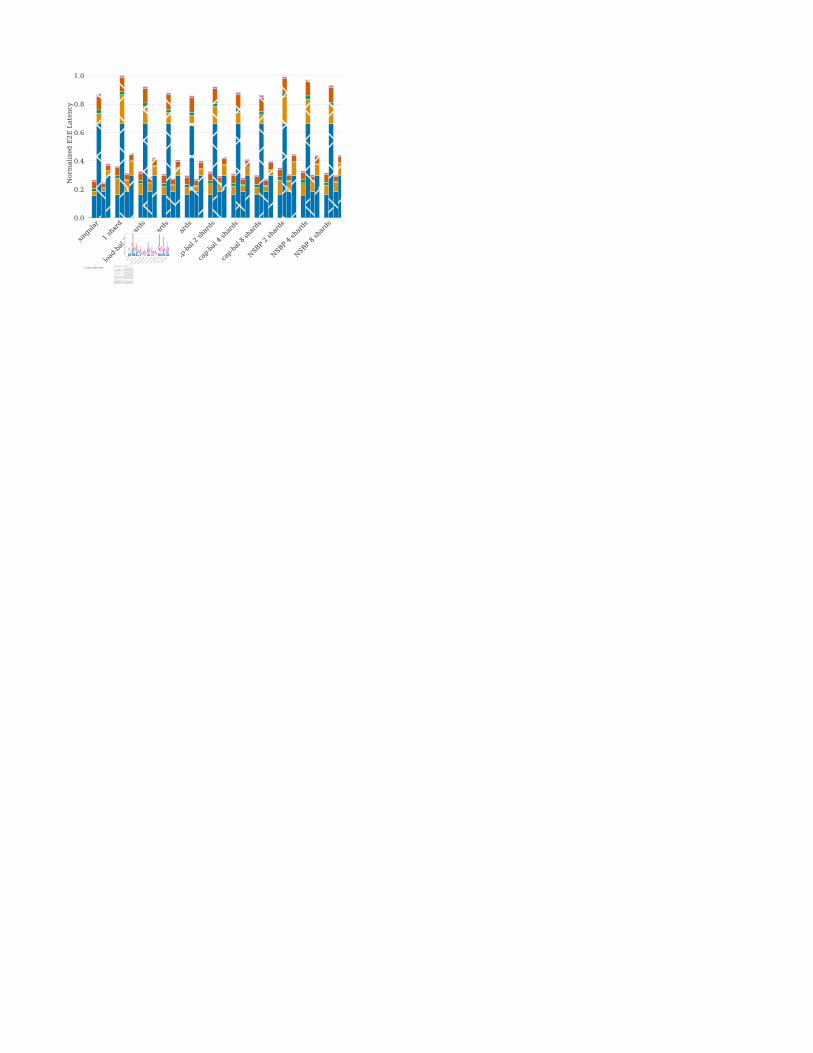
Caffe2 Sparse OpsRPC Ser/DeRPC ServiceFunctionCaffe2 NetOverheadNetwork Latency
DRM1DRM2DRM3
(b) Embedded Portion Latency Stack, for the bounding shard.
Fig. 8: P50 Latency Attribution by Sharding Strategy. Latencies are normalized to the highest latency configuration to contrastmodels. Increasing parallelism with more shards reduces aggregate latency overheads, but constant network latency eventuallydominates. Not all strategies parallelize to the same degree.
singu
lar
1 sha
rd
load-b
al 2 s
hard
s
load-b
al 4 s
hard
s
load-b
al 8 s
hard
s
cap-b
al 2 s
hard
s
cap-b
al 4 s
hard
s
cap-b
al 8 s
hard
s
NSBP 2 sh
ards
NSBP 4 sh
ards
NSBP 8 sh
ards
0.0
0.2
0.4
0.6
0.8
1.0
Nor
mal
ized
CPU
Tim
e (A
ll Sh
ards
)
Caffe2 OpsRPC Ser/DeFbThrift/Caffe2Service Overhead
DRM1DRM2DRM3
Fig. 9: P50 Aggregate CPU Time Stack by sharding config.CPU Time is normalized to highest configuration.
2) Constant overheads eventually dominate: As the numberof shards increase, the work per-shard is reduced and networklatency and additional software layers dominate, shown in Fig-ure 8. Network latency is measured as the difference betweenoutstanding request time at the main shard, and the total E2Etime at the sparse shard. This time includes in-kernel packetprocessing and forwarding time. For all distributed inferenceconfigurations, network latency was greater than operatorlatency. Distributed inference will always hurt the latencyof these models. Put another way, if the sparse operatorsproduced enough work on average, then the model would beamenable to distributed inference. And given sufficient sparseoperator work, latency could be improved. This provides amulti-discipline opportunity for the system architect, modelarchitect, and feature engineer to collaborate on balancingmodel resource consumption, performance, and accuracy.
3) Sharding impact depends on model architecture: ForDRM3, the number of shards didn’t have a strong impact.DRM3 is dominated by a single large table, shown in Figure 5,which is split amongst the shards. Even at 8-shards, only 2
shards are accessed per inference request–one shard containingthe smaller tables and one shard containing the entry for thesharded, largest table, emphasized in Figure 11a.
4) In-depth latency layer attribution: Figure 8 shows abreakdown of P50, or median, latency across the layers traced.Figure 8a shows that only the embedded portion of theworkload is significantly affected across sharding strategiesas expected, because this is the portion of the workload beingoffloaded to sparse shards. The Dense Ops are all ML opera-tors that are not embedding table lookup and pooling ops; theEmbedded Portion is all embedding table lookup and poolingoperators. For singular this is the ops themselves, whereasfor the distributed inference configurations, this is time spentwaiting for a response from a sparse shard in Figure 8a.RPC Serde refers to all serialization and deserialization requesttimes, while RPC Service is any other time strictly not spentin a Caffe2 net or serialization/deserialization. Finally, NetOverhead refers to any time in the net not spent executingoperators, e.g. scheduling of asynchronous ops. For distributedinference configurations, the effects on embedded portionlatency represent the overhead shown in Figures 6 and 7.In the DRM1 singular configuration, the embedded portionrepresents only ∼ 10% of latency, while for a single-shard, it’s32%. The best distributed inference case, for 8-shards load-balanced, it represents 15.6% of total latency. Comparatively,the embedded portion of DRM3 does not significantly changeas shards are increased because only the large dominating tableis further partitioned. Changes to latency and compute forDRM3 are attributed to cache effects and network variabilityof communicating with more server nodes. Figure 8b furtherattributes latency within that embedded portion–each bar stackrepresents the embedded portions in Figure 8a. For P99, theembedded portion is less significant, and the dense operatorsand RPC deserialization on the main shard begin to dominatedue to very large inference request sizes. This is why the P99latency overheads are more favorable than P50.
10

1 2 3 4 5 6 7 8Shard ID
0.00
0.25
0.50
0.75
1.00N
orm
aliz
edLa
tenc
yNet 1Net 2
(a) Load-balanced
1 2 3 4 5 6 7 8Shard ID
0.00
0.25
0.50
0.75
1.00
Nor
mal
ized
Late
ncy
Net 1Net 2
(b) Net-specific Bin-packing
Fig. 10: DRM1 per-shard operator latencies, by net w/ 8 sparse shards. Only co-locating tables within the same net has a largeeffect on latency.
1 2 3 4 5 6 7 8Shard ID
0.00
0.25
0.50
0.75
1.00
Nor
mal
ized
Late
ncy
NSBP 8shards
(a) DRM3 Net-specific Bin-packing (NSBP). Shard 1 contains alltables except the largest, which is split across Shards 2-8. Each DRM3inference makes one access to one of Shards 2-8.
singu
lar
1 sha
rd
NSBP 4 sh
ards
NSBP 8 sh
ards
0.0
0.2
0.4
0.6
0.8
1.0
Nor
mal
ized
Em
bedd
ed L
ooku
p La
tenc
y
Caffe2 Sparse OpsRPC Ser/DeRPC ServiceFunctionCaffe2 NetOverheadNetwork Latency
DRM3
(b) Embedded Portion Latency Stack.
Fig. 11: DRM3 per-shard operator latencies and embedded portion breakdown. DRM3’s capacity is dominated by a singlelarge embedding table. Increasing shards has no practical effect on latency.
1 2 3 4 5 6 7 8Shard ID
0.00
0.25
0.50
0.75
1.00
Nor
mal
ized
Late
ncy
load-bal 8shardscap-bal 8shardsNSBP 8shards
Fig. 12: DRM1 per-shard operator latencies, by sharding strat-egy w/ 8 sparse shards. Load-balanced does not substantiallyaffect latency compared to capacity-balanced.
C. Compute Overhead
Understanding compute overheads is vital to minimize addi-tional resource requirements at the data-center scale. Shardingstrategy is one method for the system designer to balancelatency constraints, discussed in the previous section, andcompute overheads which impact resource requirements.
1) Increased compute is a trade-off for reduced latencyoverheads: The high compute overhead is the trade-off ofa flexible, easily deployed system. As stated in the previ-ous section, increasing sparse shards can reduce the latencyoverhead of distributed inference. However, compute overheadis also increased, because each shard invokes a full Thriftservice. Figure 9 shows that for all models, distributed in-
ference always increases compute due to the additional RPCops required. More importantly, Figure 9 demonstrates thatcompute overhead is proportional to the number of RPCops. The NSBP strategy observes the least compute overheadbecause it executes the least RPC ops. Recall that the NSBPstrategy restricts each shard to not mix embedding tables fromdifferent nets, and as such each shard is invoked only once perinference. Given multiple nets, each net is less parallelized.Comparatively, the other sharding strategies, which may par-allelize each net more, will invoke more RPC ops and lead toincreased overall compute overhead.
2) Compute overhead impacts data-center resources: In-creased compute overhead is especially problematic when itis incurred on the main shard, because it increases compute-driven replication and resource requirements to handle thesame QPS. This occurs when the compute needed to issueRPC ops, on the main shard, dominates the compute saved byoffloading the embedded portion. This is also more likely tooccur with model architectures with many, large embeddingtables and low pooling factors. The results provide an impetusto investigate these inflection points, which should be inputsto future automatic sharding methodologies and are dependenton model attributes and software infrastructure. This is furtherdiscussed in Section VII.
11
singu
lar
1 sha
rd
load-b
al 2 s
hard
s
load-b
al 4 s
hard
s
load-b
al 8 s
hard
s
cap-b
al 2 s
hard
s
cap-b
al 4 s
hard
s
cap-b
al 8 s
hard
s
NSBP 2 sh
ards
NSBP 4 sh
ards
NSBP 8 sh
ards
0.0
0.2
0.4
0.6
0.8
1.0N
orm
aliz
ed E
2E L
aten
cy
Dense OpsEmbeddedPortionRPC Ser/DeRPC ServiceFunctionCaffe2 NetOverhead
DRM1DRM1-single batchDRM2DRM2-single batch
(a) E2E Latency Stack.
singu
lar
1 sha
rd
load-b
al 2 s
hard
s
load-b
al 4 s
hard
s
load-b
al 8 s
hard
s
cap-b
al 2 s
hard
s
cap-b
al 4 s
hard
s
cap-b
al 8 s
hard
s
NSBP 2 sh
ards
NSBP 4 sh
ards
NSBP 8 sh
ards
0.0
0.2
0.4
0.6
0.8
1.0
Nor
mal
ized
Em
bedd
ed L
ooku
p La
tenc
y
Caffe2 Sparse OpsRPC Ser/DeRPC ServiceFunctionCaffe2 NetOverheadNetwork Latency
DRM1DRM1-single batchDRM2DRM2-single batch
(b) Embedded Portion Latency Stack, for the bounding shard.
Fig. 13: DRM1 & DRM2 P50 Latency Stacks for default- and single-batch configurations across sharding strategy, normalizedto the highest configuration to contrast models. Distributed inference can improve latency given enough work to parallelize inthe sparse operators. DRM1’s larger requests result in more batches compared to DRM2.
singu
lar
1 sha
rd
load-b
al 2 s
hard
s
load-b
al 4 s
hard
s
load-b
al 8 s
hard
s
cap-b
al 2 s
hard
s
cap-b
al 4 s
hard
s
cap-b
al 8 s
hard
s
NSBP 2 sh
ards
NSBP 4 sh
ards
NSBP 8 sh
ards
0.0
0.2
0.4
0.6
0.8
1.0
Nor
mal
ized
CPU
Tim
e (A
ll Sh
ards
)
Caffe2 OpsRPC Ser/DeFbThrift/Caffe2Service Overhead
DRM1DRM1-single batchDRM2DRM2-single batch
Fig. 14: DRM1 & DRM2 P50 CPU Time Stack for default-and single-batch configurations. DRM1 has more batches thanDRM2, resulting in higher compute overheads.
D. Sharding Strategy Effects
A trade-off between increased latency or increased compute,as a result of shard count, was established in the previoussection. Shard count is a straightforward knob for system de-signers to balance compute overheads with latency constraints.The sharding strategy, discussed in this section, providesanother knob for designers, but the effects on latency andcompute are more nuanced.
1) NSBP is the most scalable strategy: Latency over-heads did not show a strong difference between the load-balanced and capacity-balanced configurations. However, thenet-specific bin-packed strategy deviated by being less im-pacted by additional sharding. The most important takeawayfrom this observation is that NSBP is the most scalablestrategy evaluated, because it invokes less RPC ops.
NSBP presented the most unbalanced per-shard latencies.Recall in this strategy, embedding tables are first groupedby net, and then assigned to shards based on both net andsize. Tables from separate nets are never assigned to the same
shard. Figure 10 more clearly demonstrates this via the per-netoperator latencies for the load-balanced and NSBP strategies.Shards 1 and 2 comprise the first net which performs the mostwork but has the smallest table sizes, shown in Figure 10band Table II. For NSBP, this had a negative effect on latencysince less work is parallelized, however compute overhead isless impacted precisely due to less parallelization, ergo lessscheduling and service overheads. Note that Net1 and Net2are executed sequentially, so their combined effect on E2Elatency is additive. The benefit of the NSBP strategy, in termsof resource utilization, are further discussed in Section VII.
2) Little overhead difference exists between load-balancedand capacity-balanced strategies: Figure 12 shows the per-shard operator latencies for all 8-shard configurations withDRM1, across all requests; DRM2 shows similar trends andis omitted for brevity. Recall from Section III-B that load-balanced was expected to have lower latency overheads, byremoving any one shard from being the bounding criticalpath. However, per-shard operator latencies for both strategiesare insignificant compared to the E2E latency. Furthermore,there isn’t a significant difference in latencies between load-and capacity-balanced strategies, as was suggested by theestimated pooling factors in Table II. The pooling factors aretoo small at this scale to show appreciable effect. For DRM1and DRM2, between load-balanced and capacity-balancedshard strategies, the largest impact comes from increasing thenumber of shards.
E. Model Variety
Model attributes also affect distributed inference perfor-mance. The number of nets, number of embedding tables,size distribution, and respective pooling factor are the modelattributes most relevant attributes, and are described in Sec-tion V-A for the evaluated models. DRM3 has less totalcompute attributed to sparse operators and is dominated bya single large embedding table, compared to the long tailembedding tables in DRM1 and DRM2. Latency for DRM1
12

and DRM2 benefit from increased sharding, but DRM3 seesno such benefit shown in Figures 7 and 8.
1) Effects of sharding depend on model architecture: Fig-ure 11 singles out the per-shard operator latency and embeddportion breakdown of DRM3 to show additional sharding doesnot improve latency. The primary causes are twofold. (1) Ad-ditional sharding only partitions the one capacity-dominatingembedding table, which does not parallelize any significantcompute. Figure 11a shows shard 1 performing the majorityof compute as it contains all embedding tables except for thelargest, which is partitioned across the rest of the shards. (2)Even if the smaller tables were partitioned, the relatively lowcompute would still preclude practical latency improvementsbecause network latency dominates E2E latency overheadstoo greatly. Thus we conclude models with a long tail ofembedding tables and higher pooling factors, like DRM1 andDRM2, are required to benefit from sharding.
F. Batching Effects
Batch-sizing for inference splits a request into parallel tasksand is a careful balance between throughput and latency in or-der to meet SLA and QPS targets. To show its interaction withdistributed inference, we set the batch size artificially large toperform one-batch per-request. Smaller batch sizes increasetask-level parallelism per-request and can reduce latency, butconsequently increase task-level overheads and reduce data-parallelism, which can reduce throughput. In contrast, largerbatches increase sparse operator work and benefit from theparallelization of distributed inference. Batch-sizing for deeprecommendation inference is an on-going research topic [2].
1) Distributed inference improves latency with sufficientlylarge batch sizes: Figure 13 shows distributed inference canimprove latency in the DRM1 single-batch case, when using8-shards capacity- or load-balanced configurations. This is be-cause the sparse operators perform enough work to sufficientlybenefit from parallelization, emphasized in Figure 13b. DRM2shows similar trends, but is not as strongly impacted becauserequests are smaller. In this context, larger batches can beviewed as a proxy for embedding tables with larger poolingfactor, with the salient characteristic being additional lookupindices sent over RPC and increasing sparse operator work andnetwork requirements. DRM3 isn’t shown because its requestsare typically small enough for only one batch per request, withdefault batch sizes.
2) Batch sizing can manage distributed inference computeoverheads: Figure 14 emphasizes the multiplicative computeoverhead–each additional batch issues corresponding RPC opswhich increases compute requirements. For example, becauseNSBP for DRM1 issues one RPC per shard, its computeoverhead increases slower than load-balanced as shards areadded with the default-batch size. With one-batch per-request,the marginal increase in compute from sharding is less severe.Thus, it’s essential to consider batch-size when exploringdistributed inference compute overheads.
1 2 3 4 5 6 7 8Shard ID
0.000.250.500.751.00
Nor
mal
ized
Late
ncy
SC-SmallSC-Large
Fig. 15: DRM1 per-shard operator latencies, by server plat-form. No significant latency overheads are incurred despiteplatform differences.
VII. IMPACTS IN DATA-CENTER ENVIRONMENTS
In this section, we discuss the implications of distributedinference, for deep recommender systems, in the data-center.Analyses of latency and compute overheads are important tounderstanding the impact of distributed inference on SLA tar-gets and additional compute resources. However, the analysesin Section VI focused on a simplified scenario to attributeper-request overheads where (1) each request was processedserially and (2) the servers had the same SC-Large hardwareconfigurations which are over-provisioned. To model a morerepresentative serving environment, we performed two addi-tional experiments on DRM1, which is the most computeintensive model. First, we sent requests at a higher rate of25 QPS across all sharding strategies and with the samehardware configuration of SC-Large. Second, we re-ran theload-balanced configuration across SC-Small platforms moretypical for web serving to compare to SC-Large, with requestsagain sent serially. We place our results in the context ofa serving environment where model instances are replicatedto handle real-time traffic. Lastly, we include a discussionof existing compression techniques currently implementedin large, data-center scale deep recommender systems. Ourprimary observations are:
• Requests sent at a higher QPS, indicative of a data-centerenvironment, perform better in distributed inference atP99 due to improved resource availability.
• Between SC-Large and SC-Small, there is not a sig-nificant difference in sparse shard per-request latency,providing an opportunity for better efficiency via sparseshard serving with lower power consumption.
• Shard replication provides opportunity for improved serv-ing efficiency by allocating resources for the dense andsparse portions of model independently.
• Compression is complementary to distributed inferenceand cannot address model scalability issues itself.
A. High QPS Environment
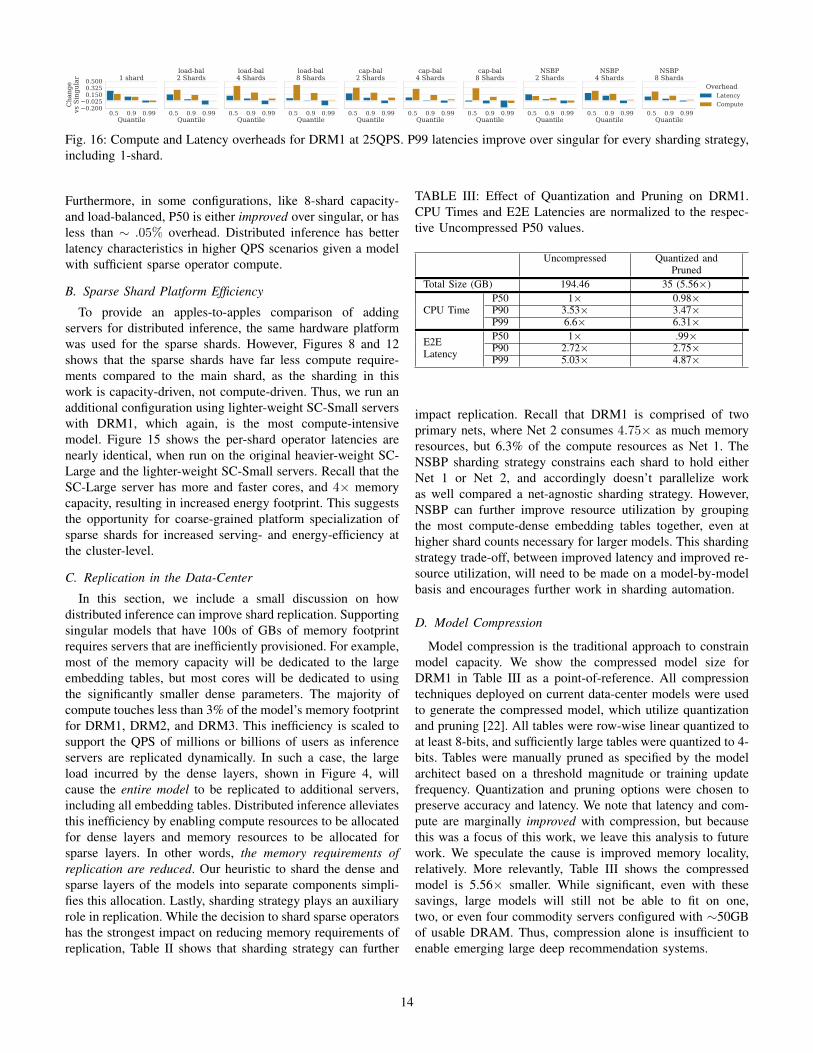
The request replayer was configured to send requests at25QPS to the main server for DRM1, the most compute-heavyof all evaluated models. The overhead graph for each DRM1configuration, compared to singular, is shown in Figure 16.All overheads in the 25QPS experiment are less than the sameconfiguration when sent serially, which was shown in Figure 6.Across nearly all configurations, the P99 latency is improvedcompared to the singular configuration, shown in Figure 6.
13
0.5 0.9 0.99Quantile
0.2000.0250.1500.3250.500
Cha
nge
vs S
ingu
lar 1 shard
0.5 0.9 0.99Quantile
load-bal2 Shards
0.5 0.9 0.99Quantile
load-bal4 Shards
0.5 0.9 0.99Quantile
load-bal8 Shards
0.5 0.9 0.99Quantile
cap-bal2 Shards
0.5 0.9 0.99Quantile
cap-bal4 Shards
0.5 0.9 0.99Quantile
cap-bal8 Shards
0.5 0.9 0.99Quantile
NSBP2 Shards
0.5 0.9 0.99Quantile
NSBP4 Shards
0.5 0.9 0.99Quantile
NSBP8 Shards
OverheadLatencyCompute
Fig. 16: Compute and Latency overheads for DRM1 at 25QPS. P99 latencies improve over singular for every sharding strategy,including 1-shard.
Furthermore, in some configurations, like 8-shard capacity-and load-balanced, P50 is either improved over singular, or hasless than ∼ .05% overhead. Distributed inference has betterlatency characteristics in higher QPS scenarios given a modelwith sufficient sparse operator compute.
B. Sparse Shard Platform Efficiency
To provide an apples-to-apples comparison of addingservers for distributed inference, the same hardware platformwas used for the sparse shards. However, Figures 8 and 12shows that the sparse shards have far less compute require-ments compared to the main shard, as the sharding in thiswork is capacity-driven, not compute-driven. Thus, we run anadditional configuration using lighter-weight SC-Small serverswith DRM1, which again, is the most compute-intensivemodel. Figure 15 shows the per-shard operator latencies arenearly identical, when run on the original heavier-weight SC-Large and the lighter-weight SC-Small servers. Recall that theSC-Large server has more and faster cores, and 4× memorycapacity, resulting in increased energy footprint. This suggeststhe opportunity for coarse-grained platform specialization ofsparse shards for increased serving- and energy-efficiency atthe cluster-level.
C. Replication in the Data-Center
In this section, we include a small discussion on howdistributed inference can improve shard replication. Supportingsingular models that have 100s of GBs of memory footprintrequires servers that are inefficiently provisioned. For example,most of the memory capacity will be dedicated to the largeembedding tables, but most cores will be dedicated to usingthe significantly smaller dense parameters. The majority ofcompute touches less than 3% of the model’s memory footprintfor DRM1, DRM2, and DRM3. This inefficiency is scaled tosupport the QPS of millions or billions of users as inferenceservers are replicated dynamically. In such a case, the largeload incurred by the dense layers, shown in Figure 4, willcause the entire model to be replicated to additional servers,including all embedding tables. Distributed inference alleviatesthis inefficiency by enabling compute resources to be allocatedfor dense layers and memory resources to be allocated forsparse layers. In other words, the memory requirements ofreplication are reduced. Our heuristic to shard the dense andsparse layers of the models into separate components simpli-fies this allocation. Lastly, sharding strategy plays an auxiliaryrole in replication. While the decision to shard sparse operatorshas the strongest impact on reducing memory requirements ofreplication, Table II shows that sharding strategy can further
TABLE III: Effect of Quantization and Pruning on DRM1.CPU Times and E2E Latencies are normalized to the respec-tive Uncompressed P50 values.
Uncompressed Quantized andPruned
Total Size (GB) 194.46 35 (5.56×)
CPU TimeP50 1× 0.98×P90 3.53× 3.47×P99 6.6× 6.31×
E2ELatency
P50 1× .99×P90 2.72× 2.75×P99 5.03× 4.87×
impact replication. Recall that DRM1 is comprised of twoprimary nets, where Net 2 consumes 4.75× as much memoryresources, but 6.3% of the compute resources as Net 1. TheNSBP sharding strategy constrains each shard to hold eitherNet 1 or Net 2, and accordingly doesn’t parallelize workas well compared a net-agnostic sharding strategy. However,NSBP can further improve resource utilization by groupingthe most compute-dense embedding tables together, even athigher shard counts necessary for larger models. This shardingstrategy trade-off, between improved latency and improved re-source utilization, will need to be made on a model-by-modelbasis and encourages further work in sharding automation.
D. Model Compression
Model compression is the traditional approach to constrainmodel capacity. We show the compressed model size forDRM1 in Table III as a point-of-reference. All compressiontechniques deployed on current data-center models were usedto generate the compressed model, which utilize quantizationand pruning [22]. All tables were row-wise linear quantized toat least 8-bits, and sufficiently large tables were quantized to 4-bits. Tables were manually pruned as specified by the modelarchitect based on a threshold magnitude or training updatefrequency. Quantization and pruning options were chosen topreserve accuracy and latency. We note that latency and com-pute are marginally improved with compression, but becausethis was a focus of this work, we leave this analysis to futurework. We speculate the cause is improved memory locality,relatively. More relevantly, Table III shows the compressedmodel is 5.56× smaller. While significant, even with thesesavings, large models will still not be able to fit on one,two, or even four commodity servers configured with ∼50GBof usable DRAM. Thus, compression alone is insufficient toenable emerging large deep recommendation systems.
14

VIII. RELATED WORK
Recent work on inference for deep learning recommenda-tion models focused on smaller models that fit on a singlemachine [1]–[6]. Characteristics like compute density, embed-ding table memory access patterns, and batch-size effects wereexplored in the context of CPU-architecture and accelerators.However, these inference-focused works did not explore thetrends of scaling models to the terabyte-scale.
Separate works have described the challenges of scalingtraining for large models, but they either don’t addressdeep recommendation systems or don’t explore the inferenceserving environment that is the focus of our paper [12],[14], [15], [36]–[38]. Google’s data-center scale ML serv-ing infrastructure, TensorFlow-Serving, encompasses modelloading, versioning, RPC APIs, and inference batching [39].Support for data-parallel distributed inference exists as partof distributed TensorFlow [32], but the distributed schemesdescribed in this work are not currently supported out-of-the-box. The remote operators used are similar to the onesdescribed in this work, but a distributed serving paradigm hasonly briefly been mentioned in publication [14]. More recentworks have discussed infrastructure for model-parallelism inTensorFlow–and in turn huge models–but have focused onlanguage models and training which don’t have the varietyand number of features shown in Figure 5 and emphasizetraining throughput compared to inference’s latency-boundedthroughput [15], [36], [37], [40], [41].
Gshard provides a sharding abstraction that strongly relieson manual user annotation for tensor placement, and it doesnot automatically shard based on dynamic inputs as is exploredin this work [15]. Furthermore, Baidu’s recent work includesmulti-GPU, fast SSDs, and pipelined stages specifically tosupport large embedding tables for recommendation [12], [13].In that work, compared to the baseline MPI solution, theirGPU+SSD system attains higher throughput during trainingand requires less physical nodes. However, such a system ismore complex to deploy and the effects on end-to-end latencyand strict SLA targets is unexplored in the serving environ-ment. In both cases, the evaluated use-case is parallelism fortraining where model parallelism is mostly static, compared tothe dynamic environment of an inference serving, where modelcomponents can be replicated to meet influxes of QPS. Whiletraining massive deep recommendation systems is also anincredible and important challenge–and is related to inferenceserving–this work focuses on the data-center implications ofserving those models. The sharding strategies discussed in thiswork are heuristically tailored to the unique model architectureof deep recommendation systems and driven by capacity andlatency constraints, not training throughput.
Cooperative, hybrid approaches–that split the model be-tween mobile systems and data-center–have also been exploredfor improved performance and efficiency [42]. However, sucha scheme is problematic in the scope of recommendationwhere the model is already capacity-bound, so execution ona constrained mobile system is challenging. Privacy require-
ments, energy concerns for the user, and online models furtherimpede the placement of model partitions on user end devices.
Model compression is discussed in Section VII-D, whichconcluded current quantization and pruning techniques donot solely resolve the challenge of serving terabyte-scaledeep recommendation systems. The effectiveness of traditionalcompression techniques is specific to the neural networkmodel, with CNNs in particular shown to compress well [22].Techniques specific to large embedding tables have tradi-tionally targeted the intuitive characteristics of pre-trainedword embeddings, not the sparse user- and content-featuresof deep recommendation systems [43]–[49]. Other lossless in-memory or in-cache compression techniques assume data-setsthat exhibit lower entropy and more regularity than observedin embedding tables [50]–[52]. Even quantized to 8- or 4-bits, embedding tables value distributions do not significantlybenefit from further lossless entropy encoding. Techniques toreduce the size of recommendation embedding tables warrantsfurther exploration and is an on-going area of research [21].
Lastly, the distributed scheme described in this work, thatshards only the embedding tables, can be compared to tra-ditional scale-out, in-memory distributed databases or hashtables that serve large magnitudes of tabular data [53], [54].However, these are overly complex due to their mutabilityand scale requirements, compared to a trained model snapshot.Even within training, the varying levels of asynchrony of pa-rameter servers also does not lend itself to existing distributeddatabase solutions. Given a key motivation of distributedinference is rapid and flexible deployment, integration withdatabase solutions was not considered.
IX. INDUSTRY AND ACADEMIC RELEVANCE
The challenge of large deep learning recommendation mod-els provides a strong opportunity for academics to tackleproblems of the data-center, the impact of which is significantdue to the ubiquity of deep recommendation systems.A corecontribution of this work is that the models and infras-tructure are highly representative of real inference serving.The software infrastructure in particular matches the datacenter environment. Despite the seemingly industry-orientedinclination of this workload, academic-friendly methodologiesalso exist that are less resource intensive. DLRM is an open-source recommendation model that has been used in manyrecent works [1]–[5]. While it currently doesn’t support dis-tributed inference, the opportunity to extend this functional-ity is straightforward with the RPC operators described inSection III. Further research opportunities are achievable byway of trace-driven experimentation. For example, Bandanaused embedding table access traces–which can be collectedoffline–to reduce effective DRAM requirements [4]. Becauseembedding table behavior is the dominating design factor inlarge models, explorations table placement and frequency-based caching are also valuable directions enabled with trace-based analyses.
15

X. CONCLUSION AND FUTURE WORK
The rate and scale of model growth for recommendationmotivates new serving paradigms to accommodate enormoussparse embedding tables. This emerging domain providesrich opportunity for system architects to have impact. Dis-tributed inference in particular provides a solution that iseasily deployed by existing infrastructure. Understanding theperformance trade-offs and overhead sources is paramount toefficient and scalable recommendation.
This is the first work to describe and characterize capacity-driven distributed inference for deep learning recommendersystems, with a cross-layer distributed tracing methodology.In this work, we described and identified distributed inferenceas a practical, deployable solution on existing data-centerinfrastructure. Even with the naive sharding strategies weevaluated, only a 1% increase in P99 latency was expe-rienced at 8-shards for the most compute-intensive model.The trace-based characterization identified sharding strategy,sparse feature hyperparameters like pooling factor, and requestsize as having substantial impact on latency and computeoverheads. In particular, we found that organizing shardsby net had a stronger impact on both latency and computeoverheads, compared to only considering embedding tables inisolation. These results varied depending on the model andwarrants a workflow that dynamically profiles models. Wealso showed that–given enough sparse operator work–latencycan be improved over the non-distributed model, especiallywhen batches are sufficiently large and in a high QPS servingenvironment. Finally, potentials for improved data-center scaleserving efficiency were identified, by decoupling dense andsparse operator resources in distributed inference.
Future work is needed to automate model sharding to targetdata-center resource efficiency and per-model SLA and QPSrequirements. The various design trade-offs identified in thiswork place a large burden on the feature, model, and systemdesigners to manually optimize the distributed deep learningrecommendation model. Moreover, the design space shouldbe expanded to include additional system-level solutions suchas paging-from-disk, and to include additional large models,such as recent terabyte-scale NLP models and graph-basedrecommender systems [15], [55].
ACKNOWLEDGMENTS
This work was completed in a collaboration between DrexelUniversity, Tufts University, and Facebook. The majority ofwork was completed while some authors were on internshipand sabbatical at Facebook. We would like to thank ourcolleagues in Facebook AI for their feedback, key insights, andmyriad of discussions on recommender systems and distributedinfrastructures and AI. The authors would like to specificallythank Udit Gupta, Liu Ke, Vikram Saraph, Mark Jeffrey,Caroline Trippel, Brandon Reagen, Michael Bevilacqua-Linn,Tristan Rice, Xuan Zhang, Hsien-Hsin Sean Lee, and BarisTaskin for their invaluable mentorship, guidance and support,without whom this work would not be possible.
REFERENCES
[1] U. Gupta, C. Wu, X. Wang, M. Naumov, B. Reagen, D. Brooks,B. Cottel, K. Hazelwood, M. Hempstead, B. Jia, H. S. Lee, A. Malevich,D. Mudigere, M. Smelyanskiy, L. Xiong, and X. Zhang, “The archi-tectural implications of facebook’s dnn-based personalized recommen-dation,” in 2020 IEEE International Symposium on High PerformanceComputer Architecture (HPCA), 2020, pp. 488–501.
[2] U. Gupta, S. Hsia, V. Saraph, X. Wang, B. Reagen, G.-Y. Wei, H.-H. S. Lee, D. Brooks, and C.-J. Wu, “Deeprecsys: A system foroptimizing end-to-end at-scale neural recommendation inference,” in2020 International Symposium on Computer Architecture (ISCA), 2020.
[3] M. Naumov, D. Mudigere, H.-J. M. Shi, J. Huang, N. Sundaraman,J. Park, X. Wang, U. Gupta, C.-J. Wu, A. G. Azzolini, D. Dzhulgakov,A. Mallevich, I. Cherniavskii, Y. Lu, R. Krishnamoorthi, A. Yu, V. Kon-dratenko, S. Pereira, X. Chen, W. Chen, V. Rao, B. Jia, L. Xiong, andM. Smelyanskiy, “Deep learning recommendation model for personal-ization and recommendation systems,” 2019.
[4] A. Eisenman, M. Naumov, D. Gardner, M. Smelyanskiy, S. Pupyrev,K. Hazelwood, A. Cidon, and S. Katti, “Bandana: Using non-volatilememory for storing deep learning models,” 2018.
[5] L. Ke, U. Gupta, B. Y. Cho, D. Brooks, V. Chandra, U. Diril,A. Firoozshahian, K. Hazelwood, B. Jia, H. S. Lee, M. Li, B. Maher,D. Mudigere, M. Naumov, M. Schatz, M. Smelyanskiy, X. Wang,B. Reagen, C. Wu, M. Hempstead, and X. Zhang, “Recnmp: Accel-erating personalized recommendation with near-memory processing,” in2020 ACM/IEEE 47th Annual International Symposium on ComputerArchitecture (ISCA), 2020, pp. 790–803.
[6] R. Hwang, T. Kim, Y. Kwon, and M. Rhu, “Centaur: A chiplet-based,hybrid sparse-dense accelerator for personalized recommendations,” in2020 ACM/IEEE 47th Annual International Symposium on ComputerArchitecture (ISCA), 2020, pp. 968–981.
[7] Y. Kwon, Y. Lee, and M. Rhu, “Tensor casting: Co-designing algorithm-architecture for personalized recommendation training,” 2020.
[8] S. Hsia, U. Gupta, M. Wilkening, C.-J. Wu, G.-Y. Wei, and D. Brooks,“Cross-stack workload characterization of deep recommendation sys-tems,” in 2020 IEEE International Symposium on Workload Character-ization (IISWC), 2020.
[9] V. J. Reddi, C. Cheng, D. Kanter, P. Mattson, G. Schmuelling, C. Wu,B. Anderson, M. Breughe, M. Charlebois, W. Chou, R. Chukka, C. Cole-man, S. Davis, P. Deng, G. Diamos, J. Duke, D. Fick, J. S. Gardner,I. Hubara, S. Idgunji, T. B. Jablin, J. Jiao, T. S. John, P. Kanwar, D. Lee,J. Liao, A. Lokhmotov, F. Massa, P. Meng, P. Micikevicius, C. Osborne,G. Pekhimenko, A. T. R. Rajan, D. Sequeira, A. Sirasao, F. Sun, H. Tang,M. Thomson, F. Wei, E. Wu, L. Xu, K. Yamada, B. Yu, G. Yuan,A. Zhong, P. Zhang, and Y. Zhou, “Mlperf inference benchmark,” in2020 ACM/IEEE 47th Annual International Symposium on ComputerArchitecture (ISCA), 2020, pp. 446–459.
[10] P. Mattson, C. Cheng, C. Coleman, G. Diamos, P. Micikevicius, D. Pat-terson, H. Tang, G.-Y. Wei, P. Bailis, V. Bittorf, D. Brooks, D. Chen,D. Dutta, U. Gupta, K. Hazelwood, A. Hock, X. Huang, B. Jia,D. Kang, D. Kanter, N. Kumar, J. Liao, D. Narayanan, T. Oguntebi,G. Pekhimenko, L. Pentecost, V. J. Reddi, T. Robie, T. S. John, C.-J.Wu, L. Xu, C. Young, and M. Zaharia, “Mlperf training benchmark,”arXiv preprint arXiv:1910.01500, 2019.
[11] C.-J. Wu, R. Burke, E. H. Chi, J. Konstan, J. McAuley, Y. Raimond,and H. Zhang, “Developing a recommendation benchmark for mlperftraining and inference,” 2020.
[12] W. Zhao, D. Xie, R. Jia, Y. Qian, R. Ding, M. Sun, and P. Li, “Distributedhierarchical gpu parameter server for massive scale deep learning adssystems,” 2020.
[13] W. Zhao, J. Zhang, D. Xie, Y. Qian, R. Jia, and P. Li, “Aibox: Ctrprediction model training on a single node,” in Proceedings of the28th ACM International Conference on Information and KnowledgeManagement, ser. CIKM ’19. New York, NY, USA: Associationfor Computing Machinery, 2019, p. 319–328. [Online]. Available:https://doi.org/10.1145/3357384.3358045
[14] X. Yi, Y.-F. Chen, S. Ramesh, V. Rajashekhar, L. Hong, N. Fiedel,N. Seshadri, L. Heldt, X. Wu, and E. H. Chi, “Factorized deep retrievaland distributed tensorflow serving,” ser. SysML’18, 2018.
[15] D. Lepikhin, H. Lee, Y. Xu, D. Chen, O. Firat, Y. Huang, M. Krikun,N. Shazeer, and Z. Chen, “Gshard: Scaling giant models with conditionalcomputation and automatic sharding,” 2020.
16
[16] J. Hestness, S. Narang, N. Ardalani, G. Diamos, H. Jun, H. Kianinejad,M. M. A. Patwary, Y. Yang, and Y. Zhou, “Deep learning scaling ispredictable, empirically,” 2017.
[17] J. Hestness, N. Ardalani, and G. Diamos, “Beyond human-levelaccuracy: Computational challenges in deep learning,” in Proceedingsof the 24th Symposium on Principles and Practice of ParallelProgramming, ser. PPoPP ’19. New York, NY, USA: Associationfor Computing Machinery, 2019, p. 1–14. [Online]. Available:https://doi.org/10.1145/3293883.3295710
[18] J. Kaplan, S. McCandlish, T. Henighan, T. B. Brown, B. Chess, R. Child,S. Gray, A. Radford, J. Wu, and D. Amodei, “Scaling laws for neurallanguage models,” 2020.
[19] C. Zhang, S. Bengio, M. Hardt, B. Recht, and O. Vinyals,“Understanding deep learning requires rethinking generalization,” in 5thInternational Conference on Learning Representations, ser. ICLR ’17,2017. [Online]. Available: https://openreview.net/forum?id=Sy8gdB9xx
[20] M. Geiger, A. Jacot, S. Spigler, F. Gabriel, L. Sagun, S. d’Ascoli, G. Biroli, C. Hongler, and M. Wyart, “Scaling descriptionof generalization with number of parameters in deep learning,”Journal of Statistical Mechanics: Theory and Experiment, vol.2020, no. 2, p. 023401, Feb 2020. [Online]. Available: http://dx.doi.org/10.1088/1742-5468/ab633c
[21] H.-J. M. Shi, D. Mudigere, M. Naumov, and J. Yang, “Compositionalembeddings using complementary partitions for memory-efficientrecommendation systems,” in Proceedings of the 26th ACM SIGKDDInternational Conference on Knowledge Discovery; Data Mining,ser. KDD ’20. New York, NY, USA: Association for ComputingMachinery, 2020, p. 165–175. [Online]. Available: https://doi.org/10.1145/3394486.3403059
[22] S. Han, H. Mao, and W. J. Dally, “Deep compression: Compressingdeep neural network with pruning, trained quantization and huffmancoding,” in 4th International Conference on Learning Representations,ICLR 2016, San Juan, Puerto Rico, May 2-4, 2016, Conference TrackProceedings, Y. Bengio and Y. LeCun, Eds., 2016. [Online]. Available:http://arxiv.org/abs/1510.00149
[23] K. Hazelwood, S. Bird, D. Brooks, S. Chintala, U. Diril, D. Dzhulgakov,M. Fawzy, B. Jia, Y. Jia, A. Kalro, J. Law, K. Lee, J. Lu, P. Noordhuis,M. Smelyanskiy, L. Xiong, and X. Wang, “Applied machine learningat facebook: A datacenter infrastructure perspective,” in 2018 IEEEInternational Symposium on High Performance Computer Architecture(HPCA), Feb 2018, pp. 620–629.
[24] Y. Koren, R. Bell, and C. Volinsky, “Matrix factorization techniques forrecommender systems,” Computer, vol. 42, no. 8, pp. 30–37, 2009.
[25] C. Desrosiers and G. Karypis, Recommender Systems Handbook.Springer, 2011, ch. A Comprehensive Survey of Neighborhood-basedRecommendation Methods.
[26] H.-T. Cheng, L. Koc, J. Harmsen, T. Shaked, T. Chandra, H. Aradhye,G. Anderson, G. Corrado, W. Chai, M. Ispir, R. Anil, Z. Haque,L. Hong, V. Jain, X. Liu, and H. Shah, “Wide and deep learning forrecommender systems,” arXiv:1606.07792, 2016. [Online]. Available:http://arxiv.org/abs/1606.07792
[27] P. Covington, J. Adams, and E. Sargin, “Deep neural networksfor youtube recommendations,” in Proceedings of the 10th ACMConference on Recommender Systems, ser. RecSys ’16. New York,NY, USA: Association for Computing Machinery, 2016, p. 191–198.[Online]. Available: https://doi.org/10.1145/2959100.2959190
[28] G. Zhou, C. Song, X. Zhu, Y. Fan, H. Zhu, X. Ma, Y. Yan, J. Jin, H. Li,and K. Gai, “Deep interest network for click-through rate prediction,”2017.
[29] H. Guo, R. Tang, Y. Ye, Z. Li, and X. He, “Deepfm: A factorization-machine based neural network for ctr prediction,” in Proceedings ofthe 26th International Joint Conference on Artificial Intelligence, ser.IJCAI’17. AAAI Press, 2017, p. 1725–1731.
[30] Facebook, “fbthrift,” https://github.com/facebook/fbthrift.[31] A. Paszke, S. Gross, F. Massa, A. Lerer, J. Bradbury,
G. Chanan, T. Killeen, Z. Lin, N. Gimelshein, L. Antiga,A. Desmaison, A. Kopf, E. Yang, Z. DeVito, M. Raison, A. Tejani,S. Chilamkurthy, B. Steiner, L. Fang, J. Bai, and S. Chintala,“Pytorch: An imperative style, high-performance deep learninglibrary,” in Advances in Neural Information Processing Systems32, H. Wallach, H. Larochelle, A. Beygelzimer, F. d'Alche-Buc,E. Fox, and R. Garnett, Eds. Curran Associates, Inc., 2019,pp. 8024–8035. [Online]. Available: http://papers.neurips.cc/paper/
9015-pytorch-an-imperative-style-high-performance-deep-learning-library.pdf
[32] M. Abadi, A. Agarwal, P. Barham, E. Brevdo, Z. Chen, C. Citro, G. S.Corrado, A. Davis, J. Dean, M. Devin, S. Ghemawat, I. Goodfellow,A. Harp, G. Irving, M. Isard, Y. Jia, R. Jozefowicz, L. Kaiser,M. Kudlur, J. Levenberg, D. Mane, R. Monga, S. Moore, D. Murray,C. Olah, M. Schuster, J. Shlens, B. Steiner, I. Sutskever, K. Talwar,P. Tucker, V. Vanhoucke, V. Vasudevan, F. Viegas, O. Vinyals,P. Warden, M. Wattenberg, M. Wicke, Y. Yu, and X. Zheng,“TensorFlow: Large-scale machine learning on heterogeneous systems,”2015, software available from tensorflow.org. [Online]. Available:https://www.tensorflow.org/
[33] T. Ben-Nun and T. Hoefler, “Demystifying parallel and distributed deeplearning: An in-depth concurrency analysis,” 2018.
[34] B. H. Sigelman, L. A. Barroso, M. Burrows, P. Stephenson, M. Plakal,D. Beaver, S. Jaspan, and C. Shanbhag, “Dapper, a large-scaledistributed systems tracing infrastructure,” Google, Inc., Tech. Rep.,2010. [Online]. Available: https://research.google.com/archive/papers/dapper-2010-1.pdf
[35] J. Kaldor, J. Mace, M. Bejda, E. Gao, W. Kuropatwa, J. O’Neill,K. W. Ong, B. Schaller, P. Shan, B. Viscomi, V. Venkataraman,K. Veeraraghavan, and Y. J. Song, “Canopy: An end-to-end performancetracing and analysis system,” in Proceedings of the 26th Symposiumon Operating Systems Principles, ser. SOSP ’17. New York, NY,USA: Association for Computing Machinery, 2017, p. 34–50. [Online].Available: https://doi.org/10.1145/3132747.3132749
[36] Y. Huang, Y. Cheng, A. Bapna, O. Firat, M. X. Chen, D. Chen, H. Lee,J. Ngiam, Q. V. Le, Y. Wu, and Z. Chen, “Gpipe: Efficient training ofgiant neural networks using pipeline parallelism,” 2018.
[37] N. Shazeer, Y. Cheng, N. Parmar, D. Tran, A. Vaswani,P. Koanantakool, P. Hawkins, H. Lee, M. Hong, C. Young,R. Sepassi, and B. Hechtman, “Mesh-tensorflow: Deep learningfor supercomputers,” in Advances in Neural Information ProcessingSystems 31, S. Bengio, H. Wallach, H. Larochelle, K. Grauman,N. Cesa-Bianchi, and R. Garnett, Eds. Curran Associates, Inc.,2018, pp. 10 414–10 423. [Online]. Available: http://papers.nips.cc/paper/8242-mesh-tensorflow-deep-learning-for-supercomputers.pdf
[38] M. Naumov, J. Kim, D. Mudigere, S. Sridharan, X. Wang, W. Zhao,S. Yilmaz, C. Kim, H. Yuen, M. Ozdal, K. Nair, I. Gao, B.-Y. Su,J. Yang, and M. Smelyanskiy, “Deep learning training in facebook datacenters: Design of scale-up and scale-out systems,” 2020.
[39] C. Olston, N. Fiedel, K. Gorovoy, J. Harmsen, L. Lao, F. Li, V. Ra-jashekhar, S. Ramesh, and J. Soyke, “Tensorflow-serving: Flexible, high-performance ml serving,” 2017.
[40] D. Narayanan, A. Harlap, A. Phanishayee, V. Seshadri, N. R. Devanur,G. R. Ganger, P. B. Gibbons, and M. Zaharia, “Pipedream: Generalizedpipeline parallelism for dnn training,” in Proceedings of the 27th ACMSymposium on Operating Systems Principles, ser. SOSP ’19. NewYork, NY, USA: Association for Computing Machinery, 2019, p. 1–15.[Online]. Available: https://doi.org/10.1145/3341301.3359646
[41] Z. Jia, M. Zaharia, and A. Aiken, “Beyond data and model parallelismfor deep neural networks,” in Proceedings of Machine Learning andSystems 2019, 2019, pp. 1–13.
[42] Y. Kang, J. Hauswald, C. Gao, A. Rovinski, T. Mudge, J. Mars, andL. Tang, “Neurosurgeon: Collaborative intelligence between the cloudand mobile edge,” in Proceedings of the Twenty-Second InternationalConference on Architectural Support for Programming Languagesand Operating Systems, ser. ASPLOS ’17. New York, NY, USA:Association for Computing Machinery, 2017, p. 615–629. [Online].Available: https://doi.org/10.1145/3037697.3037698
[43] T. Mikolov, K. Chen, G. Corrado, and J. Dean, “Efficient estimation ofword representations in vector space,” 2013.
[44] J. Pennington, R. Socher, and C. D. Manning, “Glove: Global vectorsfor word representation,” in Empirical Methods in Natural LanguageProcessing (EMNLP), 2014, pp. 1532–1543. [Online]. Available:http://www.aclweb.org/anthology/D14-1162
[45] R. Shu and H. Nakayama, “Compressing word embeddings viadeep compositional code learning,” in International Conferenceon Learning Representations, 2018. [Online]. Available: https://openreview.net/forum?id=BJRZzFlRb
[46] J. Mu and P. Viswanath, “All-but-the-top: Simple and effectivepostprocessing for word representations,” in International Conferenceon Learning Representations, 2018. [Online]. Available: https://openreview.net/forum?id=HkuGJ3kCb
17
[47] Z. Yin and Y. Shen, “On the dimensionality of word embedding,” inProceedings of the 32nd International Conference on Neural InformationProcessing Systems, ser. NIPS’18. Red Hook, NY, USA: CurranAssociates Inc., 2018, p. 895–906.
[48] V. Raunak, “Simple and effective dimensionality reduction for wordembeddings,” 2017.
[49] O. Hrinchuk, V. Khrulkov, L. Mirvakhabova, E. Orlova, and I. Oseledets,“Tensorized embedding layers for efficient model compression,” 2019.
[50] A. Lagar-Cavilla, J. Ahn, S. Souhlal, N. Agarwal, R. Burny, S. Butt,J. Chang, A. Chaugule, N. Deng, J. Shahid, G. Thelen, K. A.Yurtsever, Y. Zhao, and P. Ranganathan, “Software-defined far memoryin warehouse-scale computers,” in Proceedings of the Twenty-FourthInternational Conference on Architectural Support for ProgrammingLanguages and Operating Systems, ser. ASPLOS ’19. New York,NY, USA: Association for Computing Machinery, 2019, p. 317–330.[Online]. Available: https://doi.org/10.1145/3297858.3304053
[51] G. Pekhimenko, V. Seshadri, O. Mutlu, P. B. Gibbons, M. A. Kozuch,and T. C. Mowry, “Base-delta-immediate compression: Practicaldata compression for on-chip caches,” in Proceedings of the 21stInternational Conference on Parallel Architectures and CompilationTechniques, ser. PACT ’12. New York, NY, USA: Associationfor Computing Machinery, 2012, p. 377–388. [Online]. Available:https://doi.org/10.1145/2370816.2370870
[52] A. Alameldeen and D. Wood, “Frequent pattern compression: Asignificance-based compression scheme for l2 caches,” 01 2004.
[53] Apache Software Foundation, “Hadoop.” [Online]. Available: https://hadoop.apache.org
[54] F. Chang, J. Dean, S. Ghemawat, W. C. Hsieh, D. A. Wallach, M. Bur-rows, T. Chandra, A. Fikes, and R. E. Gruber, “Bigtable: A distributedstorage system for structured data,” in Proceedings of the 7th USENIXSymposium on Operating Systems Design and Implementation - Volume7, ser. OSDI ’06. USA: USENIX Association, 2006, p. 15.
[55] R. Ying, R. He, K. Chen, P. Eksombatchai, W. L. Hamilton,and J. Leskovec, “Graph convolutional neural networks for web-scale recommender systems,” in Proceedings of the 24th ACMSIGKDD International Conference on Knowledge Discovery &Data Mining, ser. KDD ’18. New York, NY, USA: Associationfor Computing Machinery, 2018, p. 974–983. [Online]. Available:https://doi.org/10.1145/3219819.3219890
18