understanding distributions of chess performancesregan/talks/reganmaciejahaworth2011.pdf ·...
TRANSCRIPT
Understanding Distributions of
Chess Performances
Dr. Kenneth W. Regan, Univ. at Buffalo
Bartlomiej Macieja, Warsaw, Poland
Guy Haworth, Univ. of Reading (UK)
(alternate slides with more detail than ACG13 talk)
Part 1: Population Model for 2200+ Players.
Part 2: Average Error per Tournament Category by Year.
Part 3: Intrinsic Performance Ratings.
Part 4: Distributions Of and Within Tournaments.

2
Kenneth
Regan
Bartlomiej
Macieja

Performances Measured By Elo
Ratings • FIDE Elo System started in 1971.
• Ratings are relative, no intrinsic meaning to 2200,
2300, 2400, 2500, 2600, 2700, 2800…
• Does “2700” mean “truly in the world elite” or an
absolute level of skill?
• Fischer and Karpov only 2700+ players thru 1981.
• 47 2700+ on Nov. 2011 FIDE Elo list. Inflation?
• Could the Laurent Fressinet of 2011 have beaten
the Anatoly Karpov (2695) of 1981? Nigel Short at
2698? What tests can we try?
Backstory
• A sequence of papers on ‘Assessing Decision Makers’
– Reference Fallible Decision Makers (2002, 2003)
– (Deeper) Model Endgame Analysis (2003, 2005)
– Extension of the concept to pre-EGT Chess (2007)
– Skill Rating by Bayesian Inference (2009) ... IEEE CIDM ‘09
– Performance and Prediction, (2009) ... ACG12, Pamplona
– Intrinsic Chess Ratings (2011) ... AAAI-11, San Francisco
• Topics
– The creation of a Skilloscope to rank players
– Comparison of and correlation with ELO scales
– Detection of plagiarism ... and ELO Scale instability
Pos. Crit., 2011-11-11 4

Our own previous work
• [DiFatta-Haworth-Regan, ICDM 2009]: Bayes-
ian iteration yields correspondence between
Elo and model with a single skill parameter.
Engine Toga II in 10-PV mode, depth 10.
• [Haworth-Regan-DiFatta, ACG 12, 2009]:
Reference Fallible Agent modelling,
application to controversial cases.
• [Regan-Haworth, AAAI 2011]: 2-parameter
model using Rybka 3 in 50-PV mode, depth
13. Multinomial Bernoullli-trial not Bayesian
model. Described further below.

Related Work • Matej Guid and Ivan Bratko, 2006—2011
– Focused on World Championship matches
– Crafty to depth 12, recently other engines incl. Shredder
and Rybka 2 to depth 12, and Rybka 3 to depth (only) 10.
– Reliable for relative rankings.
• Charles Sullivan, www.truechess.com
– All games by WC’s, 617,446 positions, Crafty 20.14
(modified) for 6 min. on single thread, Rybka 2.32a used
to check possible blunders.
• User “deka” posts at http://rybkaforum.net/cgi-
bin/rybkaforum/topic_show.pl?tid=5850 Victorian era
players, Rybka 3 depth 14 in 4-PV mode.
• Jeff Sonas, www.chessmetrics.com & Kaggle, others…
The focus today
• the question of ELO Inflation
• common remarks about the FIDE ELO scale
– ELO 2700 does not mean what it used to mean
– ELO 2700 is not worth what it was
–
• Three assessments of the inflation question
– Population dynamics
– ‘Average Error’ in categorised FIDE tournaments
– Parametric models of Virtual ELO players
Pos. Crit., 2011-11-11 7
Three Kinds of Tests (well, two are based on computer analysis)
1. Population Models
– Predict deflation insofar as players expire with
more zero-sum points than they entered with.
– Many obey simple equations (Verhulst 1800s).
2. Average Error (AE) from computer analysis
of games in Single-PV mode on large scale.
3. Intrinsic Ratings from Multi-PV analysis.
– Applicable to smaller sets of games, e.g.
performances in small RRs or 9-round Swisses.
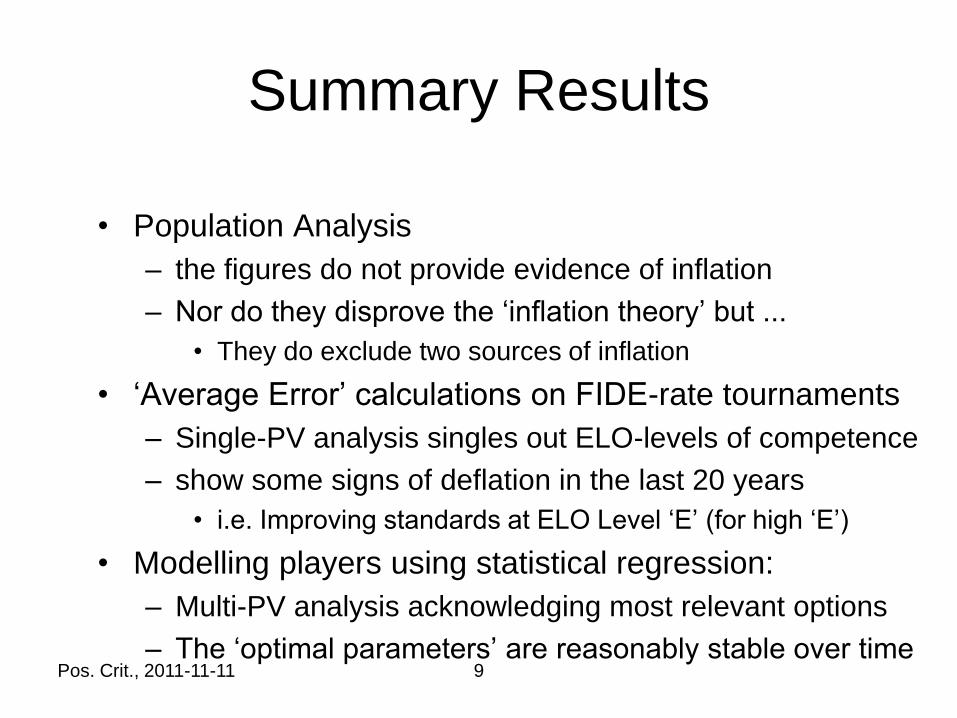
Summary Results
• Population Analysis
– the figures do not provide evidence of inflation
– Nor do they disprove the ‘inflation theory’ but ...
• They do exclude two sources of inflation
• ‘Average Error’ calculations on FIDE-rate tournaments
– Single-PV analysis singles out ELO-levels of competence
– show some signs of deflation in the last 20 years
• i.e. Improving standards at ELO Level ‘E’ (for high ‘E’)
• Modelling players using statistical regression:
– Multi-PV analysis acknowledging most relevant options
– The ‘optimal parameters’ are reasonably stable over time
Pos. Crit., 2011-11-11 9
10
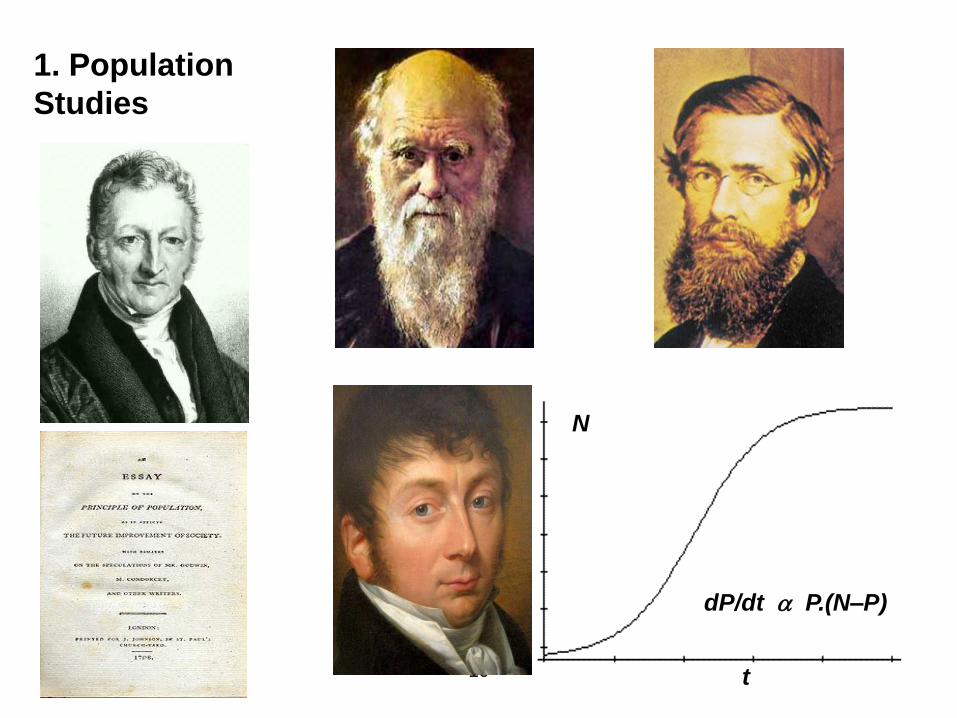
dP/dt P.(N–P)
N
t
1. Population
Studies
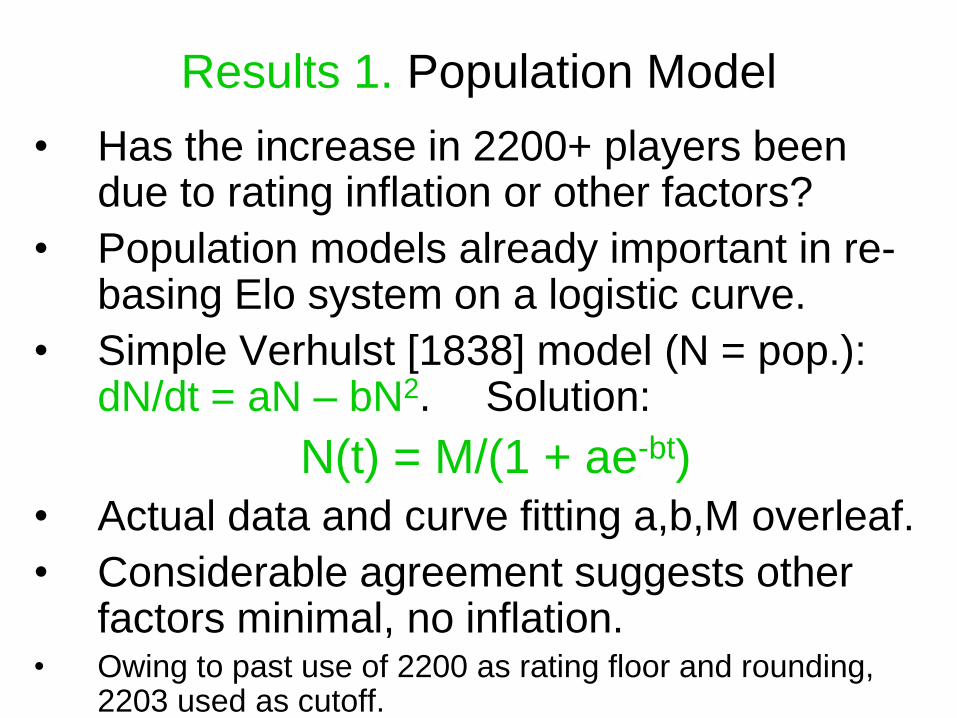
Results 1. Population Model
• Has the increase in 2200+ players been due to rating inflation or other factors?
• Population models already important in re-basing Elo system on a logistic curve.
• Simple Verhulst [1838] model (N = pop.): dN/dt = aN – bN2. Solution:
N(t) = M/(1 + ae-bt)
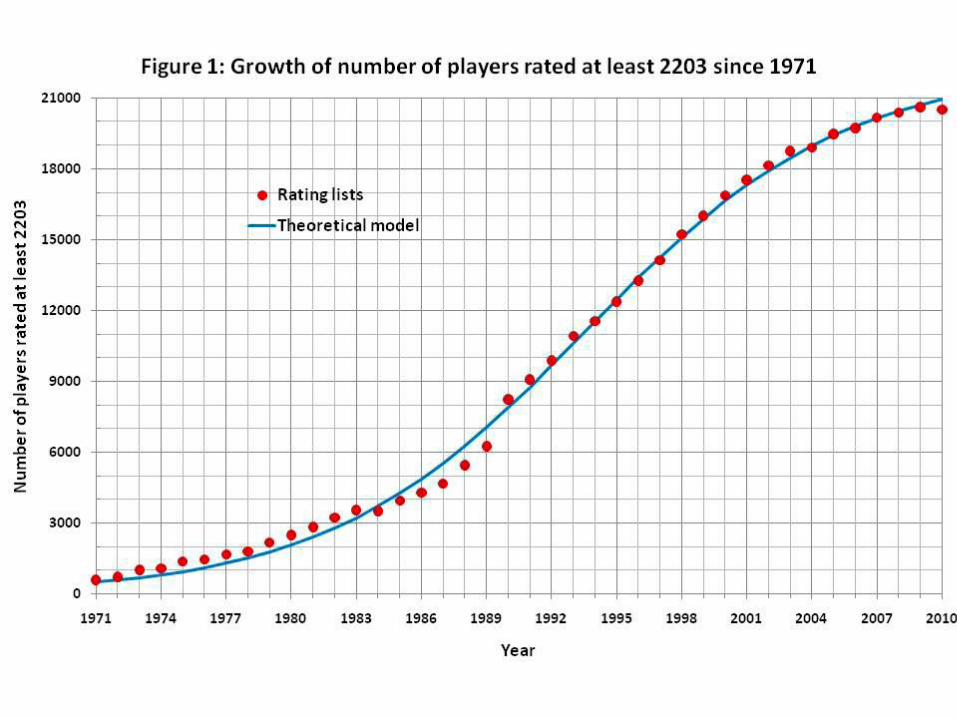
• Actual data and curve fitting a,b,M overleaf.
• Considerable agreement suggests other factors minimal, no inflation.
• Owing to past use of 2200 as rating floor and rounding, 2203 used as cutoff.
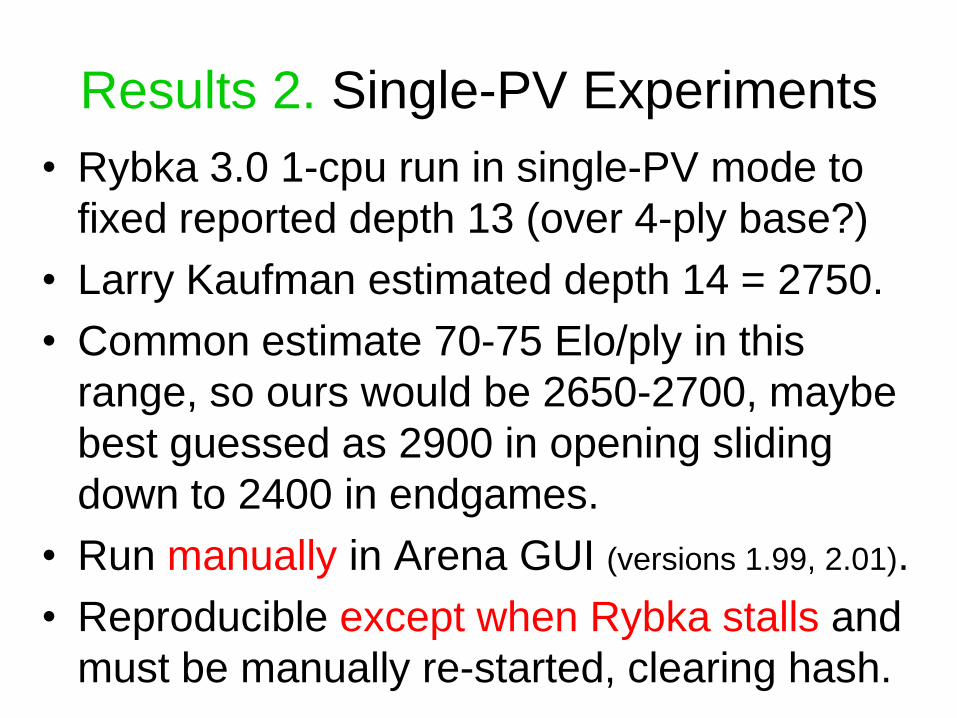
Results 2. Single-PV Experiments
• Rybka 3.0 1-cpu run in single-PV mode to
fixed reported depth 13 (over 4-ply base?)
• Larry Kaufman estimated depth 14 = 2750.
• Common estimate 70-75 Elo/ply in this
range, so ours would be 2650-2700, maybe
best guessed as 2900 in opening sliding
down to 2400 in endgames.
• Run manually in Arena GUI (versions 1.99, 2.01).
• Reproducible except when Rybka stalls and
must be manually re-started, clearing hash.

Tournaments By Category Experiment
• Every tournament given category >= 11 by
ChessBase Big 2009 database + TWIC.
• Skip turns 1—8, ignore positions with Rybka
advantage > 3.00 centipawns for either side at
previous ply, and skip (immediate) repetitions.
– If eval dips back under 3.00, charge a once-only
“error” as the difference from 3.00.
• Over 4 million moves analyzed (3,770,854 retained,
260,404 discarded not counting moves 1--8).
• Can be improved but large data firm results.

Part of 3-Year Larger Project
• On just two 4-core PC’s, Regan has done:
– Every WC, WWC, and men’s Candidates’ match.
– Every major tournament (some 1950--70 to do).
– Large selects from every Olympiad, some entire.
– Large selects from major Swiss events.
– All ICGA WCC tourneys; some engine matches.
– Amber and other Rapid; Blitz; Correspondence;
PAL/CSS Freestyle; KO, Youth---close to the
entire history of chess except national leagues.
• Serves as Scientific Control for Anti-Cheating
(Multi-PV) work (hence some parts are sensitive).
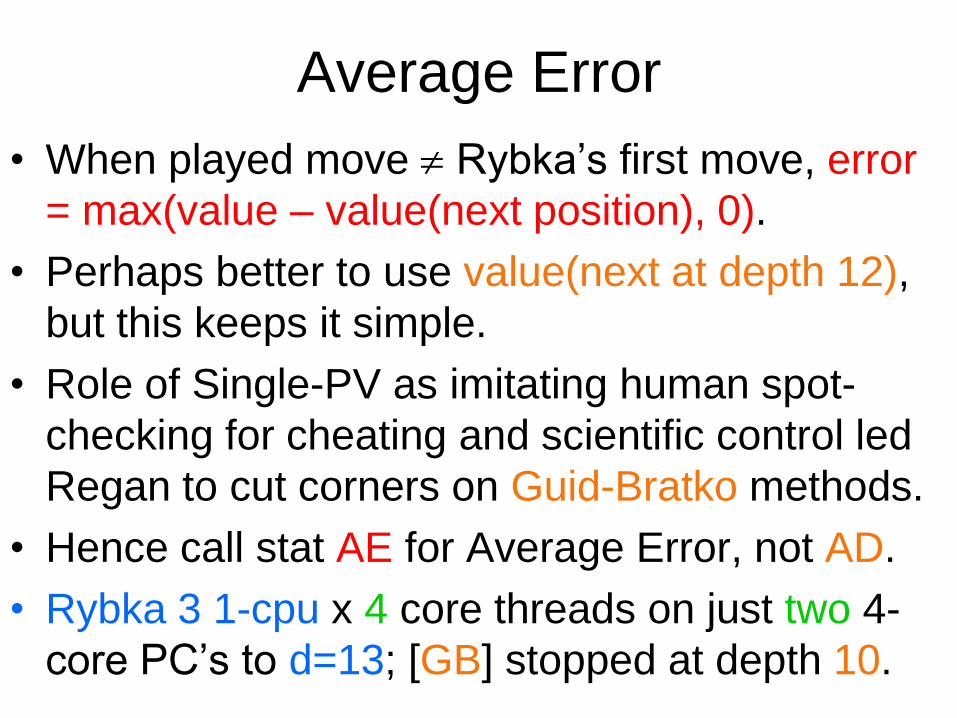
Average Error
• When played move Rybka’s first move, error
= max(value – value(next position), 0).
• Perhaps better to use value(next at depth 12),
but this keeps it simple.
• Role of Single-PV as imitating human spot-
checking for cheating and scientific control led
Regan to cut corners on Guid-Bratko methods.
• Hence call stat AE for Average Error, not AD.
• Rybka 3 1-cpu x 4 core threads on just two 4-
core PC’s to d=13; [GB] stopped at depth 10.

Average Error Eval for PTM: Error(.cp)/#moves = AE
-1.00 -- -0.91: 2370.72 / 14312 = 0.1656
-0.90 -- -0.81: 2537.31 / 16929 = 0.1499
-0.80 -- -0.71: 2357.24 / 17982 = 0.1311
-0.70 -- -0.61: 2794.65 / 23956 = 0.1167
-0.60 -- -0.51: 3525.21 / 32718 = 0.1077
-0.50 -- -0.41: 3155.00 / 33945 = 0.0929
-0.40 -- -0.31: 4203.85 / 50242 = 0.0837
-0.30 -- -0.21: 4990.28 / 65310 = 0.0764
-0.20 -- -0.11: 6346.10 / 89116 = 0.0712
-0.10 -- -0.01: 5745.90 / 84775 = 0.0678
0.00 -- 0.00: 7931.69 / 95112 = 0.0834
0.01 -- 0.10: 4927.55 / 87933 = 0.0560
0.11 -- 0.20: 6025.43 / 97595 = 0.0617
0.21 -- 0.30: 5215.15 / 75272 = 0.0693
0.31 -- 0.40: 4605.31 / 59469 = 0.0774
0.41 -- 0.50: 3392.78 / 40222 = 0.0844
0.51 -- 0.60: 3510.60 / 38036 = 0.0923
0.61 -- 0.70: 2728.45 / 27891 = 0.0978
0.71 -- 0.80: 1999.12 / 20280 = 0.0986
0.81 -- 0.90: 1956.12 / 18954 = 0.1032
0.91 -- 1.00: 1685.87 / 15973 = 0.1055
Table covers all Cat. 11 and higher
tournaments played in 2000—2009.
Read: In 65,310 positions the player to
move was judged 21 to 30 cp behind,
and made a (raw, unscaled) “error” of
7.64 cp per move.
Scripts miss some non-immediate
repetitions, hence 0.00 eval set aside.
Raw figures say players make 60-90%
more error when half a pawn ahead or
behind than when the game is even.
Is this a “real” verdict on skill in these
cases? We think not. Instead we
deduce a proportionality law.

Average Error and Scaling Law
Lower curve effectively plots AE
on log-log paper wr. to eval.
E5 = 1970—1984
E6 = 1985—1999
E7 = 2000—2009
E8 = 2010—2019
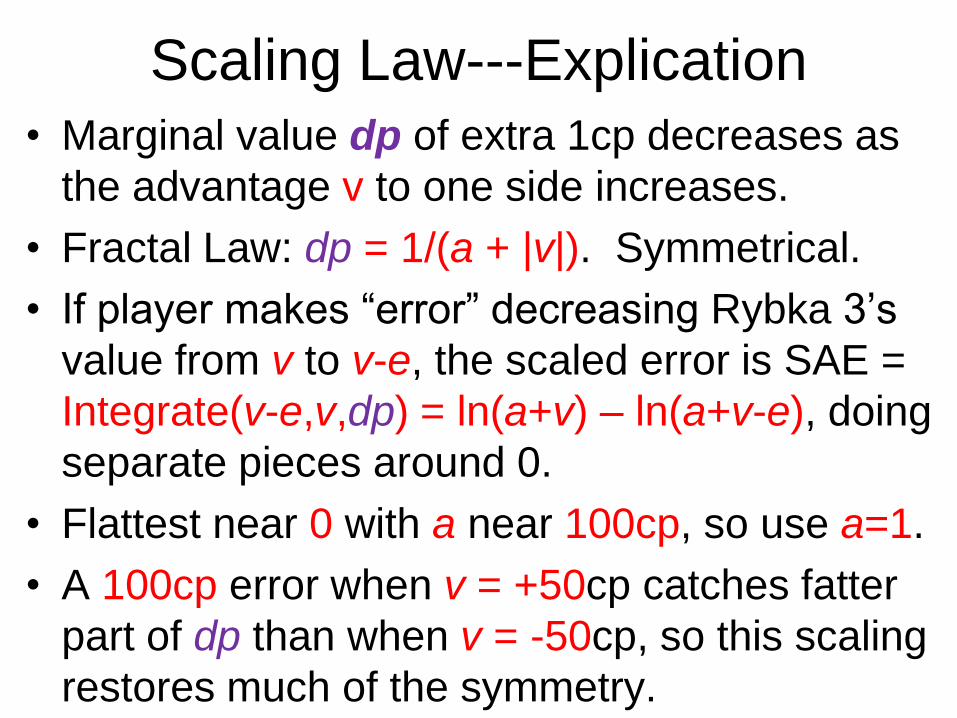
Scaling Law---Explication
• Marginal value dp of extra 1cp decreases as
the advantage v to one side increases.
• Fractal Law: dp = 1/(a + |v|). Symmetrical.
• If player makes “error” decreasing Rybka 3’s
value from v to v-e, the scaled error is SAE =
Integrate(v-e,v,dp) = ln(a+v) – ln(a+v-e), doing
separate pieces around 0.
• Flattest near 0 with a near 100cp, so use a=1.
• A 100cp error when v = +50cp catches fatter
part of dp than when v = -50cp, so this scaling
restores much of the symmetry.

Plot of SAE by Tournament Category
4-year moving avg. of average of
all tournaments in a given year.
Plot lines
would slope
up if there
were
considerable
rating inflation.
Some
evidence of
deflation in
higher
categories.
Cat 21&22
lumped
1996—2001 &
2007—2011.
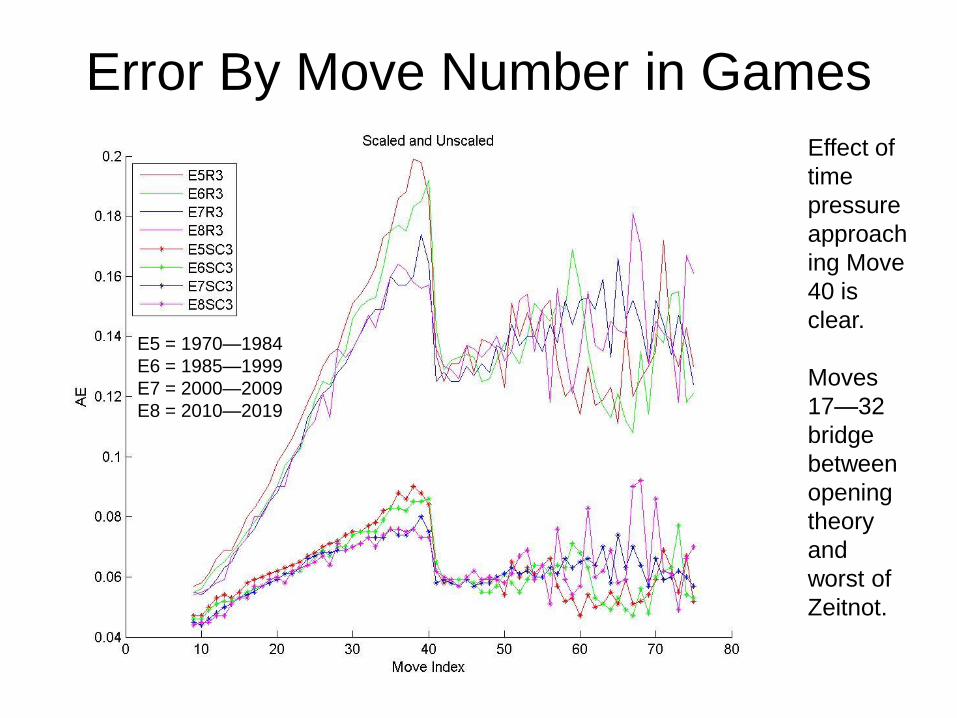
Error By Move Number in Games
Effect of
time
pressure
approach
ing Move
40 is
clear.
Moves
17—32
bridge
between
opening
theory
and
worst of
Zeitnot.
E5 = 1970—1984
E6 = 1985—1999
E7 = 2000—2009
E8 = 2010—2019
E5 = 1970—1984
E6 = 1985—1999
E7 = 2000—2009
E8 = 2010—2019

SAE-by-Category Plot for Moves 17--32
4-year moving average of SAE of
moves 17—32 only, by category.
Curves are
similar to
case of all
moves; error
itself is a
little higher.
Overall no-
inflation
verdict thus
independent
of today’s
greater
opening
theory
knowledge.
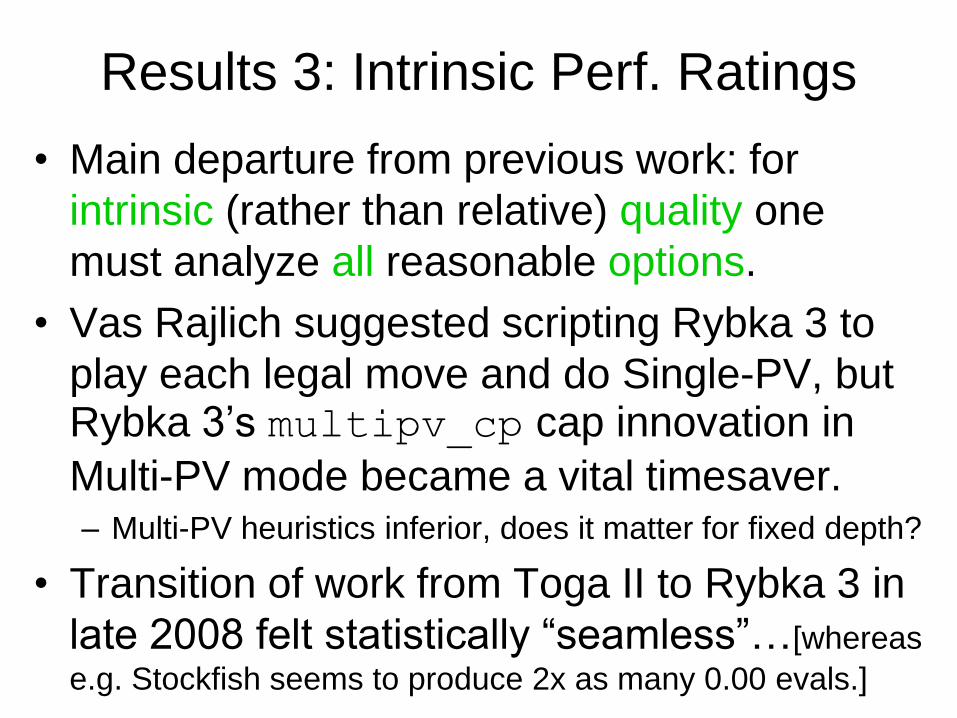
Results 3: Intrinsic Perf. Ratings
• Main departure from previous work: for
intrinsic (rather than relative) quality one
must analyze all reasonable options.
• Vas Rajlich suggested scripting Rybka 3 to
play each legal move and do Single-PV, but Rybka 3’s multipv_cp cap innovation in
Multi-PV mode became a vital timesaver. – Multi-PV heuristics inferior, does it matter for fixed depth?
• Transition of work from Toga II to Rybka 3 in
late 2008 felt statistically “seamless”…[whereas
e.g. Stockfish seems to produce 2x as many 0.00 evals.]
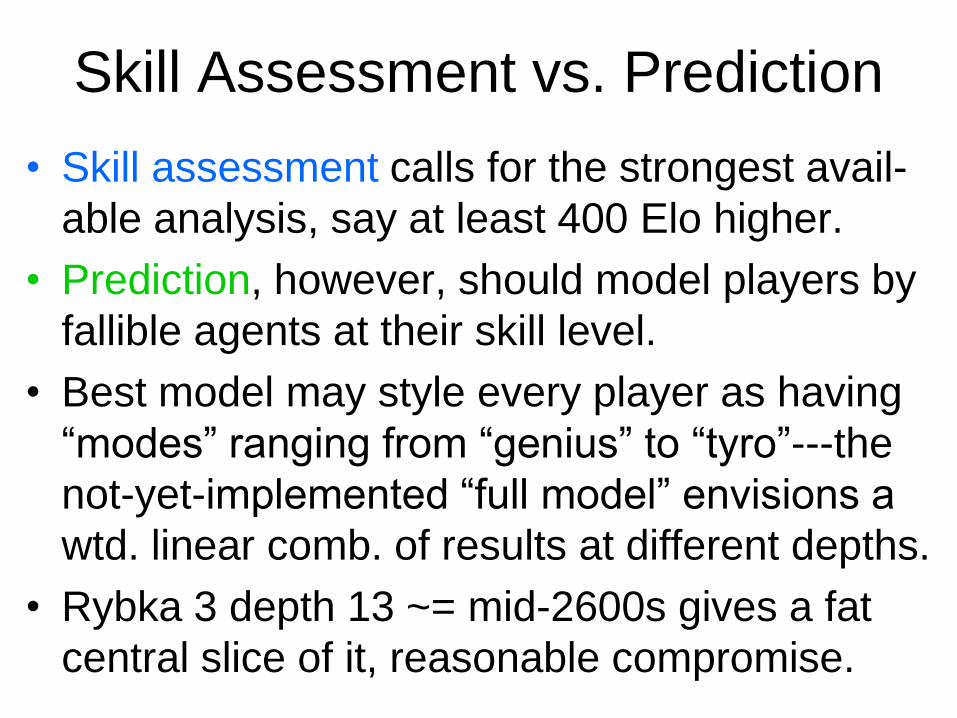
Skill Assessment vs. Prediction
• Skill assessment calls for the strongest avail-
able analysis, say at least 400 Elo higher.
• Prediction, however, should model players by
fallible agents at their skill level.
• Best model may style every player as having
“modes” ranging from “genius” to “tyro”---the
not-yet-implemented “full model” envisions a
wtd. linear comb. of results at different depths.
• Rybka 3 depth 13 ~= mid-2600s gives a fat
central slice of it, reasonable compromise.

Fixed-Depth “Fidelity” Model • Skill parameters sensitivity s, consistency c.
• Inputs are scaled differences di for each legal
move mi in a given position. Engine’s first
move is m0, so d0 = 0.
• Primary outputs are projected probabilities pi
for each move mi.
• Related by
• Parameters s,c fitted to Elo scale using
games between players within 10 pts. of a
century mark 2700, 2600, 2500,…
))s
δ(exp(
)ln(1/p
)ln(1/p ci
i
0 Why this eqn?
Good ques-
tion! It works.
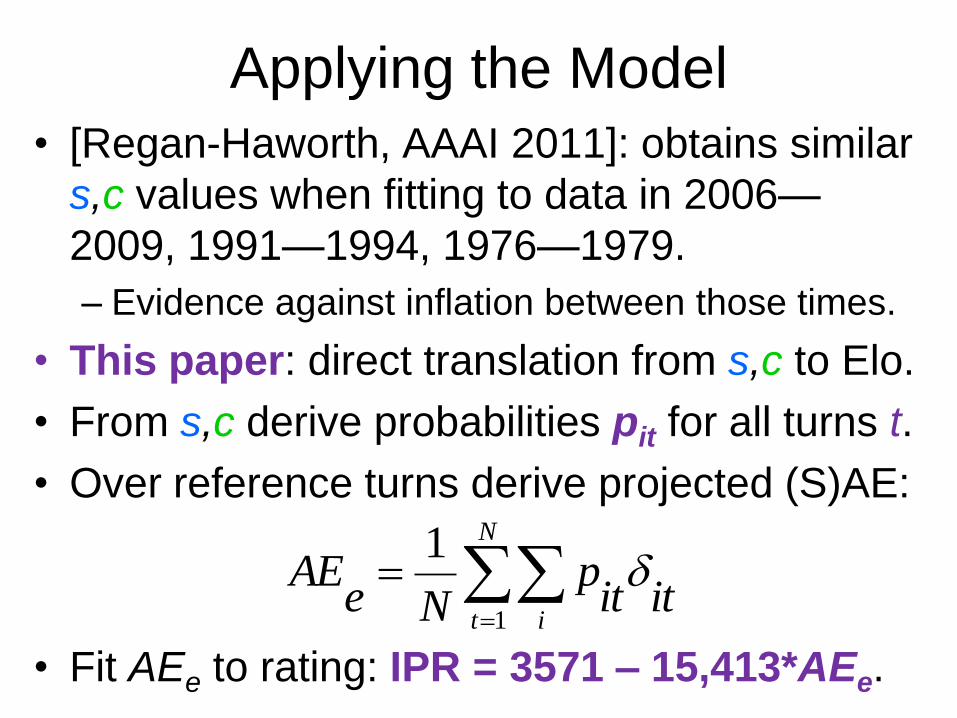
Applying the Model
• [Regan-Haworth, AAAI 2011]: obtains similar
s,c values when fitting to data in 2006—
2009, 1991—1994, 1976—1979.
– Evidence against inflation between those times.
• This paper: direct translation from s,c to Elo.
• From s,c derive probabilities pit for all turns t.
• Over reference turns derive projected (S)AE:
• Fit AEe to rating: IPR = 3571 – 15,413*AEe.
N
t iitit
pNe
AE1
1d

Training Set Results 2006—2009 linear interpolation
Elo s c IPR
2700±10 .078 .503 2690
2600±10 .092 .523 2611
2500±10 .092 .491 2510
2400±10 .098 .483 2422
2300±10 .108 .475 2293
2200±10 .123 .490 2213
1991—1994 derived IPR values
Elo s c IPR
2700±10 .079 .487 2630
2600±10 .092 .533 2639
2500±10 .098 .500 2482
2400±10 .101 .484 2396
2300±10 .116 .480 2237
2200±10 .122 .477 2169
1976—1979 derived IPR values
2600±10 .094 .543 2647
2500±10 .094 .512 2559
2400±10 .099 .479 2397
2300±10 .121 .502 2277
(Elos <= 2100 not used in interpolation)
Inflation would show as
IPR > Elo in tables at
right. Pretty much none.
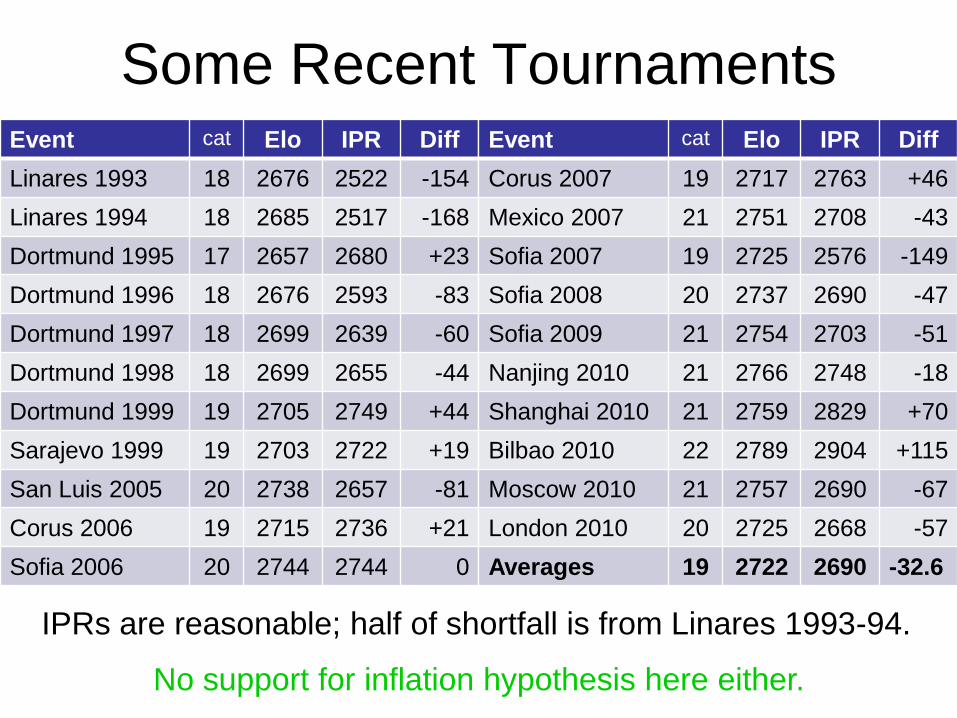
Some Recent Tournaments Event cat Elo IPR Diff
Linares 1993 18 2676 2522 -154
Linares 1994 18 2685 2517 -168
Dortmund 1995 17 2657 2680 +23
Dortmund 1996 18 2676 2593 -83
Dortmund 1997 18 2699 2639 -60
Dortmund 1998 18 2699 2655 -44
Dortmund 1999 19 2705 2749 +44
Sarajevo 1999 19 2703 2722 +19
San Luis 2005 20 2738 2657 -81
Corus 2006 19 2715 2736 +21
Sofia 2006 20 2744 2744 0
Event cat Elo IPR Diff
Corus 2007 19 2717 2763 +46
Mexico 2007 21 2751 2708 -43
Sofia 2007 19 2725 2576 -149
Sofia 2008 20 2737 2690 -47
Sofia 2009 21 2754 2703 -51
Nanjing 2010 21 2766 2748 -18
Shanghai 2010 21 2759 2829 +70
Bilbao 2010 22 2789 2904 +115
Moscow 2010 21 2757 2690 -67
London 2010 20 2725 2668 -57
Averages 19 2722 2690 -32.6
IPRs are reasonable; half of shortfall is from Linares 1993-94.
No support for inflation hypothesis here either.

Results 4. Within a Big Tournament
• Canadian Open, July 9-17, 2011, 9-rd. Swiss.
• 149 players (152 orig.), 115 with FIDE ratings.
• 647 games played; 623 available & analysed.
Whole event CanR TPR IPR Restrict CanR FIDE IPR
Average 2144 2142 2117 to 115 2211 2139 2203
St. Deviation 258 261 379 FIDE- 229 220 345
Wtd. by games 2156 2154 2134 rated 2221 2147 2219
Wtd. by moves 2173 2172 2161 players: 2236 2161 2242
1. IPRs are reasonable overall but individually more volatile than TPRs.
2. IPRs track Canadian ratings better than FIDE, though trained on FIDE.
3. Hence some evidence that FIDE ratings of Canadian players are deflated.

Conclusions and Future Work • Disparate kinds of evidence counter “conventional
wisdom” of substantial rating inflation.
• AE stat effective on largest scales.
• IPR’s from Multi-PV analysis effective on scale of
individual (players in) events.
• To-do list (would like analysis helpers):
1. Improve scripting and data format. Propose AIF:
“Analysis Interchange Format” extending PGN
and EPD. (Compare Fritz 13 “Let’s Check”)
2. Implement “full model” weighting over depths.
3. Analyze distributions of/within tournaments.
4. Apply to other tournament kinds, issues, games.
Special Thanks, and Requests • Thanks most to Arena GUI programmers for full
analysis scripting. www.playwitharena.com
• Toga II and Rybka programmers gave help.
• UB CSE and Univ. de Montreal provided support.
• Tamal Biswas collated data and created graphs.
• Hugh Brodie, David Cohen: Can. Open games.
– Can engines be set to record 0.00 at top level only when
position appears for 3rd time?
– Erroneous gamescores are a major problem! See my
30+ proposed corrections at www.chessgames.com.
Multi-PV training sets cleaned fully, ~1% bad game rate.
– UCI clear-hash without ucinewgame, like Crafty does?
– Other engines implement Multi-PV cap feature. More?