understanding economic conditions
DESCRIPTION
Economic analysis of Suffolk County, NYTRANSCRIPT
UNDERSTANDING ECONOMIC CONDITIONS
Daniel Turner
34 S. 4th Avenue
Highland Park, NJ 08904
1 UNDERSTANDING ECONOMIC CONDITIONS
NOVEMBER 2012
PART ONE: CHARACTERISTICS OF THE LOCAL ECONOMY
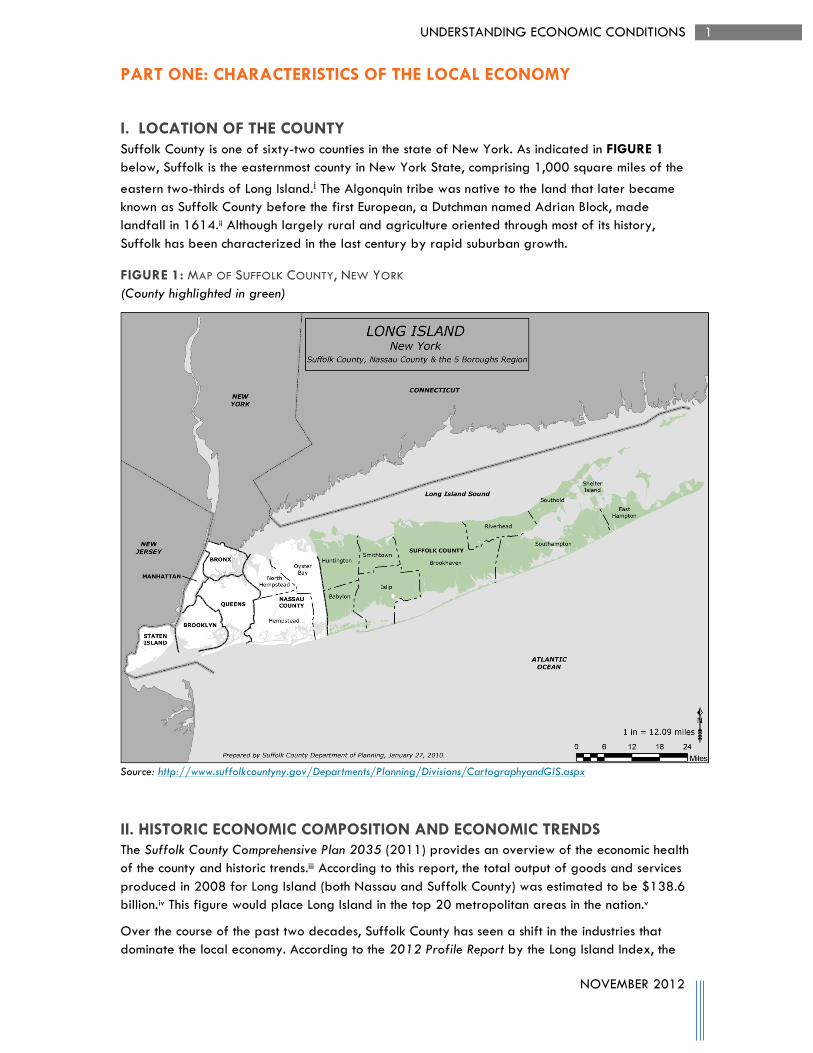
I. LOCATION OF THE COUNTY Suffolk County is one of sixty-two counties in the state of New York. As indicated in FIGURE 1 below, Suffolk is the easternmost county in New York State, comprising 1,000 square miles of the eastern two-thirds of Long Island.i The Algonquin tribe was native to the land that later became known as Suffolk County before the first European, a Dutchman named Adrian Block, made landfall in 1614.ii Although largely rural and agriculture oriented through most of its history, Suffolk has been characterized in the last century by rapid suburban growth.
FIGURE 1: MAP OF SUFFOLK COUNTY, NEW YORK (County highlighted in green)
Source: http://www.suffolkcountyny.gov/Departments/Planning/Divisions/CartographyandGIS.aspx
II. HISTORIC ECONOMIC COMPOSITION AND ECONOMIC TRENDS The Suffolk County Comprehensive Plan 2035 (2011) provides an overview of the economic health of the county and historic trends.iii According to this report, the total output of goods and services produced in 2008 for Long Island (both Nassau and Suffolk County) was estimated to be $138.6 billion.iv This figure would place Long Island in the top 20 metropolitan areas in the nation.v
Over the course of the past two decades, Suffolk County has seen a shift in the industries that dominate the local economy. According to the 2012 Profile Report by the Long Island Index, the
2 UNDERSTANDING ECONOMIC CONDITIONS
NOVEMBER 2012
economy of Long Island was dominated by large firms in the defense and aerospace industry as recently as the 1980’s.vi With the end of the cold war, however, these industries have seen a sharp decline in prominence. However, the research and technology institutions as well as the pool of high skilled labor remain. Between 2005 and 2010, while the manufacturing sector saw a 21.2% decline in the number of jobs on Long Island, the education and health services sectors saw employment rises of 14.4% and 9.3% respectively. vii
According to the Comprehensive Plan, although the loss of defense jobs hurt the long island economy, moving forward Suffolk County can depend on growth in several sectors. These include health, educational and social services, tourism, the arts, and emerging technologies such as bioscience.viii In 2008, the largest employers in Suffolk County were LIJ Health Systems (employing over 31,000 people), the Winthrop Health Systems, Stop and Shop supermarkets and Cablevision, each employing over 6000 people.ix
III. ECONOMIC BASE ANALYSIS 2010: LOCATION QUOTIENTS AND BASE MULTIPLIER
Economic base analysis was a process developed by Robert Murray Haig while working on the Regional Plan of New York in 1928.x In this analysis, a local economy is divided into two sectors: the basis and the non-basic. The basic sector is comprised of firms that depend on factors that external to the region (e.g. manufacturing exports) while the non-basic sector is comprised of firms that are more localized (e.g. drugs stores and restaurants). The central assumption of the Economic Base Theory is that a local economic grows with the presence of basic sector exports that brings money into the local economy and increases the demand for goods and services from non-basic sectors. This theory also hypothesizes that the local economy is stronger when it has more basic sectors because it insulates itself better from local economic downturns.xi
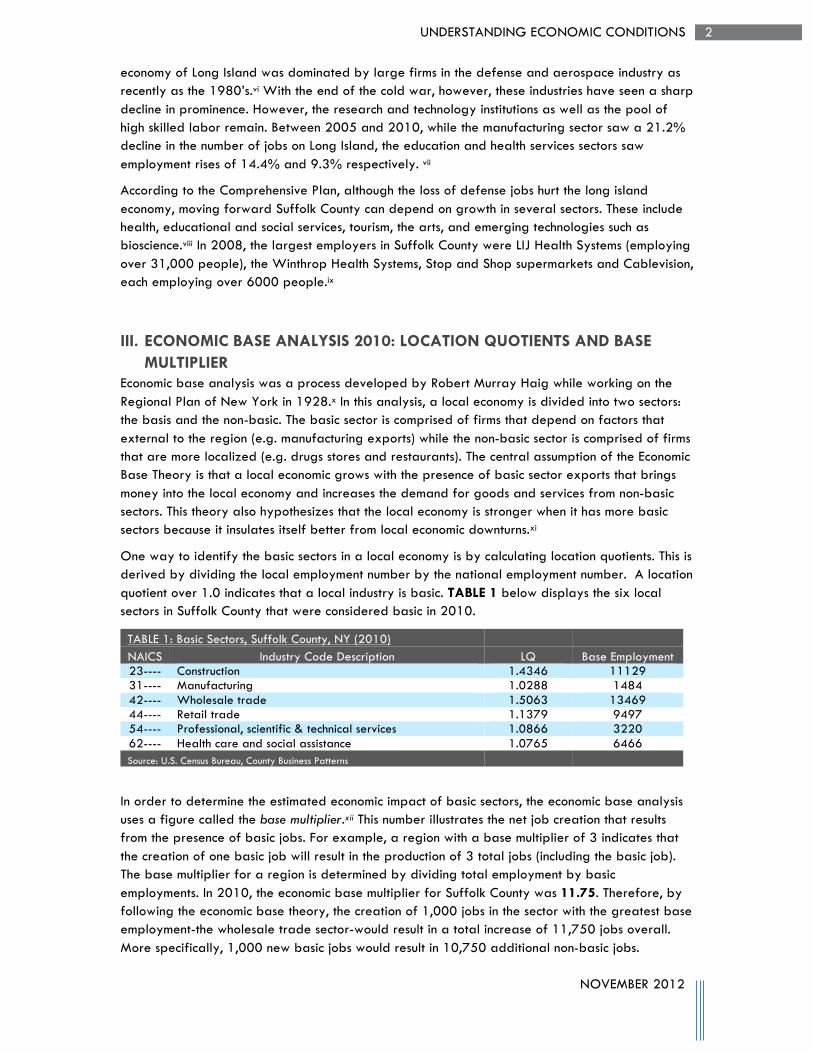
One way to identify the basic sectors in a local economy is by calculating location quotients. This is derived by dividing the local employment number by the national employment number. A location quotient over 1.0 indicates that a local industry is basic. TABLE 1 below displays the six local sectors in Suffolk County that were considered basic in 2010.
TABLE 1: Basic Sectors, Suffolk County, NY (2010) NAICS Industry Code Description LQ Base Employment 23---- Construction 1.4346 11129 31---- Manufacturing 1.0288 1484 42---- Wholesale trade 1.5063 13469 44---- Retail trade 1.1379 9497 54---- Professional, scientific & technical services 1.0866 3220 62---- Health care and social assistance 1.0765 6466 Source: U.S. Census Bureau, County Business Patterns
In order to determine the estimated economic impact of basic sectors, the economic base analysis uses a figure called the base multiplier.xii This number illustrates the net job creation that results from the presence of basic jobs. For example, a region with a base multiplier of 3 indicates that the creation of one basic job will result in the production of 3 total jobs (including the basic job). The base multiplier for a region is determined by dividing total employment by basic employments. In 2010, the economic base multiplier for Suffolk County was 11.75. Therefore, by following the economic base theory, the creation of 1,000 jobs in the sector with the greatest base employment-the wholesale trade sector-would result in a total increase of 11,750 jobs overall. More specifically, 1,000 new basic jobs would result in 10,750 additional non-basic jobs.
3 UNDERSTANDING ECONOMIC CONDITIONS
NOVEMBER 2012
IV. SHIFT-SHARE ANALYSIS 2001-2010 Shift-Share analysis is a technique for examining the sources of change in a regional economy.xiii In order to reveal the relative influence of various economic trends, the shift-share analysis divides employment change into the following three components: (1) National Growth Effect, (2) Industry Mix Effect, and (3) Regional Share Effect.xiv
The National Growth Effect refers to the change in total employment as ascribed to the growth rate for national employment.xv In other words, this determines the extent to which the national economy grew or declined.xvi In order to determine the National Growth Effect on employment in Suffolk County between 2001 and 2010, the national employment growth rate (-0.98%) was multiplied by the local employment in each industry in 2001.
Industry Mix refers to the amount of additional change that region would have occurred in the region had the various industries grown at their relative national rates.xvii To calculate the Industry Mix, the difference between an industry’s national growth rate and the overall national growth rate was multiplied the Suffolk County employment in each industry in the year 2001. The sum of all these figures revealed whether the mix of industries that exist in Suffolk County have experience growth nationally between 2001 and 2010.
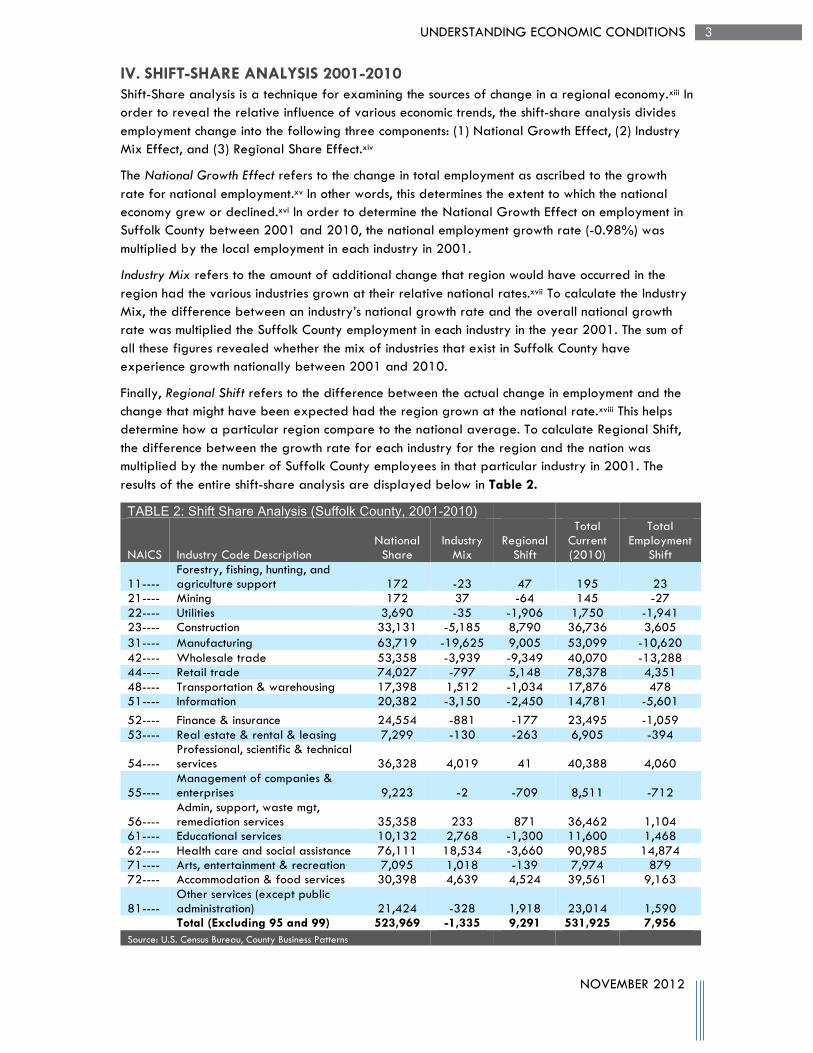
Finally, Regional Shift refers to the difference between the actual change in employment and the change that might have been expected had the region grown at the national rate.xviii This helps determine how a particular region compare to the national average. To calculate Regional Shift, the difference between the growth rate for each industry for the region and the nation was multiplied by the number of Suffolk County employees in that particular industry in 2001. The results of the entire shift-share analysis are displayed below in Table 2.
TABLE 2: Shift Share Analysis (Suffolk County, 2001-2010)
NAICS Industry Code Description National
Share Industry
Mix Regional
Shift
Total Current (2010)
Total Employment
Shift
11---- Forestry, fishing, hunting, and agriculture support 172 -23 47 195 23
21---- Mining 172 37 -64 145 -27 22---- Utilities 3,690 -35 -1,906 1,750 -1,941 23---- Construction 33,131 -5,185 8,790 36,736 3,605 31---- Manufacturing 63,719 -19,625 9,005 53,099 -10,620 42---- Wholesale trade 53,358 -3,939 -9,349 40,070 -13,288 44---- Retail trade 74,027 -797 5,148 78,378 4,351 48---- Transportation & warehousing 17,398 1,512 -1,034 17,876 478 51---- Information 20,382 -3,150 -2,450 14,781 -5,601 52---- Finance & insurance 24,554 -881 -177 23,495 -1,059 53---- Real estate & rental & leasing 7,299 -130 -263 6,905 -394
54---- Professional, scientific & technical services 36,328 4,019 41 40,388 4,060
55---- Management of companies & enterprises 9,223 -2 -709 8,511 -712
56---- Admin, support, waste mgt, remediation services 35,358 233 871 36,462 1,104
61---- Educational services 10,132 2,768 -1,300 11,600 1,468 62---- Health care and social assistance 76,111 18,534 -3,660 90,985 14,874 71---- Arts, entertainment & recreation 7,095 1,018 -139 7,974 879 72---- Accommodation & food services 30,398 4,639 4,524 39,561 9,163
81---- Other services (except public administration) 21,424 -328 1,918 23,014 1,590
Total (Excluding 95 and 99) 523,969 -1,335 9,291 531,925 7,956
Source: U.S. Census Bureau, County Business Patterns
4 UNDERSTANDING ECONOMIC CONDITIONS
NOVEMBER 2012
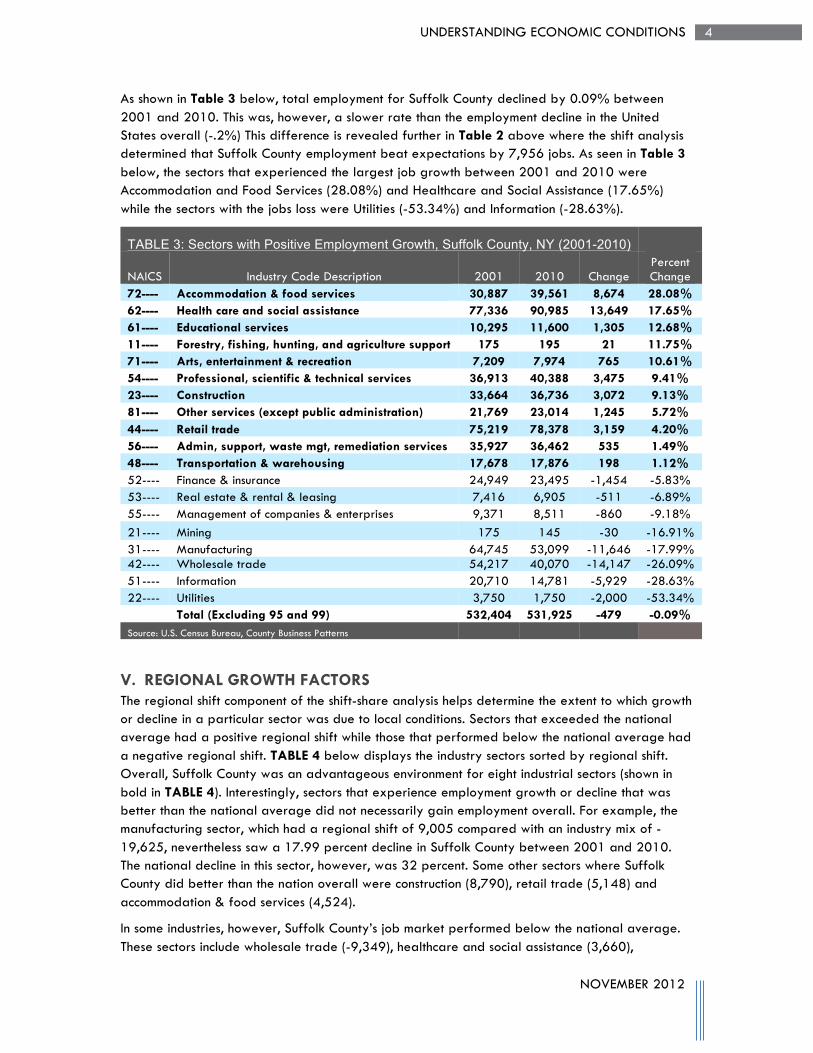
As shown in Table 3 below, total employment for Suffolk County declined by 0.09% between 2001 and 2010. This was, however, a slower rate than the employment decline in the United States overall (-.2%) This difference is revealed further in Table 2 above where the shift analysis determined that Suffolk County employment beat expectations by 7,956 jobs. As seen in Table 3 below, the sectors that experienced the largest job growth between 2001 and 2010 were Accommodation and Food Services (28.08%) and Healthcare and Social Assistance (17.65%) while the sectors with the jobs loss were Utilities (-53.34%) and Information (-28.63%).
TABLE 3: Sectors with Positive Employment Growth, Suffolk County, NY (2001-2010)
NAICS Industry Code Description 2001 2010 Change Percent Change
72---- Accommodation & food services 30,887 39,561 8,674 28.08% 62---- Health care and social assistance 77,336 90,985 13,649 17.65% 61---- Educational services 10,295 11,600 1,305 12.68% 11---- Forestry, fishing, hunting, and agriculture support 175 195 21 11.75% 71---- Arts, entertainment & recreation 7,209 7,974 765 10.61% 54---- Professional, scientific & technical services 36,913 40,388 3,475 9.41% 23---- Construction 33,664 36,736 3,072 9.13% 81---- Other services (except public administration) 21,769 23,014 1,245 5.72% 44---- Retail trade 75,219 78,378 3,159 4.20% 56---- Admin, support, waste mgt, remediation services 35,927 36,462 535 1.49% 48---- Transportation & warehousing 17,678 17,876 198 1.12% 52---- Finance & insurance 24,949 23,495 -1,454 -5.83% 53---- Real estate & rental & leasing 7,416 6,905 -511 -6.89% 55---- Management of companies & enterprises 9,371 8,511 -860 -9.18% 21---- Mining 175 145 -30 -16.91% 31---- Manufacturing 64,745 53,099 -11,646 -17.99% 42---- Wholesale trade 54,217 40,070 -14,147 -26.09% 51---- Information 20,710 14,781 -5,929 -28.63% 22---- Utilities 3,750 1,750 -2,000 -53.34%
Total (Excluding 95 and 99) 532,404 531,925 -479 -0.09%
Source: U.S. Census Bureau, County Business Patterns
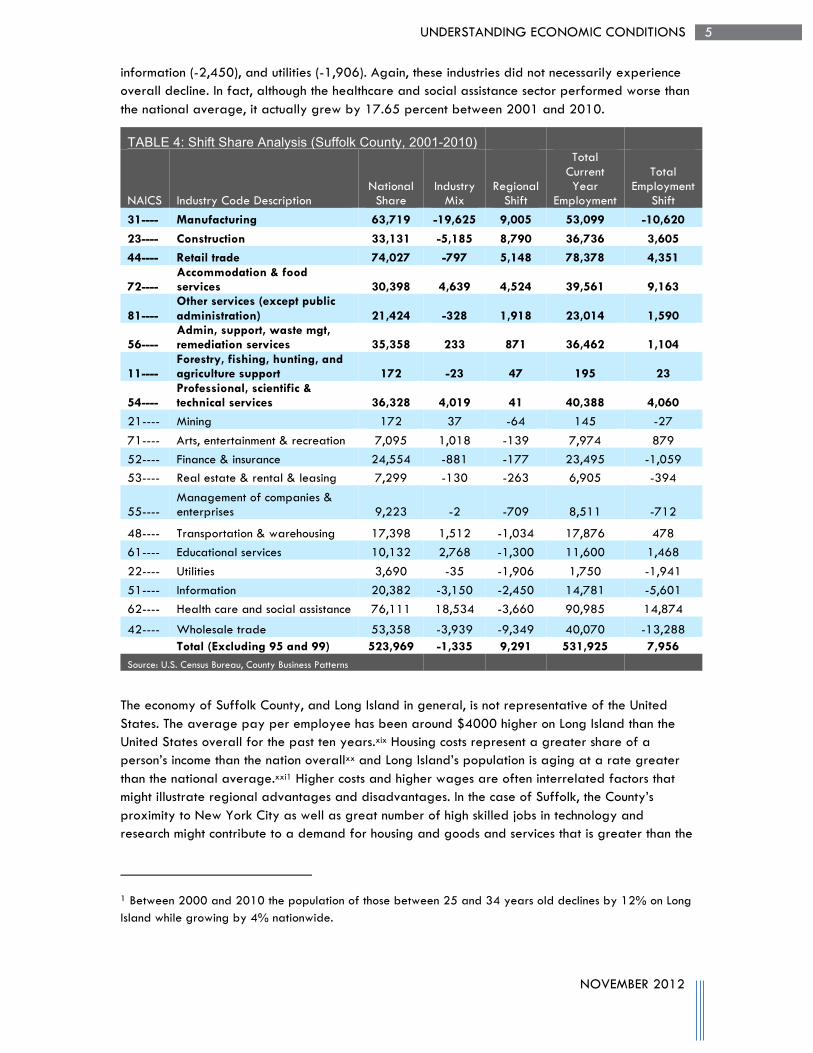
V. REGIONAL GROWTH FACTORS The regional shift component of the shift-share analysis helps determine the extent to which growth or decline in a particular sector was due to local conditions. Sectors that exceeded the national average had a positive regional shift while those that performed below the national average had a negative regional shift. TABLE 4 below displays the industry sectors sorted by regional shift. Overall, Suffolk County was an advantageous environment for eight industrial sectors (shown in bold in TABLE 4). Interestingly, sectors that experience employment growth or decline that was better than the national average did not necessarily gain employment overall. For example, the manufacturing sector, which had a regional shift of 9,005 compared with an industry mix of -19,625, nevertheless saw a 17.99 percent decline in Suffolk County between 2001 and 2010. The national decline in this sector, however, was 32 percent. Some other sectors where Suffolk County did better than the nation overall were construction (8,790), retail trade (5,148) and accommodation & food services (4,524).
In some industries, however, Suffolk County’s job market performed below the national average. These sectors include wholesale trade (-9,349), healthcare and social assistance (3,660),
5 UNDERSTANDING ECONOMIC CONDITIONS
NOVEMBER 2012
information (-2,450), and utilities (-1,906). Again, these industries did not necessarily experience overall decline. In fact, although the healthcare and social assistance sector performed worse than the national average, it actually grew by 17.65 percent between 2001 and 2010.
TABLE 4: Shift Share Analysis (Suffolk County, 2001-2010)
NAICS Industry Code Description National
Share Industry
Mix Regional
Shift
Total Current Year
Employment
Total Employment
Shift 31---- Manufacturing 63,719 -19,625 9,005 53,099 -10,620
23---- Construction 33,131 -5,185 8,790 36,736 3,605
44---- Retail trade 74,027 -797 5,148 78,378 4,351
72---- Accommodation & food services 30,398 4,639 4,524 39,561 9,163
81---- Other services (except public administration) 21,424 -328 1,918 23,014 1,590
56---- Admin, support, waste mgt, remediation services 35,358 233 871 36,462 1,104
11---- Forestry, fishing, hunting, and agriculture support 172 -23 47 195 23
54---- Professional, scientific & technical services 36,328 4,019 41 40,388 4,060
21---- Mining 172 37 -64 145 -27 71---- Arts, entertainment & recreation 7,095 1,018 -139 7,974 879 52---- Finance & insurance 24,554 -881 -177 23,495 -1,059 53---- Real estate & rental & leasing 7,299 -130 -263 6,905 -394
55---- Management of companies & enterprises 9,223 -2 -709 8,511 -712
48---- Transportation & warehousing 17,398 1,512 -1,034 17,876 478 61---- Educational services 10,132 2,768 -1,300 11,600 1,468 22---- Utilities 3,690 -35 -1,906 1,750 -1,941 51---- Information 20,382 -3,150 -2,450 14,781 -5,601 62---- Health care and social assistance 76,111 18,534 -3,660 90,985 14,874
42---- Wholesale trade 53,358 -3,939 -9,349 40,070 -13,288
Total (Excluding 95 and 99) 523,969 -1,335 9,291 531,925 7,956
Source: U.S. Census Bureau, County Business Patterns
The economy of Suffolk County, and Long Island in general, is not representative of the United States. The average pay per employee has been around $4000 higher on Long Island than the United States overall for the past ten years.xix Housing costs represent a greater share of a person’s income than the nation overallxx and Long Island’s population is aging at a rate greater than the national average.xxi1 Higher costs and higher wages are often interrelated factors that might illustrate regional advantages and disadvantages. In the case of Suffolk, the County’s proximity to New York City as well as great number of high skilled jobs in technology and research might contribute to a demand for housing and goods and services that is greater than the
1 Between 2000 and 2010 the population of those between 25 and 34 years old declines by 12% on Long Island while growing by 4% nationwide.
6 UNDERSTANDING ECONOMIC CONDITIONS
NOVEMBER 2012
nation overall. This might be a possible explanation for the regions relative advantage as compared to the nation in the manufacturing, construction and retail trade sectors.
However, Suffolk County’s advantages can also be seen as its disadvantages. The high cost of real estate in the County makes the cost of doing business there high. These costs, along with constraints on space that exist because of natural barriers, might make Suffolk County a difficult place to attract new firms. This might explain the region’s disadvantage in the health care and social assistance industry as well as the information, utilities, and educational services industries.
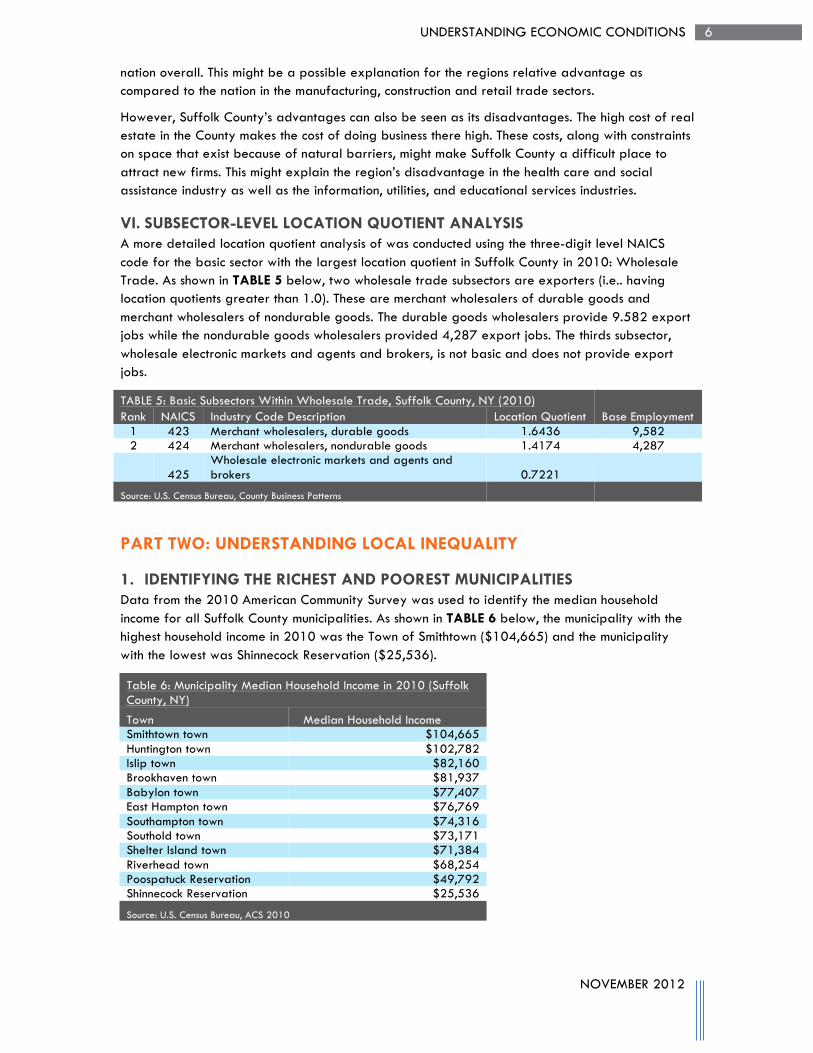
VI. SUBSECTOR-LEVEL LOCATION QUOTIENT ANALYSIS A more detailed location quotient analysis of was conducted using the three-digit level NAICS code for the basic sector with the largest location quotient in Suffolk County in 2010: Wholesale Trade. As shown in TABLE 5 below, two wholesale trade subsectors are exporters (i.e.. having location quotients greater than 1.0). These are merchant wholesalers of durable goods and merchant wholesalers of nondurable goods. The durable goods wholesalers provide 9.582 export jobs while the nondurable goods wholesalers provided 4,287 export jobs. The thirds subsector, wholesale electronic markets and agents and brokers, is not basic and does not provide export jobs.
TABLE 5: Basic Subsectors Within Wholesale Trade, Suffolk County, NY (2010) Rank NAICS Industry Code Description Location Quotient Base Employment
1 423 Merchant wholesalers, durable goods 1.6436 9,582 2 424 Merchant wholesalers, nondurable goods 1.4174 4,287
425 Wholesale electronic markets and agents and brokers 0.7221
Source: U.S. Census Bureau, County Business Patterns
PART TWO: UNDERSTANDING LOCAL INEQUALITY
1. IDENTIFYING THE RICHEST AND POOREST MUNICIPALITIES Data from the 2010 American Community Survey was used to identify the median household income for all Suffolk County municipalities. As shown in TABLE 6 below, the municipality with the highest household income in 2010 was the Town of Smithtown ($104,665) and the municipality with the lowest was Shinnecock Reservation ($25,536).
Table 6: Municipality Median Household Income in 2010 (Suffolk County, NY)
Town Median Household Income Smithtown town $104,665 Huntington town $102,782 Islip town $82,160 Brookhaven town $81,937 Babylon town $77,407 East Hampton town $76,769 Southampton town $74,316 Southold town $73,171 Shelter Island town $71,384 Riverhead town $68,254 Poospatuck Reservation $49,792 Shinnecock Reservation $25,536
Source: U.S. Census Bureau, ACS 2010
7 UNDERSTANDING ECONOMIC CONDITIONS
NOVEMBER 2012
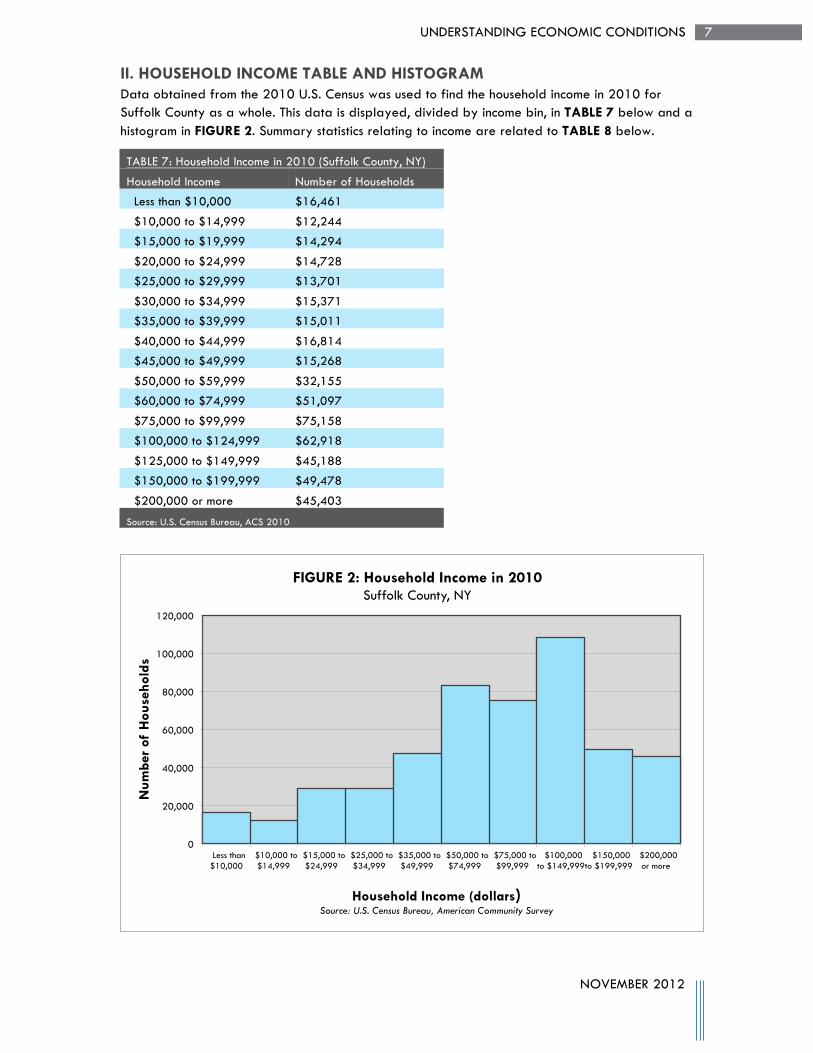
II. HOUSEHOLD INCOME TABLE AND HISTOGRAM Data obtained from the 2010 U.S. Census was used to find the household income in 2010 for Suffolk County as a whole. This data is displayed, divided by income bin, in TABLE 7 below and a histogram in FIGURE 2. Summary statistics relating to income are related to TABLE 8 below.
TABLE 7: Household Income in 2010 (Suffolk County, NY)
Household Income Number of Households
Less than $10,000 $16,461
$10,000 to $14,999 $12,244
$15,000 to $19,999 $14,294
$20,000 to $24,999 $14,728
$25,000 to $29,999 $13,701
$30,000 to $34,999 $15,371
$35,000 to $39,999 $15,011
$40,000 to $44,999 $16,814
$45,000 to $49,999 $15,268
$50,000 to $59,999 $32,155
$60,000 to $74,999 $51,097
$75,000 to $99,999 $75,158
$100,000 to $124,999 $62,918
$125,000 to $149,999 $45,188
$150,000 to $199,999 $49,478
$200,000 or more $45,403
Source: U.S. Census Bureau, ACS 2010
0
20,000
40,000
60,000
80,000
100,000
120,000
Less than $10,000
$10,000 to $14,999
$15,000 to $24,999
$25,000 to $34,999
$35,000 to $49,999
$50,000 to $74,999
$75,000 to $99,999
$100,000 to $149,999
$150,000 to $199,999
$200,000 or more
Num
ber
of H
ouse
hold
s
Household Income (dollars) Source: U.S. Census Bureau, American Community Survey
FIGURE 2: Household Income in 2010 Suffolk County, NY
8 UNDERSTANDING ECONOMIC CONDITIONS
NOVEMBER 2012
TABLE 8: Summary Statistics, Household Income in 2010 (Suffolk County, NY)
Category Result
Total Households 495,289
Total Income $51,781,351,900
Mean Household Income $104,548
Median Household Income $77,500
Mode Household Income $87,500
Variance $6,691,984,540
Standard Deviation $81,805
Coefficient of Variation 0.78
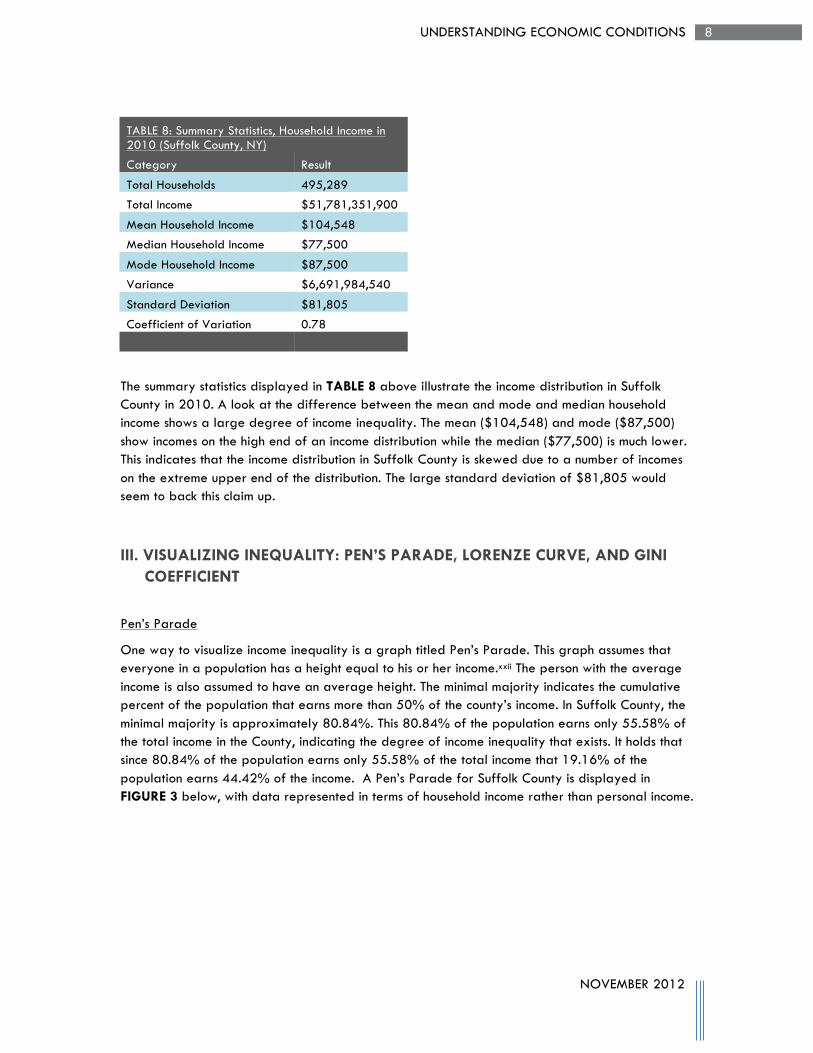
The summary statistics displayed in TABLE 8 above illustrate the income distribution in Suffolk County in 2010. A look at the difference between the mean and mode and median household income shows a large degree of income inequality. The mean ($104,548) and mode ($87,500) show incomes on the high end of an income distribution while the median ($77,500) is much lower. This indicates that the income distribution in Suffolk County is skewed due to a number of incomes on the extreme upper end of the distribution. The large standard deviation of $81,805 would seem to back this claim up.
III. VISUALIZING INEQUALITY: PEN’S PARADE, LORENZE CURVE, AND GINI COEFFICIENT
Pen’s Parade
One way to visualize income inequality is a graph titled Pen’s Parade. This graph assumes that everyone in a population has a height equal to his or her income.xxii The person with the average income is also assumed to have an average height. The minimal majority indicates the cumulative percent of the population that earns more than 50% of the county’s income. In Suffolk County, the minimal majority is approximately 80.84%. This 80.84% of the population earns only 55.58% of the total income in the County, indicating the degree of income inequality that exists. It holds that since 80.84% of the population earns only 55.58% of the total income that 19.16% of the population earns 44.42% of the income. A Pen’s Parade for Suffolk County is displayed in FIGURE 3 below, with data represented in terms of household income rather than personal income.
9 UNDERSTANDING ECONOMIC CONDITIONS
NOVEMBER 2012
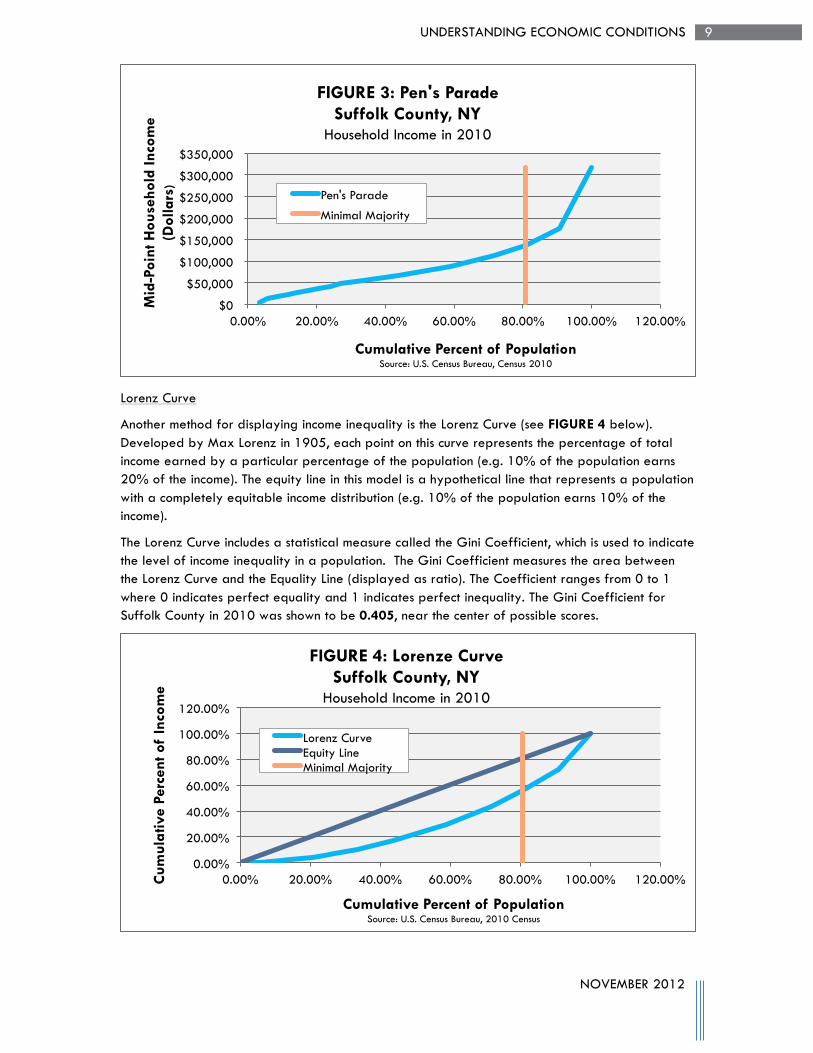
Lorenz Curve
Another method for displaying income inequality is the Lorenz Curve (see FIGURE 4 below). Developed by Max Lorenz in 1905, each point on this curve represents the percentage of total income earned by a particular percentage of the population (e.g. 10% of the population earns 20% of the income). The equity line in this model is a hypothetical line that represents a population with a completely equitable income distribution (e.g. 10% of the population earns 10% of the income).
The Lorenz Curve includes a statistical measure called the Gini Coefficient, which is used to indicate the level of income inequality in a population. The Gini Coefficient measures the area between the Lorenz Curve and the Equality Line (displayed as ratio). The Coefficient ranges from 0 to 1 where 0 indicates perfect equality and 1 indicates perfect inequality. The Gini Coefficient for Suffolk County in 2010 was shown to be 0.405, near the center of possible scores.
$0
$50,000
$100,000
$150,000
$200,000
$250,000
$300,000
$350,000
0.00% 20.00% 40.00% 60.00% 80.00% 100.00% 120.00%
Mid
-Poi
nt H
ouse
hold
Inco
me
(Dol
lars
)
Cumulative Percent of Population Source: U.S. Census Bureau, Census 2010
FIGURE 3: Pen's Parade Suffolk County, NY
Household Income in 2010
Pen's Parade
Minimal Majority
0.00%
20.00%
40.00%
60.00%
80.00%
100.00%
120.00%
0.00% 20.00% 40.00% 60.00% 80.00% 100.00% 120.00% Cum
ulat
ive
Perc
ent o
f In
com
e
Cumulative Percent of Population Source: U.S. Census Bureau, 2010 Census
FIGURE 4: Lorenze Curve Suffolk County, NY
Household Income in 2010
Lorenz Curve Equity Line Minimal Majority
10 UNDERSTANDING ECONOMIC CONDITIONS
NOVEMBER 2012
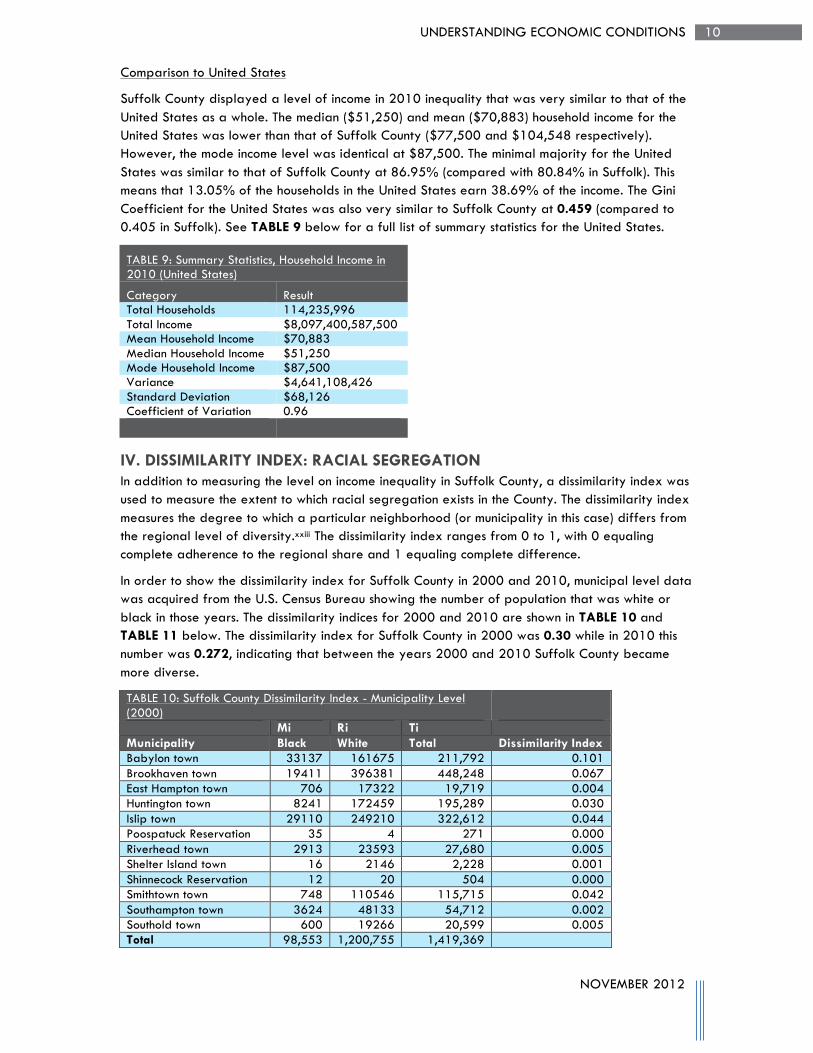
Comparison to United States
Suffolk County displayed a level of income in 2010 inequality that was very similar to that of the United States as a whole. The median ($51,250) and mean ($70,883) household income for the United States was lower than that of Suffolk County ($77,500 and $104,548 respectively). However, the mode income level was identical at $87,500. The minimal majority for the United States was similar to that of Suffolk County at 86.95% (compared with 80.84% in Suffolk). This means that 13.05% of the households in the United States earn 38.69% of the income. The Gini Coefficient for the United States was also very similar to Suffolk County at 0.459 (compared to 0.405 in Suffolk). See TABLE 9 below for a full list of summary statistics for the United States.
TABLE 9: Summary Statistics, Household Income in 2010 (United States)
Category Result Total Households 114,235,996 Total Income $8,097,400,587,500 Mean Household Income $70,883 Median Household Income $51,250 Mode Household Income $87,500 Variance $4,641,108,426 Standard Deviation $68,126 Coefficient of Variation 0.96
IV. DISSIMILARITY INDEX: RACIAL SEGREGATION In addition to measuring the level on income inequality in Suffolk County, a dissimilarity index was used to measure the extent to which racial segregation exists in the County. The dissimilarity index measures the degree to which a particular neighborhood (or municipality in this case) differs from the regional level of diversity.xxiii The dissimilarity index ranges from 0 to 1, with 0 equaling complete adherence to the regional share and 1 equaling complete difference.
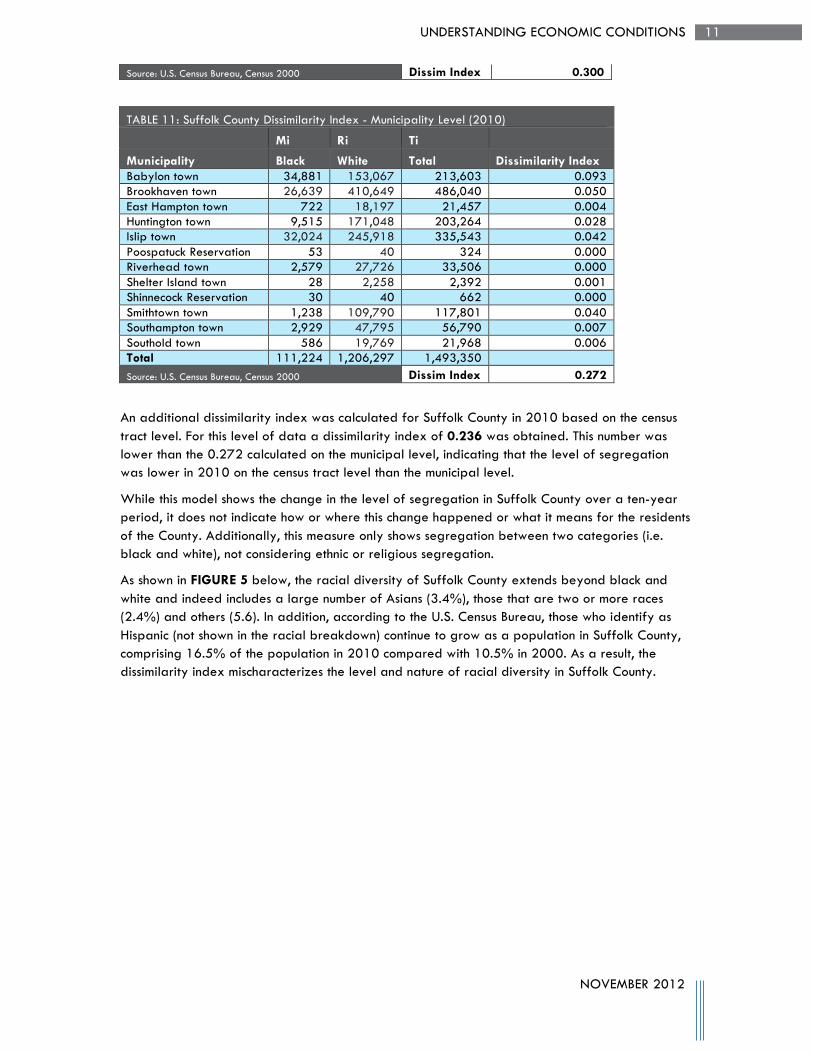
In order to show the dissimilarity index for Suffolk County in 2000 and 2010, municipal level data was acquired from the U.S. Census Bureau showing the number of population that was white or black in those years. The dissimilarity indices for 2000 and 2010 are shown in TABLE 10 and TABLE 11 below. The dissimilarity index for Suffolk County in 2000 was 0.30 while in 2010 this number was 0.272, indicating that between the years 2000 and 2010 Suffolk County became more diverse.
TABLE 10: Suffolk County Dissimilarity Index - Municipality Level (2000) Mi Ri Ti Municipality Black White Total Dissimilarity Index Babylon town 33137 161675 211,792 0.101 Brookhaven town 19411 396381 448,248 0.067 East Hampton town 706 17322 19,719 0.004 Huntington town 8241 172459 195,289 0.030 Islip town 29110 249210 322,612 0.044 Poospatuck Reservation 35 4 271 0.000 Riverhead town 2913 23593 27,680 0.005 Shelter Island town 16 2146 2,228 0.001 Shinnecock Reservation 12 20 504 0.000 Smithtown town 748 110546 115,715 0.042 Southampton town 3624 48133 54,712 0.002 Southold town 600 19266 20,599 0.005 Total 98,553 1,200,755 1,419,369
11 UNDERSTANDING ECONOMIC CONDITIONS
NOVEMBER 2012
Source: U.S. Census Bureau, Census 2000 Dissim Index 0.300
TABLE 11: Suffolk County Dissimilarity Index - Municipality Level (2010)
Mi Ri Ti
Municipality Black White Total Dissimilarity Index Babylon town 34,881 153,067 213,603 0.093 Brookhaven town 26,639 410,649 486,040 0.050 East Hampton town 722 18,197 21,457 0.004 Huntington town 9,515 171,048 203,264 0.028 Islip town 32,024 245,918 335,543 0.042 Poospatuck Reservation 53 40 324 0.000 Riverhead town 2,579 27,726 33,506 0.000 Shelter Island town 28 2,258 2,392 0.001 Shinnecock Reservation 30 40 662 0.000 Smithtown town 1,238 109,790 117,801 0.040 Southampton town 2,929 47,795 56,790 0.007 Southold town 586 19,769 21,968 0.006 Total 111,224 1,206,297 1,493,350 Source: U.S. Census Bureau, Census 2000 Dissim Index 0.272
An additional dissimilarity index was calculated for Suffolk County in 2010 based on the census tract level. For this level of data a dissimilarity index of 0.236 was obtained. This number was lower than the 0.272 calculated on the municipal level, indicating that the level of segregation was lower in 2010 on the census tract level than the municipal level.
While this model shows the change in the level of segregation in Suffolk County over a ten-year period, it does not indicate how or where this change happened or what it means for the residents of the County. Additionally, this measure only shows segregation between two categories (i.e. black and white), not considering ethnic or religious segregation.
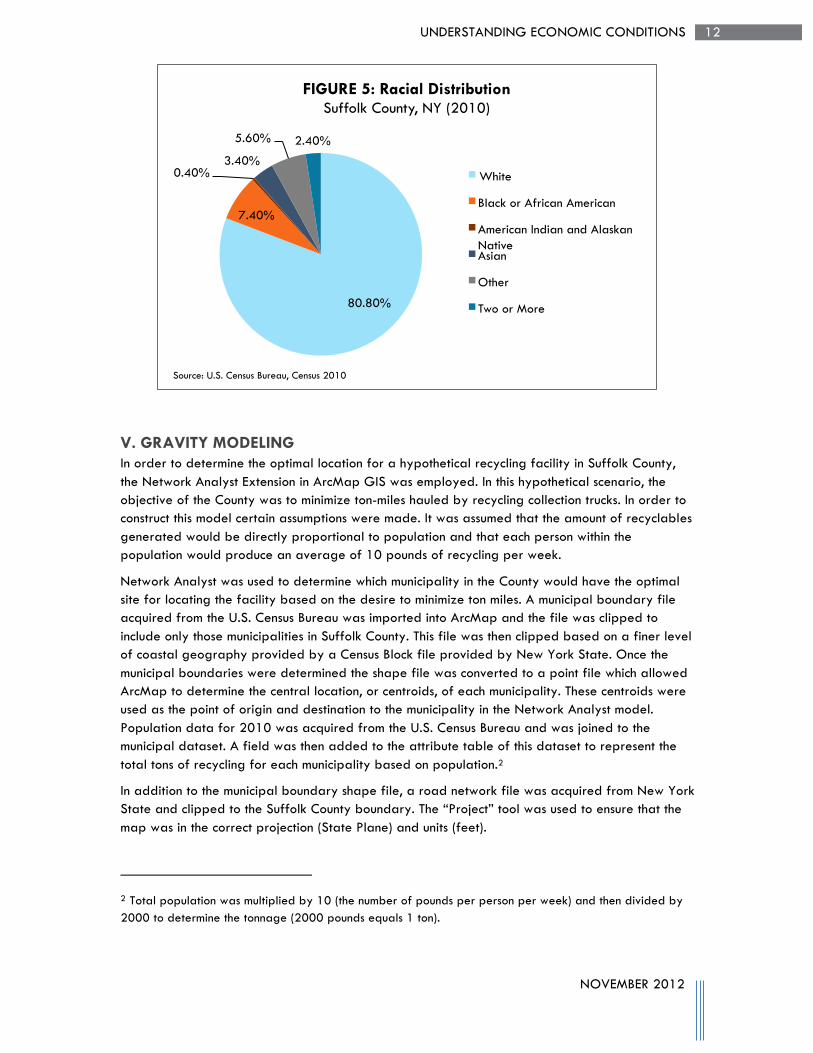
As shown in FIGURE 5 below, the racial diversity of Suffolk County extends beyond black and white and indeed includes a large number of Asians (3.4%), those that are two or more races (2.4%) and others (5.6). In addition, according to the U.S. Census Bureau, those who identify as Hispanic (not shown in the racial breakdown) continue to grow as a population in Suffolk County, comprising 16.5% of the population in 2010 compared with 10.5% in 2000. As a result, the dissimilarity index mischaracterizes the level and nature of racial diversity in Suffolk County.
12 UNDERSTANDING ECONOMIC CONDITIONS
NOVEMBER 2012
V. GRAVITY MODELING In order to determine the optimal location for a hypothetical recycling facility in Suffolk County, the Network Analyst Extension in ArcMap GIS was employed. In this hypothetical scenario, the objective of the County was to minimize ton-miles hauled by recycling collection trucks. In order to construct this model certain assumptions were made. It was assumed that the amount of recyclables generated would be directly proportional to population and that each person within the population would produce an average of 10 pounds of recycling per week.
Network Analyst was used to determine which municipality in the County would have the optimal site for locating the facility based on the desire to minimize ton miles. A municipal boundary file acquired from the U.S. Census Bureau was imported into ArcMap and the file was clipped to include only those municipalities in Suffolk County. This file was then clipped based on a finer level of coastal geography provided by a Census Block file provided by New York State. Once the municipal boundaries were determined the shape file was converted to a point file which allowed ArcMap to determine the central location, or centroids, of each municipality. These centroids were used as the point of origin and destination to the municipality in the Network Analyst model. Population data for 2010 was acquired from the U.S. Census Bureau and was joined to the municipal dataset. A field was then added to the attribute table of this dataset to represent the total tons of recycling for each municipality based on population.2
In addition to the municipal boundary shape file, a road network file was acquired from New York State and clipped to the Suffolk County boundary. The “Project” tool was used to ensure that the map was in the correct projection (State Plane) and units (feet).
2 Total population was multiplied by 10 (the number of pounds per person per week) and then divided by 2000 to determine the tonnage (2000 pounds equals 1 ton).
80.80%
7.40%
0.40% 3.40%
5.60% 2.40%
FIGURE 5: Racial Distribution Suffolk County, NY (2010)
White
Black or African American
American Indian and Alaskan Native Asian
Other
Two or More
Source: U.S. Census Bureau, Census 2010
13 UNDERSTANDING ECONOMIC CONDITIONS
NOVEMBER 2012
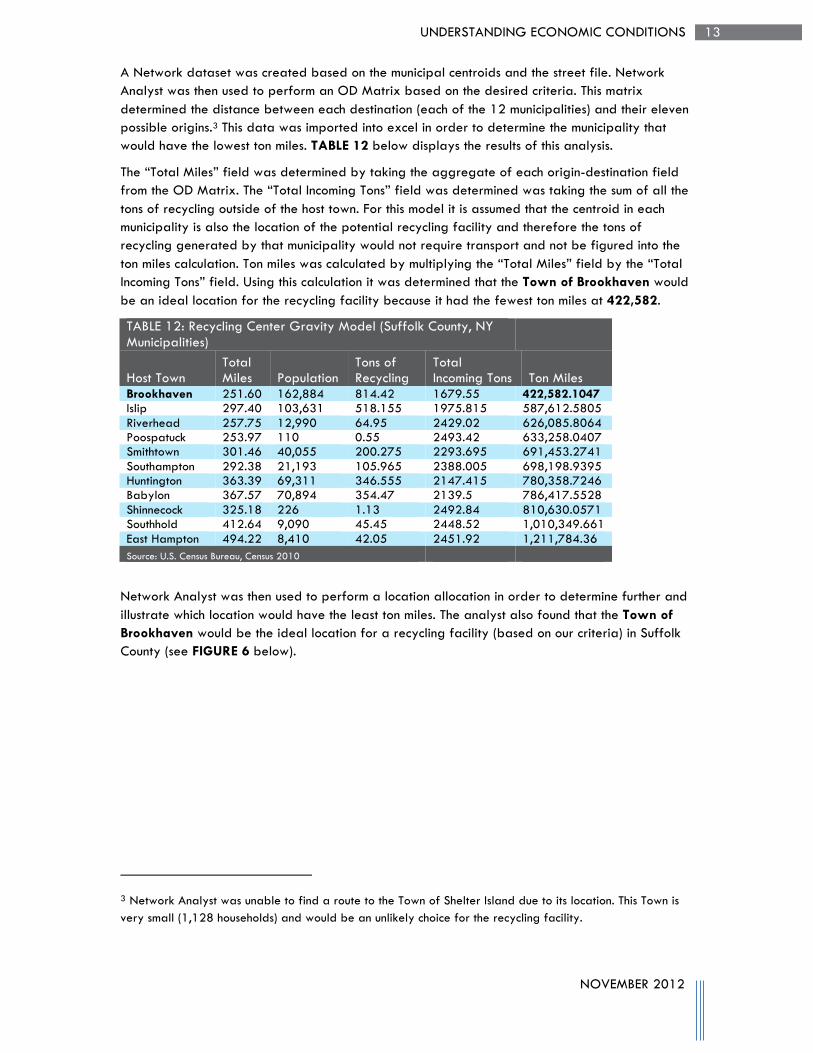
A Network dataset was created based on the municipal centroids and the street file. Network Analyst was then used to perform an OD Matrix based on the desired criteria. This matrix determined the distance between each destination (each of the 12 municipalities) and their eleven possible origins.3 This data was imported into excel in order to determine the municipality that would have the lowest ton miles. TABLE 12 below displays the results of this analysis.
The “Total Miles” field was determined by taking the aggregate of each origin-destination field from the OD Matrix. The “Total Incoming Tons” field was determined was taking the sum of all the tons of recycling outside of the host town. For this model it is assumed that the centroid in each municipality is also the location of the potential recycling facility and therefore the tons of recycling generated by that municipality would not require transport and not be figured into the ton miles calculation. Ton miles was calculated by multiplying the “Total Miles” field by the “Total Incoming Tons” field. Using this calculation it was determined that the Town of Brookhaven would be an ideal location for the recycling facility because it had the fewest ton miles at 422,582.
TABLE 12: Recycling Center Gravity Model (Suffolk County, NY Municipalities)
Host Town Total Miles Population
Tons of Recycling
Total Incoming Tons Ton Miles
Brookhaven 251.60 162,884 814.42 1679.55 422,582.1047 Islip 297.40 103,631 518.155 1975.815 587,612.5805 Riverhead 257.75 12,990 64.95 2429.02 626,085.8064 Poospatuck 253.97 110 0.55 2493.42 633,258.0407 Smithtown 301.46 40,055 200.275 2293.695 691,453.2741 Southampton 292.38 21,193 105.965 2388.005 698,198.9395 Huntington 363.39 69,311 346.555 2147.415 780,358.7246 Babylon 367.57 70,894 354.47 2139.5 786,417.5528 Shinnecock 325.18 226 1.13 2492.84 810,630.0571 Southhold 412.64 9,090 45.45 2448.52 1,010,349.661 East Hampton 494.22 8,410 42.05 2451.92 1,211,784.36 Source: U.S. Census Bureau, Census 2010
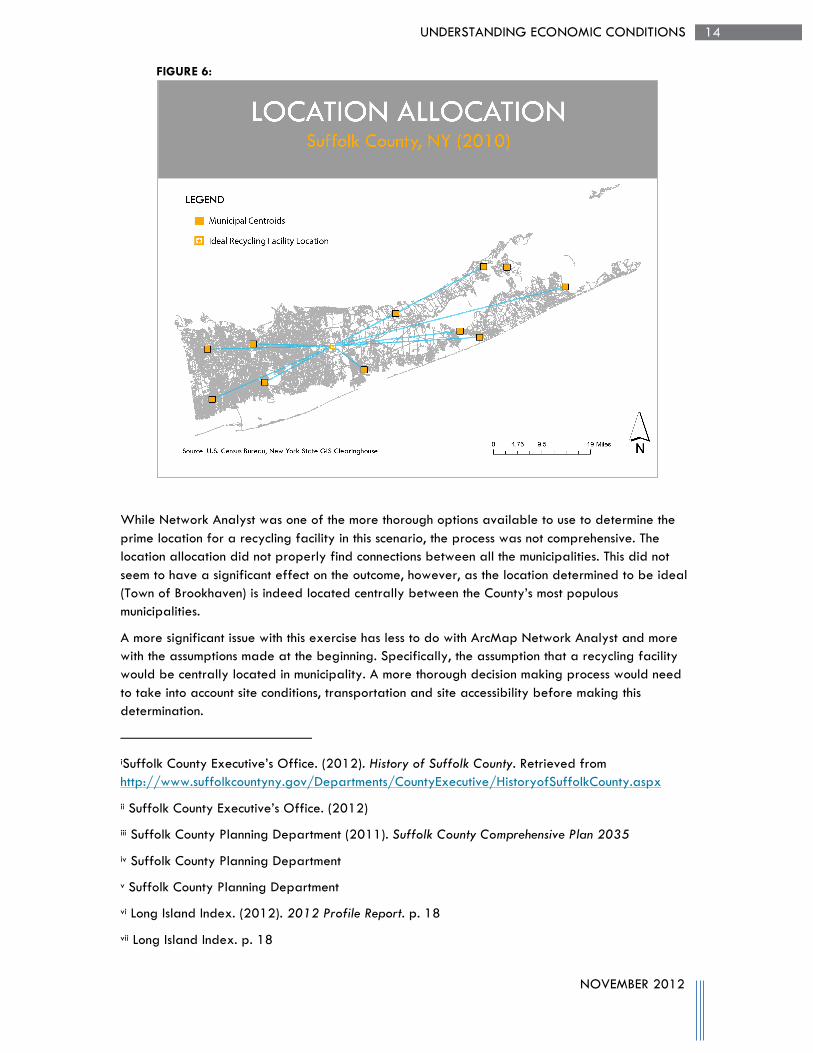
Network Analyst was then used to perform a location allocation in order to determine further and illustrate which location would have the least ton miles. The analyst also found that the Town of Brookhaven would be the ideal location for a recycling facility (based on our criteria) in Suffolk County (see FIGURE 6 below).
3 Network Analyst was unable to find a route to the Town of Shelter Island due to its location. This Town is very small (1,128 households) and would be an unlikely choice for the recycling facility.
14 UNDERSTANDING ECONOMIC CONDITIONS
NOVEMBER 2012
FIGURE 6:
While Network Analyst was one of the more thorough options available to use to determine the prime location for a recycling facility in this scenario, the process was not comprehensive. The location allocation did not properly find connections between all the municipalities. This did not seem to have a significant effect on the outcome, however, as the location determined to be ideal (Town of Brookhaven) is indeed located centrally between the County’s most populous municipalities.
A more significant issue with this exercise has less to do with ArcMap Network Analyst and more with the assumptions made at the beginning. Specifically, the assumption that a recycling facility would be centrally located in municipality. A more thorough decision making process would need to take into account site conditions, transportation and site accessibility before making this determination.
iSuffolk County Executive’s Office. (2012). History of Suffolk County. Retrieved from http://www.suffolkcountyny.gov/Departments/CountyExecutive/HistoryofSuffolkCounty.aspx
ii Suffolk County Executive’s Office. (2012)
iii Suffolk County Planning Department (2011). Suffolk County Comprehensive Plan 2035
iv Suffolk County Planning Department
v Suffolk County Planning Department
vi Long Island Index. (2012). 2012 Profile Report. p. 18
vii Long Island Index. p. 18
15 UNDERSTANDING ECONOMIC CONDITIONS
NOVEMBER 2012
viii Suffolk County Planning Department. p. 3-2
ix Suffolk County Planning Department. p. 3-3
x Wikipedia.org. (2012). Economic Base Analysis. Retrieved from http://en.wikipedia.org/wiki/Economic_base_analysis
xi Florida State University Department of Urban and Regional Planning. (2012). Economic Base Theory. Retrieved from http://mailer.fsu.edu/~tchapin/garnet-tchapin/urp5261/topics/econbase.htm
xii Bendavid-Val, A. (1991). Economic Base Analysis. In Regional and Local Economic Analysis for Practioners, 4th edition. Westport, CT: Praeger Publishers: pg. 78
xiii In-Class Presentation. Shift Share. Slide 2
xiv ibid. slide 3
xv ibid
xvi ibid. slide 9
xvii Ibid. slide 3
xviii ibid.
xix Long Island Index. p. 19
xx ibid. p. 8
xxi ibid. p. 5
xxii Cowell, F. A. (1995). Charting Inequality. In Measuring Inequality, 2nd edition. New York, NY: Prentice Hall/Harvester Wheatsheaf: pg. 16
xxiii In-Class Presentation. Inequality. Slide 46