understanding financial statements · statement of funds flow a statement, prepared for a specific...
TRANSCRIPT

UNDERSTANDING AND
USING FINANCIAL
STATEMENTS
Presented by
SCORE®
Indianapolis Chapter 1
THE BUSINESS
“REPORT CARDS”
Financial Statements are the report cards
of a business. They portray the activities of a
business to third parties, such as investors,
banks and creditors.
Most important of all, however, these
Report Cards are the most significant tools
that a business owner has available to
successfully manage his or her business. 2

Why Learn About Financials?
Two very good reasons:
1. To help you better understand and
manage your business activities, and
2. To provide those who have a financial
stake in your business (partners, other
owners or banks) vital information about
your business problems or achievements
3

WHAT ARE
FINANCIAL STATEMENTS?
There are four major financial
statements:
• Income Statement (or Profit & Loss)
• Balance Sheet
• Statement of Cash Flow
● Statement of Funds Flow
4

INCOME STATEMENT
A statement, prepared for a specific period of time (month/year),
that lists:
• Your company’s SALES or REVENUE
• The COST OF SALES (cost of the products you sell or the
cost of materials, labor, and overhead if your business is
contracting or a service organization)
• The EXPENSES incurred to generate the sales and pay for
administrative costs
• The NET INCOME (or loss), for the period, which equals
sales less cost of sales and expenses)
5
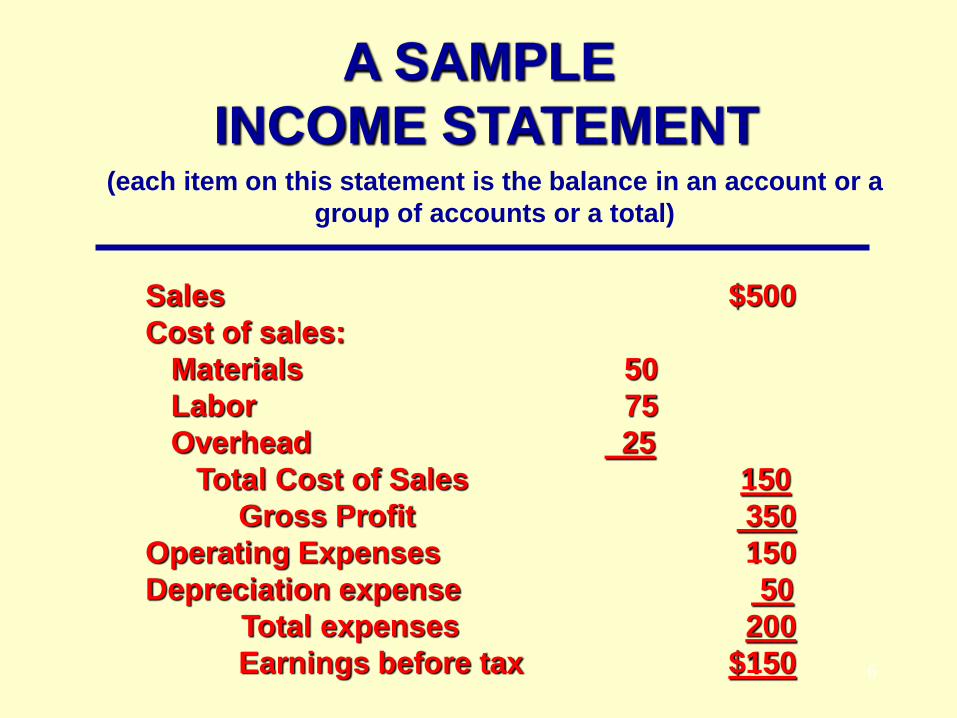
A SAMPLE
INCOME STATEMENT (each item on this statement is the balance in an account or a
group of accounts or a total)
Sales $500
Cost of sales:
Materials 50
Labor 75
Overhead 25
Total Cost of Sales 150
Gross Profit 350
Operating Expenses 150
Depreciation expense 50
Total expenses 200
Earnings before tax $150 6
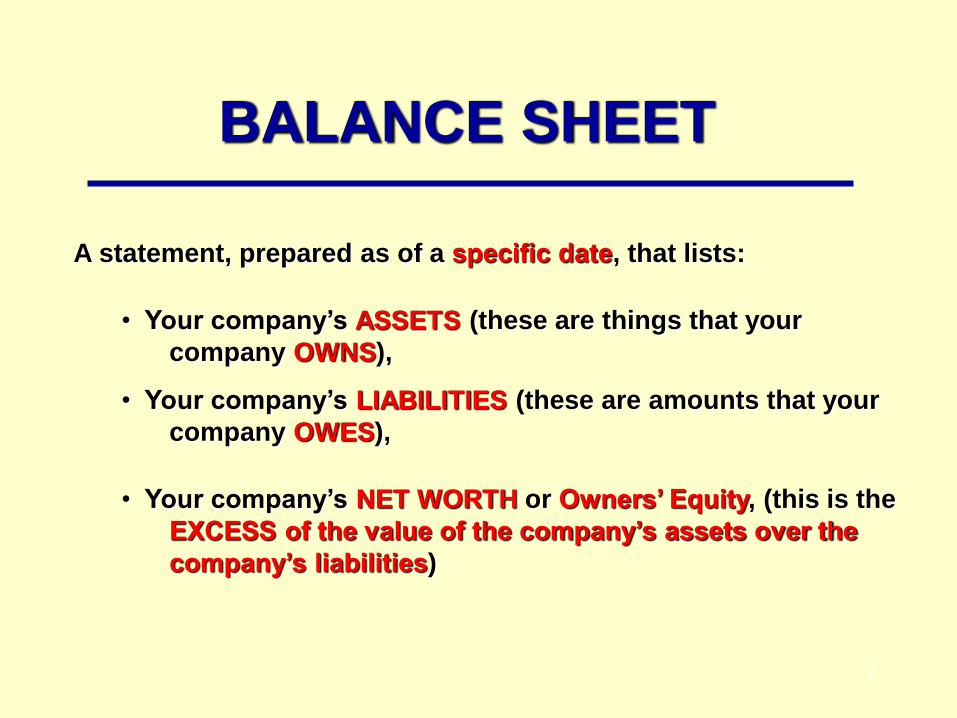
BALANCE SHEET
A statement, prepared as of a specific date, that lists:
• Your company’s ASSETS (these are things that your
company OWNS),
• Your company’s LIABILITIES (these are amounts that your
company OWES),
• Your company’s NET WORTH or Owners’ Equity, (this is the
EXCESS of the value of the company’s assets over the
company’s liabilities)
7

THE FINANCIAL EQUATION
ASSETS = LIABILITIES + EQUITY
What your business OWNS =
What your business OWES + Equity
STATED ANOTHER WAY –
ASSETS - LIABILITIES = EQUITY
What your business OWNS minus
what your business OWES = Equity
8

EXAMPLES OF BALANCE
SHEET ACCOUNTS
ASSETS - those things your Company OWNS:
(Cash, Accounts Receivable, Inventory and Equipment)
LIABILITIES - the amounts your Company OWES:
(Accounts Payable, Credit Card Balances and Bank Loans)
EQUITY - the amount the Company OWES the owners:
(including YOU, for their investment and their share of the
earnings of the business)
9

A SAMPLE BALANCE SHEET (each item listed is the balance in an account or group of
related accounts)
ASSETS LIABILITIES Cash $550 Accounts Payable $400
Accounts Receivable 300 Payable to Credit Card Co. 50
Inventory 450
Office Equipment 250
Less: Depreciation (50)
Total equipment 200
Utility Deposits 100 Total Liabilities $450
OWNER'S EQUITY
Owner's Investment 1,000
Retained Earnings --
Current Year's Earnings 150
Total Owner's Equity 1,150
Total Assets $1,600 Total Liabilities & Equity $1,600
10

CASH FLOW STATEMENT
A statement, prepared for a specific period of time
(month/year), that lists:
• Your company’s CASH RECEIPTS, such as cash sales,
payments from customers, loan proceeds and others
• CASH PAYMENTS by your company to pay for inventory,
expenses, wages and more
• The CASH BALANCES at the beginning and ending of
the period involved
11

A SAMPLE CASH FLOW
STATEMENT
Beginning Cash $ 0
Receipts:
Owner Investment 1,000
Cash Sales 200
Total Receipts 1200
Payments:
Make Utility Deposit 100
Payment of Expenses 150
Payment on Payables 400
Total Payments 650
Cash Flow for the Period 550
Ending Cash $ 550
(Each item listed is a type of transaction, not an account) 12

STATEMENT OF FUNDS FLOW
A statement, prepared for a specific period of time (month/year),
that lists:
• Funds your company generates from operations (net income
with non-cash items, like depreciation, added back)
• Other sources of funds generated by the company through
(increases in bank loans, payables, added owner
investment, or decreases in receivables, inventory or
other assets)
• Uses of funds (to increase inventory, receivables or other
assets and to decrease payables, loans or other liabilities)
13
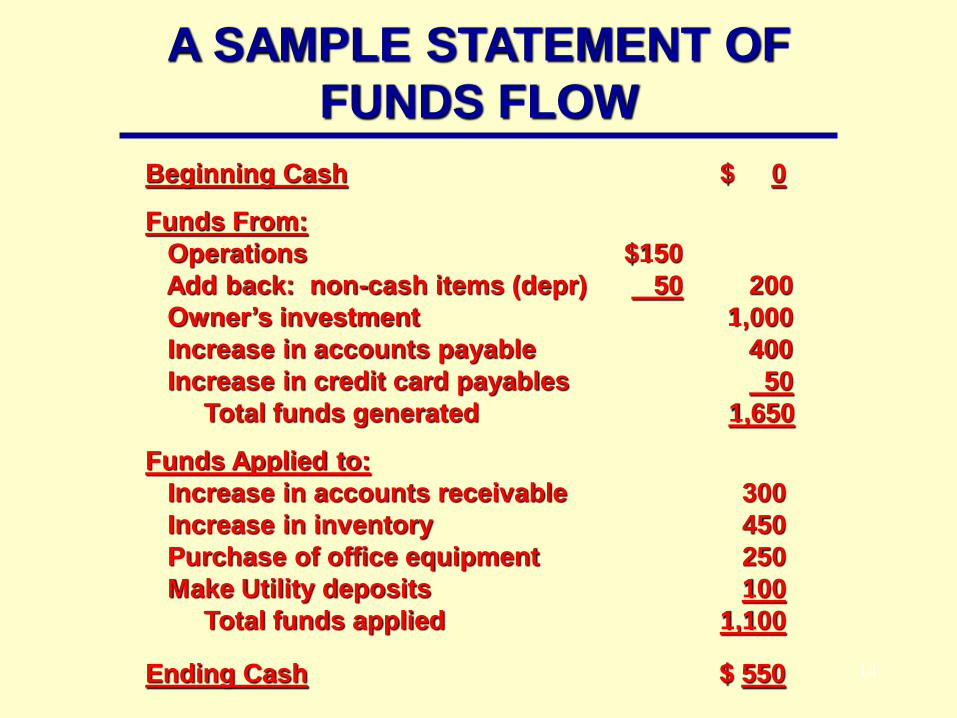
A SAMPLE STATEMENT OF
FUNDS FLOW
Beginning Cash $ 0
Funds From:
Operations $150
Add back: non-cash items (depr) 50 200
Owner’s investment 1,000
Increase in accounts payable 400
Increase in credit card payables 50
Total funds generated 1,650
Funds Applied to:
Increase in accounts receivable 300
Increase in inventory 450
Purchase of office equipment 250
Make Utility deposits 100
Total funds applied 1,100
Ending Cash $ 550 14

ALL OF THESE STATEMENTS ARE
GENERATED BY:
An Accounting System!
The question is HOW?
15
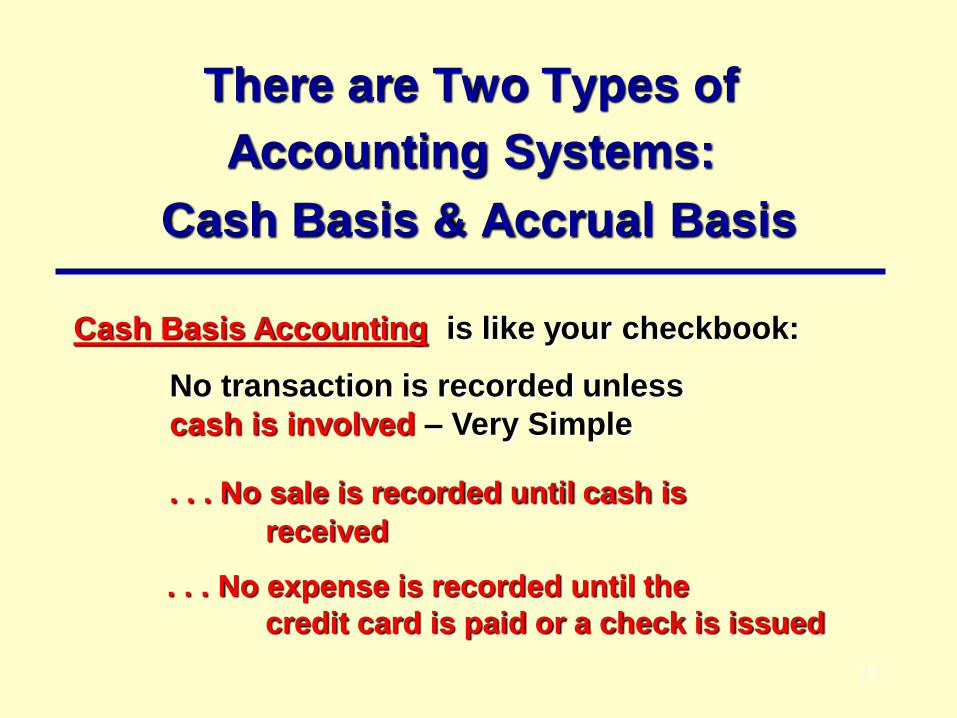
There are Two Types of
Accounting Systems:
Cash Basis & Accrual Basis
Cash Basis Accounting is like your checkbook:
No transaction is recorded unless
cash is involved – Very Simple
. . . No sale is recorded until cash is
received
. . . No expense is recorded until the
credit card is paid or a check is issued
16
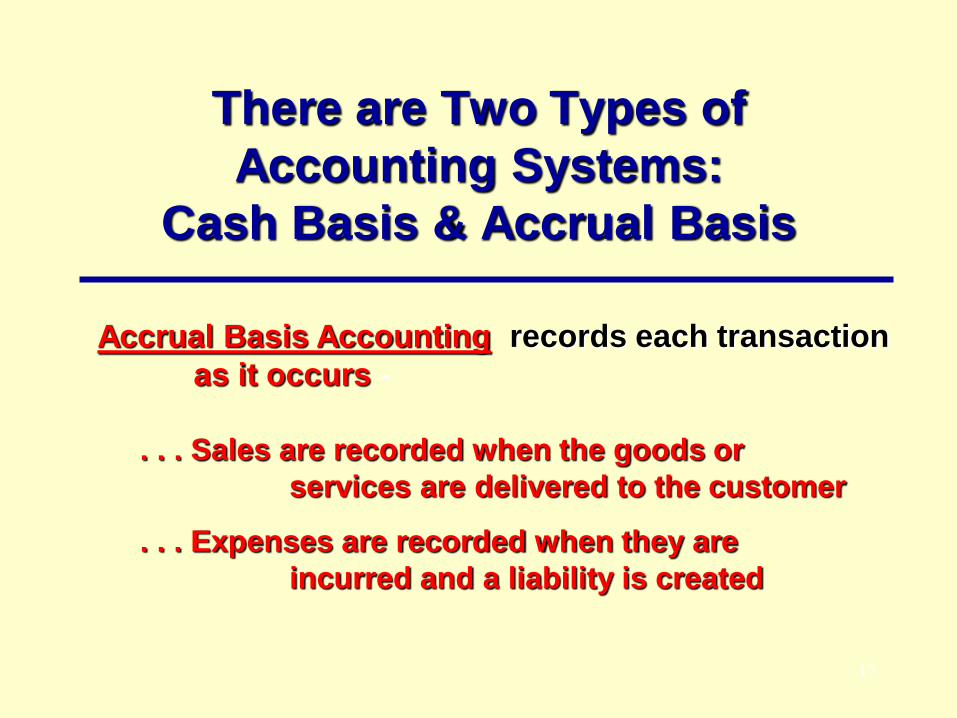
There are Two Types of
Accounting Systems:
Cash Basis & Accrual Basis
Accrual Basis Accounting records each transaction
as it occurs -
. . . Sales are recorded when the goods or
services are delivered to the customer
. . . Expenses are recorded when they are
incurred and a liability is created
17

ADVANTAGE:
Accrual Accounting
No surprises! Everything is accounted for
when it happens!
Example: Have you ever been surprised (and
dismayed) when you received your credit card
billing?
The credit card charges are liabilities which, in
accrual accounting, would have already been
recorded when the card was used.
18

How does accrual basis accounting
take us to this Balance Sheet?
ASSETS LIABILITIES
Cash $550 Accounts Payable $400
Accounts Receivable 300 Payable to Credit Card Co. 50
Inventory 450
Office Equipment 250
Less – Depreciation (50) 200
Utility Deposits 100 Total Liabilities $400
OWNER'S EQUITY
Owner's Investment 1,000
Retained Earnings --
Current Year's Earnings 150
Total Owner's Equity 1,150
Total Assets $1,600 Total Liabilities & Equity $1,600 19

USING YOUR
FINANCIAL STATEMENTS
Understanding How Financial Statements
are developed is just the beginning:
You must learn to use them to successfully to . . .
MANAGE YOUR BUSINESS!
20
Tools for Analysis
21
The following items make analysis
possible:
• Annual Budgets
• Historical Comparisons
• Ratios and Percentages
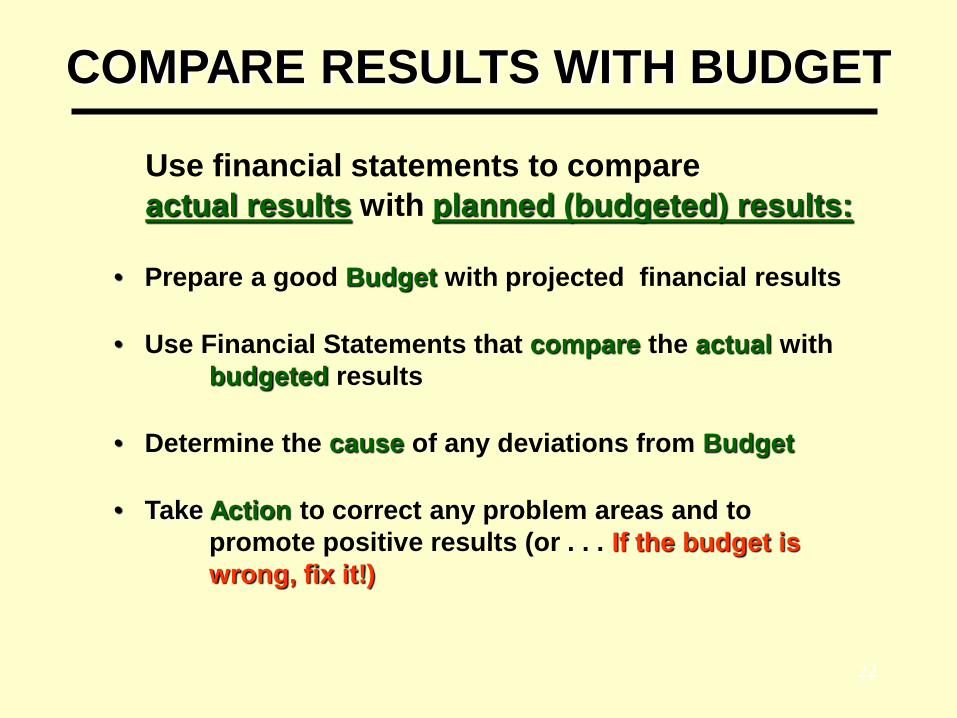
COMPARE RESULTS WITH BUDGET
Use financial statements to compare
actual results with planned (budgeted) results:
• Prepare a good Budget with projected financial results
• Use Financial Statements that compare the actual with
budgeted results
• Determine the cause of any deviations from Budget
• Take Action to correct any problem areas and to
promote positive results (or . . . If the budget is
wrong, fix it!)
22

COMPARE MONTHLY EARNINGS WITH BUDGET
INCOME STATEMENT Jan Jan Variance Variance
Description Budget Actual Amount Percent
Sales 2,500 2,200 300 12%
Cost of sales 1,500 1,320 180 12%
Gross Profit 1,000 880 120 12%
Margin % 40.0% 40.0% 0%
Expenses:
Payroll costs 460 430 30 7%
Rent 150 150 0
Utilities 70 65 5 7%
Supplies 40 35 5 12%
Advertising 30 25 5 17%
Sales expense 100 65 35 35%
Depreciation 100 100 0 __
Total Expense 950 870 80 8%
Earnings (Loss) 50 10 40 80%
23

DETERMINE THE CAUSE OF VARIANCES
• Are deviations due to uncontrollable external factors and, if
so, what were they?
• Are deviations due to errors in accounting or a bad budget,
and if so, in what respect?
• Are deviations due to poor sales effort, a failure to control
expenses or inefficiency in the production or delivery of
product/service? And if so, what problems occurred and
how can they be avoided in the future?
Note: Some companies prepare a Variance Report
to focus on, and explain, deviations from Plan.
24

MANAGING GROSS MARGIN
Sales $1,000
Cost of sales 600
Gross profit $400 40%
Gross profit is the dollar value of Sales minus Cost of
Sales. Gross margin is the percentage relationship of
Gross Profit to the Sales dollars.
Gross Margin = $400 divided by $1,000 = 40%
25

MANAGING GROSS MARGIN
Because Gross Margin relates to the price of your
product and the cost of supplying that product, to
improve your gross margin, you must:
. . . Increase the sales price of your product or
service, or
. . . Lower the cost of your product or service
. . . Or Both!
Note: Because the operating expenses of most companies
are relatively stable, the ability to increase profitability
lies with improving the company’s gross margin.
26
MANAGING GROSS MARGIN
Price your product or service at the HIGHEST PRICE THE
MARKET WILL BEAR! (check your competitors’ prices), then
examine your costs.
If the gross margin is sufficient to allow a satisfactory gross
margin and “bottom line” profit, it is priced OK.
If not, either reduce the cost to create a satisfactory
margin and resulting profit, or
. . . DROP THE PRODUCT FROM YOUR LINE!
27

COMPARE YOUR MONTHLY BALANCE SHEET TO PLAN
BALANCE SHEET Budget Jan Feb Mar
Assets
Cash 250 250 200 430
Accounts Receivable 550 560 700 675
Inventory 800 700 1000 1100
Equipment & Furniture 1000 1000 1000 1000
Utility Deposits 200 200 200 200
Total Assets 2800 2710 3100 3405
Liabilities
Accounts Payable 400 450 975 1100
Payable to Credit Card Co. 700 700 550 610
Total Liabilities 1100 1150 1525 1710
Owner's Equity
Owner's Investment 1000 1000 1000 1000
Retained Earnings 550 550 550 550
Current Year Earnings* 150 10 25 145
Total Owner's Equity 1700 1560 1575 1695
Total Liabilities & Equity 2800 2710 3100 3405
*Assumes earnings of $50 per month. Plan increases $50 every month. 28

COMPARE YOUR MONTHLY
BALANCE SHEET TO BUDGET
In comparing the Balance Sheet accounts to Plan, the principal
deviations were:
• Increase in Receivables: Was this due to increased sales
or failure to follow up on collections?
• Increase in Inventory: Was this due to poor inventory
management, a bad plan or was it needed to support
future expected sales?
Note: The answers to these questions must be studied and
appropriate action taken to avoid further deviations that
could be detrimental to profitability.
29
MANAGING CASH FLOW
Managing Cash Flow is one of the most important financial
management tasks for a small business!
IT MEANS:
Monitoring Cash Receipts
Monitoring Cash Payments
Collecting Receivables, if applicable
Managing Payments to Suppliers
And . . . taking Action when there is a deviation
between Actual and Planned Cash Flow
30

FORECAST YOUR CASH NEEDS
1. Estimate your Cash Sales by week for the next four weeks
2. Review you Accounts Receivable Aging and list the
amounts that you expect to collect by week, for the next
four weeks.
3. List any other sources of Cash that you expect to receive,
by week, for the next four weeks. (Bank loan, refunds, etc.)
FORECAST CASH RECEIPTS:
FORECAST CASH DISBURSEMENTS:
1. Review your Accounts Payable detail aging and total the
amounts you must pay, by week, for the next four weeks.
2. List any other payments you must make, by week, for the
next four weeks. (Payroll, loan payments, taxes, rent,
insurance, and other costs) 31

PREPARE A CASH FORECAST
CASH FORECAST: WEEK 1 WEEK 2 WEEK 3 WEEK 4
Cash Receipts –
Cash sales 300 250 450 250
Receivables paid 220 150 300 270
Other receipts 0 20 100 0
Totals 520 420 850 520
Cash Disbursements –
Pay payables 350 400 750 500
Tax payments 160 0 0 0
Loan payments 0 0 150 0
Totals 510 400 900 500
Cash Over (Short) - 10 20 (50) 20
32

ADDRESS PROBLEM AREAS
1. Increase receipts – higher cash sales, more collections
of accounts receivable or money from some other
source.
2. Decrease disbursements – contact a vendor and ask for
a one week delay in payment or visit with your bank and
ask for a few days leeway in making the loan payment.
In short – you must deal with the problem but . . .
By using the Cash Forecast properly you have the
time needed to resolve the issue!
WEEK 3 IS A PROBLEM AREA! YOU MUST:
33

IMPROVE COLLECTIONS
1. If the account becomes 10 days past due, call the
customer to determine if there is a problem with quality,
service or billing . . . and resolve the problem!
REMEMBER - TIME IS CRITICAL
DO NOT DELAY!
3. If the customer simply cannot pay, you can either -
• Work with the customer on a payment plan
• Turn account over to a collection agency
• Consider Small Claims Court for small amounts
2. Get a payment commitment from the customer and
then follow up to assure he meets the commitment.
34

MONITORING PAYABLES
If it is clear that you will not be able to meet a
payment when due, call the vendor and ask for
his patience. Give him a date of payment that
you are SURE you can meet . . . then MEET IT!
Weekly Payables Reports to help you monitor
payables are available in QuickBooks® and in
Peachtree Accounting®.
35

MANAGING TAX LIABILITIES
Some of the most critical liabilities are
taxes due to local, state and Federal taxing
authorities. You must pay these obligations on
time and in the proper amount.
The penalties for failure are significant!
Some tax liabilities are payable in future months.
Be sure to maintain sufficient funds to make the
future payments.
36

Importance of the
Banking Relationship
The importance of a good banking relationship is
illustrated by your Cash Flow Forecast. If there is a
shortfall in cash flow that cannot be avoided, it can be
covered by using a Bank Loan or a “Revolving Line of
Credit” which allows the amount of the loan due the
Bank to fluctuate.
Absent this Banking relationship, adjustments
would have to be made in the payments to Vendors.
The important point here is:
Don’t be surprised. Anticipate the needs!
37
MANAGING FOR SUCCESS!
Your business should provide:
Reasonable compensation for your work
A return on your owner investment
Additional profit used for growth
- - - - - - - - - - - - - - - -
You may be willing to forego some of these provisions
in the short run, but these
should be your long-term objectives!
38
MANAGING FOR SUCCESS!
REASONABLE COMPENSATION:
Your business should enable you to earn the
same amount (or more) that you would pay
someone else for doing the same job (reasonable
compensation)
. . . and generate an -
39

MANAGING FOR SUCCESS!
Adequate Return on Owner Investment:
Whatever you can earn as a reasonable return on
an investment in say, mutual funds . . .
You should expect your business to generate at
least that amount on the investment you have made in
your own business . . . in addition to the payment of a
reasonable wage for the work you are doing!
40

MANAGING FOR SUCCESS!
Profit For Growth:
In addition to a reasonable wage and return
on investment, your business should return an
additional profit to enable its continued growth.
The amount is subjective but relates to the
need to replace aging equipment, provide
additional facilities and conduct research to
provide for continued growth.
41
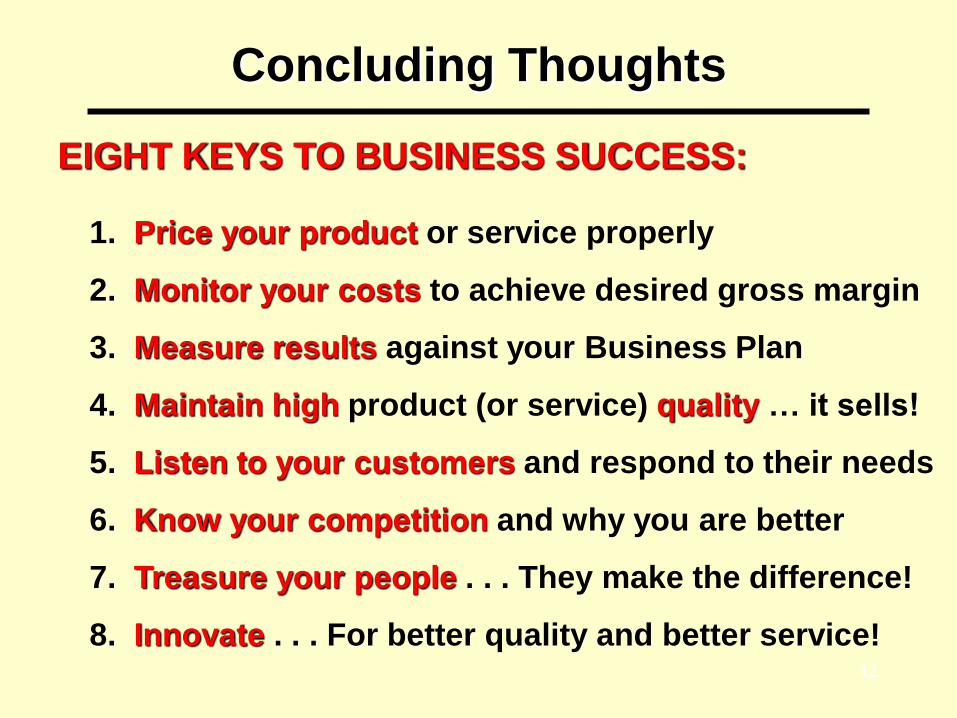
Concluding Thoughts
1. Price your product or service properly
2. Monitor your costs to achieve desired gross margin
3. Measure results against your Business Plan
4. Maintain high product (or service) quality … it sells!
5. Listen to your customers and respond to their needs
6. Know your competition and why you are better
7. Treasure your people . . . They make the difference!
8. Innovate . . . For better quality and better service!
EIGHT KEYS TO BUSINESS SUCCESS:
42