understanding financial statements, taxes, and cash...
TRANSCRIPT

Copyright © 2011 Pearson Prentice Hall. All rights reserved. 3-1
Chapter 3
Understanding Financial Statements, Taxes, and
Cash Flows

Copyright © 2011 Pearson Prentice Hall. All rights reserved. 3-2
Chapter Contents
• Learning Objectives
• Principles Used in This Chapter
• Understanding Financial Reporting and Statements
1. The Income Statement
2. Corporate Taxes
3. The Balance Sheet
4. The Cash Flow Statement

Copyright © 2011 Pearson Prentice Hall. All rights reserved. 3-3
Learning Objectives
1. Describe the content of the four basic financial statements and discuss the importance of financial statement analysis to the financial manager.
2. Evaluate firm profitability using the income statement.
3. Estimate a firm’s tax liability using the corporate tax schedule and distinguish between the average and marginal tax rate.
Copyright © 2011 Pearson Prentice Hall. All rights reserved. 3-4
Principles Used in This Chapter
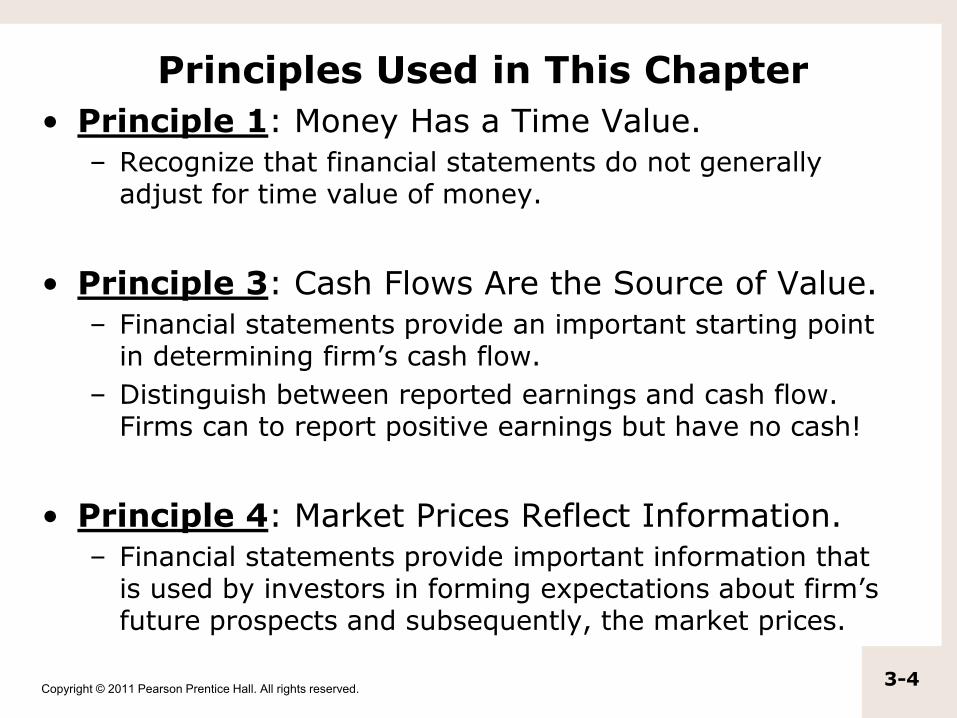
• Principle 1: Money Has a Time Value.
– Recognize that financial statements do not generally adjust for time value of money.
• Principle 3: Cash Flows Are the Source of Value.
– Financial statements provide an important starting point in determining firm’s cash flow.
– Distinguish between reported earnings and cash flow. Firms can to report positive earnings but have no cash!
• Principle 4: Market Prices Reflect Information.
– Financial statements provide important information that is used by investors in forming expectations about firm’s future prospects and subsequently, the market prices.

Copyright © 2011 Pearson Prentice Hall. All rights reserved. 3-5
Basic Financial Statements
• Following four types of financial statements are mandated by the accounting and financial regulatory authorities:
1. Income statement
2. Balance sheet
3. Cash flow statement
4. Statement of shareholder’s equity

Copyright © 2011 Pearson Prentice Hall. All rights reserved. 3-6
Basic Financial Statements (Review)
1. Income Statement:
– An income statement provides measures of activities and accomplishments of business for specific period of time (1 year; 3 or 6 months)
– Activities presented by functional classification.
• Revenues
• Cost of Goods Sold
• Gross Profit
• Operating Expenses
• Operating Income (profit)
• Interest Expense, Other “stuff” and Taxes
• Net Income (sometimes followed by Comprehensive Income).

Copyright © 2011 Pearson Prentice Hall. All rights reserved. 3-7
Sample Income Statement
Copyright © 2011 Pearson Prentice Hall. All rights reserved. 3-8
Basic Financial Statements (Review)
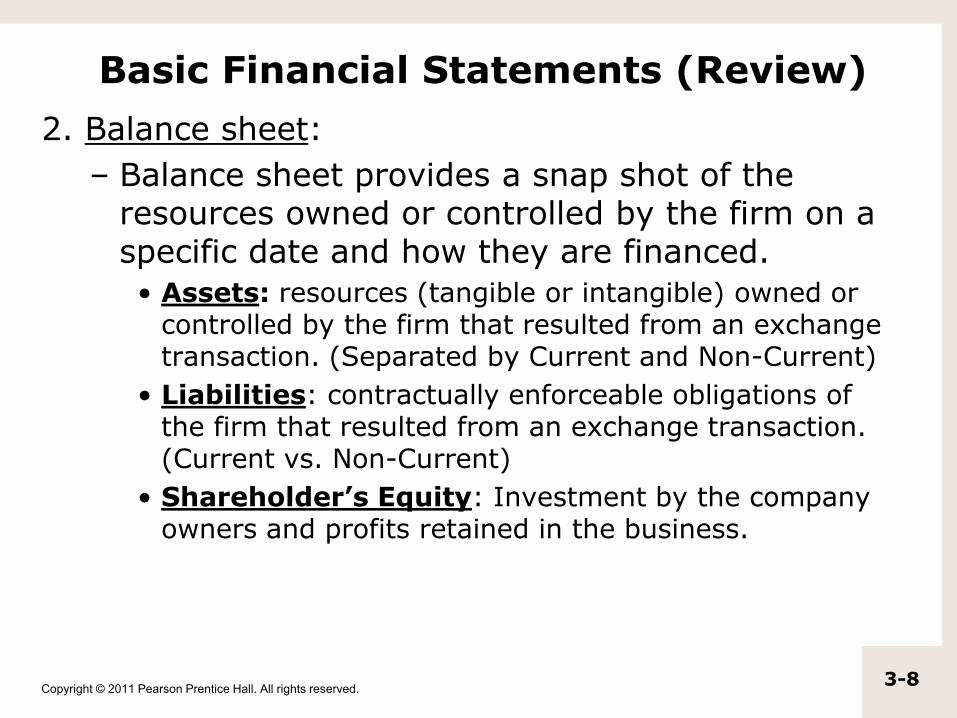
2. Balance sheet:
– Balance sheet provides a snap shot of the resources owned or controlled by the firm on a specific date and how they are financed.
• Assets: resources (tangible or intangible) owned or controlled by the firm that resulted from an exchange transaction. (Separated by Current and Non-Current)
• Liabilities: contractually enforceable obligations of the firm that resulted from an exchange transaction. (Current vs. Non-Current)
• Shareholder’s Equity: Investment by the company owners and profits retained in the business.
Copyright © 2011 Pearson Prentice Hall. All rights reserved. 3-9
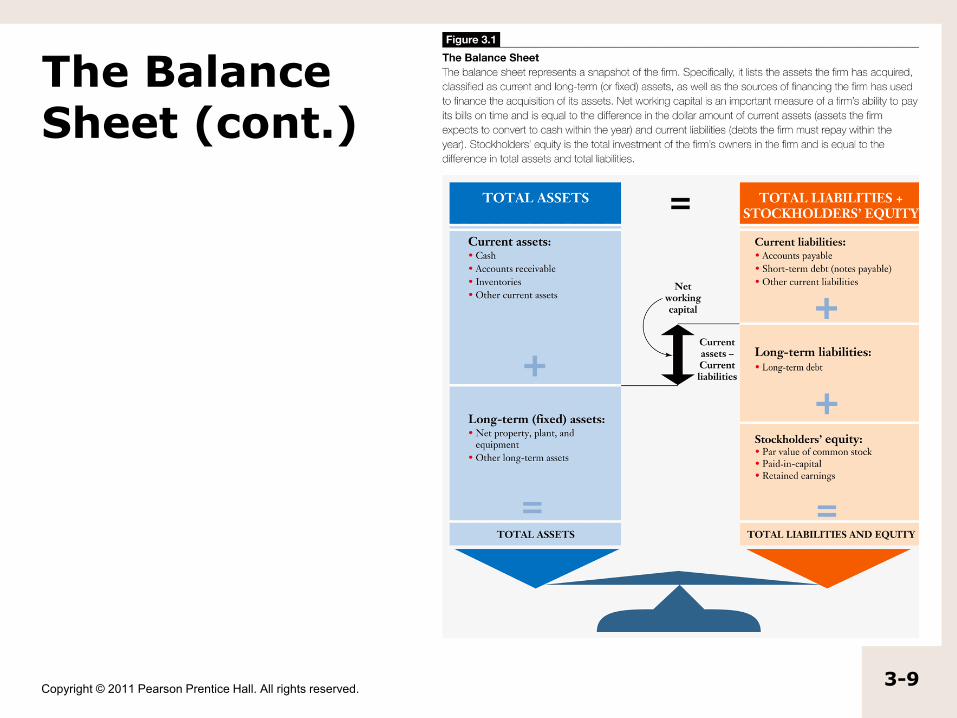
The Balance Sheet (cont.)

Copyright © 2011 Pearson Prentice Hall. All rights reserved. 3-10
The Balance Sheet

Copyright © 2011 Pearson Prentice Hall. All rights reserved. 3-11
Checkpoint 3.2
Constructing a Balance Sheet Construct a balance sheet for Gap, Inc. (GPS) using the following list of jumbled accounts for January 31, 2009. Identify the firm’s total assets and net working capital:

Copyright © 2011 Pearson Prentice Hall. All rights reserved. 3-12
Basic Financial Statements (Review)
3. Cash flow statement:
– Reports cash received and cash spent by the firm over a period of time.
– Cash flows are organized and classified by 3 functional areas:
1. Operating Activities: Cash flow analog of operating income.
2. Investing Activities: Cash used (provided by) investing (disinvesting) in physical productive capacity and non-current assets.
3. Financing Activities: Cash provided by (used by) issuing or borrowing (paying off) interest bearing liabilities (notes, loans and bonds). Also includes stock issuance (cash inflow); stock repurchase and dividends (cash outflows).

Copyright © 2011 Pearson Prentice Hall. All rights reserved. 3-13
H.J. Boswell, Inc. Statement of Cash Flows

Copyright © 2011 Pearson Prentice Hall. All rights reserved. 3-14
Checkpoint 3.3 Interpreting the Statement of Cash Flow You are in your second rotation in the management training program at a regional brokerage firm and your supervisor calls you into her office on Monday morning to discuss your next training rotation. When you enter her office you are surprised to learn that you will be responsible for compiling a financial analysis of Chesapeake Energy Inc. (CHK). Chesapeake is the largest producer of natural gas in the United States and is headquartered in Oklahoma City. Your boss suggests that you begin your analysis by reviewing the firm’s cash flow statements for 2004 through 2007 (found below):

Copyright © 2011 Pearson Prentice Hall. All rights reserved. 3-15
Basic Financial Statements (Review)
4. Statement of Changes in Shareholder’s Equity:
– It provides a detailed account of the firm’s activities in the following accounts over a period of time (for example, last six months):
• Common stock account,
• Preferred stock account,
• Retained earnings account (Dividends and Income)
• Comprehensive Income Adjustments
– Reflects the effects of marking Financial Assets and Financial Liabilities to Current Market Value.
– Typically termed “recognized but unrealized gains and losses …”
– Common items include Foreign Currency, investments, bonds and pension plans.

Copyright © 2011 Pearson Prentice Hall. All rights reserved. 3-16
Why Study Financial Statements?
• Analyzing a firm’s financial statement can help managers carry out three important tasks:
1. Assess current performance through financial statement analysis,
2. Monitor and control operations, and
3. Forecast future performance.
• Assists existing and potential investors in analyzing and estimate 1 – 3 (above).

Copyright © 2011 Pearson Prentice Hall. All rights reserved. 3-17
Ways to Study Financial Statements?
1. Financial statement analysis:
– Financial statement analysis allows us to assess the present financial condition of a firm. (Chapter 4 tools and techniques)
2. Financial control:
– Financial statements are used by both insiders (such as managers, board of directors) and outsiders (such as suppliers, creditors) to monitor and control the firm’s operations.
3. Financial forecasting and planning:
– Financial planning models are typically built using the financial statements. (Chap. 17)

Copyright © 2011 Pearson Prentice Hall. All rights reserved. 3-18
Primary Accounting Principles Used to Prepare Financial Statements (Review)
• The following three fundamental principles are adhered to by accountants when preparing financial statements:
1. The revenue recognition principle,
2. The matching principle, and
3. The historical cost principle.
• An understanding of these basic principles allows you to be a more informed user of financial statements.

Copyright © 2011 Pearson Prentice Hall. All rights reserved. 3-19
Primary Accounting Principles Used to Prepare Financial Statements (Review)
1. The revenue recognition principle:
– It states that the revenue should be included in the firm’s income statement for the period in which:
• Its goods and services were exchanged for cash or accounts receivable; or
• The firm has completed what it must do to be entitled to the cash.

Copyright © 2011 Pearson Prentice Hall. All rights reserved. 3-20
Main Accounting Principles Used to Prepare Financial Statements (Review)
2. The matching principle:
– This principle determines whether specific costs or expenses can be attributed to this period’s revenues.
– The expenses are matched with the revenues they helped produce.
• For example, employees’ salaries are recognized when the product produced as a result of that work is sold, and not when the wages were paid.
• When should bad debt expense (accounts receivable related) be recognized? In the period when you identify a deadbeat or the period in which the sale was made?

Copyright © 2011 Pearson Prentice Hall. All rights reserved. 3-21
Main Accounting Principles Used to Prepare Financial Statements? (Review)
3. The historical cost principle:
– Provides the basis for determining the dollar values the firm reports in its balance sheet.
– Most assets and liabilities are reported in the firm’s financial statements at historical cost i.e. the price the firm paid to acquire them.
• The historical cost generally does not equal the current market value of the assets or liabilities.
• Accounting dilemma is the tradeoff between relevance and reliability.

Copyright © 2011 Pearson Prentice Hall. All rights reserved. 3-22
GAAP and Earnings Management
• While the firms must adhere to set of accounting principles, GAAP (Generally Accepted Accounting Principles), there is considerable room for managers to influence the firm’s reported earnings.
• Managers have an incentive to tamper with reported earnings as their pay depends upon it and investors care about it.

Copyright © 2011 Pearson Prentice Hall. All rights reserved. 3-23
Checkpoint 3.1
Constructing an Income Statement
Use the following information to construct an income statement for Gap, Inc. (GPS). The Gap is a specialty retailing company that sells clothing, accessories, and personal care products under the Gap, Old Navy, Banana Republic, Piperlime, and Athleta brand names. Use the scrambled information below to calculate the firm’s gross profits, operating income, and net income for the year ended January 31, 2009. Calculate the firm’s earnings per share and dividends per share.

Copyright © 2011 Pearson Prentice Hall. All rights reserved. 3-24
Compute EPS given the information above
1 2 3 4
25% 25%25%25%
10
1. $0.96
2. $1.29
3. $1.30
4. $930,000,000

Copyright © 2011 Pearson Prentice Hall. All rights reserved. 3-25
Corporate Taxes
• A firm’s income tax liability is calculated using its taxable income and the tax rates on corporate income.

Copyright © 2011 Pearson Prentice Hall. All rights reserved. 3-26
Marginal and Average Tax Rates
• While analyzing the tax consequences of a new business venture, the appropriate tax rate is the marginal tax rate.
• Marginal tax rate is the tax rate that the company will pay on its next dollar of taxable income.
• Average tax rate is total taxes paid divided by the taxable income.

Copyright © 2011 Pearson Prentice Hall. All rights reserved. 3-27
Marginal and Average Tax Rates
• Example: What is the average and marginal tax liability for a firm reporting $100,000 as taxable income?
Taxable Income Bracket
Taxable
Income in the
Bracket
Marginal
Tax Rate
Incremental Tax
Liability
Cumulative
Tax Liability
Average
Tax Rate
$ 0 - $50,000 $50,000 15.00% 7,500 7,500 15.00%
$50,001 - $75,000 $25,000 25.00% 6,250 13,750 18.33%
$100,001 - $335,000 $25,000 34.00% 8,500 22,250 22.25%
Total Taxable Income $100,000

Copyright © 2011 Pearson Prentice Hall. All rights reserved. 3-28
Dividend Exclusion for Corporate Shareholders
• The dividend received by corporate stockholders are partially exempt from taxation. The rationale is to avoid double taxation at the corporate level.
– The percentage of exempt taxes is based on the degree of ownership of the firm.

Copyright © 2011 Pearson Prentice Hall. All rights reserved. 3-29
Dividend Exclusion for Corporate Shareholders
• Example
– What will be the taxable income if firm ABC receives $200,000 in dividends from firm XYZ?
• The taxable income will depend on the degree of ownership of XYZ by ABC.
Ownership Interest
Dividend Exclusion
Dividend Income
Taxable Income
Less than 20%
70% $200,000 $60,000
20% to 79%
75% $200,000 $50,000
80% or more
100% $200,000 $0