understanding gambling: mechanisms and predictors: alberta
TRANSCRIPT
University of Calgary
PRISM: University of Calgary's Digital Repository
Alberta Gambling Research Institute Alberta Gambling Research Institute
2016-04
Understanding Gambling: Mechanisms and
Predictors: Alberta Gambling Research Institute's
15th Annual Conference
Bedford, Kate; Cunningham, John; Hing, Nerilee; Kayser, Andrew;
Kim, Hyoun S. (Andrew); Leonard, Carrie A.; Lewis, Marc; Lister,
Jamey J.; McGrath, Daniel; Nower, Lia...
http://hdl.handle.net/1880/51141
Presentation
Downloaded from PRISM: https://prism.ucalgary.ca

What Proportion of Gambling Revenue is Derived from
Problem Gamblers?
Dr. Robert Williams & Dr. Robert Wood University of Lethbridge
Alberta, Canada
Alberta Gambling Research Institute ConferenceBanff, Alberta
April 2016

Funding Sources: Ontario Problem Gambling Research Centre & Alberta
Gambling Research Institute
Potential Conflicts of Interest: None

The demographic origin of gambling revenue has important philosophical, sociological and government policy implications

Academic Research
15% – 50% of gambling revenue comes from
problem gamblers depending on the jurisdiction
and time period
Volberg et al. (1998). Unaffordable losses: Estimating the proportion of gambling revenues derived from problem gamblers. Gaming Law Review, 2(4), 349-360.
Williams & Wood (2004). The proportion of gaming revenue derived from problem gamblers: Examining the issues in a Canadian context. Analyses of Social Issues & Public Policy, 4 (1), 33-45.
Williams & Wood (2007). The proportion of Ontario gambling revenue derived from problem gamblers. Canadian Public Policy, 33(3), 367-387.
Australian Productivity Commission. (2010). Gambling (Vol. 2). Productivity Commission, Government of Australia.
Orford et al. (2013). What proportion of gambling is problem gambling? Estimates from the 2010 British Gambling Prevalence Survey. International Gambling Studies, 13, 4-18.
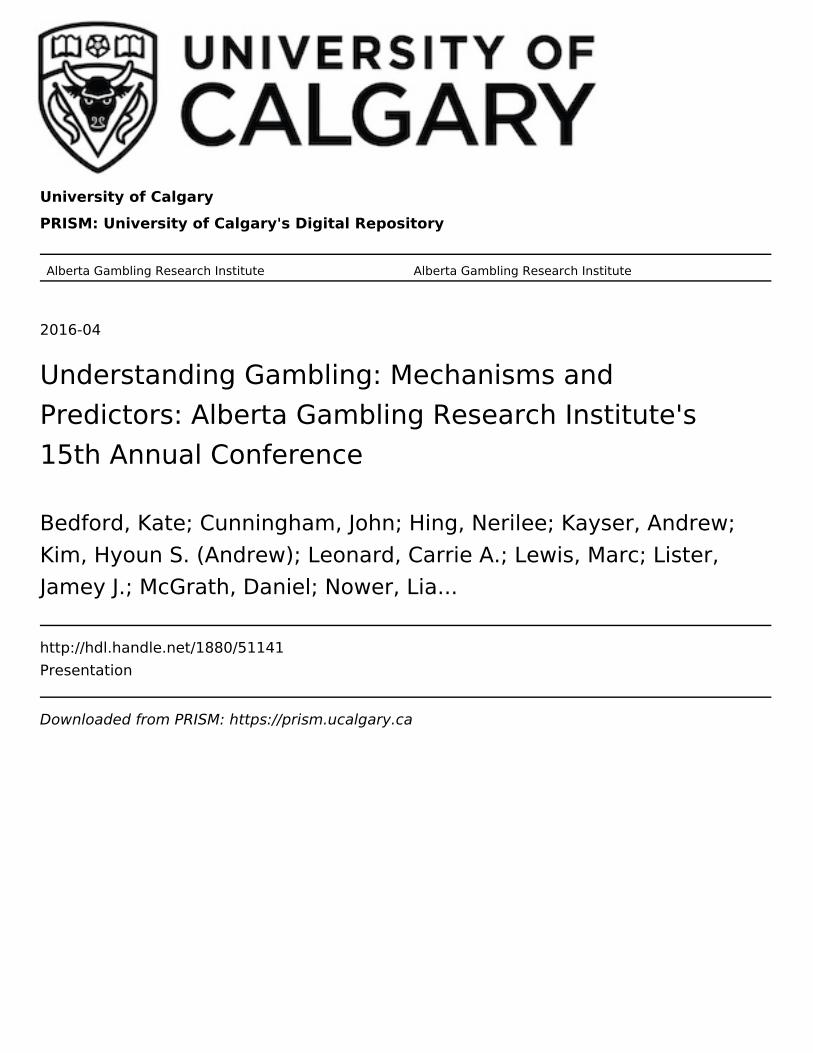
Contrary Views
“5% to 15% of gross gaming revenue comes from problem and pathological gamblers” National Center for Responsible Gaming (2016) Do Casinos
make Money off of Problem Gamblers?
“we conservatively estimate the share of total gaming revenue from Ontario problem gamblers to be much closer to 5.7%” Bernhard, B. & Philander, K. (2012). Informing the Public
Debate: Problem Gambling. Report prepared for the Canadian
Gaming Association.

Purpose of presentation
1. To reassure people that the academic research evidence on this issue is solid.
2. To point out that this finding, rather than being surprising, is actually very commonsensical.

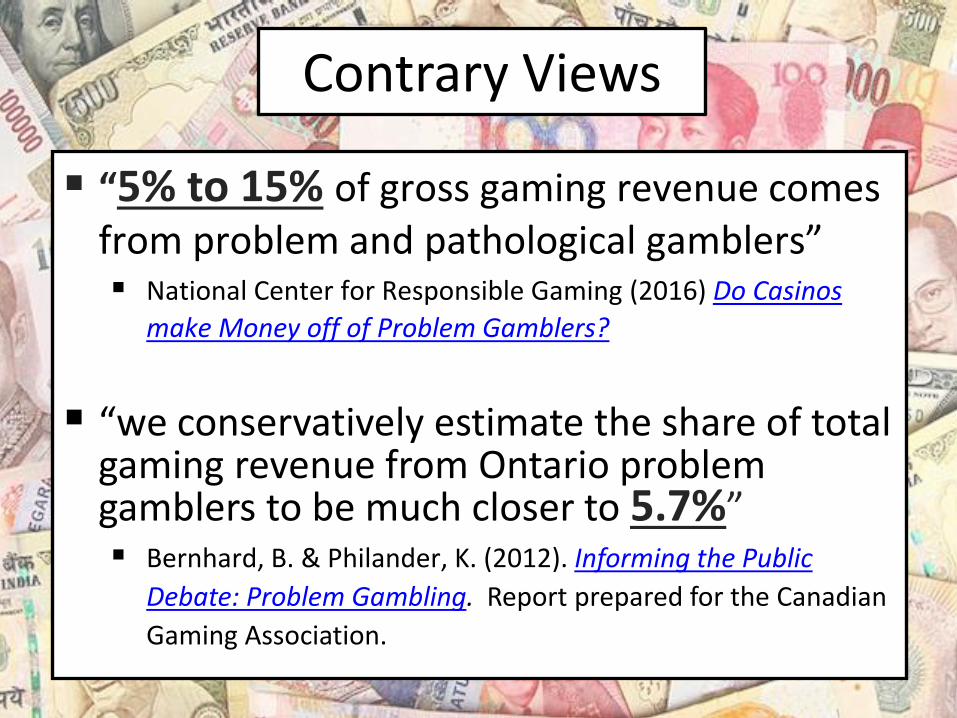
Pareto Principle
In most businesses 20% of patrons account for 80% of sales
Also known as80/20 rule

5/50; 10/65; 20/80; 40/95
5

Merchandise Sales: Customers

Merchandise Sales: Products

Movie Revenue
Health Care Spending
5% of Ontario residents
account for 65% of Health Care Spending

Tweets
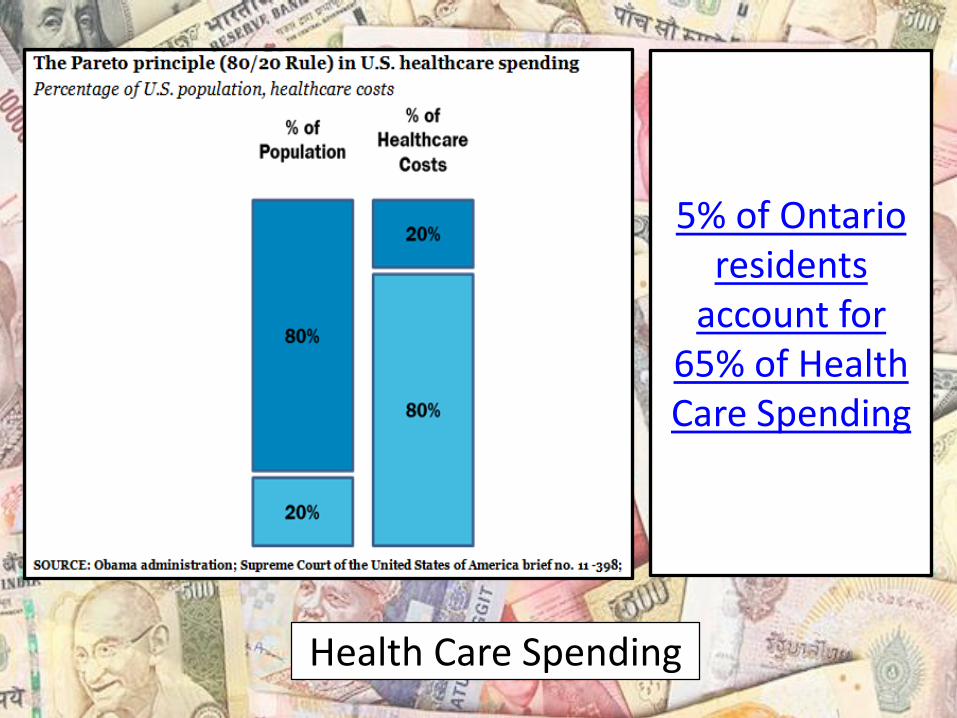
Blogging

Crime
• US: 5-6% of population commits 50-60% of all recorded crime
• UK: 9% of offenders commit 62% of all offenses

• Most people spend 80% of their time with 20% of their friends.
• 20% of the clothes in the closet tend to be worn 80% of the time.
• 20% of scientific works receive 80% of the citations

• This is just a common consumption pattern for regular consumer products.
• What about the consumption patterns for consumer products with addictionpotential?

Drugs
Most tobacco, methamphetamine, and heroin users are dependent on these substances.
Thus, although no formal data, it is reasonable to assume that most consumption is done by addicts and the large majority of the revenue from purchasing these products comes from addicts.

Alcohol Consumption
0
10
20
30
40
50
60
70
80
1stDecile
2ndDecile
3rdDecile
4thDecile
5thDecile
6thDecile
7thDecile
8thDecile
9thDecile
10thDecile
Average # Drinks per Week in U.S. in 2006 as a Function of
Population Decile
US National Epidemiologic Survey on Alcohol and Related Conditions (NESARC)

Alcohol Consumption
The top 10% of drinkers account for 60% of alcohol consumed in the United States
“…..the heaviest drinkers are of greatly disproportionate importance to the sales and profitability of the alcoholic-beverage industry. If the top decilesomehow could be induced to curb their consumption level to that of the next lower group (the 9th decile), then total ethanol sales would fall by 60 percent.”
Dr. Philip Cook (Duke Professor of Public Policy). Sept 2014. Cook, P. J. (2007). Paying the Tab. Princeton, NJ: Princeton University Press.
How much do the top 10% drink?
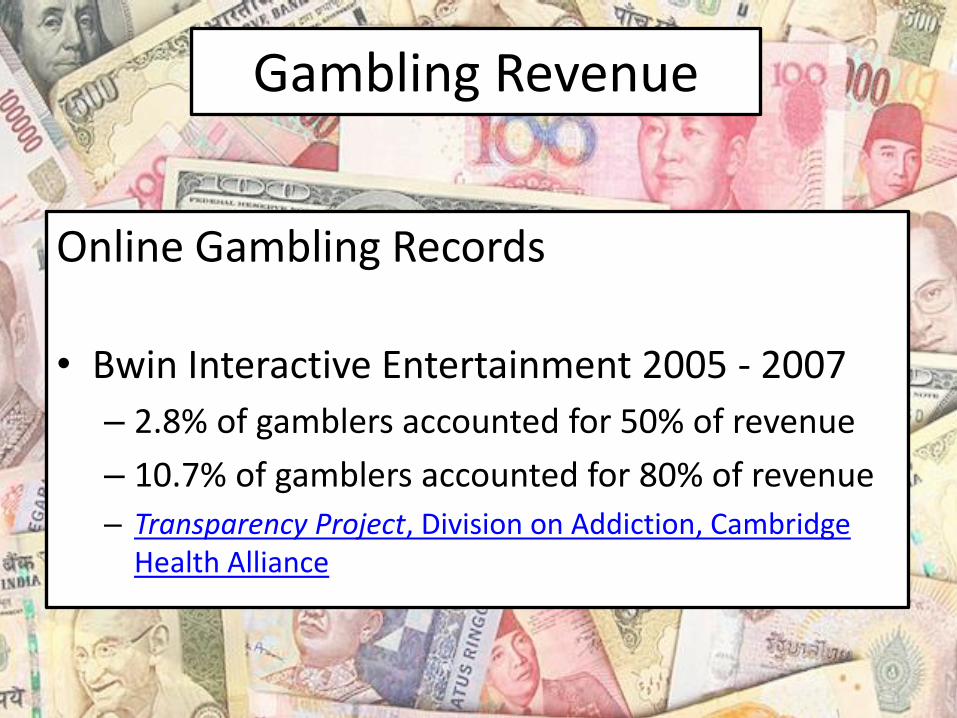
Online Gambling Records
• Bwin Interactive Entertainment 2005 - 2007
– 2.8% of gamblers accounted for 50% of revenue
– 10.7% of gamblers accounted for 80% of revenue
– Transparency Project, Division on Addiction, Cambridge Health Alliance
Gambling Revenue

Player Card Data
• Australia– 2.0% of gamblers account for 80% of revenue– Banks, G. (2011, March). Evidence and Social Policy: the Case of Gambling.
Presentation to South Australian Centre for Economic Studies, Corporate Seminar, Adelaide, Australia.
• U.S. Native Casino– 9.3% of gamblers account for 80% of revenue
– “Politically, we don't want to talk about it being more concentrated than other industries," said Andrew Klebanow, a marketing specialist who has consulted for dozens of casinos. He said the Bwin results are in line with his own estimates, based on confidential casino data, that many U.S. casinos get about 90% of their revenue from 10% of customers. Wall Street Journal , Oct 17, 2013.
Gambling Revenue

Population Surveys
Gambling Revenue
5% of gamblers
73.4%revenue
10% of gamblers
81.3%revenue
20% of gamblers
89.1%revenue
Alberta 2008/2009

% of Revenue from Problem Gamblers
4 U.S. states & 3 Canadian provinces (Lesieur, 1998)
30%
United States(Gerstein et al., 1999)
15%
Australia(Productivity Commission, 1999)
33%
New Zealand(Abbott & Volberg, 2000)
19%
Canada (Williams & Wood, 2004a)
32%
Ontario(Williams & Wood, 2004b, 2007)
30%
Australia(Productivity Commission, 2010)
36%
U.K.
(Orford et al., 2013)1 – 30%
depending on type

Some concern about the fact that these proportions are sometimes
different between jurisdictions and sometimes do not have a good match
to actual gambling revenues
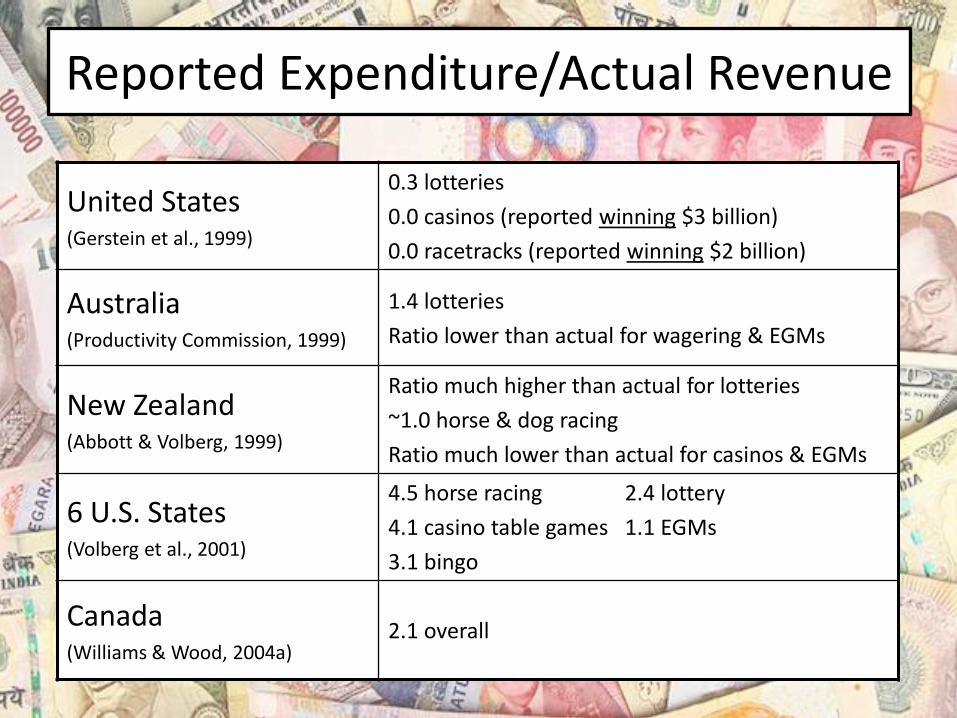
Reported Expenditure/Actual Revenue
United States(Gerstein et al., 1999)
0.3 lotteries
0.0 casinos (reported winning $3 billion)
0.0 racetracks (reported winning $2 billion)
Australia(Productivity Commission, 1999)
1.4 lotteries
Ratio lower than actual for wagering & EGMs
New Zealand (Abbott & Volberg, 1999)
Ratio much higher than actual for lotteries
~1.0 horse & dog racing
Ratio much lower than actual for casinos & EGMs
6 U.S. States (Volberg et al., 2001)
4.5 horse racing 2.4 lottery
4.1 casino table games 1.1 EGMs
3.1 bingo
Canada (Williams & Wood, 2004a)
2.1 overall

Some question wordings produce much better match between expenditure & revenue
Asked about gambling expenditure 12 different ways to 2,424 randomly selected Ontario adults
Compared each of these 12 ways against actual Ontario gambling revenue and one month prospective diaries amounts of subset of 364 Ontario gamblers (+ 211 Alberta gamblers)

Some question wordings produce much better match between expenditure & revenue
Reported expenditure varied by FACTOR OF 5 depending on question.
LOWEST: “Roughly how much money do you come out ahead or behind on gambling in a typical month?” (significant underestimate)
HIGHEST: “Roughly how much money did you spend on [specific format] the last time you purchased/played [specific format]. How often do you purchase play [specific format]? (significant overestimate)
Poor correlation between estimates and subsequent diary amounts for most questions
Best match to diary amounts and actual gambling revenue: “Roughly how much money do you spend on [specific format] in a typical month?”
Wood, R.T. & Williams, R.J. (2007b). How much money do you spend on gambling? The comparative validity of question wordings used to assess gambling expenditure.International Journal of Social Research Methodology: Theory & Practice, 10 (1), 63-77.

Expenditure/Revenue Match using this Wording
% Expenditurefrom Problem
Gamblers
Expenditure/Revenue match
Alberta 2010/2011 50% 108%
Ontario 2011 24% 88%
Massachusetts 2013 16%110% horse racing
217% lottery

Conclusions
Converging lines of evidence indicate that
a substantial portion of gambling revenue
derives from problem gamblers
Ranging from 15% – 50%

The exact proportion depends on:
1. Type of gambling – much higher for continuous forms (e.g., EGM) & much lower
for non-continuous forms (e.g., lotteries)
2. The specific jurisdiction – jurisdictions vary in the types of gambling available, strength
of their initiatives to prevent problem gambling, and vulnerability of their population
3. The specific time period studied– problem gambling highest after initial introduction of
gambling, then declines– gambling availability and prevention policies change
Conclusions

What about these contrary claims?
… “5% to 15% of gross gaming revenue comes from problem and pathological gamblers” National Center for Responsible Gaming (2016) Do Casinos Make
Money off of Problem Gamblers?
5% to 15% figure is from a single study: Gerstein et al. (1999)
Misrepresentation of the actual findings: 15% overall, with a range of 8% for lotteries to 22.1% for casinos (pages ix & 33-34)
Study conducted 18 years ago in U.S. before major casino expansion
Study with the poorest match between reported expenditure and actual revenue: 0.3 lotteries
0.0 casinos (U.S. citizens reported winning $3 billion)
0.0 racetracks (U.S. citizens reported winning $2 billion)

What about these contrary claims?
“we conservatively estimate the share of total gaming revenue from Ontario problem gamblers to be much closer to 5.7%” Bernhard, B. & Philander, K. (2012). Informing the Public Debate: Problem
Gambling. Report prepared for the Canadian Gaming Association.
Added revenue from U.S. gamblers to the denominator, but restricted numerator to expenditure of just Ontario problem gamblers
Used 2003 revenue, when U.S. gamblers accounted for 42% of revenue, rather than 2011 when U.S. gamblers accounted for just 2.5%.
Used 2011 prevalence of problem gambling (1.0%), rather than the problem gambling prevalence in 2003 (3.0%).
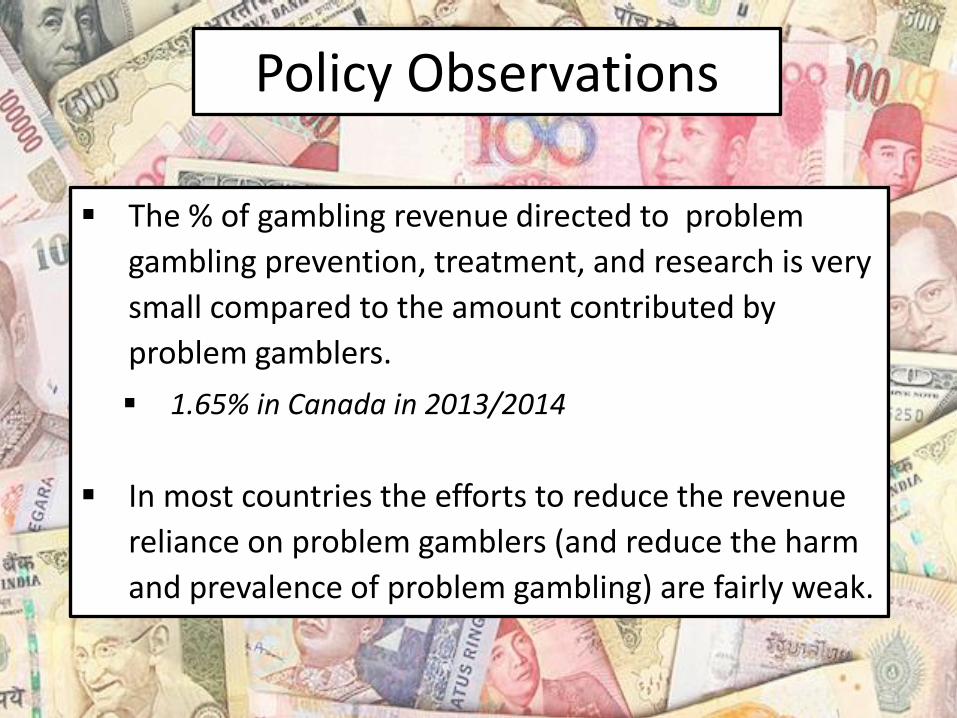
Policy Observations
The % of gambling revenue directed to problem
gambling prevention, treatment, and research is very
small compared to the amount contributed by
problem gamblers.
1.65% in Canada in 2013/2014
In most countries the efforts to reduce the revenue
reliance on problem gamblers (and reduce the harm
and prevalence of problem gambling) are fairly weak.

Policy Observations
Prevention efforts tend to rely primarily on the weak strategy of educating the gambler, whereas constraining the availability and provision of potentially dangerous products is far more effective, and is what has primarily been used to reduce the harm from drugs, alcohol, tobacco, firearms, and motor vehicles.
Williams, West, & Simpson (2012). Prevention of Problem Gambling: A Comprehensive Review of the Evidence and Identified Best Practices.Report prepared for the Ontario Problem Gambling Research Centre and the Ontario Ministry of Health and Long Term Care.

Minimum price YES NO
Limits on maximum provision YES NO
Limits on 24 hour availability YES NO (poker)
Legal liability for over-serving customers and monitoring compliance with this
YES NO
Laws penalizing public overconsumption YES NO
Prohibition of consumption in circumstances that endanger other people
YES (driving) NO
Inconsistency in our Policy Oriented Approach to Alcohol vs. our Educational Approach to Gambling