understanding material deprivation in europe: a multilevel
TRANSCRIPT

GINI DISCUSSION PAPER 37MARCH 2012
Understanding Material Deprivation in Europe: A Multilevel Analysis
Christopher T. Whelan and Bertrand Maître
GROWING INEQUALITIES’ IMPACTS

March 2012 © Christopher T. Whelan and Bertrand Maître, Amsterdam General contact: [email protected]
Bibliograhic InformationWhelan, Christopher T. and Maître, B. (2012). Understanding Material Deprivation in Europe: A Multilevel Analysis. Amsterdam, AIAS, GINI Discussion Paper 37.
Information may be quoted provided the source is stated accurately and clearly. Reproduction for own/internal use is permitted.
This paper can be downloaded from our website www.gini-research.org.

Understanding Material Deprivation in Europe
A Multilevel Analysis
March 2012DP 37
Christopher T. Whelan
School of Sociology and Geary Institute, University College Dublin
Bertrand Maître
Economic and Social Research Institute, Dublin

Page • 4
Christopher T. Whelan and Bertrand Maître

Page • 5
Understanding Material Deprivation in Europe
Table of contentsABSTRACT ......................................................................................................................................................................7
1. INTRODUCTION ..........................................................................................................................................................9
2. DATA ...................................................................................................................................................................13
2.1. Measuring Deprivation .............................................................................................................................................13
2.2. Dimensions of Deprivation ......................................................................................................................................13
2.3. Reliability Analysis ...................................................................................................................................................16
2.4. Correlations between the Deprivation Dimensions ................................................................................................16
3. DEPRIVATION LEVELS BY COUNTRY ...............................................................................................................................19
4. DEPRIVATION, HOUSEHOLD INCOME AND ECONOMIC STRESS ...................................................................................................21
5. CORRELATION OF BASIC DEPRIVATION WITH MACRO VARIABLES .............................................................................................23
6. MICRO AND MACRO INFLUENCES ON BASIC DEPRIVATION .....................................................................................................25
7. CONCLUSIONS .........................................................................................................................................................31
REFERENCES ..................................................................................................................................................................33
INFORMATION ON THE GINI PROJECT .....................................................................................................................................39

Page • 6
Christopher T. Whelan and Bertrand Maître

Page • 7
Understanding Material Deprivation in Europe
Abstract
In this paper, taking advantage of the inclusion of a special module on material deprivation in EU-SILC 2009,
we provide a comparative analysis of patterns of deprivation. Our analysis identifi es six relatively distinct dimen-
sions of deprivation with generally satisfactory overall levels of reliability and mean levels of reliability across
counties. Multi-level analysis based on 28 European countries reveals systematic variation across countries in the
relative importance of with and between country variation. The basic deprivation dimension is the sole dimension
to display a graduated pattern of variation a across countries. It also reveals the highest correlations with national
and household income, the remaining deprivation dimensions and economic stress. It comes closest to capturing an
underlying dimension of generalized deprivation that can provide the basis for a comparative European analysis of
exclusion from customary standards of living. A multilevel analysis revealed that a range of household and house-
hold reference person socio-economic factors were related to basic deprivation and controlling for contextual
differences in such factors allowed us to account for substantial proportions of both within and between country
variance. The addition of macro-economic factors relating to average levels of disposable income and income ine-
quality contributed relatively little further in the way of explanatory power. Further analysis revealed the existence
of a set of signifi cant interactions between micro socio-economic attributes and country level gross national dis-
posable income per capita. The impact of socio-economic differentiation was signifi cantly greater where average
income levels were lower. Or, in other words, the impact of the latter was greater for more disadvantaged socio-
economic groups. Our analysis supports the suggestion that an emphasis on the primary role of income inequality
to the neglect of differences in absolute levels of income may be misleading in important respects.

Page • 8
Christopher T. Whelan and Bertrand Maître

Page • 9
Understanding Material Deprivation in Europe
1. Introduction
Research on poverty in rich countries relies primarily on household income to capture living standards and dis-
tinguish those in poverty, and this is also true of offi cial poverty measurement and monitoring for policy-making
purposes in those countries. However, awareness has been increasing of the limitations of income and increased
attention has been focused on the role which non-monetary measures of deprivation can play in improving our
measurement and understanding of poverty, and contributing to the design of more effective anti-poverty strate-
gies and policies. This is true when one focuses on an individual country, but even more so when the perspective is
comparative (Nolan and Whelan, 2011, Guio et al 2009). This is refl ected in the inclusion of deprivation indicators
in the EU 2020 Poverty Target.
Poverty is generally viewed as having two core elements: it is about inability to participate that is attributable
to inadequate resources (Citro and Michael, 1995, Townsend, 1979). Most quantitative research then employs
income to distinguish the poor (OECD, 2009). In parallel, though, non-monetary indicators of living standards
and deprivation have also been developed and investigated for many years. A key justifi cation for their use is the
increasing evidence that low income fails in practice to identify those who are unable to participate in their socie-
ties due to lack of resources (Callan et al, 1993, Hallerod, 1996, Ringen, 1987, 1988, Mack and Lansley, 1985).
However, such indicators have also been employed to develop the argument that poverty is ‘not just about money’
and to underpin the case that social exclusion is distinct from and broader than poverty, or that the underlying no-
tion of poverty that evokes social concern is itself intrinsically multi-dimensional and about more than income.
(Nolan and Whelan, 2007, Burchardt, Le Grand. and Piachaud, 2002) In either case, a variety of non-monetary
indicators come into play in seeking to capture such multidimensionality.
The European Union as a whole has been grappling with how best to learn from research and incorporate a
multidimensional perspective into policy design and the monitoring of outcomes. Since 2000 the Social Inclusion
Process has had at its core a set of indicators designed to monitor progress and support mutual learning that is
explicitly and designedly multidimensional. The need for such an approach has become even more salient with
the enlargement of the EU from 2004 to cover countries with much lower average living standards, sharpening the
challenge of adequately capturing and characterising exclusion across the Union (Alber et al 2007). The difference
from richest to poorest member states in terms of average income per head is now very much wider than before.
Widely used income poverty thresholds in the more affl uent member states are higher than the average income in
the poorest member states, and those below them have higher standards of living than the well-off in the poorest

Page • 10
Christopher T. Whelan and Bertrand Maître
countries. The strikingly different picture produced by these ‘at risk of poverty’ indicators compared with average
GDP per head, and unease with the current EU practice of keeping entirely distinct concerns about the divergence
in living standards across versus within countries, helps to motivate interest in moving beyond relying entirely on
relative income. (Brandolini, 2007, Fahey, 2007)
Despite widespread interest in a multidimensional perspective and an increasing volume of research, only
limited progress has been made in teasing out how best to apply it in practice in the EU.1 This state of affairs
refl ects limitations in the information available, but also in the conceptual and empirical underpinnings provided
by existing research. The widespread adoption of the notion of multidimensionality has not meant greater clarity
about precisely what that is intended to mean or why it would be preferable to low income as a focus. Some discus-
sions highlight that the processes giving rise to poverty are multifaceted and cannot be reduced to low income and
its proximate causes: poverty in the highly complex societies of the industrialised world can only be understood
by taking a variety of causal factors and channels into account. Others focus more on outcomes, emphasising that
low income and its correlates are only one aspect of the variety of exclusions that one would wish to empirically
capture, understand and address.
Among the key issues requiring further detailed exploration are the following:
● What is the relationship between different deprivation dimensions and national and household measures of
income?
● What are the relative importance of between and within country sources of variation in deprivation in Euro-
pean and what implications do the answers to this question have for the geographical level at which we analyse
poverty and social exclusion? (Fahey, 2007, Whelan & Maître 2009).
● Which dimensions of deprivation can most fruitfully be used as measures of ‘generalised’ deprivation that
can contribute to enhancing our understanding of poverty and social exclusion understood as “exclusion from
ordinary living patterns, customs and activities (Townsend, 1979:31) and assist in identifying those “whose
resources ------- are so limited as to exclude them from a minimum acceptable way of life in the EU Member
States in which they live? (European Economic Communities, 1985).
● What role do household and national characteristics play in explaining deprivation outcomes? Does the im-
pact of the former vary across country? What role do average income levels and degree of income inequality
play in relation to material deprivation? What are the implications for our understanding of the impact of social
policy?
1 See Besharov and Couc (forthcoming) Boarani and D’Ercole (2006), Gui, Fusco and Marlier (2009), Nolan and Whelan (2011), Tsakl-ogou and Paapadopoulous (2001,2002)

Page • 11
Understanding Material Deprivation in Europe
2. Data
In this paper we make use of the 2009 wave of EU-SILC which includes a special module on materials dep-
rivation. The availability of this module allows us to explore the dimensionality of deprivation. Portugal has been
excluded from our analysis because of missing values on key variables. Our analysis therefore covers 28 countries
comprising 26 European Members together with Norway and Iceland. The total number of households in our
analysis is 205,226.
Our analysis is this survey is based at the household level and we focus on household and Household Refer-
ence Person (HRP) characteristics. The HRP is the individual responsible for the accommodation. Where more
than one such person bears this responsibility we choose the oldest person. Our analysis makes use of 27 measures
of deprivation details of which are provided in the next section. Where questions have been addressed to individu-
als we have assigned the value for the HRP to the household.2
2.1. Measuring Deprivation
2.1.1. Dimensions of Deprivation
In Table 1 we set out the results of an exploratory factory analysis. Our analysis was infl uenced by earlier
studies of dimensionality relating to both the European Community Household Panel Study (ECHP) and EU-SILC
(Fusco et al 2010, Whelan et al 2001, Whelan and Maître, 2007). The solution takes an oblique form in which the
factors are allowed to be correlated. To facilitate interpretation factor coeffi cients are reported only for the factor
on which the item has the highest loading.3 Six relatively distinct dimensions are identifi ed. Each of these factors
has an eigenvalue greater than one in the initial solution and together they account for 53.2% of the total variance.4
The six factor solution is our preferred solution on the grounds of substantive interpretability. The dimensions
identifi ed are as follows.
Basic Deprivation which comprises items relating to enforced absence of a meal, clothes, a leisure activity,
a holiday, a meal with meat or a vegetarian alternative, adequate home heating, shoes. This dimension captures
enforced deprivation relating to relatively basic items. It is dimension that that has obvious content validity in
relation to the objective of capturing inability to participate in customary standards of living due to inadequate
resources. It bears a striking resemblance to the ‘basic deprivation’ measure employed in Ireland as one part of the
2 Further details relating to the deprivation items are available from the author.3 See Layte et al (2001), Whelan et al (2004), Guio et al4 The seventh factor has an eigenvalue of 1.010 and produces a modest increase in the total variance explaines to 57.7

Page • 12
Christopher T. Whelan and Bertrand Maître
national consistent poverty measure. (Whelan, 2007) The factor loadings range from 0.761 for the leisure item to
0.412 for the shoes item. Our expectation is that, since households will to considerable length to avoid deprivation
on these items, the dimensions will be signifi cantly affected by measures of current and longer term resources.
Consumption Deprivation comprises three items relating a PC, a car and an internet connection. It is obviously
a rather limited measure and it would be preferable to have a number of additional items. Our expectation is that
the association with current resources will be weaker than in the case of basic deprivation since the items do not
necessarily refl ect capacity for current expenditure. The factor loadings range from 0.880 for a PC to 0.627.
Household Facilities This dimension is measured by fi ve items relating to a bath and shower, indoor toilet,
hot running water, a washing machine. Since these items represent extreme forms of deprivation refl ecting long-
standing household facilities rather than current consumption, we again expect that a strong association with vari-
ables tapping both current and longer term resources will be observed. However, in this case levels of deprivation
are likely to be extremely modest in the more affl uent countries with implications for the amount of variation that
can be observed. As a consequence conclusions relating to the measure need be treated with some caution. The
factor loadings range from 0.911 for the bath or shower item to 0.382 for a washing machine.
Table 1: Exploratory Oblique Factor Analysis
BASIC CONSUMPTION HEALTH
NEIGHBOURHOOD
ENVIRONMENT
HOUSEHOLD FACILITIES
ACCESS TO PUBLIC SERVICES
HRP_LEISURE .761
HRP_MEAL .750
HRP_MONEY .747
HRP_CLOTHES .728
REPLACE FURNITURE .761
HOLIDAY .636
MEALS WITH MEAT, ETC .604
HOME ADEQUATELY WARM .516
SHOES .412
PC 880
INTERNET CONNECTION .862
CAR? .627
LITTER .693
DAMAGED PUBLIC AMENITIES .661
POLLUTION, .646
CRIME/VIOLENCE/VANDALISM .625
NOISE .585
BATH OR SHOWER .911
INDOOR TOILET .903
HOT RUNNING WATER .835
WASHING MACHINE ? .494
TELEPHONE .382
HRP LIMITED ACTIVITY .866
HRP ILL .840

Page • 13
Understanding Material Deprivation in Europe
HRP HEALTH STATUS .764
ACCESSIBILITY OF PUBLIC TRANSPORT 0.856
ACCESSIBILITY OF POSTAL OR BANKING SERVICES
0.833
Health This dimension is captured by three items relating the health of the HRP. These include current health
status, restrictions on current activity and the presence of a chronic illness. Given the importance of age in relation
to health we anticipate a more modest correlation with economic resources. The factor loadings range from 0.866
for limited activity to .764 for current health status.
Neighbourhood Environment This captures the quality of the neighbourhood/area environment with a set of
fi ve items that include litter, damaged public amenities, pollution, crime/violence/vandalism and noise. Given
the importance of urban/rural residence and location within urban areas in relation to such deprivations, a much
weaker association with resource factors can be expected. The factor loadings range from 0.693 for litter to 0.585
for crime etc.
Access to Public Facilities This measure comprises two items relating to access to public transport and postal
banking services. The loading for the former is 0.856 and for the later 0.833. Again since geographical factors
are likely to play a prominent role, other forms of socio-economic differentiation are likely to be correspondingly
weaker.
2.1.2. Reliability Analysis
In Table 2 we look at the reliability levels for each of the dimensions and the extent to which these levels
vary across counties. Reliability relates to the extent to which individual items are tapping the same underlying
phenomenon. To assess this we make use of Cronbach’s coeffi cient alpha and estimate reliability coeffi cients for
each dimensions.5 The alpha levels for the basic and household facilities are respectively .850 and .795. For health
the level is .762. For access to public facilities and neighbourhood environment the levels fall slightly to .658 and
0.633 respectively. The average alpha across counties differs very little from the overall alpha for basic, health and
neighbourhood environment. For household facilities the average across counties is a good deal lower at 0.550.
This refl ects the unsatisfactorily low levels of reliability in countries such as Denmark, Sweden, Norway, Iceland
and Germany. For access to public facilities the reduction from .658 to 0.570 is a consequence of rather low rates
in counties such as Denmark, Norway, Finland, Iceland, France, Cyprus and the UK.
5 Alpha=Np=/[1 + p(N-1)] where N is equal to the number of items and is p is equal to the mean inter-item correlation

Page • 14
Christopher T. Whelan and Bertrand Maître
Table 2: Reliability of Deprivation Dimensions and Economic StressOVERALL ALPHA AVERAGE ALPHA
BASIC 0.850 0.800
CONSUMPTION 0.711 0.610
HOUSEHOLD FACILITIES 0.795 0.550
NEIGHBOURHOOD ENVIRONMENT 0.633 0.610
HEALTH OF HRP 0.762 0.750
ACCESS TO PUBLIC FACILITIES 0.658 0.570
2.1.3. Correlations between the Deprivation Dimensions
In constructing measures relating to each of these dimensions we have used prevalence weighting across the
range of counties included in our analysis. This involves weighting each component item by the proportion of
households as whole possessing an item or not experiencing the deprivation depending on the format of the ques-
tion. In other words, deprivation on widely available item or experience of a disadvantage that is relatively rare is
treated as more serious than a corresponding deprivation on an item where absence or disadvantage is more preva-
lent. This implicitly involves a “European” reference point in relation to deprivation with a particular magnitude
of deprivation being treated uniformly across counties. This is appropriate since we are interested in both within
and between country variation and we wish to avoid any procedure that by defi nition reduces such variation. In a
fi nal step we standardise scores on each of these dimensions so that they have a potential range running from 0 to
1. The former indicates that the household is deprived in relation to none of the items included in the index while
the later indicates that they experience deprivation in relation to all of the items.
In Table 3 we show the correlations between the deprivations dimensions calculated in this fashion. The cor-
relations between the neighbour environment and access to public facilities and the remaining dimensions are ex-
tremely modest.6 The highest correlation is 0.115 with little more than one per cent of the variance being explained
in any of these cases. A somewhat higher correlation of 0.292 is observed between consumption and health. The
largest correlation of 0.464 is observed between basic and consumption deprivation and followed by one of 0.367
with household facilities. The deprivation dimensions are clearly relatively independent of each other. The basic
deprivation dimension is distinctive in displaying the highest correlation with each of the remaining dimensions
providing evidence of its capacity to tap into generalised deprivation. However, as the magnitude of the correla-
tions suggest, multiple deprivation on any combination of the dimensions will be a great deal modest than the level
for basic deprivation as such. What we observe is a modest pattern of interrelated risk rather than strongly overlap-
ping patterns of deprivation leading to high levels of multiple deprivation.
6 Because of the sample size all correlations are statistically signifi cant

Page • 15
Understanding Material Deprivation in Europe
Table 3: Correlations Between Deprivation DimensionsBASIC CONSUMPTION HEALTH HOUSEHOLD FACILI-
TIES
NEIGHBOURHOOD ENVIRONMENT
BASIC
CONSUMPTION 0.464
HEALTH 0.214 0.095
HOUSEHOLD FACILITIES 0.367 0.292
NEIGHBOURHOOD
ENVIRONMENT
0.144 0.093 0.069 0.015
ACCESS TO PUBLIC FACILITIES 0.115 0.053 0.115 0.124 -.008

Page • 16
Christopher T. Whelan and Bertrand Maître
Page • 17
Understanding Material Deprivation in Europe
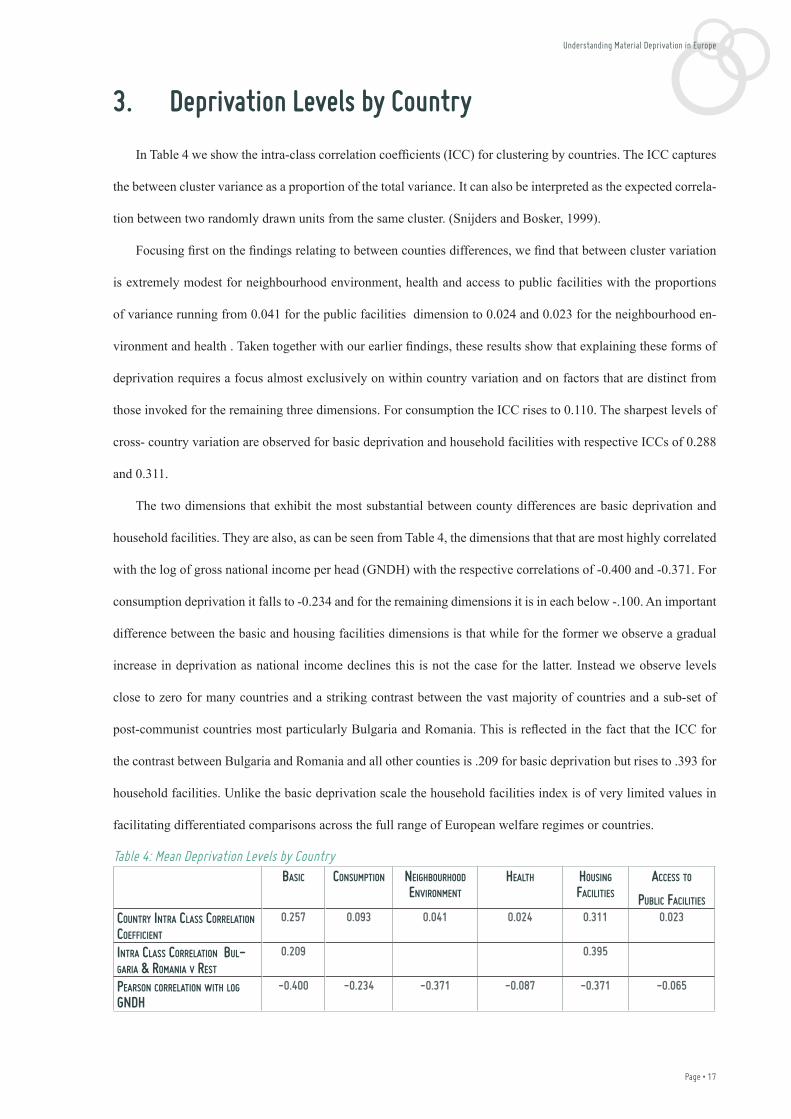
3. Deprivation Levels by Country
In Table 4 we show the intra-class correlation coeffi cients (ICC) for clustering by countries. The ICC captures
the between cluster variance as a proportion of the total variance. It can also be interpreted as the expected correla-
tion between two randomly drawn units from the same cluster. (Snijders and Bosker, 1999).
Focusing fi rst on the fi ndings relating to between counties differences, we fi nd that between cluster variation
is extremely modest for neighbourhood environment, health and access to public facilities with the proportions
of variance running from 0.041 for the public facilities dimension to 0.024 and 0.023 for the neighbourhood en-
vironment and health . Taken together with our earlier fi ndings, these results show that explaining these forms of
deprivation requires a focus almost exclusively on within country variation and on factors that are distinct from
those invoked for the remaining three dimensions. For consumption the ICC rises to 0.110. The sharpest levels of
cross- country variation are observed for basic deprivation and household facilities with respective ICCs of 0.288
and 0.311.
The two dimensions that exhibit the most substantial between county differences are basic deprivation and
household facilities. They are also, as can be seen from Table 4, the dimensions that that are most highly correlated
with the log of gross national income per head (GNDH) with the respective correlations of -0.400 and -0.371. For
consumption deprivation it falls to -0.234 and for the remaining dimensions it is in each below -.100. An important
difference between the basic and housing facilities dimensions is that while for the former we observe a gradual
increase in deprivation as national income declines this is not the case for the latter. Instead we observe levels
close to zero for many countries and a striking contrast between the vast majority of countries and a sub-set of
post-communist countries most particularly Bulgaria and Romania. This is refl ected in the fact that the ICC for
the contrast between Bulgaria and Romania and all other counties is .209 for basic deprivation but rises to .393 for
household facilities. Unlike the basic deprivation scale the household facilities index is of very limited values in
facilitating differentiated comparisons across the full range of European welfare regimes or countries.
Table 4: Mean Deprivation Levels by CountryBASIC CONSUMPTION NEIGHBOURHOOD
ENVIRONMENT
HEALTH HOUSING FACILITIES
ACCESS TO
PUBLIC FACILITIES
COUNTRY INTRA CLASS CORRELATION COEFFICIENT
0.257 0.093 0.041 0.024 0.311 0.023
INTRA CLASS CORRELATION BUL-GARIA & ROMANIA V REST
0.209 0.395
PEARSON CORRELATION WITH LOG GNDH
-0.400 -0.234 -0.371 -0.087 -0.371 -0.065

Page • 18
Christopher T. Whelan and Bertrand Maître
Page • 19
Understanding Material Deprivation in Europe
4. Deprivation, Household Income and Economic Stress
Up to this point we have shown that the basic deprivation index is highly reliable, shows substantial and
graduated variation across counties and is the dimension most highly correlated with other deprivation dimen-
sions and gross national income per head. Before proceeding to focus on this dimension in the remainder of the
paper, we provide further justifi cation for so doing. Interest in the construction of deprivation measures has been
closely related to developing indicators that allow us to complement income measures and enable us to enhance
our understanding the manner in which poverty and social exclusion are experienced. If our interest is in captur-
ing exclusion from customary pattern of living due to lack of resources what we require is a measure or measures
of deprivation that are signifi cantly related to but by no means identical to income. In column two of Table 5 we
show the correlation between the log of equivalised household income and each of the deprivation dimensions.
The strongest correlation of -0.541 is with basic deprivation. Income and basic deprivation are strongly related
but clearly distinct phenomena. The next strongest correlation of -0.439 is with housing facilities followed by one
of -0.344 with consumption. The remaining correlations are extremely modest with values ranging from -0.150 for
health to -0.065 for access to facilities.
One test of the validity of a deprivation indicator that we wish to employ as part of our efforts to understand
national and cross-national patterns of poverty and social exclusion is that it should be related in the expected
manner to patterns of subjective economic stress. In column three we show the relationship between each of the
measures of deprivation and an index of economic stress. This indicator is a weighted prevalence measure stand-
ardised for scores to run from 0 to 1 constructed from a set of dichotomous items relating to diffi culty in making
ends meet, inability to cope with unanticipated expenses, arrears and housing costs being a burden.7 The Cronbach
alpha reliability for the scale involving these items is 0.70 and the average reliability is also 0.70. From Table 5 we
can see that highest correlation with economic stress of 0.647 is with basic deprivation. The next highest value of
0.360 is associated with consumption deprivation. The remaining associations are relatively modest and are close
to 0.2 for household facilities before falling to close to zero for access to public facilities.
The basic deprivation measure therefore provides us with a measure that is highly reliable across counties,
displays variation across the full range of counties, captures generalized deprivation most successfully and bears
the strongest relationship of any of the deprivation indicators to both national and household income and subjec-
tive economic stress. In the analysis that follows we focus exclusively on this dimension and seek to explore the
role of both micro and macro variables in accounting for within and between country variation.
7 Further details are available from the authors

Page • 20
Christopher T. Whelan and Bertrand Maître
Table 5: Correlation between Log of Equivalent Income and Economic Stress and Deprivation DimensionsCORRELATIONS
LOG OF EQUIVALENT INCOME ECONOMIC STRESS
BASIC -0.541 0.647
CONSUMPTION -0.344 0.360
HOUSEHOLD FACILITIES -0.439 0.201
HEALTH -0.150 0.171
NEIGHBOURHOOD -0.086 0.167
ACCESS TO PUBLIC FACILITIES -0.065 0.009

Page • 21
Understanding Material Deprivation in Europe
5. Correlation of Basic Deprivation with Macro Variables
Before proceeding to multivariate analysis of the micro and macro factors associated with basic deprivation
we extend our analysis relating to the degree of association between such deprivation and macro-economic factors.
Kenworthy et al (2011) having established that in most counties economic growth has led to rising incomes for low
end households, poses the question of whether growth has been similarly helpful in reducing material deprivation.
Employing a 7-item material deprivation index developed by Boarini and d’Ercole (OECD, 2008) they examine
the relationship between material deprivation and GDP per capita and social policy generosity for fi fteen countries
comprising a number of the more affl uent counties together with Australia and the US.8 They found no associa-
tion to speak of between per capita GDP and material deprivation. However, they found a signifi cant relationship
between social policy generosity, as captured by government social expenditure as a percentage of GDP (GSP)
and material deprivation.
In Table 6 we look at the relationships of selected macro-economic variables to the basic deprivation index.
We also report the correlations for Gross National Disposable Income per capita (GNDH) and GINI.9 Unlike Ken-
worthy et al (2011), we fi nd a clear association of -0.396 between our deprivation measure and GDP per capita.
A similar association of -0.400 is observed between the GNDH measures which is very closely correlated with
GDP. We also observe a signifi cant correlation of -0.312 for the GSP measure. Finally, we observe a correlation
of -0.192 for GINI.
Table 6: Correlations between Basic Deprivation and Macro VariablesGDP PER CAPITA -0.396***
GROSS NATIONAL DISPOSABLE INCOME PER CAPITA (GNDH) -0.400***
GOVERNMENT SOCIAL EXPENDITURE AS % OF GSP (GSP) -0.213**
GINI 0.192***
*** p < .001
In the analysis that follows we focus on GNDH as our preferred measure of absolute living standards but given
that it is almost perfectly correlated with the GDP measure substituting the latter would have little effect on our
conclusions. Further analysis revealed that adding the GSP measure to GINI provided little in the way of additional
explanatory power. This has the advantage of allowing us to connect to a wider sociological literature relating to
8 This measure was adjusted for unemployment policies and proportion of the population over sixty-fi ve,9 The source for the macroeconomic variables is Eurostat with the exception of the MMDI below the mean which are the authors own
calculations

Page • 22
Christopher T. Whelan and Bertrand Maître
the impact of absolute income differences and income inequality (Wagstaff and Doorsalter, 2000, Wilkinson and
Pickett, 2009). While it is possible to assess the extent to which particular variables add to our explanatory power,
it is clear that a cross-sectional analysis with only 28 macro units cannot provide the basic for a causal analysis of
a set of highly correlated macro variables.

Page • 23
Understanding Material Deprivation in Europe
6. Micro and Macro Influences on Basic Deprivation
In Table 7 we present a set of hierarchical multilevel regressions. These equations are appropriate to a popula-
tion with a hierarchical structure where individual observations within higher level clusters, such as countries, are
not independent. Taking into account such clustering allows to avoid “the fallacy of the wrong level” involved in
analysing data at one level and drawing conclusions at another and, in particular, ensures that we do not fall prey
to the ecological fallacy (Hox, 2010).
The fi rst equation involving the so called empty model does not included any independent variables. The
intra-class correlation coeffi cient (ICC) for this model is 0.257. In model (ii) we add income and a range of socio-
demographic variables. A very clear and systematic pattern of variation is observed across socio-demographic
groups. In addition to the income effect, those drawn from lower social classes, less educated groups, the unem-
ployed and those with a disability, women, lone parents, those separated/widowed/divorced, those in the middle
of the life-course, having three or more children, being non-European and tenants are likely to be more deprived.
These relationships are all highly signifi cant and the patterns of differentiation are entirely consistent with our
understanding of the latent dimension of generalized deprivation that the deprivation index is tapping. This model
reduces the ICC to 0.084. It reduces the country variance by 0.801, the individual variance by 0.204 and the overall
variance by 0.357. Thus not only does this set of socio-demographic variables account for a substantial portion
of within country variance in basic deprivation but by controlling for cross-country compositional differences in
relation to such factors it accounts for four fi fths of the between country variance.
In equation (iii) we enter the macro variables GNDH and GINI without any micro variables. When we do so
the coeffi cient for GINI is not signifi cant and it adds little to the explanatory power of the GNDH measure. The
macro variables account for 0.774 of the between country variance and consequently 0.073 of the total variance. In
equation (iv) we enter both the household and HRP characteristics and GNDH. The micro coeffi cients are identical
to those in equation (ii) but the net effect of log GNDH declines from -0.253 to -0.068. Entering GNDH increase
the proportion of between country variance explained from 0.801 to 0.837 and the total variance accounted for
from 0.357 to 0.367. However, it produces only the most marginal reduction in log likelihood ratio estimate. The
introduction of macro variables adds almost nothing to the explanatory power of the micro variables.
Our analysis to this point assumes that macro and micro-factors combine in an additive fashion. However,
one plausible hypothesis is that the impact of socio-economic factors on basic deprivation is contingent on the
level of income in the society. In that case levels of deprivation will differ between more and less affl uent socie-

Page • 24
Christopher T. Whelan and Bertrand Maître
ties not only because of compositional differences relating to a range of socio-economic factors but also because
the consequences of socio-economic disadvantage for the level of basic deprivation experienced by households
are greater the lower the average level of disposable income in a country. In equation (v) we allow for interaction
between GNDH and a range of micro socio-economic attributes. The fi ndings reported in equation (v) make it
abundantly clear that the role of both micro and macro variables cannot be understood independently of each other.
The consequences of being in a lower social class are crucially dependent on the level of GNDH in the respond-
ent. The impact of the HRP being in a lower social class, lacking educational qualifi cations, being unemployed,
having three or more children and marital disruption increases as the log of GNDH declines. Put another way, the
impact of lower GNDH is signifi cantly greater for more disadvantaged socio-economic groups than for those more
favoured. There is no one set of country differences. The consequences of being in a country with low income
is signifi cantly affected by the HRP’s social class10, educational qualifi cations, labour market position, marital
and parental status, housing situation. Cross-national differences in basic deprivation will be signifi cantly greater
among disadvantaged groups than for their more favoured counterparts as a consequence of substantially sharper
patterns of social stratifi cation in less prosperous counties. The variables included in equation fi ve account for
0.855 of the cross-national variance, 0.214 of the within country variance and 0.379 of the total variance. The log
likelihood ratio is reduced by 2,698.2 for the addition of 10 degrees of freedom. Thus taking into account both
compositional differences in relation to key socio-economic factors and the differential impact of a number of key
factors across
Table 7: Multilevel Random Intercept Model for Basic Deprivation: HRP and Macro Predictors(I) (II) (III) (IV) (V)
FIXED EFFECTS
LOG INCOME -0.108*** -0.102*** -0.100***
SOCIAL CLASS
REF: HIGHER P & M & SELF-EMPLOYED WITH EMPLOYEES
LOWER P & M 0.009*** 0.009*** 0.008***
SELF-EMPLOYED WITHOUT EMPLOYEES 0.009*** 0.009** 0.009***
LOWER NON-MANUAL 0.016*** 0.016*** 0.014***
FARMERS WITH EMPLOYEES 0.005*** 0.005*** 0.004 ns
FARMERS WITHOUT EMPLOYEES 0.019*** 0.019*** 0.016***
LOWER SERVICE & TECHNICAL 0.046*** 0.046*** 0.044***
ROUTINE 0.059*** 0,059*** 0.055***
NEVER WORKED 0.033*** 0.033*** 0.034***
PRE-PRIMARY 0.082*** 0.082*** 0.087***
PRIMARY 0.046*** 0.046*** 0.050***
LOWER SECONDARY 0.034*** 0.034*** 0.036***
HIGHER SECONDARY 0.010*** 0.010*** 0.013***
10 The measure of social class employed as a version of the European Socio-economic classifi cation (ESeC) which takes advantage of the availability of information relating to the presence of employees for both farmers and other self-employed

Page • 25
Understanding Material Deprivation in Europe
SEPARATED/WIDOWED/DIVORCED 0.022*** 0.022*** 0.021***
FEMALE 0.020*** 0.020*** 0.020***
NON-EUROPEAN 0.044*** 0.044*** 0.044***
AGE 30-44 0.028*** 0.028*** 0.028***
AGE 50-64 0.045*** 0.045*** 0.041***
AGE <65 0.014*** 0.014*** 0.013***
NUMBER OF CHILDREN 3+ 0.032*** 0.032*** 0.034***
MARKET TENANT 0.045*** 0.045*** 0.049***
OTHER TENANT 0.036*** 0.036*** 0.037***
LONE PARENT 0.042*** 0.042*** 0.044***
LABOUR FORCE STATUS
UNEMPLOYED 0.068*** 0.068*** 0.072***
ILL/DISABLED 0.094*** 0.094*** 0.099***
MACRO VARIABLES
LOG GNDH (DEVIATION FROM MEAN) -0.253*** -0.068** 0.016 ns
GINI (DEVIATION FROM MEAN) 0.044 ns
INTERACTIONS
LOG GNDH* FARMERS WITHOUT EMPLOYEES -0.028***
LOG GNDH* LOWER SERVICE & TECHNICAL -0.055***
LOG GNDH* ROUTINE -0.055***
LOG GNDH* NEVER WORKED -0.063***
LOG GNDH*PRIMARY -0.094***
LOG GNDH* LOWER SECONDARY -0.100***
LOG GNDH* HIGHER SECONDARY -0.053***
LOG GNDH* NUMBER OF CHILDREN 3+ -0.070***
LOG GNDH *SEPARATED/WIDOWED/DIVORCED -0.029***
INTERCEPT 0.152 1.020 0.155 1.020 0.984
RANDOM EFFECTS
VARIANCE
COUNTRY 0.013 0.003 0.003 0.002 0.002
INDIVIDUAL 0.038 0.030 0.038 0.030 0.030
INTRA CLASS CORRELATION COEFFICIENT 0.257 0.084 0.073 0.066 0.061
REDUCTION IN COUNTRY VARIANCE 0.801 0.774 0.837 0.855
REDUCTION IN INDIVIDUAL VARIANCE 0.204 0.000 0.204 0.214
REDUCTION IN TOTAL VARIANCE 0.357 0.199 0.367 0.379
LOG LIKELIHOOD RATIO -44,404.8 67,608.6 -55,425.6 67,612.6 -68,860.8
N 203,795 203,795 203,795 203,795 203,795
*p < .1, ** p < .01, *** p < .001
countries allows us to largely account for cross-country differences in levels of basic deprivation.
In further analysis we have examine the effect of allowing for a comparable set of interactions with GINI.
While there is a tendency for the impact of some of the socio-economic characteristics to be stronger where GINI is
higher, these effects are considerably weaker than in the case of GNDH. Adding the terms involving GINI to those
included in equation (v) produces an extremely modest reduction of 82.1 in the log likelihood for 10 degrees of

Page • 26
Christopher T. Whelan and Bertrand Maître
freedom. In contrast adding the GNDH terms to the equation involving the GINI interaction produces a reduction
of 1,224.1.We explored this issue further by substituting for GINI in our analysis a measure proposed by Checci,
Visser and Van de Werfhorst (2010) and Lancee and van de Werfhorst (2011) based on the Mean Distance to Me-
dian Income (MMDI) below the median which, by focusing on inequality at the lower end of the income distribu-
tion, might possibly capture effects on deprivation not captured by GINI. However, the equation involving the set
of MMDI below the median terms produces a reduction in the log likelihood of only 100.4. The corresponding
addition where the GNDH terms are added to the MMDI blow the median effects is 1,278.8.
In order to explore further the implications of our results in Table 8 we set out the gross effects of welfare
regime differentiation and the net effects when the dummy variables for welfare regimes are entered after the full
set of terms included in equation (v) in Table 7. The welfare regimes distinguished are as follows.
● The social democratic regime comprises Sweden, Denmark, Iceland, Finland, Norway and Netherlands.
● The corporatist regime includes Germany, Austria, Belgium, France and Luxembourg.
● The liberal regime is made up of Ireland and the UK
● The southern European regime comprises Cyprus, Greece, Italy, Portugal, Spain and Malta
● The post-socialist corporatist regime includes Czech Republic, Hungary, Poland, Slovenia and Slovakia are
included in this cluster.
● The post-socialist liberal regime comprises the Baltic comprising Estonia, Latvia, Lithuania
● The residual regime is made up of Bulgaria and Romania
The gross effects are generally in line with expectations. With the residual regime as the reference category,
the lowest level of deprivation is observed for the social democratic regime with a coeffi cient of -0.413. The level
for the corporatist and liberal regimes differ very little with respective coeffi cients of -0.355 and -0.362. The level
increases gradually across the remaining regimes. The welfare state dummies account for 0.861 of the country
variance. However, when the welfare state dummies are entered after the terms entered in equation (v) of Table 7
they add little in the way of explanatory power. They reduce the value of the log likelihood by a mere 7.8 for the
use of six degrees of freedom. The pattern of coeffi cient refl ect a general tendency for all of the remaining welfare
regimes to have lower levels of basic deprivation than the residual regime rather than any substantively interpret-
able pattern of welfare regime effects as such. In any event, only those relating to the post-communist cluster are
signifi cant beyond the 0.1 level.

Page • 27
Understanding Material Deprivation in Europe
Table 8: Multilevel Intercept Model for Welfare Regime EffectsGROSS NET (CONTROLLING FOR HOUSEHOLD/HRP CHARACTERISTICS, GDH &
INTERACTIONS
WELFARE REGIME
SOCIAL DEMOCRATIC -0.413*** -0.105*
CORPORATIST -0.355*** -0.066 ns
LIBERAL -0.362** -0.100*
SOUTHERN EUROPEAN -0.306*** -0.084*
POST-COMMUNIST CORPORATIST -0.254*** -0.111***
POST-COMMUNIST LIBERAL -0.208** -0.110***
INTERCEPT 0.452 1.072
RANDOM EFFECTS
VARIANCE
COUNTRY 0.002 0.001
INDIVIDUAL 0.038 0.030
INTRA CLASS CORRELATION COEFFICIENT 0.046 0.036
REDUCTION IN COUNTRY VARIANCE 0.861 0.917
REDUCTION IN INDIVIDUAL VARIANCE 0.000 0.214
REDUCTION IN TOTAL VARIANCE 0.221 0.395
-2 LOG LIKELIHOOD --44,432.5 -68.868.6.
N 20,795 203,795
*p < .1, ** p < .01, *** p < .001

Page • 28
Christopher T. Whelan and Bertrand Maître

Page • 29
Understanding Material Deprivation in Europe
7. Conclusions
In this paper we have sought to take advantage of the special module on material deprivation in EU-SILC
2009 in order to enhance our understanding of the dimensionality of deprivation and the role of micro and macro
factors in accounting for such deprivation. Our analysis identifi ed six dimensions of deprivation which are only
modestly correlated. Further analysis established that it was possible to construct measures of such dimensions
which displayed high levels of overall reliability and fairly uniform patterns of reliability across counties. The
most important exception to this conclusion was in relation to the housing facilities dimension in more affl uent
counties arising from the extremely low numbers reporting such deprivation.
Analysis of deprivation levels across countries and revealed that for health, neighbourhood environment and
access to public facilities variation was largely within counties and consequently analysis of such forms of depri-
vation requires a focus on factors that vary largely within counties. Consideration of the correlations of between
deprivation dimensions indicated that such factors are largely independent of those that play an important role in
relation to, for example, basic deprivation. For both basic deprivation and household facilities between country dif-
ferences account for over a quarter of the total variance. However, in the latter case the major contrast is between
the post-socialist and residual welfare regimes and all others and indeed between the latter and the remaining
clusters. This raises issues about employing a measure for comparative purposes where scores approach zero for a
number of countries. For basic deprivation dimension on the other hand variation is observed across the range of
countries and our subsequent analysis focused on this dimension. Further justifi cation for singling out this dimen-
sion was provided by the fact it is the form of deprivation most strongly associated with the remaining forms of
deprivation and national and household income and economic stress.
A multilevel analysis showed that a broad range of socio-economic variables were associated with basic
deprivation with the patterns of differentiation being entirely in line with our expectations in relation to factors
such as social class, educational qualifi cations and labour market experience. Controlling for such differences in
composition across counties allows us to account for eighty per cent of the cross-national variation. Adding gross
national disposable income per capita (GNDH) contributes very little in the way of explanatory power while the
GINI measure is statistically insignifi cant once we control for GNDH. In order to understand the role of GNDH it
is crucial to take into account the manner in which it interacts with a number of key HRP characteristics. An unam-
biguous pattern emerges whereby the impact of GNDH is signifi cantly greater for less favoured socio-economic

Page • 30
Christopher T. Whelan and Bertrand Maître
groups. Or looked at in another way, the impact of factors such as social class, education, labour market experi-
ence, family size and marital disruption is signifi cantly more powerful in countries with low average income levels.
Our analysis suggests that variation in basic deprivation across the set of European counties on which we have
focused is largely accounted for by cross-national variation in a range of socio-economic characteristics and the
manner in which a sub-set of these infl uences interact with gross disposable national income.. Once we have taken
these factors into account other macro characteristics provided no additional explanatory power. No comparable
set of effects was observed involving GINI or the Mean Median Distance to the Median below the median Substi-
tuting other variables relating to generosity of social policy for GINI such as social expenditure as a percentage of
GDP, in no way alters this conclusion. Given our fi ndings it seems highly unlikely that further refi nements of the
social expenditure variable (Kenworthy et al, 2011) or the substitution of social benefi ts levels for social expendi-
ture would signifi cantly alter change the picture (Nelson, forthcoming).
What does this imply in terms of social policy? Kenworthy (2011: 15-16) in exploring whether growth is
good for the poor concludes that for the seventeen counties involved in his analysis economic growth allowed
policymakers to boost infl ation adjusted benefi t levels. None of the countries signifi cantly increased the percent-
age of GDP going to social transfers during this period. This is line with our fi nding regarding the minimal direct
role of GINI and generosity of social expenditure. However, as Kenworthy (2001:16) notes, whether or not to
pass on the benefi ts of economic growth is a policy choice and to points to evidence that countries with that were
comparatively high in social policy generosity were most likely to do so. The evidence that we have presented in
relation to the interaction of key socio-economic variables suggests that this “trickle down” effect has been fairly
widespread in the counties in our analysis. However, our analysis also suggest that in addition to increasing levels
of income being associated with a lessening of the impact of socio-economic circumstances, it is also associated
with a restructuring of the distribution of favourable and unfavourable economic circumstances that has a substan-
tial impact on cross-national differences in levels of basic deprivation.
Clearly it is not possible to disentangle such infl uences in a cross-sectional analysis. However, the gross ef-
fect of welfare regime clusters was entirely accounted for by the socio-economic factors on which we focused and
their interaction with national income levels. However, our analysis supports the view put forward by Kenworthy
(2011:1-4) that concern with inequality and relative poverty should not lead us to neglect the importance of ab-
solute income levels. It is also consistent with the view that the currently fashionable emphasis on primary role
of inequality rather than the role of material factors may be misleading in important respects. (Goldthorpe, 2009,
Lynch et al 2000, Wilkinson and Pickett, 2009).

Page • 31
Understanding Material Deprivation in Europe
References
Alber, J., Fahey, T. and Saraceno, C. (2007). Introduction: EU enlargement and quality of life: The context and purpose of the book. In Alber, J. (Ed.) et al. Handbook of Quality of Life in the Enlarged European Union. Oxon: Routledge.
Boarini, R., & Mira d’Ercole, M. (2006). Measures of material deprivation in OECD countries. OECD Social Employment and Migration Working Papers No. 37. Paris: OECD.
Brandolini, D. (2007). Measurement of Income Distribution in Supranational Entities: the Case of the European Union in J. Micklewright and S. Jenkins (eds) Inequality and Poverty Re-examined. Oxford: Oxford Univer-sity Press.
Burchardt, T., Le Grand, J., & Piachaud, D. (2002). Degrees of exclusion: Developing a
dynamic, multidimensional measure. In J. Hills, J. Le Grand, & D. Piachaud (Eds.), Understanding Social Exclu-sion . Oxford: Oxford University Press
Callan, T., Nolan, B. and Whelan, C. T. (1993). Resources, deprivation and the measurement of poverty. Journal of Social Policy, 22, 141–172.
Checci, D., Visser, J. and van Der Werfhorst, H, (2010), Inequality and Union Membership: The Infl uence of Rela-tive earnings and Inequality Attitudes’, british Journal of Industrial Relations, 48: 84-108
Fahey, T. (2007). The case for an EU-wide measure of poverty. European Sociological Review, 23, 35–47.
Fusco, A, Guio, A-C and Marlier, E. (2010), ‘Characterising the Income Poor and the Materially Deprived in European Countries’, in A. B. Atkinson and E. Marlier (eds), Inccome and Living Conditions in Europe. Lux-embourg: Publications Offi ce of the European Union
Goldthorpe, J. H. (2009), ‘Analysing Social Inequality: A Critique of Two Recent Contributions from Economics and Epidemiology’, European Sociological Review. 26, 6, 731-744.
Guio, A.-C. (2009), What can be learned from deprivation indicators in Europe? Eurostat Methodologies and Working paper. Eurostat Luxembourg
Halleröd, B. (1995). The truly poor: Direct and indirect measurement of consensual poverty
in Sweden. Journal of European Social Policy, 5, 111–129.
Hox, J. (2010). Multilevel Analysis: Techniques and Applications, Second Edition, Routledge: New York & Hove.
Lancee, B and van der Werfhorst, H. (2011), Income inequality and Participation: A Comparison of 34 Counties, GINI Discussion Paper 6
Lynch, J. et al (2004), ‘Is income inequality a determinant of population health? (Parts 1 and 2), Milbank Quar-terly, 82, 5-99 and 355-400.
Kenworthy, L. (2011), Progress for the Poor, Oxford: Oxford University Press
Kenworthy, L. Epstein, J and Duerr, D. (2011), ‘Generous social policy reduces material deprivation’ in L. Ken-worthy, L. Progress for the Poor, Oxford: Oxford University Press
Mack, J., & Lansley, S. (1985). Poor Britain. London: Allen and Unwin
Nelson, K. (forthcoming), ‘Counteracting material deprivation: the role of social assistance in Europe’, Journal of European Social Policy

Page • 32
Christopher T. Whelan and Bertrand Maître
Nolan, B. and Whelan, C.T. (2007). On the multidimensionality of poverty and social exclusion. In Micklewright, J. and Jenkins, S. (Eds.), Poverty and Inequality: New Directions. Oxford: Oxford University Press.
Nolan, B. and Whelan, C.T. (2007). Poverty and Deprivation in Europe. Oxford: Oxford University Press.
Ringen, S. (1988). Direct and indirect measures of poverty. Journal of Social Policy, 17, 351–366.
Snijders, T. A. and Bosker, R (1999), Multilevel Analysis: An introduction to basic and advanced multi-level mod-elling, Thousand Oaks CA: Sage
Townsend, P. (1979), Poverty in the United Kingdom, Penguin: Harmondsworth.
Wagstaff, A. and van Doorslaer (2000), ‘Income Inequality and Health: What Does the Literature Tell Us?’, An-nual Review of Public Health, 21, 543-67
Whelan, C. T., Layte, R., Maître, B., & Nolan, B. (2001). Income, deprivation and economic
strain: An analysis of the European Community Household Panel. European Sociological
Review, 17, 357–372.
Whelan, C. T. and Maître, B. (2007), ‘Measuring Material Deprivation with EU-SIC: Lessons from the Irish Sur-vey’, European Societies, 9:147-73
Whelan, C. T. and Maître, B. (2009). Europeanization of inequality & European reference group. Journal of Eu-ropean Social Policy, 19, 117–130.
Wilkinson, R. and Pickett, K. (2009a). ‘Income Inequality and Social Function’, The Annual Review of Sociology, 33: 493-511
Wilkinson, R. and Pickett, K. (2009b), The Spirit Level, London: Routledge.

Page • 33
Understanding Material Deprivation in Europe
GINI Discussion PapersRecent publications of GINI. They can be downloaded from the website www.gini-research.org under the subject
Papers.
DP 36 Material Deprivation, Economic Stress and Reference Groups in Europe: An Analysis of EU-SILC 2009 Christopher T. Whelan and Bertrand Maître March 2011
DP 35 Unequal inequality in Europe: differences between East and West Clemens Fuest, Judith Niehues and Andreas Peichl November 2011
DP 34 Lower and upper bounds of unfair inequality: Theory and evidence for Germany and the US Judith Niehues and Andreas Peichl November 2011
DP 33 Income inequality and solidarity in Europe Marii Paskov and Caroline Dewilde March 2012
DP 32 Income Inequality and Access to Housing in Europe
Caroline Dewilde and Bram Lancee March 2012
DP 31 Forthcoming: Economic well-being… three European countries
Virginia Maestri
DP 30 Forthcoming: Stylized facts on business cycles and inequality
Virginia Maestri
DP 29 Forthcoming: Imputed rent and income re-ranking: evidence from EU-SILC data
Virginia Maestri
DP 28 The impact of indirect taxes and imputed rent on inequality: a comparison with cash transfers and direct taxes in five EU countries
Francesco Figari and Alari Paulus January 2012
DP 27 Recent Trends in Minimim Income Protection for Europe’s Elderly
Tim Goedemé February 2012
DP 26 Endogenous Skill Biased Technical Change: Testing for Demand Pull Effect
Francesco Bogliacino and Matteo Lucchese December 2011
DP 25 Is the “neighbour’s” lawn greener? Comparing family support in Lithuania and four other NMS
Lina Salanauskait and Gerlinde Verbist March 2012
DP 24 On gender gaps and self-fulfilling expectations: An alternative approach based on paid-for-training
Sara de la Rica, Juan J. Dolado and Cecilia García-Peñalos March 2012
DP 23 Automatic Stabilizers, Economic Crisis and Income Distribution in Europe
Mathias Dolls , Clemens Fuestz and Andreas Peichl December 2011

Page • 34
Christopher T. Whelan and Bertrand Maître
DP 22 Institutional Reforms and Educational Attainment in Europe: A Long Run Perspective
Michela Braga, Daniele Checchi and Elena Meschi December 2011
DP 21 Transfer Taxes and InequalIty
Tullio Jappelli, Mario Padula and Giovanni Pica December 2011
DP 20 Does Income Inequality Negatively Effect General Trust? Examining Three Potential Problems with the Inequality-Trust Hypothesis
Sander Steijn and Bram Lancee December 2011
DP 19 The EU 2020 Poverty Target
Brian Nolan and Christopher T. Whelan November 2011
DP 18 The Interplay between Economic Inequality Trends and Housing Regime Changes in Advanced Welfare Democracies: A New Research Agenda
Caroline Dewilde November 2011
DP 17 Income Inequality, Value Systems, and Macroeconomic Performance
Giacomo Corneo September 2011
DP 16 Income Inequality and Voter Turnout
Daniel Horn October 2011
DP 15 Can higher employment levels bring down poverty in the EU?
Ive Marx, Pieter Vandenbroucke and Gerlinde Verbist October 2011
DP 14 Inequality and Anti-globalization Backlash by Political Parties
Brian Burgoon October 2011
DP 13 The Social Stratification of Social Risks. Class and Responsibility in the ‘New’ Welfare State
Olivier Pintelon, Bea Cantillon, Karel Van den Bosch and Christopher T. Whelan September 2011
DP 12 Factor Components of Inequality. A Cross-Country Study
Cecilia García-Peñalosa and Elsa Orgiazzi July 2011
DP 11 An Analysis of Generational Equity over Recent Decades in the OECD and UK
Jonathan Bradshaw and John Holmes July 2011
DP 10 Whe Reaps the Benefits? The Social Distribution of Public Childcare in Sweden and Flanders
Wim van Lancker and Joris Ghysels June 2011
DP 9 Comparable Indicators of Inequality Across Countries (Position Paper)
Brian Nolan, Ive Marx and Wiemer Salverda March 2011
DP 8 The Ideological and Political Roots of American Inequality
John E. Roemer

Page • 35
Understanding Material Deprivation in Europe
March 2011
DP 7 Income distributions, inequality perceptions and redistributive claims in European societies
István György Tóth and Tamás Keller February 2011
DP 6 Income Inequality and Participation: A Comparison of 24 European Countries + Appendix
Bram Lancee and Herman van de Werfhorst January 2011
DP 5 Household Joblessness and Its Impact on Poverty and Deprivation in Europe
Marloes de Graaf-Zijl January 2011
DP 4 Inequality Decompositions - A Reconciliation
Frank A. Cowell and Carlo V. Fiorio December 2010
DP 3 A New Dataset of Educational Inequality
Elena Meschi and Francesco Scervini December 2010
DP 2 Are European Social Safety Nets Tight Enough? Coverage and Adequacy of Minimum Income Schemes in 14 EU Countries Francesco Figari, Manos Matsaganis and Holly Sutherland June 2011
DP 1 Distributional Consequences of Labor Demand Adjustments to a Downturn. A Model-based Approach with Application to Germany 2008-09
Olivier Bargain, Herwig Immervoll, Andreas Peichl and Sebastian Siegloch September 2010

Page • 36
Christopher T. Whelan and Bertrand Maître

Page • 37
Understanding Material Deprivation in Europe
Information on the GINI project
Aims
The core objective of GINI is to deliver important new answers to questions of great interest to European societies: What are the social, cultural and political impacts that increasing inequalities in income, wealth and education may have? For the answers, GINI combines an interdisciplinary analysis that draws on economics, sociology, political science and health studies, with improved methodologies, uniform measurement, wide country coverage, a clear policy dimension and broad dissemination.
Methodologically, GINI aims to:
● exploit differences between and within 29 countries in inequality levels and trends for understanding the impacts and teasing out implications for policy and institutions,
● elaborate on the effects of both individual distributional positions and aggregate inequalities, and
● allow for feedback from impacts to inequality in a two-way causality approach.
The project operates in a framework of policy-oriented debate and international comparisons across all EU countries (except Cyprus and Malta), the USA, Japan, Canada and Australia.
Inequality Impacts and Analysis
Social impacts of inequality include educational access and achievement, individual employment oppor-tunities and labour market behaviour, household joblessness, living standards and deprivation, family and household formation/breakdown, housing and intergenerational social mobility, individual health and life expectancy, and social cohesion versus polarisation. Underlying long-term trends, the economic cycle and the current financial and economic crisis will be incorporated. Politico-cultural impacts investigated are: Do increasing income/educational inequalities widen cultural and political ‘distances’, alienating people from politics, globalisation and European integration? Do they affect individuals’ participation and general social trust? Is acceptance of inequality and policies of redistribution affected by inequality itself ? What effects do political systems (coalitions/winner-takes-all) have? Finally, it focuses on costs and benefi ts of policies limiting income inequality and its effi ciency for mitigating other inequalities (health, housing, education and opportunity), and addresses the question what contributions policy making itself may have made to the growth of inequalities.
Support and Activities
The project receives EU research support to the amount of Euro 2.7 million. The work will result in four main reports and a fi nal report, some 70 discussion papers and 29 country reports. The start of the project is 1 February 2010 for a three-year period. Detailed information can be found on the website.
www.gini-research.org

Amsterdam Institute for Advanced labour Studies
University of Amsterdam
Plantage Muidergracht 12 1018 TV Amsterdam The Netherlands
Tel +31 20 525 4199 Fax +31 20 525 4301
[email protected] www.gini-research.org
Project funded under the Socio-Economic sciencesand Humanities theme.