understanding scale as a boundary object
DESCRIPTION
scientific article on scaleTRANSCRIPT

Ecological Economics 76 (2012) 15–24
Contents lists available at SciVerse ScienceDirect
Ecological Economics
j ourna l homepage: www.e lsev ie r .com/ locate /eco lecon
Methods
A boundary object for scale selection — Moderating differences andsynergising understanding
S.S. Keshkamat a,⁎, A. Kooiman b, M.F.A.M. van Maarseveen a, A. van der Veen a, M.H.P. Zuidgeest a
a Faculty of Geo-Information Science and Earth Observation, University of Twente, The Netherlands, Hengelosestraat 99, 7514AE Enschede, The Netherlandsb SERVIR-Africa, Regional Centre for Mapping of Resources for Development, Kasarani Road, Nairobi, Kenya
⁎ Corresponding author.E-mail address: [email protected].
0921-8009/$ – see front matter © 2012 Elsevier B.V. Alldoi:10.1016/j.ecolecon.2012.01.013
a b s t r a c t
a r t i c l e i n f oArticle history:Received 15 July 2011Received in revised form 8 December 2011Accepted 13 January 2012Available online 8 February 2012
Keywords:ScaleBoundary objectConceptual frameworkIssues of scalePolitics of scaleStakeholderIdentification
Lack of attention to scale selection may limit the utility of multidisciplinary assessments and studies. Thispaper integrates research on scale from several disciplines to identify commonalities.Boundary objects – flexible enough to appeal and apply to different interest groups, and yet robust enough tomaintain core concepts – offer a medium to connect findings from different disciplines.We propose a boundary object on scale— a 3-dimensional framework, whose axes are reality-, model- and data-scale. This framework can be applied to facilitate an improved transdisciplinary understanding of scale andmoreconscious scale selection that promotes the credibility, salience and legitimacy of decision support systems.
© 2012 Elsevier B.V. All rights reserved.
1 Baumgärtner et al. (2008) defined the cooperation of two or more scientific disci-
1. Introduction
The prefixing of terms such as ‘large-scale’ ‘small-scale’, ‘micro-scale’to a subject is as common in development initiatives, infrastructure pro-ject financing, impact assessment and spatial planning, as it is in themore empirical and philosophical fields. In colloquial vocabulary, it isoften used quite subjectively, based on the author's (or speaker's)own perceptions. Such colloquial use does not necessarily reflect or af-fect an actual geographical extent and therefore may not influence theimplementation or outcomes of a decision or process. However, thechoice of scale carries much weight and may well affect the outcomeand sustainability of a project. One FAO publication provides a simpleinstruction for scale-choice — the right scale of a study is that whichwill fit on one map sheet (FAO, 2011). However, most practitionerscan only wish it was indeed as easy. The advance of GIS technologieshas enabled us to present different aspects of information, often byrepresenting the same data at different map scales, has made the selec-tion of scale more complex.
In science, scale is often described as one of the most overworkedand yet, continuingly ambiguous terms. It may be used to refer to theextent, or thedegree of detail of a study or ameans of comparing objectsin a meaningful way. It has been used in the context of space, time, in-dividuals, hierarchy, perceptions, turnover, levels of governance and
eu (S.S. Keshkamat).
rights reserved.
muchmore. Every discipline claims it as its own, as an intrinsic compo-nent of scientific inquiry in the discipline, with its own so-called ‘uni-versal definition’, thus making its use in an interdisciplinary contextdifficult. Indeed it is as difficult to identify a completely ‘scale-less’ dis-cipline, as it is to identify a common transdisciplinary1 definition ofthe term.
Scale definitions have typically been derived from landscape ecolo-gists and geographers. Many studies preferred to just define the scaleof the study and zoom in to it quickly. In recent years however, complexissues operating at multiple scales have forced researchers in many dif-ferent disciplines to explain scale choices, multiscalarity and eventrans-scalarity and to take an urgent relook into the understanding ofscale. João (2007) and Partidário (2007) called for a research agenda tobetter understand scale issues in assessment; the STS school at OxfordUniversity (2009) call for a school of ‘scalography’ thought “to turn the‘problem of scale’ into an object of productive inquiry”. The MillenniumEcosystemAssessment (Berkes et al., 2006) dedicated a separate volumeto the issue of scale to “illustrate the multiple dimensions of the chal-lenges inherent in bridging scales and knowledge systems”, whileGoodchild and Quattrochi (1997) even called for a “separate science of
plines, side by side, through division of labor between disciplines, or by an integratedcooperation of disciplines as interdisciplinarity, whereas transdisciplinarity is definedas going beyond science and disciplinary boundaries, to include aspects of practicalcontexts and values or normative judgments, as well as to apply results back into prac-tical actions.

16 S.S. Keshkamat et al. / Ecological Economics 76 (2012) 15–24
scale”. This article seeks to integrate contemporary scale-related re-search from several disciplines in order to:
• Identify commonalities across different schools of scale inquiry;• Use these commonalities to synergistically advance the under-standing of scale;
• Create a framework for the selection of scale that can be appliedacross the theoretical, applied and philosophical aspects of variousdisciplines, whether they are spatial, temporal or hierarchical; andthereby,
• Advance the credibility, salience and legitimacy of policy, researchand decision making.
Star and Griesemer (1989) define a boundary object as frameworkthat is plastic enough to act as a mediator between different disci-plines, facts, knowledge, interest groups and individuals, and yet isrobust enough to maintain a common identity across them. Harveyand Chrisman (1998) state that “Boundary objects moderate differ-ences and establish a shared understanding that not only enables(partial) agreement across ontological and epistemological bound-aries, but also leads to the creation of ‘things’ with increased validityto a much larger portion of society.” The boundary object which wepropose in this article is therefore a means to understand, communi-cate, negotiate and decide on suitable choice of scale in applied, the-oretical and philosophical spheres of science.
2. The Importance of the Issue of Scale
The more fundamental issue of scale requires ensuring that theboundaries (extent), resolution (detail) and methods (of comparing)are defined objectively and that conclusion of the analysis does notdepend on any arbitrary scale.
According to Goodchild and Quattrochi (1997), 5 types of scaleshave been identified: operational, temporal, cartographic, observation-al, andmeasurementwhich represent only the technical aspects of scalein spatial analysis. It is found that technical anomalies such as
Fig. 1. Stakeholder priorit(Source: Odoki et al., 2008
Modifiable Areal Unit Problem (MAUP), ecological fallacy (Openshaw,1977, 1983, 1984) or spatial aggregation (Clark and Avery, 1976), mayensue if scales have not been defined and used objectively in spatialanalysis. Wilbanks (2002) opines that although the scale in integratedassessment is a continuous function, there is a ‘lumpiness’ in humanprocesses and therefore scales become discrete functions stepped atnodes such as community, village, provincial, national and global levels.They also state that in most cases, smaller scale mosaics are nestedwithin larger-scale mosaics and that we can often think in terms of spa-tial hierarchies. However Gibson et al. (2000) compare definitions fromTurner et al. (1990), Allen and Hoekstra (1990), and Mayr (1982) toshow that processes, whether they are inclusive or constitutive nestedhierarchies, display different behavior at different scales.
The prominent social implications of scale are termed “politics ofscale” (Lebel, 2006; Paasi, 2004; Swyngedouw, 1997). In theMillenniumEcosystem Assessment, Lebel (2006) shows how through the strategicchoice of scale one group of actors can influence the decision makingprocess by shaping the scales and contexts in which knowledge is orga-nized and decisions are made. Cash et al. (2006b) and Lebel et al. (2005)state that “Scale represents a class of key choices, commitments and con-straints that actors contest or are forced to accept”. Karstens et al. (2007)show how problems can be magnified or shifted by political decisionstaken to solve small scale problems without a full analysis. StephenandDowning (2001) andDaly (1992) showhowpolicies, geographicallytargeted at groups socio-economically vulnerable to natural disasters,can complicate the situation further if appropriate scales of assessmentare not chosen.
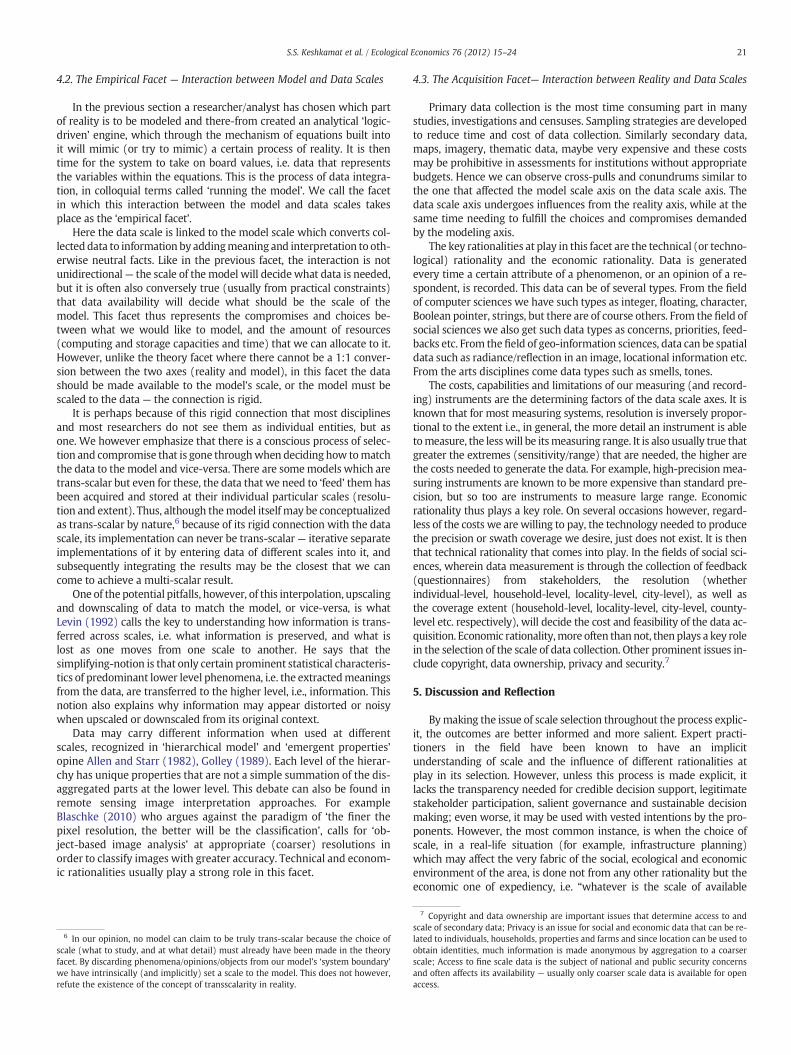
A study done by theWorld Bank showshow the stakeholder priorities(expressed byweights seen in Fig. 1) change at different scales and levelsin a participatory planning exercise (Odoki et al., 2008). When one con-siders this understanding with the observations of Brenner (2001),Cash et al. (2006a), Cox (1998a, b), Lebel (2006), Meadowcroft (2002)and Swyngedouw (2000), it is possible to see how spatial planningdone through participatory planning processes, will show major differ-ences and anomalies at different scales. It may also be seen that results
ies at different levels.).

Fig. 2. Stakeholder identification and categorization.(Source: Slootweg et al., 2009).
17S.S. Keshkamat et al. / Ecological Economics 76 (2012) 15–24
derived from these shifting priorities may not necessarily be nested, andthus solutions need to be tailored to specific audiences and scales to im-part the needed salience, legitimacy and credibility (Kooiman andKeshkamat, in press). These are the most necessary attributes for infor-mation to cross over from research to policy (Cash et al., 2003).
Scale also makes an enormous difference in the generation of alter-natives. For example, Keshkamat et al. (2009) demonstrated a newGIS-based participatory method for route planning of the Via Baltica ex-pressway, a major European highway. They have shown how differentroutes can be obtained for different visions — economic, social, ecolog-ical, and balanced; however, they do not take into account that the pro-posed route alignment would change if the spatial analyses were doneat different geographical or temporal scales. Perspectives, assumptions,constraints, stakeholders, aswell as stakeholder priorities and concerns,can be different at different levels. A spatial sensitivity analysis, such asthat illustrated by Berry (1996), shows that optimal route alignmentsmay change up to 97% of the total length if the weights are changedby as little as 12–15%. Hence, this brings to light an issue of serious con-sequence — the sustainability, salience and legitimacy of planning andassessment practice are scale dependent.
Although in recent years much work had gone into understandingthe concepts of scale (Atkinson and Foody, 2002; Atkinson and Tate,2000; Goodchild and Quattrochi, 1997; Rotmans and Rothman,2003), no profound pivotal theories were formulated as in manyother disciplines. In many studies some feature is used as a “definingcontext” — a limit at which the system boundary of the study will beset-up. For example, river hydrology based research often derives itsextent from the water divide, just as urban studies draw their bound-aries at municipality limits. However, the resolution of the studyshould still be given much consideration. From a stakeholder's per-spective the choice of extent and detail will decide who are likely tobe affected, and which issues will be considered. Therefore the choiceof scale should also be driven by a thorough stakeholder analysis.However, in actual practice scale selection is done at the Terms ofReference (ToR) stage of a project by the proponents. In aided devel-opment projects for example, scales are usually set by the donor. Innon-development aided projects usually by the appointed consul-tants (Cash et al., 2006b; Lebel, 2006; Wilbanks, 2007). Data con-straints are often the governing factor in this selection (Gontier,2007; João, 2000). In other cases the electoral interests of the rulingparty play a role (Romein et al., 2003). Scale-dependent interestsare likely to be articulated only if they are represented. Tightly-setboundaries can ensure that off-site, higher-level interests are onlyweakly represented, to the advantage of local interests, and viceversa.
Perhaps recognizing the need to transcend the politics of scale,many researchers have laid claim to themultiscalarity of their methods(for example Ewert et al. (2006), Janssen et al. (2009), Jolly et al. (2005),Parker et al. (2002)). But althoughmost of these can be used at differentscales, they can only be used at each scale — one at a time and not in atrans-scalar manner as defined by Whittaker (1999) or Banini et al.(2003). Thus, the need to identify and state the scale at which thestudy is conducted at the time still remains. The Millennium EcosystemAssessment defines multi-scale assessment as a process that incorpo-rates at least two complete nested and interacting assessments, eachwith a distinct user group, problem definition and expert group. How-ever, Romein et al. (2003) show the widening mismatch in multi-levelgovernance of the nation-state between the planning scales of a sover-eign state as a definite territorial unit, and the realities of global mar-kets. For a solution to be trans-scalar, the problem would be to find acommon ground in which all stakeholders feel a sense of belongingboth at the local and the global scale (Tomlinson and Fry, 2000) — avery complex problem if all stakeholders can be identified (Fig. 2).
This concept of the ‘glocal identity’ (Swyngedouw, 1992, 1997, 2004)has formed a foundation stone of the United Nations Rio Conference onEnvironment and Development (1992), and has been codified in many
official documents such as the Millennium Development Declaration,but has found resonance with researchers dealing with scale in planningand governance only recently (for example Governa and Salone (2004),Manson (2008), Mamadouh et al. (2004), van der Wusten andMamadouh (2008), Majoor and Salet (2008)). Although like Hay et al.(1997), Kent and Schneider (1994), and Allen and Hoekstra (1990), wefind that extent and resolution are the two key lenses in the “formula-tion” and inquiry of scale, we also find that the research on scale hasbeen steeped in the individuality of the discipline that the researcherhails from. Thus, although great depth has been achieved in individualdisciplines, a comprehensive understanding of the complex problem ofscale has eluded the scientific community in general.
2.1. Crossing Disciplinary Boundaries
Rotmans (2003) opines that there is a growing need for interdisci-plinary approaches to scaling issues by holistically combining insightsfrom both the natural and social sciences in order to pave a way for amore common understanding of the role of scale in many current soci-etal problems. There needs to be a greater crossing of boundaries be-tween disciplines; for this there is a need for a framework that canbring together the philosophical, theoretical and practical schools ofthought from various disciplines. Slootweg et al. (2009) state that, “insituations where interdisciplinarity or transdisciplinarity are requiredfor effective analysis and decision making, as is the case in most plan-ning and environmental assessment situations, the problem of bound-ary crossing presents itself. Boundaries have to be crossed betweenthree main domains: research (by credibility), policy (with salience)and society (through legitimacy)”.
In the following sections we will address the ‘problem of scale’ as aboundary concept and develop this concept into a vehicle for communi-cation between different disciplines by means of a framework whichcan act as a boundary object in a transdisciplinary context like that spec-ified by Star (2010). Boundary conditions for effective boundary cross-ing will be discussed in brief in the final section of this paper.
3. The Boundary Concept
The available literature on research into scale-issues falls into cor-responding 3 main streams, mirroring the three stages of science inwhich scale choices are made:
1. Sorting and understanding of scales and patterns in real-life. Forexample, habitat fragmentation studies in landscape ecology,

2 From Goodchild and Quattrochi (1997), we know that resolution and extent are in-versely proportional to each for managerial reasons — if not for economic reasons, thenat least purely for processing and storage capacities. However in recent years, cloud com-puting, distributed processing etc. have hurdled these technical limitations and challeng-ing studies using high resolution as well as large extent are being taken up more often(Goodchild, 2011).
Fig. 3. The proposed boundary object on scale-choice, and its various components.
18 S.S. Keshkamat et al. / Ecological Economics 76 (2012) 15–24
impact assessment of anthropogenic activities, land-use zonationin regional planning etc.
2. The simulating or modeling real-life issues (for example molecularmodeling, risk modeling, hydro-geological modeling, atmosphericaerosol transfer modeling etc.) in order to find solutions for real-life issues (that may be applied back to real-life), or the depictionof real-life through maps.
3. Collecting data to confirm, refute, extrapolate and extend themodels (for example, measurements of indications of temperature,length, luminosity, reflectance etc.).
These three stages which are the foundations of our boundary con-cept, are based upon the logic of science as described by various authorsin (western) philosophical tradition (For example, Goodstein (2000);Gordon (1991); Habermas (1988); Newton and French (1990);Shapere (1982)), i.e. inference to the best explanation. Accordingly,the three stages we distinguish reflect firstly, the process from observa-tions to theory development; secondly, the necessary data collection toset up an experiment, and, thirdly, from experimentation and calibra-tion of the model back to validation of the theory.
Accordingly, we propose a hypothetical 3-dimensional framework(Fig. 3), whose three axes are: “reality”, “model” and “data”. Theseaxes represent the corresponding streams in scientific literature onscale issues.
We then apply the two lenses (of extent and resolution) to theaxes-framework, defining each axis as having its own pair of resolu-tion and extent. As per standard definitions, the ‘resolution’ wouldbe the smallest detail that can be shown on the axis and the ‘extent’is the maximum range that can be shown on the axis. Similar to
Cartesian geometry, the choice of resolution and extent on eachscale axis can and may be independently different. The exact combi-nation of resolution and extent chosen for the axis depends on a vari-ety of rationalities at play in the process of scale choice, and may (asseen in Fig. 4) consist of large extent-low resolution (for exampleglobal climate change studies), high resolution-low extent (for exam-ple molecular material sciences), or low resolution-low extent (pro-ject feasibility or reconnaissance studies) and more rarely, highresolution-large extent.2
3.1. Axis of Reality
Reality consists of several different processes acting in a space–time continuum. The processes have different scales — differentstart points and/or different extents and/or different resolutions.There are therefore different perceptions of reality and different in-terpretations that can be drawn from even the same process by ob-servers, depending on their own location in the space–timecontinuum. The interactions between different processes furthercomplicate the interpretation. Systematic assessment and planningtherefore define the exact window of the study – the choice of pro-cesses to be studied, their start-point, their extent and the level of

Fig. 4. The relationship between resolution and extent.
19S.S. Keshkamat et al. / Ecological Economics 76 (2012) 15–24
detail – before modeling or analyzing them. We term this ‘window ofstudy’ or ‘focal zone’ as the scale of reality (i.e. perceived reality).
Sheppard and McMaster (2004), Sheppard and Leitner (1999),Marston (2000) Marston and Smith (2001), Turner et al. (1990),and Prakash and Gupta (1994) argue that space and scale, like terri-tories, are social constructs. Herb and Kaplan (1999) went a step fur-ther and combined theoretical insights on scale and political scienceswith 13 structured case study examples to remind us that the scalesand identities are inseparably connected to each other. The book ex-plicitly examined how human identity relates to territory and howit coexists and competes with other identities (global, national, re-gional, cultural, religious etc.) at different geographic scales. Thesescales are not only fluid, but also interconnected or nested and areimplicitly used by actors (both proponents and opponents) in the ne-gotiation of identity within the complex nexus of territory, power andscale.
Integrated Assessment studies such as global environmentalchange modeling (for example, Turner et al. (1990) and Wilbanks(2006)) must find the balance between modeling real-life at micro-scale (high resolution— less extent) which will provide opportunityfor holistic analysis that is not possible at larger scales; and modeling
Mod
AnalogicalConceptual
Virtual Physical
e.g. computer generated
object models
e.g. architectural building models, model airplanes
etc
m
e.g. boundary objects, epistemological
models, metaphysical models etc
Fig. 5. Main mo
macro-scale processes (coarse resolution— large extent) which illu-minate inter-dependence and interactions that would be completelymasked at smaller scales. However, managerial considerations atplay in any project dictate, from the needs of practicality, that it isnot possible to study the phenomena at high resolution and large ex-tent – there must always be a compromise; but the concept not onlyexists theoretically, but also it is the actuality – Real life processestake place at high resolution, as well as large extent. It is also herethat the uncertainty issue arises: in planning, policy and assessmentstudies we always face randomness in all kind of features and pro-cesses. It is this randomness which creates uncertainties in our anal-ysis and causes that it does not make sense in many cases tocombine a large extent in the temporal and/or spatial domain witha high resolution.
Wilbanks (2006) too argues that lessons from assessment indicatethat there is not one scale for every purpose and scale is related tofunction. Thus, since reality is about perception and perspective, thescale of reality can be defined as phenomena, processes and issuesas perceived by stakeholders, or framed by managers and decisionmakers. It thereby aims at the creation of knowledge and forms thecontext for it. At a practical level, the scale of reality defines the re-search and managerial problems and, the derivable objectives. Thisframes the requirements for the scale of data and models.
3.2. Axis of Model
A model, usually defined as a simplified representation of reality,is a human construct to help us better understand real world systems.There are four main types of models, which can, depending upontheir applicability, be divided and subdivided into several sub-types.Fig. 5 shows the main model types and examples.
Regardless of the type of model, scale plays a very important rolein its development— either explicitly, implicitly or both. The modelscale axis represents the scale with which reality is translated intocause-and-effect relationships of processes and decision making. Inscience its focus is on causal relationships. In management and inthe political world, the model scale relates to the instruments ofstakeholders and is therefore closely linked to the administrative orinstitutional scale. The models therefore also predicate what wouldbe the effect of decisions on issues under observation.
Apart from the extent and resolution of the reality sought to be stud-ied, framing of model scale manifests itself especially in the definition ofindicators. Models are important tools in assessment and frequently getrescaled based on the application. Likemaps (Monmonier, 1996),modelscan be used to hide or reveal scale-dependent relations (Lebel et al.(2005)). Framing model scale by using objective criteria for indicatorsand variables is therefore crucial in salient assessments and planning.
els
Symbolic Descriptive
Numeric Graphical
e.g. athematical or
statistical models
e.g. maps, electrical circuit
diagrams etc
e.g. company philosophy,
political manifestos, behavioral models etc.
del types.
4 We like to point out that we are not referring here to the heated debates withinecological economics on the rationality concept of economics (see the excellent chap-
20 S.S. Keshkamat et al. / Ecological Economics 76 (2012) 15–24
3.3. Axis of Data
The Oxford dictionary gives the meaning of data as “facts and statis-tics collected together for reference or analysis”. In computing sciences,data are numbers, words, images, etc., accepted as they stand. Beynon-Davies (2009a, b) and Case (2007) separated the concepts of data, infor-mation and knowledge based on the level of abstraction, and state thatthe hierarchical relationship of these three concepts is that data is thelowest level of abstraction, information (data+meaning) is the nextlevel, and finally, knowledge (information+inference) is the highestlevel among all three.
The most commonly used definition of data is “qualitative or quan-titative attributes of a variable or set of variables” (Wikipedia, 2010).It is the measured (observed or perceived) attribute of the manifesta-tion of reality. Scale of data thus connects the scale of reality to thescale of the model, for example — the x, y, z coordinates are the vectorattributes of a manifested process, whereas temperature, humidity,height, density, reflectance are their scalar attributes. This estimationis influenced by the extent (range) and detail (precision) needed i.e.the scale of data. For example land-use classification done at a countylevel will often be very different from one done at supra-nationallevel, in terms of not only spatial extent and resolution, but also impor-tantly in the class descriptions.
Depending on the attribute to be recorded, data scale can be categor-ical or magnitude.3 Categorical records are instances on a scale that canbe distinguished from each other absolutely (e.g. thematic or Booleandata). Magnitude refers to the property that one instance on a scalecan be judged greater than, less than, or equal to another instance onthe same scale (e.g. ratio, interval, ordinal or nominal data types).
4. The Boundary Object
It was seen in previous sections that research till date has been fo-cused on understanding each axis, and within the bounds of the re-spective disciplines the understanding of each axis, particularly thedata and model axis, has more or less reached a plateau. The attemptsat understanding relationships between any two scales (axes) toohave been made, but are much fewer. However, the framework thatwe present here incorporates all three axes and the facets which rep-resent the interactions between any two axes. There are three axesand three facets. Although we will describe the three axes briefly,they have in general been delved deep into by previous research.We believe that the interactions, i.e. the three facets, are of greaterimportance to this discussion than the axes themselves. Consequentlywe contribute to the discourse on scale choice by emphasizing the in-teractions rather than the individual scales. The facets are:
• The theory facet, representing the interaction between reality andmodel scale,
• The empirical facet, representing the interaction between modeland data scale,
• The acquisition facet, representing the interaction between realityand data scale.
The principles of human rationality, as defined by Diesing (1962),will be used to understand how a specific scale will be chosen/selectedwhen there is an interaction between any two axes. He specifies and ex-plains six basic types of rationalities: technical, economic, social, ecolog-ical, legal and political. These rationalities reflect six principal types ofgoal-based, reason-enabled effectiveness in society. They guide varioustrends of development, group gravitation (interest-group formation)
3 Meta-data, often called information on data (FGDC, 2003), forms a special class ofdata which we see more as a description of the data, and the data acquisition process,rather than a recordable attribute of a physical phenomenon. It helps give the rationaleto scale choice, but does not have/need a scale itself. Therefore we do not include it inthis boundary object we propose.
and decision-making. Depending on which rationalities are at play ineach interaction (facet) and which rationality is (pre)dominant, thechoice of scale in that facet occurs.4
4.1. The Theory Facet — Interaction between Reality and Model Scales
The theory facet brings out the compromise that must be made be-tween reality, as it truly exists, and what can be modeled by us (Ewertet al., 2006). Actors typically operating in and affected by this facet areresearch scientists, modelers, physical geographers, systems analystsetc. However it is typically within this facet that politics and power con-tend and play a major role, particularly in projects involving commongoods. Following the line of reasoning of Beynon-Davies (2009a, b)and Case (2007), in this facet inference is added to information so thatmeaningful knowledge is created and decision making is supported.
Levin (1992) opines that one of the principal techniques of scientificinquiry is to change the scale of description by filtering out individualcases that are unrepeatable or unpredictable phenomena. In doing so,we trade off heterogeneity and loss of detail within a group in orderto gain some degree of modeling predictability, thereby extractingprominent features of phenomena at finer scales as variables at otherscales. He emphasizes that the problem is “not to choose the correctscale of description but to recognize that change is taking place onmany scales at the same time, and that it is the interaction among phe-nomena on different scales that must occupy our attention”. Taking theexample of krill distribution in the southern oceans, he shows how it ispossible to model even a system operating at multiple and complexscales, by recognizing which variables produce the observed patterns.Through it he proves that the philosophy behind the applied models isnot that finer detail does not exist, but that often it is not relevant (orneeded) to show the observed patterns. This is the kind of simplificationwe need in order to identify the scale of operation of real phenomena, aswell as the different scales of interactions of inter-phenomenal process-es.5 After all, the goal of scientific research is to simplify complexity andrepresent the essence of reality and its processes, understandably.
We call this facet as the ‘theory facet’, as this iswhere the researcher/analyst chooses which/howmuch part of the system s/he would like tostudy and model and at what detail. It should however also be notedthat the interactions in this facet are not unidirectional but bidirection-al. The reverse of the process of modeling, i.e. validation, is the processflow in the opposite direction in this facet — confronting the modelwith reality, via the data axis.
Technical, political and social rationalities are usually the dominantrationalities in this facet. However, legal, economic and ecological ratio-nalities also play a role. Understandably, as complex is the reality understudy, so complex will be the interplay of rationalities in it. Inappropri-ate choice would affect the credibility and legitimacy of the research,planning or assessment. Examples of pitfalls of inappropriate scale se-lection in modeling of reality are: important hotspots overlooked inecology, vulnerable groups and situation overlooked in disaster riskmanagement, poverty alleviation efforts misdirected due to poverty as-sessment models or, infrastructure investment assessments that can beanalyzed to show wide-ranging benefits, while actually benefitting afew at large costs to many.
ter on the difference in values between economists and ecologists in Edwards-Jones etal. (2000)), but restrict ourselves to the rationalities described by Diesing (1962) in or-der to maintain focus on the issue of scale.
5 We prefer not to use the term ‘cross-scale phenomena’ in this facet, because the scaleof reality is a continuumnot at static levels, although of course the scale of themodeling ofit may be so due to the “lumpiness” that we visualize for our understanding.
21S.S. Keshkamat et al. / Ecological Economics 76 (2012) 15–24
4.2. The Empirical Facet — Interaction between Model and Data Scales
In the previous section a researcher/analyst has chosen which partof reality is to be modeled and there-from created an analytical ‘logic-driven’ engine, which through the mechanism of equations built intoit will mimic (or try to mimic) a certain process of reality. It is thentime for the system to take on board values, i.e. data that representsthe variables within the equations. This is the process of data integra-tion, in colloquial terms called ‘running the model’. We call the facetin which this interaction between the model and data scales takesplace as the ‘empirical facet’.
Here the data scale is linked to the model scale which converts col-lected data to information by addingmeaning and interpretation to oth-erwise neutral facts. Like in the previous facet, the interaction is notunidirectional— the scale of themodel will decidewhat data is needed,but it is often also conversely true (usually from practical constraints)that data availability will decide what should be the scale of themodel. This facet thus represents the compromises and choices be-tween what we would like to model, and the amount of resources(computing and storage capacities and time) that we can allocate to it.However, unlike the theory facet where there cannot be a 1:1 conver-sion between the two axes (reality and model), in this facet the datashould be made available to the model's scale, or the model must bescaled to the data — the connection is rigid.
It is perhaps because of this rigid connection that most disciplinesand most researchers do not see them as individual entities, but asone. We however emphasize that there is a conscious process of selec-tion and compromise that is gone throughwhen deciding how tomatchthe data to the model and vice-versa. There are somemodels which aretrans-scalar but even for these, the data that we need to ‘feed’ them hasbeen acquired and stored at their individual particular scales (resolu-tion and extent). Thus, although themodel itself may be conceptualizedas trans-scalar by nature,6 because of its rigid connection with the datascale, its implementation can never be trans-scalar— iterative separateimplementations of it by entering data of different scales into it, andsubsequently integrating the results may be the closest that we cancome to achieve a multi-scalar result.
One of the potential pitfalls, however, of this interpolation, upscalingand downscaling of data to match the model, or vice-versa, is whatLevin (1992) calls the key to understanding how information is trans-ferred across scales, i.e. what information is preserved, and what islost as one moves from one scale to another. He says that thesimplifying-notion is that only certain prominent statistical characteris-tics of predominant lower level phenomena, i.e. the extractedmeaningsfrom the data, are transferred to the higher level, i.e., information. Thisnotion also explains why information may appear distorted or noisywhen upscaled or downscaled from its original context.
Data may carry different information when used at differentscales, recognized in ‘hierarchical model’ and ‘emergent properties’opine Allen and Starr (1982), Golley (1989). Each level of the hierar-chy has unique properties that are not a simple summation of the dis-aggregated parts at the lower level. This debate can also be found inremote sensing image interpretation approaches. For exampleBlaschke (2010) who argues against the paradigm of ‘the finer thepixel resolution, the better will be the classification’, calls for ‘ob-ject-based image analysis’ at appropriate (coarser) resolutions inorder to classify images with greater accuracy. Technical and econom-ic rationalities usually play a strong role in this facet.
6 In our opinion, no model can claim to be truly trans-scalar because the choice ofscale (what to study, and at what detail) must already have been made in the theoryfacet. By discarding phenomena/opinions/objects from our model's ‘system boundary’we have intrinsically (and implicitly) set a scale to the model. This does not however,refute the existence of the concept of transscalarity in reality.
4.3. The Acquisition Facet— Interaction between Reality and Data Scales
Primary data collection is the most time consuming part in manystudies, investigations and censuses. Sampling strategies are developedto reduce time and cost of data collection. Similarly secondary data,maps, imagery, thematic data, maybe very expensive and these costsmay be prohibitive in assessments for institutions without appropriatebudgets. Hence we can observe cross-pulls and conundrums similar tothe one that affected the model scale axis on the data scale axis. Thedata scale axis undergoes influences from the reality axis, while at thesame time needing to fulfill the choices and compromises demandedby the modeling axis.
The key rationalities at play in this facet are the technical (or techno-logical) rationality and the economic rationality. Data is generatedevery time a certain attribute of a phenomenon, or an opinion of a re-spondent, is recorded. This data can be of several types. From the fieldof computer sciences we have such types as integer, floating, character,Boolean pointer, strings, but there are of course others. From the field ofsocial sciences we also get such data types as concerns, priorities, feed-backs etc. From the field of geo-information sciences, data can be spatialdata such as radiance/reflection in an image, locational information etc.From the arts disciplines come data types such as smells, tones.
The costs, capabilities and limitations of our measuring (and record-ing) instruments are the determining factors of the data scale axes. It isknown that for most measuring systems, resolution is inversely propor-tional to the extent i.e., in general, the more detail an instrument is abletomeasure, the lesswill be itsmeasuring range. It is also usually true thatgreater the extremes (sensitivity/range) that are needed, the higher arethe costs needed to generate the data. For example, high-precision mea-suring instruments are known to be more expensive than standard pre-cision, but so too are instruments to measure large range. Economicrationality thus plays a key role. On several occasions however, regard-less of the costs we are willing to pay, the technology needed to producethe precision or swath coverage we desire, just does not exist. It is thenthat technical rationality that comes into play. In the fields of social sci-ences, wherein data measurement is through the collection of feedback(questionnaires) from stakeholders, the resolution (whetherindividual-level, household-level, locality-level, city-level), as well asthe coverage extent (household-level, locality-level, city-level, county-level etc. respectively), will decide the cost and feasibility of the data ac-quisition. Economic rationality,more often thannot, thenplays a key rolein the selection of the scale of data collection. Other prominent issues in-clude copyright, data ownership, privacy and security.7
5. Discussion and Reflection
Bymaking the issue of scale selection throughout the process explic-it, the outcomes are better informed and more salient. Expert practi-tioners in the field have been known to have an implicitunderstanding of scale and the influence of different rationalities atplay in its selection. However, unless this process is made explicit, itlacks the transparency needed for credible decision support, legitimatestakeholder participation, salient governance and sustainable decisionmaking; even worse, it may be used with vested intentions by the pro-ponents. However, the most common instance, is when the choice ofscale, in a real-life situation (for example, infrastructure planning)which may affect the very fabric of the social, ecological and economicenvironment of the area, is done not from any other rationality but theeconomic one of expediency, i.e. “whatever is the scale of available
7 Copyright and data ownership are important issues that determine access to andscale of secondary data; Privacy is an issue for social and economic data that can be re-lated to individuals, households, properties and farms and since location can be used toobtain identities, much information is made anonymous by aggregation to a coarserscale; Access to fine scale data is the subject of national and public security concernsand often affects its availability — usually only coarser scale data is available for openaccess.

22 S.S. Keshkamat et al. / Ecological Economics 76 (2012) 15–24
data”. These are the most important reasons why a deeper conscious-ness of scale must be instilled in all fields of science, assessment andplanning, than there is at present. Goodchild and Quattrochi (1997)commented that the problem of scale has reached a plateau and that itis better understood nowwith the advent of GIS. Far from it, we believethere is clearly some way to go before scale effects can be fully under-stood and accommodated, but this article has aimed to be the nextstep in that vital process.
Referring back to Fig. 3, with the above descriptions, we can identifythe inter-axes processes and “flows of meaning”with more familiarity,as shown in Fig. 6. When we try to apply meanings from reality andidentify a model scale, the process is called modeling. Conversely,when we use our model to verify it against the reality, we usually callthis construct validation. In the empirical facet, we identify data of aparticular scale which we apply to the model to “run” it and explain it,thus the flow of meaning in this process is from the model axis to thedata axis. If howeverwe force ourmodel tofit the scale of the data avail-able, such a process would be called construct calibration (or data-fitting). In the acquisition facet, when the flow of meaning is from real-ity toward identification of the scale at which datawill be gathered, it ispart of the process ofmeasurement; andwhen it is the otherway round,it is the process of verification. At the same time, within each facet areseen the iterative processes of learning– doing-relearning-refining –
for example, the choice of a modeling scale is not an open-and-shut de-cision, but an iterative process between reality and model scales inwhich different rationalities play a role. Similarly the choice of the rep-resentation scale is also the result arrived at through intra-facet deliber-ation of the various rationalities (mainly technical and economic).
Using this boundary object, it also becomes possible to see why itwould be erroneous to plan the scale of a real-life intervention processbased purely on the scale of available data, as is often done with a view
Fig. 6. Processes and interactions with respect to t
to expediency. This framework helps to resolve the ‘problem of scale’into its component blocks. It can help make better sense of abstract con-cepts such as ‘transscalarity’ and ‘glocal identity’. It also can help to iden-tify whether, why and how the choice of scale is data-driven, issue-driven or model-driven, and if need be, necessary remedies or informednegotiations can be taken up. Thus it aids transparency and consensusbuilding, the core goals of multi-stakeholder participatory processes.
Typically discussions on scale have centered on the aspect of geogra-phy (i.e. space and spatial data) (Moore, 2008). However, in keepingwith the Gibson et al. (2000) meta-definition of scale, our discussionand framework also keeps inmind the temporal andhierarchical aspects,which although even more difficult to account for, can be simplified bytheir link to spatial scale. We believe, like Delcourt and Delcourt (1988)who argue that spatial and temporal scales usually co-vary in naturalsystems, and Jordan and Fortin (2002) who contend the same for eco-nomics, that infrastructure plans involving large spatial extents will gen-erally also be planned for larger time periods and vice-versa. Forexample, time scales in planning of large-investment transnational high-ways typically range in 20–30 year periods, provincial infrastructureplan periods may lie within a 10–15 year period, while county-levelplanning generally focuses on a sub-10 year period. Partidário (2007)also showed how the temporal scale is importantly connected to spatialinfrastructure assessment processes. Fig. 7 shows the relationship be-tween spatial and temporal scales in earth system processes.
6. Conclusions and Recommendations
Within the fields of assessment and planning, the question ofscales has been of ongoing interest since the 70s but discussions areas yet far from solution. From extensive analysis of literature onscale, we identified the need for a framework that redefines the
he proposed boundary object on scale-choice.

Fig. 7. The relationship between characteristic spatial and temporal scales in earth system processes.(Source: Johnston and Hudson (1989)).
23S.S. Keshkamat et al. / Ecological Economics 76 (2012) 15–24
understanding of the complex issues related to the selection of scalein scientific enquiry and assessment practice. Realizing that scalehas received much attention across a variety of scientific disciplineswe concluded that the framework needs to be presented as a bound-ary object that is independent from a particular discipline and thatcan be used across thematic boundaries.
This paper presented such a boundary object in the form of a 3 di-mensional framework for the selection of scale. The framework is de-fined by three interdependent axes: the axis of scale of reality andcontext, the scale of models and methods and the scale of data. Theinteractions between these axes are described as three facets. Weconclude that “appropriate scale” is a scale that is defined and bal-anced in each of the three axes, considering the demands, possibilitiesand limitations as defined in each of the three facets. By consideringthe framework in its entirety, the selection of scale can be argued inobjective terms, whereby salience, credibility and legitimacy of as-sessments and plans can be improved. The conscious use of thisboundary object to balance attention across reality, models and datacan help scientific inquiry in bridging the gap to practice. We expectit to be particularly useful when explaining scale selection in integrat-ed assessments that need to address issues that may be transscalarand multiscalar.
Acknowledgments
The authors acknowledge Roel Slootweg, Christine Richter and thetwo anonymous reviewers for their critical reviews and constructivefeedback which helped us to substantially improve the quality ofthis article.
References
Allen, T.F.H., Starr, T.B., 1982. Hierarchy: Perspectives for ecological complexity. Uni-versity of Chicago Press, Chicago.
Allen, T.F.H., Hoekstra, T.W., 1990. The confusion between scale-defined levels andconventional levels of organization in ecology. Journal of Vegetation Science 1,5–12.
Atkinson, P.M., Foody, G.M., 2002. Uncertainty in remote sensing and GIS: fundamentals.Uncertainty in Remote Sensing and GIS John Wiley & Sons, Ltd, Chichester, UK.
Atkinson, P.M., Tate, N.J., 2000. Spatial scale problems and geostatistical solutions: a re-view. The Professional Geographer 52, 607–623.
Banini, T., Claval, P., Pagnini, M.P., Scaini, M., 2003. Identity and surroundings: a criticalreading in a transcalar perspective, the cultural turn in geography, Gorizia Campus.
Baumgärtner, S., Becker, C., Frank, K., Müller, B., Quaas, M., 2008. Relating the philoso-phy and practice of ecological economics: the role of concepts, models, and casestudies in inter- and transdisciplinary sustainability research. Ecological Economics67, 384–393.
Berkes, F., Reid, W.V., Wilbanks, T.J., Capistrano, D., 2006. Bridging scales and knowledgesystems. Bridging Scales and Knowledge Systems: Concepts and Applicationsin Ecosystem Assessment, 315.
Berry, J.K., 1996. Spatial Reasoning for Effective GIS. Wiley.Beynon-Davies, P., 2009a. The ‘language’ of informatics: the nature of information sys-
tems. Int J Inform Manage 29, 92–103.Beynon-Davies, P., 2009b. Neolithic informatics: the nature of information. Int J Inform
Manage 29, 3–14.Blaschke, T., 2010. Object based image analysis for remote sensing. ISPRS Journal of
Photogrammetry and Remote Sensing 65, 2–16.Brenner, N., 2001. The limits to scale? Methodological reflections on scalar structuration.
Progress in Human Geography 25, 591–614.Case, D.O., 2007. Looking for Information: A Survey of Research on Information Seeking,
Needs and Behaviour, Second ed. Emerald Group Publishing.Cash, D.W., Clark, W.C., Alcock, F., Dickson, N.M., Eckley, N., Guston, D.H., Jäger, J.,
Mitchell, R.B., 2003. Knowledge systems for sustainable development. Proceedingsof the National Academy of Sciences of the United States of America 100, 8086.
Cash, D.W., Adger, W.N., Berkes, F., Garden, P., Lebel, L., Olsson, P., Pritchard, L., Young,O., 2006a. Scale and cross-scale dynamics: governance and information in a multi-level world. Ecology and Society 11 (2), 8.
Cash, D.W., Adger, W., Berkes, F., Garden, P., Lebel, L., Olsson, P., Pritchard, L., Young, O.,2006b. Scale and cross-scale dynamics: governance and information in a multilevelworld. Ecology and Society 11.
Clark, W.A.V., Avery, K.L., 1976. The effects of data aggregation in statistical analysis.Journal of Geographical Analysis 428–438.
Cox, K.R., 1998a. Representation and power in the politics of scale. Political Geography17, 41–44.
Cox, K.R., 1998b. Spaces of dependence, spaces of engagement and the politics of scale,or: looking for local politics. Political Geography 17, 1–23.
Daly, H.E., 1992. Allocation, distribution, and scale: towards an economics that is efficient,just, and sustainable. Ecological Economics 6, 185–193.
Delcourt, H.R., Delcourt, P.A., 1988. Quaternary landscape ecology: relevant scales inspace and time. Landscape Ecology 2, 23–44.
Diesing, P., 1962. Reason in Society; Five Types of Decisions and Their Social Conditions.University of Illinois Press, Urbana.
Edwards-Jones, G., Davies, B., Hussain, S., 2000. Ecological Economics: An Introduction.Wiley-Blackwell.
Ewert, F., Keulen, H.V., Ittersum, M.K.V., Giller, K.E., Ewert, F., Keulen, H.V., Ittersum,M.K.V., Giller, K.E., 2006. Multi-scale analysis and modelling of natural resourcemanagement. Proceedings of the iEMSs Third Biennial Meeting: “Summit on Envi-ronmental Modelling and Software” Burlington, USA.
FAO, 2011. Land resources: land-use planning at thenational level. In: F.A. (Ed.), Organisation.FAO.
FGDC, 2003. ISO Metadata Standard Harmonization. FGDC web page.Gibson, C.C., Ostrom, E., Ahn, T.K., 2000. The concept of scale and the human dimensions of
global change: a survey. Ecological Economics 32, 217–239.

24 S.S. Keshkamat et al. / Ecological Economics 76 (2012) 15–24
Golley, F.B., 1989. A proper scale (Editor's comment). Landscape Ecology 2, 71–72.Gontier, M., 2007. Scale issues in the assessment of ecological impacts using a GIS-
based habitat model — a case study for the Stockholm region. Environmental Im-pact Assessment Review 27 (5), 440–459.
Goodchild, M.F., 2011. Scale in GIS: an overview. Geomorphology 130, 5–9.Goodchild, M.F., Quattrochi, D.A., 1997. Scale, multiscaling, remote sensing and GIS. In:
Goodchild, M.F., Quattrochi, D.A. (Eds.), Scale in Remote Sensing and GIS. CRCLewis, Boca Raton, FL, pp. 1–11.
Goodstein, D., 2000. How science works. US Federal Judiciary Reference Manual on Ev-idence, pp. 66–72.
Gordon, S., 1991. The History and Philosophy of Social Science. Routledge London.Governa, F., Salone, C., 2004. Territories in action, territories for action: the territorial
dimension of Italian local development policies*. International Journal of Urbanand Regional Research 28.
Habermas, J., 1988. On the Logic of the Social Sciences.Harvey, F., Chrisman, N., 1998. Boundary objects and the social construction of GIS
technology. Environment and Planning A 30, 1683–1694.Hay, G., Niernann, K., Goodenough, D., 1997. Spatial thresholds, image-objects, and
upscaling: a multiscale evaluation. Remote Sensing of Environment 62, 1–19.Herb, G.H., Kaplan, D.H., 1999. Nested Identities: Nationalism, Territory, and Scale.
Rowman & Littlefield Pub Inc, Maryland.Janssen, S., Ewert, F., Li, H., Athanasiadis, I., Wien, J., Thérond, O., Knapen, M., Bezlepkina, I.,
Alkan-Olsson, J., Rizzoli, A., 2009. Defining assessment projects and scenarios for pol-icy support: use of ontology in integrated assessment and modelling. EnvironmentalModelling and Software 24, 1491–1500.
João, E., 2000. The Importance of Scale Issues in Environmental Impact Assessment andthe Need for Scale Guidelines. , p. 20.
João, E., 2007. A research agenda for data and scale issues in Strategic EnvironmentalAssessment (SEA). Environmental Impact Assessment Review 27, 479–491.
Johnston, G.I., Hudson, W.R., 1989. Technology for Monitoring Global Change (Paper No.AIAA 89-0254), AIAA 27th Aerospace Sciences Meeting. Jet Propulsion Laboratory,NASA.
Jolly,W.M., Graham, J.M., Michaelis, A., Nemani, R., Running, S.W., 2005. A flexible, integrat-ed system for generating meteorological surfaces derived from point sources acrossmultiple geographic scales. Environmental Modelling and Software 20, 873–882.
Jordan, G.J., Fortin, M.-J., 2002. Scale and topology in the ecological economics sustain-ability paradigm. Ecological Economics 41, 361–366.
Karstens, S.A.M., Bots, P.W.G., Slinger, J.H., 2007. Spatial boundary choice and the viewsof different actors. Environmental Impact Assessment Review 27, 386–407.
Kent, M., Schneider, D.C., 1994. Quantitative Ecology: Spatial and Temporal Scaling. Ac-ademic Press, San Diego.
Keshkamat, S.S., Looijen, J.M., Zuidgeest, M.H.P., 2009. The formulation and evaluationof transport route planning alternatives: a spatial decision support system for theVia Baltica project, Poland. Journal of Transport Geography 17, 54–64.
Kooiman, A., Keshkamat, S.S. in press. Scale in regional environmental assessment andplanning: the reconstruction of North-Brabant, Journal of Environmental Assess-ment Policy and Management.
Lebel, L., 2006. The politics of scale in environmental assessments. In: Reid,W.V., Berkes, F.,Wilbanks, T.J., DORIS, C. (Eds.), Bridging Scales andKnowledge Systems: Concepts andApplications in Ecosystem Assessment. Island Press, Washington, pp. 37–59.
Lebel, L., Garden, P., Imamura,M., 2005. The politics of scale, position, and place in the gov-ernance of water resources in the Mekong region. Ecology and Society 10 (2), 18.
Levin, S.A., 1992. The problem of pattern and scale in ecology: the Robert H. MacArthurAward Lecture. Ecology 73, 1943–1967.
Majoor, S., Salet, W., 2008. The enlargement of local power in trans-scalar strategies ofplanning: recent tendencies in two European cases. GeoJournal 72, 91–103.
Mamadouh, V., Kramsch, O., Van der Velde, M., 2004. Articulating local and globalscales. Tijdschr Econ Soc Ge 95, 455–466.
Manson, S.M., 2008. Does scale exist? An epistemological scale continuum for complexhuman–environment systems. Geoforum 39, 776–788.
Marston, S.A., 2000. The social construction of scale. Progress in Human Geography 24,219–242.
Marston, S.A., Smith, N., 2001. States, scales and households: limits to scale thinking? Aresponse to Brenner. Progress in Human Geography 25, 615–619.
Mayr, E., 1982. The Growth of Biological Thought: Diversity, Evolution, and Inheritance.Belknap Press, Cambridge, MA.
Meadowcroft, J., 2002. Politics and scale: some implications for environmental gover-nance. Landscape and Urban Planning 61, 169–179.
Monmonier, M., 1996. How to Lie with Maps. University of Chicago Press, Chicago andLondon.
Moore, A., 2008. Rethinking scale as a geographical category: from analysis to practice.Progress in Human Geography 32, 203.
Newton, C.A.D.C., French, S., 1990. The model-theoretic approach in the philosophy ofscience. Philosophy of Science 57, 248–265.
Odoki, J.B., Ahmed, F., Taylor, G., Okello, S.A., 2008. Towards the Mainstreaming of anApproach to Include Social Benefits within Road Appraisal: A Case Study fromUganda. Transport Papers. The World Bank Group, Washington DC, p. 81.
Openshaw, S., 1977. A geographical solution to scale and aggregation problems inregion-building, partitioning, and spatial modelling. Transactions of the Instituteof British Geographers 2, 459–472.
Openshaw, S., 1983. The modifiable areal unit problem. Concepts and Techniques inModern Geography, 38.
Openshaw, S., 1984. Ecological fallacies and the analysis of areal census data. Environ-ment Planning A 16, 17–31.
Paasi, A., 2004. Place and region: looking through the prism of scale. Progress in HumanGeography 28, 536–546.
Parker, P., Letcher, R., Jakeman, A., et al., 2002. Progress in integrated assessment andmodelling. Environmental Modelling and Software 17, 209–217.
Partidário, M.R., 2007. Scales and associated data — what is enough for SEA needs? En-vironmental Impact Assessment Review 27, 460–478.
Prakash, A., Gupta, A.K., 1994. Are efficiency, equity, and scale independent? EcologicalEconomics 10, 89–90.
Romein, A., Jacob Trip, J., de Vries, J., 2003. The multi-scalar complexity of infrastructureplanning: evidence from the Dutch–Flemish megacorridor. Journal of TransportGeography 11, 205–213.
Rotmans, J.A.N., 2003. Scaling in Integrated Assessment: Problem or Challenge? In:Rothman, D.S., Rotmans, J. (Eds.), Routledge, pp. 329–354.
Rotmans, J., Rothman, D.S., 2003. Scaling in Integrated Assessment. Taylor & Francis.Science and Technology Studies group, 2009. Scalography, in: Oxford University Insti-
tute for Science Innovation and Society (Ed.). Issues in Scale – STS seminar series.Saïd Business School, University of Oxford., Oxford, UK.
Shapere, D., 1982. The concept of observation in science and philosophy. Philosophy ofScience 49, 485–525.
Sheppard, E., Leitner, H., McMaster, R.B., Tian, H., 2009. GIS-based measures of environ-mental equity: exploring their sensitivity and significance. Journal of ExposureAnalysis and Environmental Epidemiology 9 (1), 18–28.
Sheppard, E., McMaster, R.B., 2004. Scale and Geographic Inquiry: Nature, Society, andMethod. Blackwell Publishing, Cornwall.
Slootweg, R., Rajvanshi, A., Mathur, V.B., Kolhoff, A., 2009. Biodiversity in Environmen-tal Assessment: Enhancing Ecosystem Services for Human Well-being. CambridgeUniversity Press.
Star, L., 2010. This is not a boundary object: reflections on the origin of a concept. Sci-ence, Technology & Human Values 35, 601.
Star, S.L., Griesemer, J.R., 1989. Institutional ecology, ‘translations’ and boundary ob-jects: amateurs and professionals in Berkeley's Museum of Vertebrate Zoology,1907–39. Social Studies of Science 19, 387–420.
Stephen, L., Downing, T.E., 2001. Getting the scale right: a comparison of analyticalmethods for vulnerability assessment and household-level targeting. Disasters25, 113–135.
Swyngedouw, E., 1992. The Mammon Quest. ‘Glocalisation’, interspatial competitionand the monetary order: the construction of new scales: Cities and Regions inthe New Europe, pp. 39–68.
Swyngedouw, E., 1997. Neither global nor local: ‘glocalization’ and the politics of scale.Spaces of Globalization: Reasserting the Power of the Local, pp. 137–166.
Swyngedouw, E., 2000. Authoritarian governance, power, and the politics of rescaling.Environment and Planning D 18, 63–76.
Swyngedouw, E., 2004. Globalisation or ‘glocalisation’? Networks, territories andrescaling. Cambridge Review of International Affairs 17, 25–48.
Tomlinson, P., Fry, C., 2000. SEA and its Relationship to Transportation Projects. In:Workshop, T.B. (Ed.), TRL Ltd.
Turner, B.L., Kasperson, R.E., Meyer, W.B., Dow, K.M., Golding, D., Kasperson, J.X., Mitchell,R.C., Ratick, S.J., 1990. Two types of global environmental change: definitional andspatial-scale issues in their human dimensions. Global Environmental Change 1,14–22.
van der Wusten, H., Mamadouh, V., 2008. Geographies of governance in the EuropeanUnion: an introduction. GeoJournal 72, 1–5.
Whittaker, R.J., 1999. Scaling, Energetics and Diversity. Nature 401 (6756), 865–866.Wikipedia, 2010. Data. Wikipedia.Wilbanks, T.J., 2002. Geographic scaling issues in integrated assessments of climate
change. Integrated Assessment 3, 100–114.Wilbanks, T.J., 2006. How scale matters: some concepts and findings. Bridging Scales
and Knowledge Systems. Millennium Ecosystem Assessment. Island Press, Wash-ington DC.
Wilbanks, T.J., 2007. Scale and sustainability. Climate Policy 7, 278–287.