understanding spatial and temporal … pattern of urban expansion has consumed a large amount of...
TRANSCRIPT

UNDERSTANDING SPATIAL AND TEMPORAL PATTERNS OF URBAN EXPANSION IN WESTERN CHINA DURING THE POST-REFORM ERA
by
Chaoyi Chang
A thesis submitted in partial fulfillment of
the requirements for the degree of
Master of Science
(Environment and Resources)
at the
University of Wisconsin-Madison
2013

i
Acknowledgements
In the long process of completing this thesis, I would like to express my sincere appreciation to
my adviser and committee chair, Professor Annemarie Schneider, who has the attitude and the
substance of a true geographer. Her devotion to research and attention to detail continuously
pushed me to produce better work. Without her guidance, this thesis would not have been made
possible.
I am also deeply indebted to my committee members, Professor Kurt Paulsen and Professor
Stephen Malpezzi. Their guidance and encouragement helped me to clear hurdles along the way.
Their ideas were inspiring and stimulating.
My special thanks go to Professor A-Xing Zhu, who encouraged and supported me. I am also
thankful to my friends and colleagues, including Zhiwei Ye, Huan Gu, Fei Du, Jing Liu, and Bo
Wang. My gratitude goes to them both for the help on my manuscripts and for the gentle
consideration and kindness. This William Wordsworth poem expresses my gratitude.
Small service is true service while it lasts:
Of humblest friends, bright creature! scorn not one:
The daisy, by the shadow that it casts,
Protects the lingering dew-drop from the Sun.
In the end, this thesis is devoted to Yi-Fu Tuan who is the reason I came to the University of
Wisconsin – Madison. Everything that I understand, I understand because of you.

ii
Abstract
Cities in China have exploded in size, population, and impact during the last three decades after
economic reforms in late 1970s. Several investigations have documented the impacts of ongoing
urban transition, but the majority has focused on rates and patterns of development in coastal
cities first targeted for reforms in the late 1970s and early 1980s rather than those in China’s
western region. This thesis investigates the ongoing urban transition in Western China over the
past two decades (1988-2009), focusing on four extended metropolitan regions: Chengdu, Xi’an,
Kunming, and Urumqi. The analysis relies on data from time series land cover change maps,
very high resolution satellite images, disaggregated socioeconomic data, and urban planning
maps for each city, and draws on measures from geography, urban planning, and land change
science to estimate urban patterns through space and time. The results show that average rates of
change are indeed high: all four cities grew at annual rates near 2 percent for the earliest period
(1988-2000), but climbed to 5-7 percent after 2006. The extent of urban expansion
corresponding to these changes is staggering: each city has more than doubled in size during the
study period. In addition, the location of new urban land is primarily outside the contiguous
urban core area, being located near small town seats and planned development zones. This
finding suggests the emergence of a multinucleated urban form consistent with trends reported
for coastal cities. Within each city, the land use pattern is differentiated by planned industrial,
high-tech, and residential zones, corresponding to the government master plans. Quantitative
analysis using landscape metrics and an urban-rural gradient approach in each zone suggests that
rates and amounts are highest in areas designated for tertiary activities and housing. Further
estimation on land use pattern over time identifies a monumental morphology in the newly

iii
developed area that may be a consequence of strong urban planning aimed at development.
Monumentality in urban expansion has led to more land consumption, and further more to an
urban form that is changeable in a short time period and results in a lower average population
density. An assessment of population growth relative to urban land expansion at the county-
level reveals that the increase in population has led to decreasing population density in counties
and districts surrounding preexisting core city area, at the same time population densities in the
core city districts tend to reach the same level. Overall, the results suggest that urban expansion
in Western China does not fit traditional models of urban growth and development based on U.S.
and European cities, but is similar to the typology of growth in China’s coastal cities. Given the
disadvantageous geographical location of these Western cities, this rapid urban expansion could
be tied to strong central planning and to the enormous and long suppressed demand for housing.
This pattern of urban expansion has consumed a large amount of arable land, which is
environmental hazardous, and leads to social inequalities, including but not limited to the
reallocated farmers, floating workers, educated youth, and homosexual group. These findings
need to be taken into account in the future planning and management of urban land, for such
efforts will impact social, economic, political and environmental systems.

iv
Table of Contents
Acknowledgements………………………………………………………………..……….............i
Abstract……………………………………………………………………………………............ii
Table of Contents…………………………………………………………………………………iv
List of Tables……………………………………………………………………………………..vi
List of Figures……………………………………………………………………………………vii
List of Appendices………………………………………………………………………………viii
Section 1: Introduction…………………………………………………………………………..1
Section 2: Background…………………………………………………………………………...7
2.1 Previous investigations of urban spatial form…………………………………………7
2.2 The role of landscape metrics for understanding urban form…………………………9
2.3 Past work to understand urban form in China……………………………………….13
Section 3: Study Areas………………………………………………………………………….17
Section 4: Definitions and Datasets……………………………………………………………25
4.1 Remote sensing of urban expansion in Chinese cities ………………………………25
4.2 Defining ‘urban land’ and ‘urban expansion’ ……………………………………….27
4.3 Defining the extent of each study area ………………………………………………29
4.4 Additional datasets…………………………………………………………………...34
Section 5: Methods and Results………………………………………………………………..36
5.1 Hypothesis 1: Rapid expansion of built-up land……………………………………..36
5.2 Hypothesis 2: Transition from monocentric to multi-nucleated urban form………...41
5.3 Hypothesis 3: Development of corridors with specific spatial patterns related to designated land use………………………………………………………………………50
5.4 Hypothesis 4: Trend toward monumentality in urban form………………………….54

v
5.5 Hypothesis 5: Expansion of urban land is greater than population growth………….59
Section 6: Discussion……………………………………………………………………………65
6.1 Trends in urban expansion of cities in Western China………………………………65
6.2 Possible explanations of urban expansion and limitation of quantitative urban methods……......................................................................................................................66
6.3 Implications: what I learned from urban expansion in Western China……………...68
6.4 Limitations and uncertainty in the various data sources……………………………..71
6.5 Future work…………………………………………………………………………..72
Section 7: Conclusions………………………………………………………………………………….......74
Section 8: Bibliography…………………………………………………………………………………….75

vi
LIST OF TABLES
Section 2: Background
Table 1 – table of metrics, definitions, equations, and frequency of use………………………...10
Section 3: Study Areas
Table 2 – table of population, GDP, etc. for each city…………………………………………...21
Section 5: Methods and Results
Table 3 – The average annual growth rate in two periods compared to other studies…………...40 Table 4 – road intersection density in all four cities at different period…………………………59

vii
LIST OF FIGURES
Section 3: Study Areas Figure 1 – The location of each metropolitan area within China………………………………..19 Section 4: Definitions and Datasets Figure 2 – Planning maps, corridors, nuclei cities, and urban growth for each city……………..32 Section 5: Methods and Results Figure 3 – Rates and amounts of new urban land, agricultural land , 1988 – 2009………….…..37 Figure 4 – Examples of the buffers used in the analysis of each city……………………………41 Figure 5 – Ratio of new urban land to the developable land in buffers………………………….44 Figure 6 – Rate and amount of urban land in core city, satellite cities, and villages…………….45 Figure 7 – Amount of new urban land near core city and satellite cities………………………...46 Figure 8 – Average size of urban patch in designated corridors across cities, displayed in log scale………….…………………………………………………………………………………...53 Figure 9 – Selected sample circles for estimating number of road intersection…………………57 Figure 10 – Example of digitized road intersections from Google Earth, compared to Landsat..58 Figure 11 – The growth of urban land versus the growth of population in all four cities……….62
Figure 12 – Chloropleth maps illustrating the population normalized by the area of urban settlement by county in three years………………………………………………………………63

viii
LIST OF APPENDICES
Appendix 1 – literatures in applying landscape metrics in urban studies….…………………….81
Appendix 2 – Literatures in using remote sensing on monitoring urban expansion in China…...86
Appendix 3 – Literatures in spatial differentiation and polycentricity……………...…………...91

1
1. Introduction
Cities in China have exploded in size, population, and impact during the last three
decades. Since the economic reform in 1978, China’s urban population has grown from
172 million to 691 million in 2012, boosting the urbanization rate from 16 to over 50
percent (Chinese Statistical Bureau, 2012). During the same period, annual GDP growth
has averaged 10 percent (Chinese Statistical Bureau, 2011), with the majority of
economic activity focused in densely populated coastal areas and special economic zones
targeted for development by the Chinese government (Lin, 1999). Several investigations
have documented China’s rapid urban transformation following reforms in the 1970s and
1980s, which has led to unprecedented rates of land development in coastal provinces
(Wu and Yeh, 1997; Seto and Fragkias, 2005; Yu and Ng, 2007; Han et al, 2009). In the
early 1990s, China’s leaders began to coordinate economic development in western
regions as a means to reduce inequality in development and living standards between
coastal and inland areas (Lin, 1999). While a handful of studies have assessed the impact
of these policies (e.g. Rural-Urban Integration, Chinese Western Development Program)
on industrialization and urbanization in Western China (Vermeer, 2004; Liu et al., 2005;
Schneider et al., 2005), urban expansion, which is the land conversion to the urban land
led by this urbanization process, in the western region (Figure 1) has not been widely
studied or well-understood.

2
With its large area, rapid development and burgeoning population, urban expansion in
China will have a significant regional and potentially global impact on land use and the
environment (Grimm et al., 2000; Grimm et al., 2008). Urban expansion has profound
environmental impacts that extend beyond the city core, including changes to
microclimate, conversion of natural ecosystems, loss of agricultural land, fragmentation
of natural habitats, contamination of air, soil and water, increased water use and runoff,
reduced biodiversity, and introduction of non-native species (Pickett et al., 1997; El
Araby, 2002; Shepherd, 2005). In China, recent investigations in coastal cities have
revealed that urbanization has a significant and lasting impact on local precipitation and
temperature (Weng, 2001; Kaufmann et al., 2007), expansion of the urban heat island
effect (Zhou et al., 2004), reduced water quality (Shao et al, 2006), and air pollution
(Shao et al, 2006). Moreover, many environmental impacts are exacerbated when new
growth is expansive and fragmented in form (Alberti, 2005), such as the low density,
dispersed or even decentralized forms of urban expansion now common in the U.S. and
other developed countries (Ewing, 2003). The western region of China is
environmentally fragile, yet the information about urban expansion remains unclear for
years. Accurate, up-to-date information on the rate, form, and pattern of China’s urban
expansion is therefore crucial to answering a wide range of research questions related to
the influence of urbanization on climate, ecology and environmental processes.
Urban expansion takes place in different forms, and in each form it would have different
environmental impact with regard to compactness or dispersions (Grossman and Krueger,

3
1995; Alberti, 2005). Previous studies show that as a city spread out, the new expansion
is likely to result in a handful of typical geometric forms, or a mixed form of some of
them (Ewing, 1997; Angel et al., 2005). Three geometric forms are typical and
fundamental: leapfrog or scattered development, strip development, the expanses of low-
density and single family houses (Ewing, 1997; Antrop, 2004). And discontinuous
development, multi-centered development, and corridor development are mixed forms of
them (Ewing, 1997).
Work to understand changing urban form in China has taken one of two perspectives –
epistemological/qualitative and positivist/quantitative – in terms of research method.
First, a large number of studies have focused on spatial restructuring of Chinese cities in
the context of urban economics, urban planning, and urban sociology (Yeh and Xu, 1996;
Gaubatz, 1999; Zhang, 2000; Lin, 2001; Wu, 2002; Ma, 2004; Vermeer, 2004; Ding,
2007; Wei and Zhao, 2009). These researches provides a mostly theoretical and
qualitative understanding of urban dynamics that is crucial for understanding rural-urban
demographic shift, social progress in rapid urbanization era, and spatial restructuring with
respect to marketization and major institutional changes. However, they are not well
documented with sufficient data, especially with regard to the changing spatial patterns.
Second, a growing body of work has centered on use of empirical data to measure urban
land use trends (Weng, 2001; Seto and Fragkias, 2005; Xie et al., 2007; Xu et al., 2007;
Yu and Ng, 2007; Deng et al, 2009; Feng and Chen, 2010; Yue et al., 2010; Pham et al.,
2011). These studies rely on geospatial analysis of urban land, often using satellite

4
observations to measure rates and amounts of urban growth. To quantify patterns of
urban expansion, empirical studies have relied exclusively on spatial analyses, especially
the spatial metrics originally developed in the landscape ecology arena (O’Neill et al.,
1988; McGarigal and Marks, 1995). Current studies in coastal cities show that: first,
urban expansion in coastal cities had been rapid (Wu and Yeh, 1995; Liu et al., 2005;
Seto et al., 2011), and the urban form can change in a short period (Seto and Fragkias,
2005); second, as the cities grew larger, a multinucleated form and corridor expansion
emerged (Wu, 1998; Yue et al., 2010). Nonetheless, a monumental form was observed in
the new developments in Chinese coastal cities (Ford, 2008), as well as expansive
development with declining population density (Deng et al., 2009). These findings have
extended the scope of diverse urban expansion patterns by complicating the three typical
geometric forms.
With these issues in mind, the primary goal of this work is to understand the spatial and
temporal pattern of cities in Western China, with a specific focus on empirically
validating whether these urban forms observed in the coastal cities occurred in cities in
Western China. I selected four extended metropolitan regions – Chengdu, Xi’an,
Kunming, and Urumqi (Figure 1) as the study areas to measure the patterns quantitatively.
And to better understand this overarching research question, five hypotheses are tested in
this research. I will state them more fully in section 5, with detailed evaluation, but here
is a preliminary statement.

5
(1) Following implementation of reforms in the western region, rates and amounts of
urban growth have increased.
(2) All study areas have experienced expansion of built-up lands outside the city core.
Each city has transitioned from a monocentric to a multi-nucleated urban form, with new
development has occurred discontiguous from the edge of the urban core, in the outlier
independent zones.
(3)Maps and documents published by urban planners in western municipalities (Figure 2)
have included development of corridors extending outward from each city core. These
plans designate specific areas for industrial, commercial, high-tech and residential
development, which in turn has resulted in distinct spatial patterns within each corridor.
Specifically, there is a convergence of spatial patterns across residential corridors from
different cities, and across high-tech corridors from different cities.
(4) Urban expansion since the late 1990s has been monumental (Schneider et al., 2005,
Seto and Fragkias, 2005; Ding 2007), resulting in new urban development taking the
form of large block structures, and road networks laid out on increasingly large road grid
patterns.

6
(5) Expansion of built-up lands has been faster than population growth in each study area.
The new expansion exhibits a more expansive and fragmented form than that in the city
core before the reforms.
To test these questions, this study relies on unique datasets of land cover change derived
from remotely sensed data (Schneider, 2012) for five key time periods: the period
immediately after the land reform, 1988-1995, two periods following the wave of
development zones, 1996-2000 and 2001-2003; and two periods after the China Western
Development programs have been in place, 2004-2006, and 2007-2009. Drawing on
measures used in the urban planning, geography, and transportation studies literature, this
work exploits simple, straightforward measures from a variety of spatial analyses,
landscape metrics and urban study indicators to estimate urban patterns through space
and time.
In the following sections, I review past research on urban form in China (including a
synthesis of how landscape metrics have been used), describe the study regions, introduce
the datasets and methodology, and present my findings. The paper concludes with a
discussion of the trend of urban expansion in Chinese cities, its implications, and
limitations of applying theoretical models into this study area, as well as the importance
of possibilities by modeling land cover and land use changes.

7
2. Background
2.1 Previous investigations of urban spatial form
The spatial form of cities and patterns of urbanization have been investigated across
multiple disciplines for nearly a century, especially by urban economists (Burgess, 1927;
Hoyt, 1939; Blumenfeld, 1954; Muth, 1961; Batty, 1991). Early theories include the
concentric zone (Burgess, 1927), the sector (Hoyt, 1939) and the multiple nuclei (Harris
and Ullman, 1945) models, which show sectoral specialization and rent-seeking
competitions could shape urban spaces in different forms. Ideas of primary (or basic)
industry and the division of labors continued to dominate in economic base theories
(Haig, 1928; North, 1955; Thompson, 1965), growth pole theories (Perroux, 1950;
Hirschman, 1958) and ideas of cumulative causation (Myrdal, 1957; Kaldor, 1957)
contributed to the understanding of changing urban forms driven by pursuit of
development. As long as the city still takes advantage in gaining economic efficiency by
scale and agglomeration effects, it would continue to grow economically usually along
with land conversions to built-up areas.
Many studies have investigated urban spatial structure using population density or
housing prices. These studies model urban growth in two-dimensional space by using a
gradient outward from city center. Von Thünen (1875), Park et al. (1925), Alonso (1964),
Mills (1967), and Muth (1969) developed spatially-explicit land-use models to analyze

8
the spatial organization of cities (Bertaud, 2004), as known as monocentric model. These
theories simplify the city to a central business district (CBD) that acts as a job center,
decentralized by trip distance to it along with decay of land price and population density.
The spatial form of the city was driven by sectoral rent-bid in the land market. The city
expands when high land value at the perimeter put simultaneous pressure on all land
owners in the fringe to convert to urban use (Gaffney, 1969). In reality, several
socioeconomic and physical factors were considered to be potential drivers affecting
urban form, such as topography, urban planning, infrastructure construction and so forth.
The revised polycentric model includes labor market at multiple locations in the city, but
still relies on the same theory that the demand for housing decreases as distance to the
labor market increases. Because the existing urban form resilient to be changed, the new
demand could only be met by a large amount of land conversions on urban fringe. A
decay of transmission to built-up areas was hypothesized to appear extended from
preexisting labor market in urban space, the old core city and nucleus in this case.
Although many of these theories have not been tested using empirical data, they do
provide a foundation for understanding the spatial expansion of urban and built-up land.
In this study, because the population density and house price at very fine spatial scale at
multiple time points are not available, the changing form of urban land is analyzed as an
indicator and spatial existential form linking to these urban economic theories.

9
2.2 The role of landscape metrics for understanding urban form
A large number of studies within geography and urban planning are now dedicated to the
use of landscape metrics to understand changes in urban form and morphology.
Originally developed for use in landscape ecology (O’Neill et al., 1988; McGarigal and
Marks, 1995), landscape metrics or spatial pattern metrics were designed to quantify and
categorize landscape patterns (McGarigal et al., 2002). The metrics first appeared in
urban studies in late 1990s to understand residential housing prices in the Washington
DC region (Geoghegan et al., 1997) and early 2000s to understand changes in urban
structure in California (Herold et al., 2002). Following these initial applications,
researchers and practitioners across a range of disciplines have adopted spatial metrics for
use (Bockstael, 1996; Hargis et al., 1998; Luck and Wu, 2002; Leitão and Ahern, 2002).
A survey of peer-reviewed literature from the last decade reveals nearly 90 articles that
have used landscape metrics to quantify urban structure. These studies have all relied on
maps derived from satellite data, often at medium spatial resolution (e.g. 30-m Landsat
data). The contiguous impervious pavements that is delineated as urban land on these
land cover land use maps is defined as urban patches. A suite of metrics are typically
estimated to show increasing fragmentation, changing composition, or varying
spatiotemporal patterns in various urban landscape dominated by these urban patches
(Herold et al., 2005; Seto and Fragkias, 2005; Lewis and Plantinga, 2007).

10
Table 1. Most frequently used landscape metrics in peer‐reviewed literature pertaining to urbanization.
Abbreviation Landscape metric
Frequency of use
(total: 87) Equation Relevance and meaning within urban studies Spatial
consistency
PD Patch density
37 A
n
Density of continuous settlements. Could be meaningful as an indicator of patchness. May not be meaningful in urban studies due to its inconsistency with new settlement and infilling process.
Consistent with extent and grain size
NP Number of patches
36 n
Number of continuous settlements in the study area. May not be meaningful in urban studies due to its not normalized by area and inconsistency with new settlement and infilling process.
Varies with extent
MPS Mean patch size
31
n
an
1ii
Mean size of continuous settlements. It stands for average size of urban settlement in the extent. Can be meaningful because its direct correlation to settlement size and patchness. High value means continuous, large settlement, while low means possible small patches or more patchy landscape.
Consistent with extent and grain size
CONTAG Contagion 31
mln2
g
g)pln()
g
gp(
1
m
1i
m
1jm
1jij
ijim
1jij
iji
Relative clumpiness of continuous settlements. May not be meaningful in urban studies because it is hard to understand how it is calculated with specific meaning in urban studies and different software packages use different formula.
Consistent with extent and grain size
ED Edge density
31
A
en
1ii
Density of settlement edges. Can be meaningful in urban studies because it is simply another measure of patchness. May not be straightforward as MPS.
Varies with extent and grain size
LPI Largest patch index
31 A
)amax( i
Percentage of the largest settlement to the extent. It means how dominate the largest urban settlement exist in the extent. May not be meaningful because it not necessarily mean for continuous development.
Varies with extent
LSI Landscape shape index
26
A
e25.n
1ii
Total settlement edges divided by edge of the minimum settlement. May not be meaningful in urban studies due to its unclear meaning to urban morphology.
Varies with extent and grain size
SHDI Shannon’s diversity index
24
n
1jjj )pln(p
Abstract index to measure the diversity of land types. It provides a reference to measure the abundance of land use types. Could be meaningful if detailed land use information is available. May not be meaningful in some urban studies due to remote sensing images cannot provide enough detail on land use types.
Consistent with extent and grain size
Letters in equation
n: number of patches in the extent m: number of patch types in the extentA: total area of the extent ei: length of all edge segments of patch iai: area of patch i gik: number of adjacencies (joins) between pixels of patch types i and j based on the double count methodpi: proportion of the extent occupied by patch type i eij: tot al length of edge of patch type i in the extent

11
To better understand which metrics may be useful and/or meaningful for this work, I tallied
the frequency with which metrics were used across literature in the arena of urban studies,
ranging from urban geography, transportation studies, landscape architecture, and urban
planning disciplines until 2010 (Table 1, Appendix 1). The results show that patch density
(PD) is the most widely used landscape metrics, followed by the number of patches (NP) and
the mean patch size (MPS). The consistencies of those metrics, as well as their meaning in
urban studies, are also investigated here, in order to find a parsimonious set of landscape
metrics that are meaningful in urban studies and consistent with scale and extent.
Only 35 percent of these studies provided a justification of why the metrics were useful in an
urban setting. The majority of landscape metrics are meaningful for ecological studies (e.g.
measurement of forest patch perimeter to determine its impact on edge-sensitive species)
(McGarigal et al., 2009), but less so for studies that attempt to measure fragmentation of the
city (Schneider et al., 2005). For instance, edge density is crucial to edge-sensitive species in
ecology, but it is unclear how this is meaningful for urban land. Another example is that
patch density can indicate the fragmentation of urban patches but not the size of each patch.
There are several characteristics of urban areas that are often useful in planning and policy-
making, including accessibility of neighborhood to the roads, distance of new settlement to
existing urban areas, commuting distance to workplace and connectivity of sidewalks. These
features are difficult to characterize with landscape metrics, however. Other characteristics
are of importance to contrast over time could be documented, such as the average size of

12
urban blocks, the configuration of land cover at urban fringe, and the degree of fragmentation
in urban land.
The consistencies of metrics across scale and extent are also essential to be comparable
across the studies using various spatial resolution of satellite imagery, and the studies
covering different spatial extent (Gustafson, 1998; Remmel and Csillag, 2003; Li and Wu,
2004; Cushman et al, 2008). Common metrics such as the number of patches (NP) and total
class area (TA) are sensitive to changing scale (grain size and extent size) (Cain et al, 1997;
Wu, 2004). Furthermore, many of the metrics provide redundant information. For example,
patch density (PD) is equivalent to the number of patches (NP) divided by areal extent, and is
numerically correlated to mean patch size (MPS).
Given the insufficient and inconsistent studies, simple, parsimonious and straightforward sets
of measure are needed to estimate urban patterns through space and time. Among available
metrics, a few metrics, such as TA and MPS, have been shown to be suitable for use in urban
studies (Luck and Wu, 2002; Carrion-Flores and Irwin, 2004; Seto and Fragkias, 2005;
Schneider et al., 2005; Yu and Ng, 2007; Wu et al, 2011). TA provides an intuitive means to
investigate the amount of urban land, yet it is not robust across extent. As long as the extent
of landscape has been accurately defined, TA could provide comparable estimation but also
the differences of it between consecutive time points could also yield the growth rate. MPS
captures the average size of continuous urban settlement in a given landscape mathematically,
as well as consistent with variations of spatial scale and extent. Since urban expansion is

13
unidirectional, the growth of an urban patch exhibits three spatial patterns: edge expansion,
infilling, and leapfrog development (Forman, 1995; Ellman, 1997; Hoffhine Wilson et al,
2003; Xu et al., 2007; Sun et al, 2013). The first two patterns of growth lead to area increase
of an urban patch, which further result in an increase of the metric in the landscape. The
leapfrog development of small isolated settlements leads to a decrease of MPS in the
landscape. Therefore, once the city started expanding as observed in the satellite image,
increasing of MPS indicates the patterns infilling and edge expansion in the landscape, while
being constant or decreasing stands for a more fragmented development.
2.3 Past work to understand urban form in China
A growing body of evidence shows that the rates and patterns of urban expansion in China
differ from those in more developed countries like the U.S. and E.U. countries where the
majority of work has been conducted and most theories established (McGee, 1989; Ginsburg,
1990; Lin, 2001; Ma, 2004; Schneider and Woodcock, 2008; Deng et al, 2009). Previous
studies have shown that medium to large-sized cities (those over 1 million in population) in
China have experienced core expansion and the rapid growth of satellite cities outside the
core, as well as the development of transportation corridors extending outward from the city
that have led to peri-urban expansion (Schneider et al., 2005; Seto and Fragkias, 2005).
Massive urban expansion was first observed in coastal regions, mostly documented in the
Pearl River Delta and Yangtze River Delta, Beijing and the Bohai Rim area. Previous

14
studies have suggested that metropolitan areas in China’s coastal area now exhibit these
trends as a result of rapidly increasing international trade, the influx of floating workers
following hukou reforms, tremendous infrastructure construction, reform to a market-
oriented economy, increasing foreign direct investment and newly established development
parks (Wu and Yeh, 1997; Wu, 1998; Wang, 2002; Ma, 2004; Yue et al., 2010).
A number of studies have suggested that the reforms first witnessed on the coast may lead to
a spatial restructuring of cities (Wu and Yeh, 1997; Ma, 2004), and several empirical studies
have shown that Beijing, Shanghai, Guangzhou, and Hangzhou experienced rapid polycentric
urban development including the core city and nearby nucleus (Yeh and Li, 2001; Ma, 2002;
Xu et al. 2007; Yue et al., 2010). Similar reform policies were adopted in Western China in
the late 1990s and early 2000s. With gradual transition to market oriented economy, vast
infrastructure construction and newly built industrial parks may generate similar spatial
restructuring in the region. However, China’s Western provinces have lagged behind the
coastal regions in resource allocation from the central government and sectoral
transformation (Lai, 2002). In addition, the lack of proximity to ports has likely contributed
to the lack of foreign direct investment (Chadee et al., 2003). In sum, these differences in
socioeconomic conditions, investment, and historical context may significantly impact the
spatial evolution of cities in Western China.
The state and municipal government played an important and active role in shaping urban
landscapes. Reforms (the Land Administrative Law in 1986 and 1998, the Constitutional

15
Amendment for land reform in 1988, the tax reform in 1993 that led municipal government
to leverage the land market to offset government spending) toward a market-oriented
economy have not only established the land (i.e. land use right) and real estate market, but
the government has also been leading land acquisitions for the past years to meet the
increasing land demand in those markets (Ding, 2007). The acquired land was designated to
a variety of development zones (e.g. industrial, high-tech, commercial, logistics, university,
even government), state, regional, or urban public projects, as well as real estate projects.
The planned development zones, large scale infrastructure construction, and preferable
policies spurred urban growth, as well as stimulated specialization in manufacturing,
commercial districts and large scale housing developments (Gaubatz, 1999; Ma, 2004;
Vermeer, 2004).
Empirical analysis of the urban transformation in China has been increasing since remotely
sensed imagery began to be widely used (Li and Yeh, 1998) to quantify the extent of urban
land as well as the rates of change. With the increasing availability of satellite data sources
and semi-automated processing streams, there has been an explosion of work (>140
publications, Appendix 2) during the last decade dedicated to mapping change in China’s
cities and settlements. The bulk of work has been dedicated to mapping three regions in
particular: (a) Beijing and the Bohai Rim (Zhang et al., 2002; Liu et al., 2004; Tan et al.,
2005; Wu et al., 2006; An et al., 2007; Dong et al., 2008), (b) Shanghai and the Yangtze
River Delta (Zhang, 2001; Zha et al., 2003; Liao et al., 2008; Yue et al., 2010), and (c)
Guangzhou and the Pearl River Delta region (Weng, 2001; Seto et al., 2002; Fan et al., 2007).

16
Despite the differences of the time horizon and spatial extent of city’s limit (some studies
only mapped the change to the urban core, or part of the city), these studies reveal that
changes in urban extent vary by region: the annual growth rate of urban land in extended
Beijing, Shanghai, and Guangzhou metropolitan area peaked over 10% in the period of 1980
to 1990, followed by the rate of 5% to 10% in the period of 1990 to 2010. In addition to case
study analysis, work to map urban expansion across all of China has shown that other cities
in coastal areas and some cities in central and western China have also experienced fast
urban growth since 1990s, with an accelerating growth rate in the late decade (Wang, 2010).
Their findings suggested that urban expansion in all Chinese cities might have occurred at
different waves when Beijing, Shanghai, and Guangzhou were observed having rapid
expansion in 1980s. However, due to less developed economic and social conditions, most
qualitative and quantitative studies have overlooked urban expansion in Western China,
leading to a lack of understanding the urban form of cities there.

17
3. Study areas
This study focuses on four urbanizing regions in Western China: Chengdu, Sichuan Province,
Xi’an, Shaanxi Province, Kunming, Yunnan Province, and Urumqi, Xinjiang Province
(Figure 1). While clear commonalities exist across the four metropolitan regions, these areas
have been selected for study because of their differences in development trajectories, history,
physical geography, and land cover types.
Each of the four cities is long lasting in history and has been a center of the region’s
economic, cultural, and political life. Chengdu and Xi’an are located in a fertile flood plain
and a densely populated region. After a massive irrigation project - Dujiangyan system –
was built in 256BC and sent water to the broad fertile plain, Chengdu has been the most
populous city of Sichuan due to its agricultural wealth. Xi’an is known for its culturally rich
history, as it had been agglomerated as an important city for over three thousand years, and
symbolized as Chinese capital for 13 dynasties, approximate a thousand years. Farms
gradually replaced forest to dominate in this plain region. Rich natural resources such as coal
and natural gas reserves are generously warranted as well. In contrast, Kunming and Urumqi
are settled at a strategic location in an ethnic region. Kunming is seated at a mountainous
plateau in southwestern China, and has been a significant military base and trade center for a
thousand years. It links international trades between Han dominated central China and
southeastern Asia. Urumqi was home to native Uygur population in history but outnumbered
by Hans today. The oasis city in a desert region has been a port on the route of the Silk Road,

18
connecting China to Europe in history and known rich for petroleum, natural gas, and other
energy resources today.
Physical geographies determine strong possibilities for a large population in each city.
Chengdu sits in a broad plain in the Red Basin, with small mountains in its east boundary and
great mountains of foothills of Tibetan Plateau lie in the west. Xi’an is also located in vast
Guanzhong Plain, bounding the mighty Qingling Mountains on the north. Thanks to the
fertile soil of flood plain and periodic precipitation brought by monsoon climate, the
agricultural production has long been well developed in both Chengdu and Xi’an. The triple
cropping with rotation of rice, wheat, and vegetables predominates in Chengdu, and textile
industry has been prosperous given to its sizable number of labors and sufficient resources.
With a drier and colder weather, a rotation of maize and wheat is typical in Xi’an.
Manufacturing and heavy chemical industries were the pillar industries before the reform.
Kunming, in contrast, has been resource-poor, partly due to its location in the rugged
landscape of the Yungui Plateau. Thus, Kunming has a small amount of agriculture near the
core city on the edge of Dianchi Lake, but is surrounded primarily by forest. The transport of
people and goods was difficult but also embarked Kunming to be an important trade port on
Ancient Tea Route. Urumqi is seated in a narrow valley with alluvial plain, bisecting
Urumqi River and Toutun River. Its southern side is the giant Tianshan Mountains and its
northern side is the Junggar Basin and desert. The extremely continental arid climate
encapsulates the way in which agricultural productions – grazing and crop farming – are
largely constrained by timely snowmelt.

19
Figure 1. The location of each metropolitan area within China (upper left) and the extent of each study area in Xi’An, Shaanxi Province, Chengdu, Sichuan Province, and Kunming, Yunnan Province. The small maps of each study area illustrate three periods of urban expansion from 1988 to 2010 (note that the full classification scheme was collapsed for ease of viewing).

20
Each city is surrounded by a densely settled region that has grown significantly in the twenty
year period following reforms (1990s to present): the population in each extended region
ranged from 4 to 9 million in 1990, but climbed to 6 to 11 million by 2009 (Table 2, Chinese
Statistical Bureau, various years). The population in the city proper grew even faster than
that in the extended region in each city. And for both scales the population of the city at least
increased a half in the two decades.
Second, all four regions have witnessed incredible rates of economic development, with a
noticeable shift away from agrarian-based economies to secondary and tertiary industry
based on percent GDP. Despite these similarities, there are also important differences in
policy and development as well: Chengdu was designated early on as a western ‘Gateway
City’, Xi’an has emerged as a leader in telecommunications and aerospace industry, and
Kunming has been designated a primary tourist destination within China.

21
Table 2. Demographic, socio-economic, and land cover characteristics of the three study areas, 1990-2009. Chengdu, Sichuan Xi'An, Shaanxi Kunming, Yunnan Urumqi, Xinjiang 1988 2009 1988 2009 1988 2009 1988 2009
Populationa City proper 2,000,600 3,171,498 2,506,560 3,685,300 1,482,000 3,080,000 1,548,662 2,505,000
Extended metro area 19,355,4000 22,703,260 12,368,270 16,286,060 3,849,000 6,059,000 2,218,744 3,448,400
Household Numberb
2,626,100 4,052,000 2,165,175 N/A 921,957 1,884,900 339,300 783,100
Gross Domestic Productc
GDP (10,000 yuan) 1,940,857 39,009,857 1,165,100 21,900,400 1,152,588 16,053,993
532,664
11,025,884
GDP per capita (yuan/person) 2,123 34,873 N/A 26,259 2,413 25,826 3,440 44,016
GDP by sector (% of total GDP)
Primary 20.9 6.9 12.0 4.8 11.2 6.5 N/A 2.0
Secondary 39.7 46.6 43.1 43.4 52.9 46.1 N/A 42.7
Tertiary 39.4 46.5 45.0 51.9 35.9 47.4 N/A 55.3
Land Coverd
Urban extent (km2) 577.7 1,237.7 553.2 1,016.7 211.3 532.1 278.4 456.0
Cropland (km2) 3,805.6 3,145.5 3,635.7 3,172.2 2160.0 1839.2 1205.8 1096.5
Major crops rice, wheat, vegetables wheat, corn, vegetables rice, wheat, corn, tobacco cotton, wheat
a Population statistics are from the Provincial Statistical Bureau , various years. The city proper includes the core city (defined by political boundaries), while the extended metropolitan area consists of the core and surrounding counties (typically, the municipality).
b Household statistics are from the Provincial Statistical Bureau, various years. The number includes the core city (defined by political boundaries) only.
c. Miscellaneous GDP are from Chinese Statistical Bureau, various years.
d. Land cover statistics are derived from maps produced in this research, while crop information is from agricultural census data for crops with greatest yields for the 1990‐2009 period (Chinese Statistical Bureau, various years).

22
Population and economic changes have been spurred by major policy and institutional
shifts during the reform period (Table 2). Over the last two decades, Western China has
been targeted by the Chinese government for reforms designed to bring China’s
economic transformation to inland regions (Lai, 2002). The extraordinary rates and
patterns of land use change in Shanghai, Beijing, Guangzhou and other open cities in
coastal region exemplify the first ‘wave of growth’ that occurred as a result of reforms
that liberalized the household registration system (aka. Hu Kou) to allow greater mobility
to the population, gave freer rein to market forces (which in turn led to a rapid rise in
GDP and per capita income), and provided preferential policy to spur growth in a small
number of Open Door cities and Special Economic Zones (Lin & Ho, 2005). These early
reforms included The Household Contract Responsibility System for rural land lease,
which was introduced in the early 1980s and allowed for the privatization of land use
right in rural areas (Ho, 2001). In the late 1980s, controls on population mobility were
largely released throughout China (including the West), permitting migration from rural
to urban area (Chan and Zhang, 1999).
By the 1990s, China’s leaders began to coordinate economic development in central and
western regions to reduce inequality in development and living standards between coastal
and inland areas (Long et al., 2008). Following the regional development goals outlined
in the Ninth Five-Year Plan (1996-2000), western cities began to experience China’s
“second wave” of industrialization, urbanization and urban growth. This growth was
spurred in part by the establishment of economic and industrial zones in the West,

23
beginning as early as 1991 in Chengdu (Lai, 2002; Chengdu municipal government,
2011). These areas provided cheap land, tax exemptions and reductions, and the new
firms in these areas helped foster faster GDP growth during the 2000-2009 period than
witnessed a decade earlier (Ding, 2007). The Chinese Western Development policies
adopted in 1999 had profound impacts in Western China on infrastructure construction,
investment, economic adjustment, environmental protection and the welfare of residents
(Lai, 2002; Fan and Sun, 2008). Finally, the Grain for Green policy designed to return
grazing land to forest or natural vegetation was implemented in 2003, instituting land
protection that affected where and how the urban regions in the West were able to
expand/grow (Lai, 2002; Tan et al., 2005). More recently, policies favoring economic
development, the real estate market and public infrastructure development have been
extended to include cities throughout the central and western regions, with evidence of
increasing flows of government-led investment to high-performing cities such as Xi’an
(Vermeer, 2004).
The major shifts in policy and institutional governance have had a profound impact on
each of the four study areas, although changes have occurred at different times and at
times, have fostered different outcomes (Demurger et al, 2002; Ni et al., 2005; National
Bureau of Statistics, various years). Chengdu was one of the first western cities
designated for ‘open’ status, also receiving the first national-level high-tech zone in 1991
(Chengdu municipal government, 2011). Chengdu also benefited from major
road/highway construction projects that connected the city to nearby prefectural-level
cities, such as Mianyang, Guanghan. In comparison, Xi’an was favored by same bundle

24
of national-level policies as Chengdu but failed to attract as much FDI as Chengdu (Xi’an
municipal government, 2011). Instead, Xi’an boosted its economy by high-tech industry,
export-oriented industry and tourism. Aside from these, it was labeled as a national
center for space technology and energy exploitation, along with a regional center for
financial service and logistics. In comparison, Kunming was not favored by national-
level policies as much as Chengdu and Xi’an. Kunming is unique among the study areas
in that its development was spurred by major investment and infrastructure development
for the International Horticultural Expo held in 1999. Following these changes, Kunming
planned a new town in Chenggong in order to break the geographical constrains for urban
growth. Tobacco industry, biochemistry, tourism, mining and electricity production
sparkled in Kunming as mainstay industry. Urumqi was also benefited from the state
government with the national-level economic zone and high-tech zone in 1994. Because
of the barren soil quality, limited water supply, and petroleum transportation hub to
central Asia, Urumqi emphasized on developing energy industry and other resource based
industry.
In addition, all four cities established ambitious urban planning by developing city to a
leading position in Western China. Corridors are planned along major arterial roads and
functional satellite cities are designed based on county seats or industrial parks. For
example, primary and secondary developing axes were planned in Chengdu from north to
south and from northwest to southeast. At least six satellite cities with different functions
were planned around the core city. The underlying goal of recent urban planning efforts
has been to shift each city from a traditional monocentric form to a polycentric urban
25
region (Chengdu Planning Bureau, Xi’an Planning Bureau, Kunming Planning Bureau,
and Urumqi Planning Burea, 2011).
4. Datasets and definitions
4.1 Remote sensing of urban expansion in Chinese cities
This study was possible in part because of recent work to monitor land cover change in
Chinese cities using remote sensing data with high spatial and temporal detail (Schneider,
2012). The maps of land cover change for each study area were obtained through
historical analysis of 30 m spatial resolution Landsat TM and ETM+ data for five time
periods (1988-1995, 1996-2000, 2001-2003, 2004-2006, 2007-2009). Although great
strides have been made to accurately map land cover change using satellite imagery,
remote sensing of urban areas remains a complex challenge because of the many
combinations of materials present and the variations in size/shape of urban features that
can lead to different ‘mixtures’ within pixels (Small and Lu, 2006). These issues are
further compounded in developing countries such as China, since new development is
often small, patchy in nature, and located in peri-urban areas up to 100 km from the urban
core (Webster, 2002; Long et al., 2009).
To deal with these issues, the remote sensing analysis relied on a supervised multi-date
composite change detection technique that exploited training data of stable/changed areas

26
interpreted from Google Earth images, and a 'brute force' approach of providing all
cloud-free Landsat data as input (typically 35-50 scenes for each city). All Landsat
scenes were stacked and used as input to a boosted decision tree classifier (C4.5, Quinlan,
1993) to detect changed areas for the five periods of interest. This approach is built on
the premise that information from before a given period helps establish land cover classes,
while information from after the period helps confirm that change occurred.
Selection of training sites was performed in-lab for each case study city through visual
interpretation of Landsat data and Google Earth very high resolution (1-4 m) imagery
(multiple dates, 2000-2011) and through on-the-ground visits to each location. On-site
visits (multiple visits, 2009-2011) confirmed that the only land lost to urbanization was
agricultural land, and other land cover transitions (e.g. forest to urban land) were
negligible. Thus, this work focused specifically on the transition from cropland to urban
land in each region for the five time periods. In addition, unchanged or ‘stable’ classes
such as natural vegetation, forest, and water bodies were mapped, as well as agriculture
and urban land that remained unchanged throughout the study period. Note that a lack of
cloud-free Landsat data for Urumqi in 1995 required estimation of land cover amounts
for this time point using linear interpolation of the 1990 and 2000 classes.
The final maps were calibrated and assessed for accuracy using Google Earth imagery,
on-site visits, and photo interpretation of test sites by multiple analysts (for details see
Schneider, 2012). The overall accuracies of the maps averaged 90-94 percent, and the

27
methodology proved particularly effective for monitoring peri-urbanization outside the
urban core, capturing >98 percent of village settlements.
4.2 Defining ‘urban land’ and ‘urban expansion’
Before outlining the approach, it is important to clearly define ‘urban land’. In the
remote sensing based maps, a definition based on the physical environment was required:
here, urban land refers to places dominated by the built environment. The ‘built
environment’ includes all non-vegetative, human-constructed elements, such as roads,
buildings, runways, etc., and ‘dominated’ implies coverage greater than 50 percent of a
given spatial unit (the pixel). When vegetation (e.g. a park) dominates a pixel, these
areas are not considered urban, even though in terms of land use, they may function as
urban space. Finally, the definition also includes a minimum mapping unit: urban areas
are contiguous patches of built-up land greater than 1,800 m2 (because the classification
algorithm screens out single pixel urban land with classification errors, the minimum size
of contiguous urban patch should be two 30m-by-30m pixels. See details in Schneider,
2012).
Given the definition of urban land described above, it is now possible to define ‘urban
expansion’. In this research, expansion of urban areas refers to wholesale conversion of
land within a 30-m pixel (it is assumed that the entire pixel area is converted). Since new
development near the urban core has a similar spectral signature to lands converted to

28
urban uses outside the city, all areas converted to built surfaces are labeled ‘urban
expansion’, regardless of location. To distinguish different types and locations of new
development therefore required additional processing, as described below.
There are three forms of new development taking place in terms of location, observed in
land cover maps (Figure 1). First, a major development in scale is the continuous
expansion extended from the old city core. Behind it, the increasing demand of land for
urban use encourages municipal government to acquire surrounding land, pave
infrastructure, and enlarge city’s limit. Second, a noticeable amount of development is
situated close to county seat, towns, and planned development zones. They are either
attractive to nearby farmers with short distance to their villages, or attractive to
employers with favorable policies. Third, the rest of developments in piecemeal form,
such as new settlements next to existing villages or emerging villages, are categorized as
rural development here.
The remote sensing work was also able to characterize the large number of settlements
that dominate the Chinese landscape (Schneider, 2012). The most appropriate label for
these areas is that of ‘village’: these areas are comprised of a dense configuration of
buildings, houses and tree cover, and vegetation typically differs from surrounding
agricultural areas. The presence of buildings and materials characteristic of urban
environments makes it easy to include these areas as part of the urban class, and most
remote sensing studies that focus on the geophysical environment follow this
convention. From the perspective of urban planning, however, these areas neither

29
essentially function as a part of city economically nor have the minimum population size
to be administratively designated a city or town.
To fully address the research questions and hypotheses, areas of built-up land had to be
separated into core urban land, nuclei cities/towns (i.e. the small satellite cities that
surround the core city), and all other built-up areas (typically, villages or rural industry).
The urban core was delineated for each time point using visual interpretation and heads-
up digitizing. To define the nuclei cities, three criteria were used: (1) the area had to be a
county seat or a planned industrial or high-tech zone; (2) the area had to be connected to
the core city with major transportation networks; and (3) the built-up area had to rank in
the top one percent of all urban patches in the region. With this definition, 27 satellite
cities were designated for Chengdu, 19 for Xi’An, 14 for Kunming, and 5 for Urumqi
circa 2009. Similar to the core, the nuclei cities were then digitized for each time point.
Finally, any remaining urban land outside the core or satellite cities was designated as
‘other built up land’.
4.3 Defining the extent of each study area
Defining the extent of what constitutes a city is challenging for several reasons: (a) the
jurisdictional extent usually does not coincide with boundaries used for economic and
social functions of city (e.g. the extent of sewage and water supply may not align with
administrative boundaries, Kelly, 1984; Leutwiler, 1987); (b) the extent of the city – both
in physical and administrative terms – often changes as the city grows and expands (Lin,

30
2001; Brenner, 2004); and (c) including all areas that function as part of the city (whether
socially, politically or economically) can be difficult (Benguigui et al, 2000).
Although population measures are widely used to define urban versus rural areas,
demographic data for Chinese cities are problematic due to the discrepancy and
inconsistency of surveying approaches across time and generality of spatial scale in early
years. One approach that was used by statistic bureaus in 1980s and early 1990s were
absolutely relying on counting hukou permits of the city’s residency, leaving two main
concerns for reflecting the real number for urban population. First, the statistics failed to
include floating population with other cities’ residency (Zhou and Ma, 2005). Second,
while the hukou permit divides population dichotomously into the agricultural and non-
agricultural population, a large fraction of rural residents who live and work in the city
and hold the hukou permits of the same city were also misreported in the urban
population of the statistics (Tan et al, 2008). The other approach for the statistics was
surveying or sampling all residents within a city’s limit that was delineated by municipal
authorities. This approach overcame the problem of floating population but left two other
issues. First, it overly counted urban residents by even including peasants who lived on
lands that were delineated into the urban boundary (Yew, 2012). Second, it did not cope
well with changing urban boundaries, given the duration between population censuses
was usually longer than boundary changes (Fan, 1999; Chan, 2007). Considering the
land conversion is essential to the process of urbanization in China, using the extent of
built-up environment is an alternative to define city’s extent and incorporate
socioeconomic data consistently.

31
To balance the trade-offs described above, I used two measures to determine the overall
extent of each city and its surroundings. First, the study extent is normalized by using a
standardized area across all four regions. Based on a review of relevant literature, a 40
km radius is selected to buffer the original CBD (Wang and Meng, 1999; Dietzel et al,
2005; Seto and Fragkias, 2005; Ji et al., 2006; Haase et al., 2007; Schneider and
Woodcock, 2008), since this value has been shown to reach the realm of jurisdictional
and economic functioning of a city, and the area in this radius covers all zones and
corridors in each city’s master plans, it was used here to define the extent of each city.

32
Figure 2. Planning maps, corridors, nuclei cities, and urban growth for each city. From left to right, they are Chengdu, Xi’an, Kunming, and Urumqi respectively. Top row is the planning maps across cities and bottom row is the defined nuclei and corridors using planned development zones, county seats, and townships.

33
Second, I selected the counties that comprise the standardized area (i.e. the counties
whose majority land area fell within the 40 km buffered area). For Kunming, Chengdu,
and Urumqi, the selected counties correspond roughly to the municipal boundary as well,
while in Xi’an, the selected counties comprise the municipality and six neighboring
counties as well. Those six counties are under jurisdiction of Xianyang municipality that
is functioning as a part of great Xi’an area. In addition, I chose one measure to delineate
a more constrained urban core than the standardized area or municipality provide. Here, I
selected the county that overlapped the urban core (Figure 2). The data within the urban
core county was important because the number of total population using here stands for
the urban population within traditional urban center constantly, since agricultural
activities barely exist in those first-core-county-then-core-districts. Also, the total
population instead of urban population in statistics is used for matching up with the
standardized urban extent in each city for further comparison. Due to the considerably
low fertility rate and the diminishing input of labors for farming in China, population
migration explains the demographical shift. The rural household permit holders within
jurisdiction of municipalities were likely to work in the nearby cities, or at least capitalize
their agricultural products or services (e.g. work at the farmers’ market), with increasing
demand of labors in those cities. Thus, the matching counties and districts are arguably
defined as the extent of the city in this research.

34
4.4 Additional datasets
The goals of this research required comparison of urban expansion to socioeconomic
characteristics, such as population density, as part of a larger objective to connect urban
expansion to socio-economic drivers of change (see Schneider et al., in prep). Population
data is available at different administrative levels for each city, so the first step was to
determine the most appropriate source/level of data to align with the land cover analysis.
While municipal-level data published by National Bureau of Statistics of China contain
the most complete set of variables and consistency is maintained across provinces and
through time, two caveats prevent applying it to this study: 1) the variation in terms of
municipal boundary lacks necessary continuity for data quality; 2) taking one
municipality as a whole fails to differentiate the change of built-up areas detected in this
study.
Disaggregated, district-level data, on the other hand, were not available prior to 2000 and
the statistical variables collected/published by each city varied widely, making
comparison across cities before 2000 impossible. To fill the gap of time horizon, I turned
to the county-level data that make up each municipality (Sichuan Bureau of Statistics,
Shaanxi Bureau of Statistics, Yunnan Bureau of Statistics, and Xinjiang Bureau of
Statistics, multiple years). The multiple districts with newly delineated jurisdictional
boundaries in post-2000 period that shaped the city proper were usually one or two
counties/districts prior 2000. As described above, the counties corresponding to the built-

35
up extent of the city and its surrounding nuclei were selected and the population data
aggregated to one metropolitan-level statistic.
It is important to note that Chinese socioeconomic data have been shown to be
problematic due to the manner in which data were collected, and due to possible
adjustment of figures by local officials (Fan, 1999, 2005; Chan, 2007). The term ‘city’
remains unclear in China, in terms of population or jurisdictional spatial scale. The
hukou system (household registration system) divides population into rural and urban
based on residence, and statistical data is collected accordingly. Prior to 2000, this
system did not record persons with rural hukou who moved to the city as urban residents.
This ‘floating population’ has been estimated as high as 10 percent of the total population
in medium and large sized cities (Liang and Ma, 2004). Moreover, Chinese statistical
agencies changed their survey methods in the year 2000 to include some of these persons
in the urban population data (Zhou and Ma, 2005; Chan, 2007). Because these issues
make the urban and rural population data particularly unreliable, I chose to use the total
population at the county level, and aggregate the county-level data to one metropolitan
statistic as the core districts. With regard to deflation of data before 2000, the results of
this study should be considered in light of the bias introduced by these issues.
Fortunately, some studies suggest that since the large population migration mostly started
from inner small sized cities and rural areas to coastal large metropolitan areas, the
floating population before 2000 in those medium sized cities specifically from other
municipalities was limited (Liang and Ma, 2004; Wang et al., 2008).

36
Finally, political boundary data of counties and districts were acquired in GIS format
from the Socioeconomic Data and Applications Center (SEDAC), China Dimensions at
Columbia University (http://sedac.ciesin.columbia.edu/data/collection/cddc). A few new
districts were established in or near the core for some cities. Since disaggregated data
were available for the new districts, it was possible to adjust all socioeconomic data to the
baseline GIS political boundaries.
5. Methods and results
5.1 Hypothesis 1: Rapid expansion of built-up land.
The first hypothesis I explore is centered on one fundamental question: what the rates and
amounts of urban transformation in each study area are. In addition to a visual
assessment of each map, these trends were quantified using one simple and
straightforward approach: the amount of new urban land within the 40 km normalized
study extent was measured for each period to estimate city-specific rates of change
(Figure 3).
Regional views of each map (Figure 1) reveal that each study area has expanded rapidly,
with large amounts of new urban land appearing in the most recent time period (2006-
2009). New urban land, rather than sprawling out from the core city, extended further out
to even 20-40 kilometers away from the city center. Visual inspection suggests that not

37
only the growth rate in each period is fast but in a trend of accelerating. The growth of
all four cities in the latest period was immense.
Figure 3. Rates and amounts of new urban land, agricultural land, 1988 - 2009. The top row is the urban expansion at the expense of arable land. The bottom row is the average annual rate of urban expansion in each period.
Quantifying these trends, Figure 3 shows that rapid expansion has indeed occurred in all
four study areas. Studies that measure rates of urban expansion in cities across the globe
suggest an average annual rate of change of 2 percent per year (Angel et al., 2005;
Schneider and Woodcock, 2008; Seto et al., 2011). The results here reveal that all four
cities grew at rates near 2 percent for the earliest period (1988-1995), but climbed to over
3 percent expansion in the 1995-2000 period for all cities except Xi’an. While none of
the cities developed rapidly during China’s “first wave” of growth in the late 1980s and
early 1990s, this jump in the late 1990s suggests that Western cities may have undergone

38
a “second wave” of growth. Both Chengdu and Urumqi were targeted for growth during
this period, with favorable investment/policies, state infrastructure construction, etc.
Finally, a “third wave” of growth may be apparent in the results as well: all cities jumped
to average annual rates of expansion of 5-7 percent in the 2006-2009 period. This third
wave has not yet been discussed in the literature on Chinese urban development, but the
consistency of this trend across study areas suggests that policies aimed to develop the
West have been effective in establishing new buildings and infrastructure outside the core
during this period (Lai, 2002).
Compared to average annual rates of change over 30% for coastal cities (Schneider and
Woodcock, 2008), rates in Western cities are clearly not as high. Rates of change on the
order of 5-7 percent are equivalent to significant amounts of land, however (Table 3). In
Chengdu, for example, more than 200 km2 were developed between 2006 and 2009, the
overall total amount of expansion-- cities tripled in size from 88-09 (27 years), while
cities on the coast tripled in a shorter amount of time (88-96, Seto et al., 2003).
When estimating the rates and amounts of new urban land, one additional trend became
clear. Across all four cities, all new urban land developed between 1988 and 2009
occurred at the expense of farmland or arable land. This trend is clear in Figure 3, which
shows a decline in the amount of agricultural land coincident with the increase in urban
land.

39
The findings of hypothesis one suggest that none of these cities experienced rapid urban
expansion during 1988 to 1995, as they grew at 2% annually on average, which
approximately equals to the average annual growth rate of cities throughout the world
(Angel et al, 2005; Schneider and Woodcock, 2008). From mid-1990s to early 2000s, the
average growth rate of these cities was much faster (at 5-7%) than early period. Also, the
new expansion was discontiguous and located as far as 10 kilometers away from the edge
of preexisting urban core area.
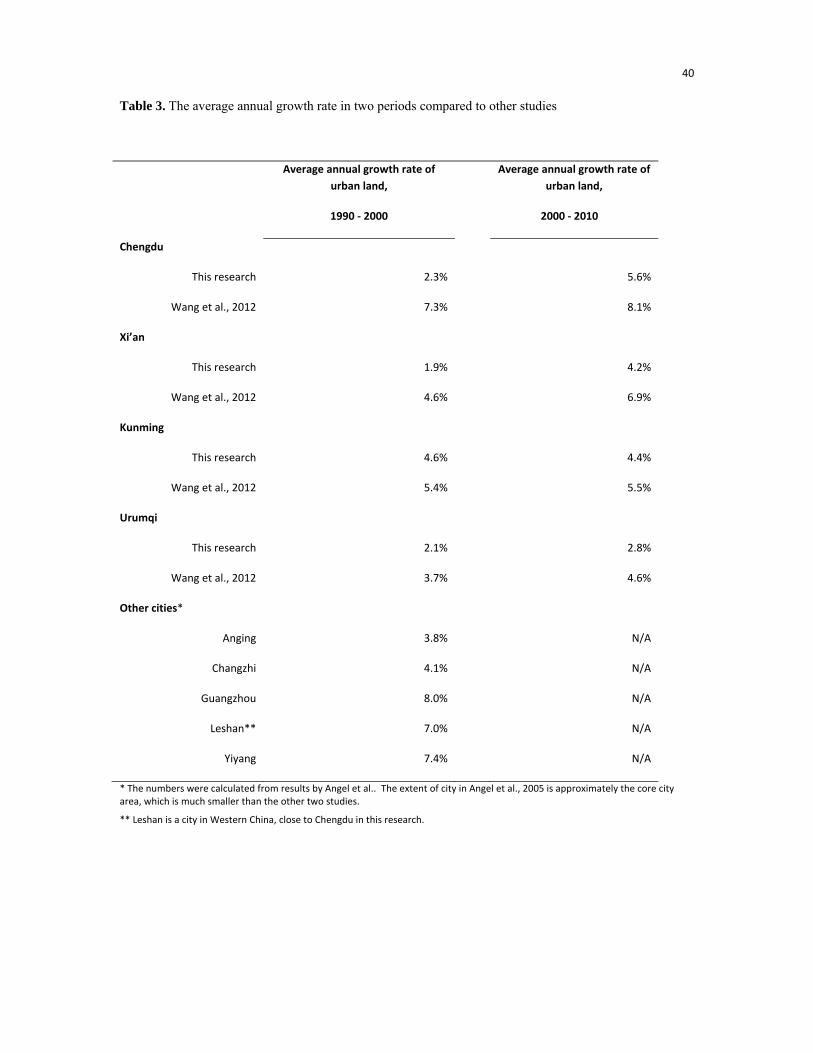
40
Table 3. The average annual growth rate in two periods compared to other studies
Average annual growth rate of urban land,
1990 ‐ 2000
Average annual growth rate of urban land,
2000 ‐ 2010
Chengdu
This research 2.3% 5.6%
Wang et al., 2012 7.3% 8.1%
Xi’an
This research 1.9% 4.2%
Wang et al., 2012 4.6% 6.9%
Kunming
This research 4.6% 4.4%
Wang et al., 2012 5.4% 5.5%
Urumqi
This research 2.1% 2.8%
Wang et al., 2012 3.7% 4.6%
Other cities*
Anging 3.8% N/A
Changzhi 4.1% N/A
Guangzhou 8.0% N/A
Leshan** 7.0% N/A
Yiyang 7.4% N/A
* The numbers were calculated from results by Angel et al.. The extent of city in Angel et al., 2005 is approximately the core city area, which is much smaller than the other two studies.
** Leshan is a city in Western China, close to Chengdu in this research.

41
5.2 Hypothesis 2: Transition from monocentric to multi-nucleated urban form.
Given that the rates and amounts of the expansion are fast, the question is where the new
urban land is located with regard to the preexisting core city. Instead of delineating
artificial gradients at certain directions, I applied a series of 1-km buffers to the city at
each time point (Figure 4). As shown in Figure 4, the core urban area was not held
constant through time, but rather updated for each time period, and the buffers re-
estimated accordingly. This approach is similar to transect analysis along the urban-rural
gradient (Luck and Wu, 2002), but I modified it so that transects in all directions could be
considered.
Figure 4. Examples of the buffers used in the analysis of each city (Chengdu is shown above), where the buffers were modified for each time period based on the extent of urban land for a given period.

42
To estimate the amount of new urban land within each consecutive buffer extending
outward from the city, the total area (TA) of urban land at each time point is a simple and
straightforward measure, yet not consistent across scale as reviewed in the use of
landscape metrics. Instead, TA at each time point is normalized by the amount of land
available in each buffer area for development in each period (note that available
developable land was defined as the total land, minus any built-up areas, water, and forest,
for nuclei expansion, exclude the core city). In this analysis, a steep slope for a given
period indicates that all new urban land was developed very close to the original city core,
while a flattening of the slope with distance indicates that development occurred farther
from the edge of the city (specifically, the city edge as defined in that period). It is
important to note that, although the buffers are adjusted to account for the growth of the
core, the actual area within the buffer is not standard across a city or across cities.
Therefore, the percentage of new urban land in the buffer (the percentage) will always be
higher for the early periods (20-40 percent or higher), while in later periods, the large
core size means that the first buffer ring is substantially larger, and the percentage of
urban land is correspondingly low.
The results for the core urban area of each city show that in the early periods (1988-1995,
1995-2000), the slope for the amount of new urban land is indeed steep; nearly all new
urban land developed during these two periods occurred within 4-5 km of the original
city core in Chengdu and Xi'an, and within 2-3 km of the core in Kunming and Urumqi
(Figure 5, top row). In later periods, this drop is less apparent, and the trend lines are
indeed flatter, revealing that consecutive buffers all had a large amount of development

43
take place. The later trend lines are also higher along the y axis, since a greater amount
of available land was developed in later periods. Kunming exhibits the extreme case:
nearly 10 percent of available land was developed in every buffer between 5 and 13 km
from the core during the 2006-2009 period.
Given the sizable amount of new urban land that was developed far away from the core
city, more efforts have been made to investigate changes in spatial patterns over the past
two decades – whether they are simply sprawling outward from the monocentric city
center or shifting to a multi-nucleated urban form. Planned development zones, new
towns, and county seats are defined as nuclei cities in each study area, with the assistance
of planning maps published by each municipality (Figure 2). Within a development zone,
essential infrastructure, including roads, sewage lines, electricity, is well accommodated
by the government. And certain type of land use (e.g. high-tech manufacturing in high-
tech zone) is encouraged, if not limited, by favorable policies, such as subsidies for land
purchase, favorable tax policies and so forth. The number of nuclei cities differs as
mentioned in section 4. The other development, including village and town expansion,
and piecemeal rural housing extension, is defined as rural transformation.

44
Figure 5. Ratio of new urban land to the amount of developable land in 1 km rings/buffers extending outward from the core city (top row) and from the nuclei outside each core city (bottom row) for the three metropolitan areas. In this analysis, the buffers vary for each period (see Figure 4 for an example).

45
Figure 6. Rate and amount of urban land in core city, satellite cities, and villages. The rate between two bars indicates the average annual growth rate for all urban land during that period.

46
Figure 7. Amount of new urban land near core city and satellite cities

47
The same buffer analysis was applied to the nuclei cities in each region, to determine if
the trend toward expansive growth near the city core was also apparent in small- and
medium-sized cities in each region (Figure 5, bottom row). The results show that for
Chengdu and Kunming, this is indeed the case: new urban areas have been developed as
far as 10 km from the city edge. In Xi'an and Urumqi, however, the line remains steep
over time, suggesting that any growth that occurred in the small cities occurred
consistently within 2 km of the city's edge. The results suggest that, over time,
development has occurred farther and farther from existing built-up spaces in China's
western cities. It is no surprise, then, that my next question focuses on the transition from
the monocentric to a multi-nucleated urban form that is likely underway in each study
region.
An alternative way to understand this trend is to look at the amount of new urban land
that has occurred near the core, compared to the amount of new land developed near
satellite cities (small cities located between 10-40 km from the original CBD) (Figure 7).
If I look at the total urban land in both the core and nuclei cities, the year-to-year trends
are actually masked - the amounts of urban land change varies little year to year relative
to one another. Some new urban land near nuclei cities here is counted both as core
expansion and nuclei expansion even though some nucleus merged into the core city
eventually.
Even in these raw (unnormalized) numbers, an interesting story begins to emerge. All the
core cities exhibit an initial jump in urban land growth during the 1988-1995 period (the

48
lowest bar), followed by a drop to lower amounts of growth in subsequent periods. Later,
the trend was followed by increasing amounts of urban land in the 2003-2006 and 2006-
2009 periods (note the 'C' shape in graphs for the core, right side). The amounts of new
urban land added to the satellite cities (left side graphs) actually mirror what occurred in
each core city. In both Chengdu and Xi'an, the amounts of urban land added to the core
are nearly the same as the combined amount of new urban land added to the satellite
nuclei cities. In several cases, the amount of new land added to the satellite cities is
actually greater than that for the core for the 2006-2009 periods: Chengdu and Kunming
added 86 and 46 km2 to the core, respectively, while the combined amount of urban land
added into the satellite cities outside Chengdu and Kunming was 118 and 56 km2,
respectively. Overall, the growth near the nuclei cities is staggering in years.
Also, clear contrast between satellite cities and rural transformation suggests differences
across the cities (Figure 6). In both Chengdu and Kunming, rural transformation almost
coincided the growth near satellite cities and the core city. In Chengdu, the built-up in
the rural area increased in every period, and in Kunming, it grew significantly in the
1995-2000 and 2006-2009 periods, where the expansion near satellite cities increased the
most in these two periods. However, in Xi’an, the settlements in rural area widely
outnumbered the total amount of urban land in the satellite cities at the beginning, so the
growth of rural transformation outpaced the growth near satellite cities in each period.
There was very little urban growth occurring out of the core city and satellite cities in
Urumqi, due to the sparsely populated surrounding areas. Given the rural transformation

49
is the house extension of grassroots farmers benefited from economic growth, it is a
bottom-up growth other than government-led core and nuclei expansion.
Finally, it is worth noting that, in some extreme cases, the amount of new urban land in
the nuclei might actually be quite a bit larger than the amount of new land added to the
core, indicating that all urban expansion is occurring far from the core. Urumqi in the
early 1990s is a good example of this trend, as well as Kunming during the 2006-2009
period.
The finding of hypothesis two indicates that the newly expanded urban land in all four
cities is located discontiguous from the preexisting core city. A sizable amount of this
new urban land is clustered around the planned development zones, county seats and
other townships, which is addressed as nuclei expansion here. Because of the nuclei
expansion, the transition of the urban form is clear: all four cities are transitioning from a
form with one core city to a new form with a large core city and several satellite cities.

50
5.3 Hypothesis 3: Development of corridors with specific spatial patterns related to
designated land use.
The third hypothesis for investigation is related to the corridor expansion that was
visually detectable in each city. In addition to exploring the expansion in terms of
location near the core and nuclei cities, it is more specific to compare and contrast the
expansion that economically links specific nuclei cities with certain land use in urban
planning. Major roads and massive road construction in later years linked nuclei cities
with the core city. A handful of literatures suggest that road construction drives urban
expansion in China, not like the reverse way in the U.S (Fan and Chan-Kang, 2005).
After the roads and ancillary infrastructure are built, other developments are filled in
accordingly. For the road construction, land acquisition and the favorable policies in
development zones are predominately designed by the government (Ding, 2007), which
suggest that the government plays a large role in the development that is worth further
examination. Therefore, a few gradients along the arterial roads in each city were
examined specifically to understand how road construction fosters new urban growth and
what kind of specific spatial pattern could be linked to designated land use type of nuclei
expansion.
According to the master plan of each city, several development zones were planned, such
as the high-tech zone, the industrial/manufacturing zone, and the new town/residential
zone, where the designated land use in the zone is encouraged by favorable policies, but
not necessarily regulated by zoning and construction ordinances. To accommodate the

51
potential large load of commuting between the historical core city to its development
zones, arterial roads were built to connect them with the core city. Along with the arterial
roads, road networks and other infrastructures were appropriated and formed corridors,
inviting certain businesses related to designated land use of the zone. The growths of
certain land uses are hypothetically likely to expand along these corridors.
To measure the expansion, a four-kilometer wide corridor was therefore defined along
the arterial roads to connect the core city to the satellite cities. Among all the landscape
metrics, the mean patch size was used here to capture the increasing average size of the
urban settlement as well as the fragmentation of development in the circular moving
windows (2 kilometers radius) from the city centers to the urban fringes within the
corridors. It is worth noting that the maximum value of MPS ideally is 12.56 km2 when
the entire moving window is occupied by one urban settlement, and the minimum value
is 0 and not shown in the figure.
A trend shows that in early period (1988-2000), the expansion in the corridor was near
the core city, not near the nuclei cities. The area in between the two lines stands for the
expansion during the period in Figure 8. The line of 2000 curves but simply moves to the
right, illustrating how the expansion remains close to the core. In the later period (2000-
2009), the expansion of the core city continued by externalizing the peri-urban area,
while a few rapid expansions near the nuclei cities emerged, as the spikes show in the
figure.

52
The results also show distinctions among different planned corridors, in spite of certain
designated land use across the cities. For both the high-tech and residential corridors,
significant expansion in1988-2000 period was pronounced near the city center (within 10
kilometers), as is shown in the first and last two columns from left to right (Figure 8).
The trend diverged in the 2000-2009 period. The growth in the high-tech corridors
extended further out close to existing urban area, due to the fact that the available land
closer was fully consumed. In contrast, in the later period, growth appeared in spikes
even over 30 kilometers far from the city center, as is shown in the right two columns,
indicating large expansion near the nuclei cities further out. For the industrial corridors,
the growth was initialized in early period, but was not prominent as expected in the later
period.
Corridor expansion differed across cities in terms of magnitude. The expansion in
Chengdu and Xi’an was larger than that in Kunming. In Urumqi, there was not much
expansion for all the designated corridors compared to other cities. Taking the residential
corridors as an example, the expansion was 15 kilometers away from the city center in
Chengdu and Xi’an by 2000, and even beyond 30 kilometers by 2009. In Urumqi, the
development was not as much about urban expansion but the fragmentation of urban land.

53
Figure 8. Average size of urban patch in designated corridors across cities, displayed in log scale. It is worth noting that corridor b. is industrial corridor and corridor d. is mixed-use corridor in Urumqi.

54
The finding suggests that, first, the corridor expansion widely occurred in western China
during the urban expansion. Second, it is closely related to the nuclei expansion, and the
form varies by the difference of development zones. For high-tech zones, corridor
expansion is extended outward from the core city. For residential zones, it is spread from
both the core city and the nuclei cities. For industrial zones, there is not much expansion
in the corridors. Last, the extent of corridor expansion in each city responds to the
magnitude of urban expansion in the city as discussed in hypothesis one.
5.4 Hypothesis 4: Trend toward monumentality in urban form.
Besides of the spatial patterns of the expansion, the fourth urban model I explore is the
expansive nature of new development in these cities over a relatively short period, which
is closely related to large consumption of land, such as wide street block structure, and
enormous real estate projects. The ideology of expansive urban form could trace back to
the concept of monumentality in the Paleolithic or Neolithic period where the early form
of the city started to be crystallized. The religious and royal monuments, such as the
Egyptian pyramids, and the Greek and Chinese palaces emerged to magnify social
privilege and power as urban order formed (Mumford, 1961 pp.64). With the rise and
development of capitalism, the idea of monumentality has repeatedly appeared in urban
planning (Le Corbusier, Daniel Burnham) and landscape architecture (Frederick Law
Olmsted) in search of the utopian aesthetics, economic growth and competiveness.

55
The monumentality has reappeared recently in urban geography literature (Ford, 2008;
Smith, 2008; Adams, 2008; Ben-Joseph, 2009; Trumbull, 2010). From the singular
imperialism that incites religious monuments, to the manifold mechanisms which, in the
areas of economy, political symbolism, and aesthetics, distribute and institutionalize the
monumentality, an immense verbosity of monumentality is what each municipality has
required and pursued. The term monumentality refers to any urban development projects
that are at a larger scale than their surrounding neighborhood, and in an emblematic and
distinguished form that can be singled out in the urban fabrics. For instance, the grand
boulevards of Paris, Central Park of New York, and the downtown Abu Dhabi, could be
considered as urban monuments. Sometimes, these monuments are referred to as
‘megaprojects’ or ‘megastructures’, which are those that transform landscapes rapidly,
intentionally, and profoundly in a visible way that can be observed by satellites.
Although it is difficult to quantify the significance and magnitude of these urban
monuments, there is enough uniformity in how new urban areas and new zones are
planned to be less dense but with large-scale forms that could be quantified. What I am
trying to measure is the movement toward new urban areas that are less dense than the
core urban at a certain level of dispersion, or areas becoming less dense, and buildings
and road design become more large scale, involving more land.
One way to measure the monumentality is the density of road intersections, which is a
proxy for the area of an urban neighborhood given that the pedestrian accessibility and
communicable proximity are largely cut off by highways (Jacobs, 1961; Southworth,

56
1997). Higher the intersection density is, smaller the average neighborhood is. Here I
selected sample circles with 1.5 kilometer radius from each period, within which 90% or
more urban expansion occur during that period (Figure 9). Overlying them with Google
Earth (Figure 10), all intersections were digitized using points and the average number of
intersection per square kilometers was estimated as the results in Table 4.
The results show that in early periods, such as 1988 and 1995, the first amounts of
settlement developments were quite dense. The wave of development exhibited similar
intersection density as the urban core area before 1988. The expansion in the late 1990s
for Chengdu and Xi’an appeared to be expansive in form, as the sharply dropping
intersection density suggests in Table 4. At the same time, Kunming and Urumqi
continue dense development as a form of their historical urban core. Intersection density
in Kunming and Urumqi began to sharply decline in the early/middle 2000s. Since then,
new development in all four cities has been expansive, such as large condo blocks,
multiple lanes boulevards, and spacious squares.
The observed monumentality of urban development did not vary with land use types.
The selected sample circles across the cities all have designated associated land uses.
However, not quite different density of intersection was observed across the cities. It
suggests that, for all sectoral development, including manufacturing, high-tech, and
residential/service, has a similar expansive form of development emerged in the cities in
Western China as the cities expanded.

57
Figure 9. Selected sample circles for estimating number of road intersections at each time point across cities. Alphabetically, the letter stands for Chengdu, Xi’an, Kunming and Urumqi respectively. The small black circles are the sample circle with 1.5 kilometers radius for counting intersections in each period.

58
Figure 10. Digitizing road intersections – example of roads from Google Earth, compared to Landsat. The top panels (shown as a and b) are regarded as urban area circa 1988, and the bottom panels (shown as c and d) are regarded as urban area circa 2009.

59
Table 4. Density of intersections in different period for all four cities (1.5km buffer)
1988 1995 2000 2003 2006 2009
Chengdu 54 42 10 9 3 7
Xi’an 31 33 18 17 15 7
Kunming 57 42 18 13
Urumqi 37 41 7 6
* Unit: count of intersections per square kilometer ** The count of intersections is estimated based on circles in each period with 1.5 km radius
5.5 Hypothesis 5: Expansion of urban land is greater than population growth.
The last urban model that was examined related to the change of population density in all
four cities in response to the changing spatial form. Previous results show that the rate of
urban expansion in these cities was unprecedented and accelerating. An interesting
question is raised here – whether the population growth was as fast as urban expansion so
that the population density remained the same.
The amount of urban land and the number of urban residents were carefully matched at
two levels – counties and districts in the core city that was administratively defined as the
city proper, as well as the city extent in the 40 kilometers buffer that was defined in this
study. The raw numbers and cumulative changes of both urban land and population were
shown in Figure 11.

60
The results show two sets of plots that illustrate the relationship between population
growth and urban expansion, in jurisdictional core districts and a consistent 40 kilometers
buffer separately. The first row of panels finds an explicit trend of both population
increase and urban land increase in every period, at both core districts level and farther 40
kilometers buffers. The trends of four cities could be split into two categories. Chengdu
and Xi’an are at a larger size as shown in the second plot, while Kunming and Urumqi
are at a smaller size. It is notable that the growth of Kunming in core districts was
exaggerated because the size of its core districts is comparatively much bigger. Also, the
period 2000 – 2003 has the least expansion for all four cities.
For Chengdu and Xi’an, population density has been constantly decreasing for all periods.
Even for Kunming, because of constraints of physical geography, the trend is noisier than
the first two study regions but still pronounced. The trend of the core districts of Urumqi
is exceptional. In this case, the population growth outpaced the urban expansion.
The second row of panels shows the same trend as of cumulative percent change, but
only in two main periods, 1988 – 2000 and 2000 – 2009. It is clear to compare and
contrast the trend in inner core districts and a larger extent. For all four cities, the slope
of these periods varies. The slope of Urumqi is the flattest in both core districts and 40-
kilometer extent. The slope of Kunming is steeper than that of Urumqi. And those for
Chengdu and Xi’an are the steepest. The steeper the slope is, the lower population
density of the city becomes. The development in inner districts has been denser in
population than that of outer peri-urban areas. The rate of urban expansion outpaces the

61
rate of population growth and the difference is increasing. The latest period is the fastest
period for urban expansion in all four cities.
An alternative method to show the expansive form is measuring the population density at
county level. Instead of using total land area within the jurisdictional boundary, the total
built-up area in each county/district is used here. Even without available data in a few
counties and districts in early periods, an interesting story emerges as the choropleth
maps were shown in 1988, 2000 and 2009 (Figure 12).
The results show decreasing population density, especially in counties and districts
closely around the city center. The population density was relatively high in 1988 in all
four cities where urban expansion had not started yet and rural dwellers were living in
traditional compact rural houses. The density started declining in a few counties and
districts near the core city in 2000. And this trend spread to other surrounding counties
and districts that were even further to the core city in 2009. The deceasing population
density in later periods suggests that all cities were extended out in a more expansive
form that the form in the city center prior to 1988.

62
Figure 11. The growth of urban land versus the growth of population in all four cities. The top panels are the raw number of urban land and population in each time point at two spatial levels. The bottom panels are the cumulative percent changes in two major periods at two spatial levels.

63
Figure 12. Chloropleth maps illustrating the population normalized by the area of urban settlement by county in three years: 1988 (top row), 2000 (middle row), and 2009 (bottom row). It is worth noting that the population of Hongta in Kunming and core districts in Urumqi circa 1988 is interpreted from later years (1990-1995). Also, the numbers for a handful of counties at the urban fringe are slightly adjusted due to the short of Landsat imagery footprint.

64
The trend in the core districts varies by cities. For Chengdu and Xi’an, the population
density declined consistently during the past two decades. For Kunming, it declined from
1988 to 2000 then increased in the later period. For Urumqi, the population in the core
districts increased during the whole period. Considering there are a large amount of non-
urban land in Kunming and Urumqi that can be developed, the increasing population
density in Kunming and Urumqi might be because they tend to utilize the available land
in the core districts first. However, the population density in the core districts for all four
cities reached same level – 8,000 to 10,000 persons per square kilometers built-up land –
by the end of 2009, which may indicate the bottleneck of population density in the
developed urban area under current city building in China.
The findings of the final hypothesis show that the growth rate of urban expansion and
population is different across cities over period. In Chengdu, Xi’an and Kunming, urban
expansion is faster than population growth, while in Urumqi, it is the reverse way. Also,
it is noticeable that the core districts have been experiencing both population growth and
urban expansion, and eventually their population density reaches a similar level. In
contrast, the counties around the core districts, where the population density was high in
the rural area, have also experienced both population growth and urban expansion. But
the population density has been declining.

65
6. Discussion
6.1 Trends in urban expansion of cities in Western China
I have given a detailed account of trends in urban expansion in Western China. Here I
recapitulate a number of these trends so as to raise certain socio-economic issues. In the
following section (6.2), I will broach the topic of explanations: What caused the
expansion? How important was central planning at state, provincial, and local levels as
distinct from market forces – the role of the invisible hand? Seeking causes requires one
to look backward. One can also look forward, that is to say, ask how urban expansion is
affecting non-urban land use, especially agriculture, what are its current and future
impact on soil degradation and air pollution, and what are the social consequences – for
example, the gap between rich and poor? Naturally I cannot even begin to do justice to
these important questions. I wish only to say two things: first, I am aware of them and
wish to explore them in the future; second, I believe that such exploration requires
detailed spatio-temporal mapping and analysis of what actually happened on the ground
in Western China. My contribution lies primarily in this necessary, preliminary step.
The rapid expansion of Western cities is in different waves. None experienced rapid
growth right after the land reform in the late 1980s when coastal cities took off. The
pattern of expansion is not simply one of sprawling from the core city. Satellite cities
emerged, with urban types of land use surrounding them. One may characterize this
expansion as from monocentric to multi-nucleated. Multi-nucleated pattern has a

66
dominating center surrounded by smaller cities. It is not to be confused, therefore, with
polycentric pattern in which the multiple centers are approximately of the same size. In
the multi-nucleated pattern, the core city, which is usually the historical center, does not
suffer from having satellites. On the contrary, it remains strong and even becomes
stronger with growing residents, jobs, and services. It is in services – health, business,
and social – that the smaller satellite cities cannot compete. In the development of the
multi-nucleated pattern, governmental planning has clearly played a role in acquiring
land, reallocating rural residents, and laying out essential infrastructure. Government
may begin by establishing development zones. In just a few years, these can turn into
satellite cities, gobbling up land once used for agriculture and non-urban purposes.
Obviously, other forces – social, cultural, and economic – must also be at work. So far,
little is known about them – little that is precise and quantitative. But perhaps the social
and, particularly, the cultural forces need a different approach, one that is more like a
narrative than a statistical algorithm.
6.2 Possible explanations of urban expansion and limitation of quantitative urban
methods
What drives urban expansion? One drive is the increasing demand for
urban/nonagricultural services. Satellite cities did not grow with villages, but from
preexisting county seats or government planned, development zones. Similarly, corridors
did not grow out of pre-existing roads, but were connections required by core and

67
satellite cities. The craving for housing seems to drive people to move from core city to
spacious apartment complexes along these corridors. The newly built structures take up
land that was once occupied by villages and workers’ condos, resulting in a mixed
landscape of modern housing and slums. Who live in the new complexes along the
corridors? Government officials, entrepreneurs, and well-paid professionals. Who live in
the collectively owned condos? Floating workers and the urban poor. Who live in the
villages that remain and need upkeeping? Elderly peasants who lack the initiative and
resource to move into the city and other underprivileged groups.
Government planned development zones can turn into satellite cities, as we have seen.
The speed of the transformation seems to depend on the type of industry. Thus high-tech
zones give rise to cities rapidly because they promote growth in secondary and tertiary
economies. Zones devoted to the more traditional industries, by contrast, promote mixed
city growth, successful in some areas, not successful in others. Urumqi, however, is an
exception. It has an energy industrial zone, and energy is not high technology.
Nonetheless the industrial zone, supported to an unusual degree by such services as
management and finance, is promoting the growth of new towns and the new towns
themselves are plentifully supplied with restaurants, house care, schools, and hospitals, to
minimize the need to commute.
Even though the planning policies have an effect on urban form, it is not easy to separate
the roles that different levels of government have from decision making to
implementation. One problem is that cities and corridors have stretched beyond the
jurisdiction of any district and county, sometimes even the jurisdiction of the

68
municipality, as is the case with Xi’an. It also happens that sometimes a project requires
the participation of all levels of government. A case in point is urban expansion
following major road construction. Remotely sensed images have captured major roads
constructed in various periods in all four cities, roads that extend beyond the city’s limit.
These are phenomenally wide and long; they are super highways built at the state level of
government. Along their side and the side of the development zones are large street
blocks and other types of built-up areas. These require input from the lower levels of
government – provincial, municipal, and county. Success is clearly a challenge, for it
requires all levels of government to make and carry out the urban plans seamlessly.
6.3 Implications: what I learned from urban expansion in Western China
Unlike other developing countries where urban expansion occurs near a few major cities,
the expansion in western China, the interior hinterland, is expansive and occurring in
many small cities outside large metro areas. This is similar to the coastal cities. This
finding has posed an interesting question: Whether the urban development in western
China would follow the same development path as coastal cities in terms of spatial forms?
The rapid urban expansion is concurrent with Chinese economic restructuring,
unbalancing geographic development, and decentralizing political system. As the share
of agricultural production diminishes, manufacturing and services are increasing in
demand. The port cities on the coast began taking off due to the proximity to the global
market. While the state government decentralized its fiscal and administrative power to

69
municipal governments, the municipal governments capitalized its power on establishing
land market on one side, on the other side simply pursued economic growth by promoting
real estate development, to gain advantages in political rewarding system. The strategies
involved adaptive urban planning to the market economy, deficit-financing infrastructure
construction, and large scale privatization. It also helps spatial differentiation in terms of
sectoral restructuring and income segregation (Leaf, 1995; Yeh, 1995; Zhang et al., 2003).
Urban planning has been adaptive to the dynamics of spatial forms, shaping the corridors
and satellite cities associated with certain land uses. The multiple satellite cities planned
seem working well; not only they are expanding, but also the corridors connecting them
are filling with new residents especially from the end near the core city. Manufacturing
is booming. Spatial differentiation continues, in terms of not only land use types, but also
housing.
After the liberalization reforms, Chinese economy developed fast by marketization,
privatization, and integrating international trades, and initialize the transformation from
totalitarian and egalitarian poor society to early stage of capitalism – state capitalism
(Panell, 2002; Harvey, 2005; Hsing, 2007; Huang, 2008; Naughton, 2011). Under the
political economic circumstance, the municipal governments in this study established
growth-led policies and urban master plans in order to mimic the economic success in
coastal regions. Not just setting the path for economic growth, government actually
worked closely with developers, entrepreneurs, and foreign investors to ensure the
development happening over space and time. Setting up development zones could attract
investments and create jobs, so does promoting real estate development, as results show

70
that master plan successfully promote urban growth near satellite cities and along radial
corridors. The massive development further away from city center and the monumental
development observed in later periods were appropriations to western urban form, where
the commuting mode is mostly individual vehicle and the large green space could attract
new offices and residents.
However, this means of production raises challenges in two ways. First, the development
largely relies on a controversial regulation over individual mobility – the hukou system.
Instead of reallocating labors to coastal regions to increase the efficiency, it allocates
capital inland, which inevitably increase the transportation cost and decrease the
competitiveness. With technical advances and increasing competitiveness, the Fordism
in the interior area will break down first in crisis. Second, the urban expansion has
almost reproduced the hierarchy of Chinese political system – large development near the
core city, and satellite cities, and even rural areas. However, without equivalent
amenities and public goods, creative services, the benefits from economic growth in
remote areas, including satellite cities far away from the core city and rural areas, are
limited. As the capital further accumulated, it would be spatially skewing towards large
cities, where resources like education, medical care, and public recreation are
concentrated. This restructuring would further encourage the geographical rural-urban
migration, therefore, leave the settlements in rural area and satellite cities abandoned.

71
6.4 Limitations and uncertainty in the various data sources
The main purpose of this study is to find the appropriate and manageable level of
resolution – the appropriate scale and detail – of the facts, to understand the rapid
expansion of built-up land in Western China. A few limitations and uncertainties that
relate to my findings are aware of. First, it is impossible to capture the constructions at
one pixel level (that is 900 square meters). And developments smaller than 2 to 3 pixels
(less than 1,800 or 2,700 square meters) are highly possible to be missed. However, self-
constructed houses in rural China could fall into this category, especially in mountainous
areas. That means rural development in Kunming and Chengdu could be slightly
underestimated in the results. Also, small linear features, such as mud road connecting
villages, are sometimes missed.
Even though I cautiously examined the socioeconomic data and matched to the land
cover changes, a certain level of uncertainties remains that are elusive to assess. The
jurisdiction boundaries of districts and counties have been changing quite often at fine
level. These sub-county level changes of boundaries can shift the results but are not
reflected in my results. The survey approach used (census sampling size, statistical
approach, etc.) and the data published in yearbooks (published variables at county level)
vary slightly by each municipality. In addition, after the rigid hukou system was lifted in
early 1990s, a fraction of floating population in urban spaces and private sectors were
missing in yearbooks around 2000. Considering the uncertainty is systematically biased

72
toward underestimation like the built-up land, the ratio of population to the built-up land
in examining the last hypothesis is less biased than expected.
The urban expansion is a three dimensional process. Constrained with the limited land in
historical urban center, a handful of urban renewal projects replaced Soviet style, and six
to eight story building with high-rise buildings or even skyscrapers with elevators. The
population density, therefore, was further concentrated. However, because remote
sensing mapping does not capture change in height of buildings, this trend of change is
missing in this work. Also, urban expansion in China can be overly rapid, thus it requires
more frequent satellite observations to fully capture the temporal variations.
6.5 Future work
A few unresolved questions need further researches. First, based on the findings, why are
there differences in the form of urban expansion? Why do these cities in Western China
take different form of satellite cities, as well as corridors? Because pattern links to
process, in this study, I have been trying to connect the morphological change to the
change of land use, economic restructuring, social restructuring. However, further data is
required and it needs modeling to connect the dots. The urban planning policies strongly
intervene the urban growth but more work needs to be done to study the effect of these
policies. Policies from state and municipal level of government were clear having huge
impacts on urban growth, while role of provincial and county level government remains

73
unknown in this process. Liberalization reform in late 1970s and early 1980s unleashed
population migration and initialed land/housing market to some extent, as well as
leveraged FDI and domestic investment to stimulate the expansion (e.g. development
zones and large infrastructure projects). The effect of policy on the expansion is not
always clear. For example, it is unclear to tell how the land use plan and master plan in
each city impact on expansion. And it is hard to tease apart impacts of municipal
development zones from provincial or state zones. Another example is that “Great West
Development” had a share of budget on building highways and railways. They were also
encouraged by municipal and provincial policies. And it is difficult to distinguish the
impact from each policy. The dramatic expansion accompanied with a great deal of land
acquisitions. It is still unclear that how the public and private sectors in urban and rural
area coup with the acquisition, especially in the process of emerging land use right and
land market.
In addition to understanding different reasons behind the expansion across cities, the
different pattern of two specific expansions also needs further investigation. On the one
hand, there was no decay in these Chinese cities, in contrast with the history of decay,
followed by gentrification and rejuvenation, in many American cities. On the other hand,
the expansion along a corridor invites businesses around it, increasing neighborhood
population, so the population density should accordingly increase. Yet the population of
the countryside – the neighborhood – actually decreases. Why are these Chinese cities
exceptions in these two aspects? The answer may lie in the rural transformation unique
to densely settled Asian countries, but requires further analyses.

74
Furthermore, the impact and future scenarios of urban expansion in China are significant
and worth studying. It is clear to show transportation network has been changed in
response to the expansion. It would be interesting to show how the commuting means,
land use, and urban society are shifting due to this change. It is also interesting to
incorporate globalization to the state, regional and local development and build up
possible scenarios. Also, the urban climate, biodiversity, and carbon cycles were
changed accordingly, and require more efforts to understand these impacts.
7. Conclusions
Understanding the spatial and temporal patterns of urban expansion provides valuable
information for exploring the possible reasons behind the process, as well as estimating
its impact on the environment, economy, and society. Remotely sensed imagery opens
the opportunity to map the expansion for a large area for the past three decades, which
could not possibly be surveyed by human power. The results from the satellite based
maps provide a powerful tool for illustrating the spatial expansion of built-up areas across
decades.
The findings in this study show that urban expansion in Western China has occurred at an
unprecedented rate for the past three decades. Even it is slightly slower than that in
coastal regions, the rapid process of urban expansion associated with arable land loss is
not negligible. The expansion exhibits a multi-nucleated form, along with several
planned corridors. Unlike the urban sprawl of the United States and European countries,

75
the expansion still take forms in high-rise apartment buildings, factories, and office
buildings as relatively high population density suggests. However, the newly constructed
urban spaces all exhibit a monumental form of development, relating to wide boulevards,
large urban blocks, and other planned megaprojects.
Across provinces, the urban development occurred in waves. The cities with larger
population base and higher GDP at the initial stage took off to expand earlier. Physical
geography like the geomorphology and climate constrains the spatial expansion of cities
to some extent. However, in terms of rates and spatial forms, urban expansion in
Western China does not seem different than that in coastal regions.
8. Bibliography
Adams, J. S. (2008). Monumentality in urban design: the case of Russia. Eurasian Geography and Economics, 49(3), 280-303.
Alberti, M. (2005). The Effects of urban patterns on ecosystem function. International Regional Science Review, 28(2), 168-192.
Alonso, W. (1964). Location and land use. Toward a general theory of land rent. Cambridge, MA, USA: Harvard University Press
Angel, S., Sheppard, S. C., Civco, D. L., Buckley, R., Chabaeva, A., Gitlin, L.,Kraley A.,Parent J. & Perlin, M. (2005). The dynamics of global urban expansion. Transport and Urban Development Department, The World Bank, 1(2), 3.
Antrop, M. (2004). Landscape change and the urbanization process in Europe. Landscape and urban planning, 67(1), 9-26.
Batty, M. (1991). Cities as fractals: simulating growth and form. In Fractals and Chaos (pp. 43-69). Eds A J Crilly, R A Earnshaw, H Jones, New York: Springer.
Blumenfeld, H. (1954). The tidal wave of metropolitan expansion. Journal of the American Planning Association, 20(1), 3-14.
Ben-Joseph, E. (2009). Commentary: designing codes: trends in cities, planning and development. Urban studies, 46(12), 2691-2702.
Benguigui, L., Czamanski, D., Marinov, M., & Portugali, Y. (2000). When and where is a city fractal?. Environment and Planning B, 27(4), 507-520.
Bertaud, A. (2004). The spatial organization of cities: deliberate outcome or unforeseen consequence? The center for land economic research. University of Wisconsin
Bockstael, N. E. (1996). Modeling economics and the ecology : the importance of spatial perspective. American Journal of Agricultural Economics, 78(5), 1168-1180.

76
Bosker, B. (2013). Original copies: architectural mimicry in contemporary China. University of Hawai'i Press, Honululu, USA
Botequilha Leitão, A., & Ahern, J. (2002). Applying landscape ecological concepts and metrics in sustainable landscape planning. Landscape and urban planning, 59(2), 65-93.
Brenner N. (2004). New state spaces: urban governance and the rescaling of statehood. London and New York: Oxford University Press
Burgess, E. W. (1927). The determination of gradients in the growth of the city. Publications of the American Sociological Society, 21(1927), 178.
Cai, M. (2011). Local determinants of economic structure: evidence from land quota allocation in China. available at: http://extranet.isnie.org/uploads/isnie2012/cai.pdf
Cain, D. H., Riitters, K., & Orvis, K. (1997). A multi-scale analysis of landscape statistics. Landscape Ecology, 12(4), 199-212.
Carrion-Flores, C., & Irwin, E. G. (2004). Determinants of Residential Land-use Conversion and Sprawl at the Rural-urban Fringe. Agricultural Economics, 86(4), 889-904.
Chadee, D. D., Qiu, F., & Rose, E. L. (2003). FDI location at the subnational level: a study of EJVs in China. Journal of Business Research, 56(10), 835-845.
Chan, K. W., & Zhang, L. (1999). The hukou system and rural-urban migration in China: Processes and changes. China Quarterly, 818-855.
Chan, K. (2007). Misconceptions and complexities in the study of China’s cities: Definitions, statistics, and implications. Eurasian Geography and Economics, 48(4), 383-412. doi:10.2747/1538-7216.48.4.383
Chengdu Planning and Management Bureau, 2011, http://www.cdgh.gov.cn/structure/lm_gardencity/gardencity_ghgy
Chengdu economic and social development of the twelfth five years of planning guidelines, http://www.chengdu.gov.cn/special/template/detail.jsp?id=419759&ClassID=02124501
Chengdu municipal government, 2011, http://www.chengdu.gov.cn/cd_know/detail.jsp?id=273934 Chengdu municipal government, 2011,
http://www.chengdu.gov.cn/special/template/detail.jsp?id=278313&ClassID=02122831 Cushman, S., Mcgarigal, K., & Neel, M. (2008). Parsimony in landscape metrics: Strength, universality,
and consistency. Ecological Indicators, 8(5), 691-703. Dai, F. C., Lee, C. F., & Zhang, X. H. (2001). GIS-based geo-environmental evaluation for urban land-use
planning: a case study. Engineering geology, 61(4), 257-271. Démurger, S., Sachs, J. D., Woo, W. T., Bao, S., Chang, G., & Mellinger, A. (2002). Geography, economic
policy, and regional development in China. Asian Economic Papers, 1(1), 146-197. Deng, J. S., Wang, K., Hong, Y., & Qi, J. G. (2009). Spatio-temporal dynamics and evolution of land use
change and landscape pattern in response to rapid urbanization. Landscape and Urban Planning, 92(3-4), 187-198.
Deng, X., Huang, J., Rozelle, S., & Uchida, E. (2009). Economic growth and the expansion of urban land in China. Urban Studies, 47(4), 813-843.
Dietzel, C., Herold, M., Hemphill, J., & Clarke, K. (2005). Spatio-temporal dynamics in California’s Central Valley: Empirical links to urban theory. International Journal of Geographical Information Science, 19(2), 175-195.
Ding, C. (2007). Policy and praxis of land acquisition in China. Land Use Policy, 24(1), 1-13. El Araby, M. (2006). Urban growth and environmental degradation: The case of Cairo, Egypt. Cities, 19(6),
389-400. Ellman, T. (1997). Infill: the cure for sprawl?. Arizona issue analysis, 146. The Goldwater Institute,
Phoenix, USA Ewing, R. (1997). Is Los Angeles-style sprawl desirable?. Journal of the American planning association,
63(1), 107-126. Ewing, R., Schmid, T., Killingsworth, R., Zlot, A., & Raudenbush, S. (2003). Relationship between urban
sprawl and physical activity, obesity, and morbidity. American journal of health promotion : AJHP, 18(1), 47-57. Retrieved from http://www.ncbi.nlm.nih.gov/pubmed/13677962
Fan, C. C. (1999). The vertical and horizontal expansions of china’s city system. Urban Geography, 20(6), 493-515.

77
Fan, C. C. (2005). Interprovincial migration, population redistribution, and regional development in China: 1990 and 2000 census comparisons. The Professional Geographer, 57(2), 295-311.
Fan, C. C., & Sun, M. (2008). Regional inequality in China, 1978-2006. Eurasian Geography and Economics, 49(1), 1-18.
Fan, S., & Chan-Kang, C. (2005). Road development, economic growth, and poverty reduction in China (Research Report 138). International Food Policy Research Institute, Washington D.C.
Feng, J., & Chen, Y. (2010). Spatiotemporal evolution of urban form and land-use structure in Hangzhou, China: evidence from fractals. Environment and Planning B: Planning and Design, 37(5), 838-856.
Ford, L. R. (2008). World cities and global change: Observations on monumentality in urban design. Eurasian Geography and Economics, 49(3), 237-262.
Forman, R. T. (1995). Land mosaics: the ecology of landscapes and regions. Cambridge, UK: Cambridge University Press
Gaffney, M. (1969). Land planning aimd the property tax. Journal of the American Institute of Planners, 35(3), 178-183.
Gaubatz, P. (1999). China’s urban transformation: Patterns and processes of morphological change in Beijing, Shanghai and Guangzhou. Urban Studies, 36(9), 1495-1521.
Geoghegan, J., Wainger, L. a., & Bockstael, N. E. (1997). Spatial landscape indices in a hedonic framework: an ecological economics analysis using GIS. Ecological Economics, 23(3), 251-264.
Ginsburg, N. (1990). The urban transition: Reflections on the American and Asian experiences. Hong Kong: Chinese University Press.
Grimm, N. B., Foster, D., Groffman, P., Grove, J. M., Hopkinson, C. S., Nadelhoffer, K. J., Pataki, D. E., et al. (2008). The changing landscape: ecosystem responses to urbanization and pollution across climatic and societal gradients. Frontiers in Ecology and the Environment, 6(5), 264-272.
Grimm, N. B., Morgan Grove, J., Pickett, S. T., & Redman, C. L. (2000). Integrated Approaches to Long-TermStudies of Urban Ecological Systems: Urban ecological systems present multiple challenges to ecologists-pervasive human impact and extreme heterogeneity of cities, and the need to integrate social and ecological approaches, concepts, and theory. BioScience, 50(7), 571-584.
Grossman, G. M., & Krueger, A. B. (1995). Economic growth and the environment. The quarterly journal of economics, 110(2), 353-377.
Gustafson, E. J. (1998). Quantifying landscape spatial pattern: What is the state of the art ? Ecosystems, 1(2), 143-156.
Haase, D., Walz, U., Neubert, M., & Rosenberg, M. (2007). Changes to central European landscapes - analysing historical maps to approach current environmental issues, examples from Saxony, Central Germany. Land Use Policy, 24(1), 248-263.
Haig, R. M., & MacCrea, R. C. (1927). Regional survey of New York and its environs. Regional Plan of New York and its environs.
Han, J., Hayashi, Y., Cao, X., & Imura, H. (2009). Application of an integrated system dynamics and cellular automata model for urban growth assessment: A case study of Shanghai, China. Landscape and Urban Planning, 91(3), 133-141. doi:10.1016/j.landurbplan.2008.12.002
Hargis, C. D., Bissonette, J. A., & David, J. L. (1998). The behavior of landscape metrics commonly used in the study of habitat fragmentation. Landscape Ecol., 13, 167-186.
Harris, C. D., & Ullman, E. L. (1945). The nature of cities. Annals of the American academy of political and social science, 242, 7-17.
Harvey, D. (2005). A brief history of neoliberalism. Oxford University Press, Oxford, UK. Herold, M, Couclelis, H., & Clarke, K. (2005). The role of spatial metrics in the analysis and modeling of
urban land use change. Computers, Environment and Urban Systems, 29(4), 369-399. Herold, Martin, Scepan, J., & Clarke, K. C. (2002). The use of remote sensing and landscape metrics to
describe structures and changes in urban land uses. Environment and Planning A, 34(8), 1443-1458. Hirschman, A., 1958, The strategy of economic development. New Haven, USA: Yale University Press. Ho, P. (2001). Who owns China's land? Policies, property rights and deliberate institutional ambiguity. The
China Quarterly, 166(1), 394-421. Hoffhine Wilson, E., Hurd, J. D., Civco, D. L., Prisloe, M. P., & Arnold, C. (2003). Development of a
geospatial model to quantify, describe and map urban growth. Remote Sensing of Environment, 86(3), 275-285.

78
Hoyt, H. (1939). The structure and growth of residential neighborhoods in American cities. Federal Housing Administration, Washington D.C., USA
Huang, Y. (2008). Capitalism with Chinese characteristics: Entrepreneurship and the state (Vol. 1). Cambridge: Cambridge University Press.
Jacobs, J. (1961). The death and life of great American cities. New York: Vintage books Ji, W., Ma, J., Twibell, R., & Underhill, K. (2006). Characterizing urban sprawl using multi-stage remote
sensing images and landscape metrics. Computers, Environment and Urban Systems, 30(6), 861-879. Kaufmann, R. K., Seto, K. C., Schneider, A., Liu, Z., Zhou, L., & Wang, W. (2007). Climate response to
rapid urban growth: Evidence of a human-induced precipitation deficit. Journal of Climate, 20(10), 2299-2306.
Kaldor, N. (1957). A model of economic growth. The economic journal, 67(268), 591-624. Kelly, E. D. (1984). Piping growth: The law, economics, and equity of sewer and water connection
policies. Land Use Law & Zoning Digest, 36(7), 3-8. Kunming Planning Bureau, 2011, http://www.kmghj.gov.cn/Html/285/2008-8/20088817429-1.Html Kunming municipal government, 2011, http://www.km.gov.cn/structure/xwpdlm/zfwjxx_52168_1.htm Lacayo, R. (2008). The architecture of autocracy. Foreign Policy, 166:52-57. Lai, H. H. (2002). China's western development program: Its rationale, implementation, and
prospects. Modern China, 28(4), 432-466. Leaf, M. (1995). Inner city redevelopment in China: Implications for the city of Beijing. Cities, 12(3), 149-
162. Leutwiler, N. R. (1987). Playing taps for urban growth control: Restricting public utility access to manage
growth. State & Local Government Review, 8-14. Lewis, D. J., & Plantinga, A. J. (2007). Policies for habitat fragmentation : Combining econometrics with
GIS-based landscape simulations. Land Economics, 83(2), 109-127 Li, F., Wang, R., Paulussen, J., & Liu, X. (2005). Comprehensive concept planning of urban greening
based on ecological principles: a case study in Beijing, China. Landscape and Urban Planning, 72(4), 325-336.
Li, H., & Wu, J. (2004). Use and misuse of landscape indices. Landscape Ecology, 19(4), 389-399. Li, X., & Yeh, a. G. O. (1998). Principal component analysis of stacked multi-temporal images for the
monitoring of rapid urban expansion in the Pearl River Delta. International Journal of Remote Sensing, 19(8), 1501-1518.
Liang, Z., & Ma, Z. (2004). China’s floating population: New evidence from the 2000 Census. Population and Development Review, 30(3), 467-488.
Lin, G. C. S. (1999). State policy and spatial restructuring in post-reform China, 1978-95. International Journal of Urban and Regional Research, 23(4), 670-696.
Lin, G. C. S. (2001). Metropolitan development in a transitional socialist economy: Spatial restructuring in the Pearl River Delta, China. Urban Studies, 38(3), 383-406.
Lin, G. C. S. (2002). The growth and structural change of Chinese cities: a contextual and geographic analysis. Cities, 19(5), 299-316.
Lin, G. C., & Ho, S. P. (2005). The state, land system, and land development processes in contemporary China. Annals of the Association of American Geographers, 95(2), 411-436.
Liu, J., Liu, M., Tian, H., Zhuang, D., Zhang, Z., Zhang, W., Tang, X., et al. (2005). Spatial and temporal patterns of China’s cropland during 1990–2000: An analysis based on Landsat TM data. Remote Sensing of Environment, 98(4), 442-456.
Liu, X., Li, X., Chen, Y., Tan, Z., Li, S., & Ai, B. (2010). A new landscape index for quantifying urban expansion using multi-temporal remotely sensed data. Landscape Ecology, 25(5), 671-682.
Long, H., Wu, X., Wang, W., & Dong, G. (2008). Analysis of urban-rural land-use change during 1995-2006 and its policy dimensional driving forces in Chongqing, China. Sensors, 8(2), 681-699.
Long, H., Liu, Y., Wu, X., & Dong, G. (2009). Spatio-temporal dynamic patterns of farmland and rural settlements in Su–Xi–Chang region: Implications for building a new countryside in coastal China. Land Use Policy, 26(2), 322-333.
Luck, M., & Wu, J. (2002). A gradient analysis of urban landscape pattern : a case study from the Phoenix metropolitan region , Arizona, USA. Landscape Ecology, (1925), 327-339.

79
Ma, L. (2004). Economic reforms, urban spatial restructuring, and planning in China. Progress in Planning, 61(3), 237-260.
Ma, L. J. C. (2002). Urban transformation in China, 1949 - 2000: a review and research agenda. Environment and Planning A, 34(9), 1545-1569.
McGarigal, K., & Marks, B. J. (1995). Spatial pattern analysis program for quantifying landscape structure. Gen. Tech. Rep. PNW-GTR-351. US Department of Agriculture, Forest Service, Pacific Northwest Research Station.
McGarigal, K., Cushman, S.A., Neel, M.C., Ene, E., 2002. FRAGSTATS: Spatial Pattern Analysis Program for Categorical Maps. Computer software program produced by the authors at the University of Massachusetts, Amherst, available at: http://www.umass.edu/landeco/research/fragstats/fragstats.html
McGarigal, K., Tagil, S., & Cushman, S. A. (2009). Surface metrics: an alternative to patch metrics for the quantification of landscape structure. Landscape Ecology, 24(3), 433-450.
McGee, T. G. (1989). Urbanisasi or kotadesasi? Evolving patterns of urbanization in Asia. Urbanization in Asia: Spatial dimensions and policy issues, 108. Honolulu, HI: University of Hawaii Press.
Mills, E. S. (1967). An aggregative model of resource allocation in a metropolitan area. The American Economic Review, 57(2), 197-210.
Muth, R. F. (1961). Economic change and rural-urban land conversions. Econometrica: Journal of The Econometric Society, 1-23.
Muth, R. F. (1969). Cities and housing: The spatial pattern of urban residential land use. Chicago, IL: University of Chicago Press.
Myrdal, G. (1957). Economic theory and underdeveloped regions. London: Buckworth National Bureau of Statistics of China, Chinese Statistical Database, 2011, available at:
http://www.stats.gov.cn Naughton, B. (2011). China's economic policy today: The new state activism. Eurasian Geography and
Economics, 52(3), 313-329. Ni, Q. (2005). China's economic reform and income distribution-in the view of cross-sectors labor
flow. The Theory and Practice of Finance and Economics, 5, 022. North, D. C. (1955). Location theory and regional economic growth. The Journal of Political
Economy, 63(3), 243-258. O’Neill, R. V., Krummel, J. R., Gardner, R. H., Sugihara, G., Jackson, B., Deangelis, D. L., et al. (1988).
Indices of landscape pattern. Landscape Ecology, 1, 153–162. Pannell, C. W. (2002). China’s continuing urban transition. Environment and Planning A, 34(9), 1571-1589. Park, R. B., & Burguess, E. E. and McKenzie, R. (1925). The City. University of Chicago Press, Chicago,
Illinois, USA Pham, H. M., Yamaguchi, Y., & Bui, T. Q. (2011). A case study on the relation between city planning and
urban growth using remote sensing and spatial metrics. Landscape and Urban Planning, 100(3), 223-230. Elsevier B.V.
Perroux, F. (1950). Economic space: theory and applications. The Quarterly Journal of Economics, 64(1), 89-104.
Quinlan, J. R. (1993). C4. 5: programs for machine learning (Vol. 1). New York: Morgan Kaufmann Publishers
Remmel, T. K., & Csillag, F. (2003). When are two landscape pattern indices significantly different? Journal of Geographical Systems, 5(4), 331-351.
Schneider, a., & Woodcock, C. E. (2008). Compact, dispersed, fragmented, extensive? A comparison of urban growth in twenty-five global cities using remotely sensed data, pattern metrics and census information. Urban Studies, 45(3), 659-692.
Schneider, A. (2012). Monitoring land cover change in urban and peri-urban areas using dense time stacks of Landsat satellite data and a data mining approach. Remote Sensing of Environment, 124, 689-704.
Schneider, A., Seto, K. C., & Webster, D. R. (2005). Urban growth in Chengdu, Western China: application of remote sensing to assess planning and policy outcomes. Environment and Planning B: Planning and Design, 32(3), 323-345.
Seto, K. C., & Kaufmann, R. K. (2003). Modeling the drivers of urban land use change in the Pearl River Delta, China: integrating remote sensing with socioeconomic data. Land Economics, 79(1), 106-121.

80
Seto, K. C., & Fragkias, M. (2005). Quantifying Spatiotemporal Patterns of Urban Land-use Change in Four Cities of China with Time Series Landscape Metrics. Landscape Ecology, 20(7), 871-888.
Seto, K. C., Fragkias, M., Guneralp, B., & Reilly, M. K. (2011). A meta-analysis of global urban land expansion. PLoS ONE, 6(8).
Shao, M., Tang, X., Zhang, Y., & Li, W. (2006). City clusters in China : air and surface water pollution. Frontiers in Ecology and the Environment, 4(7), 353-361.
Shepherd, J. M. (2005). A review of current investigations of urban-induced rainfall and recommendations for the future. Earth Interactions, 9(12), 1-27.
Small, C., & Lu, J. W. T. (2006). Estimation and vicarious validation of urban vegetation abundance by spectral mixture analysis. Remote Sensing of Environment, 100(4), 441-456.
Smith, C. J. (2008). Monumentality in urban design: The case of China. Eurasian Geography and Economics, 49(3), 263-279.
Southworth, M. (1997). Walkable suburbs?: An evaluation of neotraditional communities at the urban edge. Journal of the American Planning Association, 63(1), 28-44.
Sun, C., Wu, Z.-feng, Lv, Z.-qiang, Yao, N., & Wei, J.-bing. (2013). Quantifying different types of urban growth and the change dynamic in Guangzhou using multi-temporal remote sensing data. International Journal of Applied Earth Observation and Geoinformation, 21, 409-417.
TAN, M., LI, X., XIE, H., & LU, C. (2005). Urban land expansion and arable land loss in China—a case study of Beijing–Tianjin–Hebei region. Land Use Policy, 22(3), 187-196.
Tan, M., Li, X., Lu, C., Luo, W., Kong, X., & Ma, S. (2008). Urban population densities and their policy implications in China. Habitat International, 32(4), 471-484.
Thompson, W. R. (1965). A preface to urban economics (Vol. 43). Washington, DC: Resources for the Future.
Trumbull, N. (2010). Challenges to Western participation in shaping the urban landscape of post-socialist St. Petersburg: The failure of international competitions for iconic architectural projects. Eurasian Geography and Economics, 51(6), 788-802.
Vermeer, E. B. (2004). Shaanxi: Building a Future on State Support. The China Quarterly, 178(2), 400-425. Von Thünen, J. H. (1875). Der isolirte staat in beziehung auf landwirthschaft und nationalökonomie (Vol.
1). Wiegandt, Hempel & Parey. Wang, F., & Meng, Y. (1999). Analyzing urban population change patterns in Shenyang, China 1982 – 90:
Density function and spatial association approaches. Annals of GIS, 5(2), 121-130. Wang, K., Gao, X., & Chen, T. (2008). Influencing factors for formation of urban and rural spatial structure
in metropolis fringe area—Taking shuangliu county of Chengdu in China as a case. Chinese Geographical Science, 18(3), 224-234.
Wang, M. Y. (2002). Small City , Big Solution ? Disp, 151, 23-29. Webster, D. (2002). On the edge: Shaping the future of peri-urban East Asia. Asia/Pacific Research Center.
discussion paper. The urban dynamics of East Asia series. Stanford University, Stanford, California: Asia Pacific Research Center Publication
Wei, Y., & Zhao, M. (2009). Urban spill over vs. local urban sprawl: Entangling land-use regulations in the urban growth of China’s megacities. Land Use Policy, 26(4), 1031-1045.
Weng, Q. (2001). A remote sensing?GIS evaluation of urban expansion and its impact on surface temperature in the Zhujiang Delta, China. International Journal of Remote Sensing, 22(10), 1999-2014.
Wu, F. (1998). Polycentric urban development and land-use change in a transitional economy : the case of Guangzhou. Environment and Planning A, 30(1989), 1077-1100.
Wu, Fulong. (2002). Sociospatial differentiation in urban China: evidence from Shanghai’s real estate markets. Environment and Planning A, 34(9), 1591-1615.
Wu, Fulong, & Yeh, A. G.-O. (1997). Changing spatial distribution and determinants of land development in Chinese cities in the transition from a centrally planned economy to a socialist market economy: A case study of Guangzhou. Urban Studies, 34(11), 1851-1879.
Wu, J. (2004). Effects of changing scale on landscape pattern analysis: scaling relations. Landscape Ecology, 19, 125-138.

81
Wu, Jianguo, Jenerette, G. D., Buyantuyev, A., & Redman, C. L. (2011). Quantifying spatiotemporal patterns of urbanization: The case of the two fastest growing metropolitan regions in the United States. Ecological Complexity, 8(1), 1-8.
Xi’an City Planning Bureau, 2011, available at: http://www.xaghj.gov.cn/content.jsp?urltype=news.NewsContentUrl&wbtreeid=1038&wbnewsid=2008
Xi’an municipal government, 2011, available at: http://www.xa.gov.cn/zwgk/content/content_zwzy1402525_1.htm
Xie, Y., Fang, C., Lin, G. C. S., Gong, H., & Qiao, B. (2007). Tempo-spatial patterns of land use changes and urban development in globalizing China: A study of Beijing. Sensors, 7, 2881-2906.
Xu, C., Liu, M., Zhang, C., An, S., Yu, W., & Chen, J. M. (2007). The spatiotemporal dynamics of rapid urban growth in the Nanjing metropolitan region of China. Landscape Ecology, 22(6), 925-937.
Yeh, A. G. O., Xu, X., & Hu, H. (1995). The social space of Guangzhou city, China. Urban Geography, 16(7), 595-621.
Yeh, A.G. and X. Xu (1996) Globalization and the urban system in China. In F.C. Lo and Y.M. Yeung (eds.), Emerging world cities in Pacific Asia, United Nations University Press, Tokyo.
Yeh, A. G.-O., & Li, X. (2001). A constrained CA model for the simulation and planning of sustainable urban forms by using GIS. Environment and Planning B: Planning and Design, 28(5), 733-753.
Yew, C. P. (2012). Pseudo-Urbanization ? Competitive government behavior and urban sprawl in China. Journal of Contemporary China, 21(74), 281-298.
Yu, X., & Ng, C. (2007). Spatial and temporal dynamics of urban sprawl along two urban–rural transects: A case study of Guangzhou, China. Landscape and Urban Planning, 79(1), 96-109.
Yue, W., Liu, Y., & Fan, P. (2010). Polycentric urban development: the case of Hangzhou. Environment and Planning A, 42(3), 563-577.
Zhang, L. S. X. B., Zhao, S. X., & Tian, J. P. (2003). Self‐help in housing and chengzhongcun in China's urbanization. International Journal of Urban and Regional Research, 27(4), 912-937.
Zhang, T. (2000). Land market forces and government's role in sprawl: The case of China. Cities, 17(2), 123-135.
Zhou, L., Dickinson, R. E., Tian, Y., Fang, J., Li, Q., Kaufmann, R. K., Tucker, C. J., et al. (2004). Evidence for a significant urbanization effect on climate in China. Proceedings of the National Academy of Sciences of the United States of America, 101(26), 9540-4.
Zhou, Y., & Ma, L. (2005). China’s urban population statistics: A critical evaluation. Eurasian Geography and Economics, 46(4), 272-289.
Appendix 1. Literatures in applying landscape metrics in urban studies
Aguilera, F., Valenzuela, L. M., & Botequilha-Leitão, A. (2010). Landscape metrics in the analysis of urban land use patterns: A case study in a Spanish metropolitan area. Landscape and Urban Planning, 99(3-4), 226-238. Elsevier B.V. doi: 10.1016/j.landurbplan.2010.10.004.
Andersson, E., Ahrné, K., Pyykönen, M., & Elmqvist, T. (2009). Patterns and scale relations among urbanization measures in Stockholm, Sweden. Landscape Ecology, 24(10), 1331-1339. doi: 10.1007/s10980-009-9385-1.
Araya, Y. H., & Cabral, P. (2010). Analysis and Modeling of Urban Land Cover Change in Setúbal and Sesimbra, Portugal. Remote Sensing, 2(6), 1549-1563. doi: 10.3390/rs2061549.
Bar, A., & Volker, M. (2010). Two multi-scale contextual approaches for mapping spatial pattern. Landscape Ecology, 711-725. doi:10.1007/s10980-010-9452-7
Bhatta, B., Saraswati, S., & Bandyopadhyay, D. (2010). Urban sprawl measurement from remote sensing data. Applied Geography, 30(4), 731-740. Elsevier Ltd. doi:10.1016/j.apgeog.2010.02.002
Boentje, J., & Blinnikov, M. (2007). Post-Soviet forest fragmentation and loss in the Green Belt around Moscow, Russia (1991–2001): a remote sensing perspective. Landscape and Urban Planning, 82(4), 208-221. doi: 10.1016/j.landurbplan.2007.02.009.
Botequilha Leitao, A., Ahern, J. (2002). Applying landscape ecological concepts and metrics in sustainable landscape planning. Landscape and Urban Planning, 59(2), 65-93. doi: 10.1016/S0169-2046(02)00005-1.

82
Buyantuyev, A., Wu, Jianguo, & Gries, C. (2010). Multiscale analysis of the urbanization pattern of the Phoenix metropolitan landscape of USA: Time, space and thematic resolution. Landscape and Urban Planning, 94(3-4), 206-217. doi: 10.1016/j.landurbplan.2009.10.005.
Chang, H., Li, F., Li, Z., Wang, R., & Wang, Y. (2011). Urban landscape pattern design from the viewpoint of networks: A case study of Changzhou city in Southeast China. Ecological Complexity, 8(1), 51-59. Elsevier B.V. doi:10.1016/j.ecocom.2010.12.003
Cheng, J. (2003). Urban growth pattern modeling: a case study of Wuhan city, PR China. Landscape and Urban Planning, 62(4), 199-217. doi:10.1016/S0169-2046(02)00150-0
Cifaldi, R. (2004). Spatial patterns in land cover of exurbanizing watersheds in southeastern Michigan. Landscape and Urban Planning, 66(2), 107-123. doi: 10.1016/S0169-2046(03)00098-7.
Clark, J. K., McChesney, R., Munroe, D. K., & Irwin, E. G. (2009). Spatial characteristics of exurban settlement pattern in the United States. Landscape and Urban Planning, 90(3-4), 178-188. doi: 10.1016/j.landurbplan.2008.11.002.
Compas, E. (2007). Measuring exurban change in the American West: A case study in Gallatin County, Montana, 1973–2004. Landscape and Urban Planning, 82(1-2), 56-65. doi: 10.1016/j.landurbplan.2007.01.016.
Crawford, T. W. (2005). Spatial fluctuations as signatures of self-organization: a complex systems approach to landscape dynamics in Rondônia, Brazil. Environment and Planning B: Planning and Design, 32(6), 857-875. doi: 10.1068/b31141.
Croissant, C. (2004). Landscape patterns and parcel boundaries: an analysis of composition and configuration of land use and land cover in south-central Indiana. Agriculture, Ecosystems & Environment, 101(2-3), 219-232. doi: 10.1016/j.agee.2003.09.006.
Darrel Jenerette, G., & Potere, D. (2010). Global analysis and simulation of land-use change associated with urbanization. Landscape Ecology, 25(5), 657-670. doi: 10.1007/s10980-010-9457-2.
Deng, J. S., Qiu, L. F., Wang, K., Yang, H., & Shi, Y. Y. (2011). An integrated analysis of urbanization-triggered cropland loss trajectory and implications for sustainable land management. Cities, 28(2), 127-137. Elsevier Ltd. doi: 10.1016/j.cities.2010.09.005.
Deng, J. S., Wang, K., Hong, Y., & Qi, J. G. (2009). Spatio-temporal dynamics and evolution of land use change and landscape pattern in response to rapid urbanization. Landscape and Urban Planning, 92(3-4), 187-198. doi: 10.1016/j.landurbplan.2009.05.001.
Dietzel, C., Herold, M., Hemphill, J., & Clarke, Keith. (2005). Spatio-temporal dynamics in Californiaʼs Central Valley: Empirical links to urban theory. International Journal of Geographical Information Science, 19(2), 175-195. doi: 10.1080/13658810410001713407.
Du, Z., Shen, Yudan, Wang, Jian, & Cheng, W. (2009). Land-use change and its ecological responses: a pilot study of typical agro-pastoral region in the Heihe River, northwest China. Environmental Geology, 58(7), 1549-1556. doi: 10.1007/s00254-008-1656-7.
Frondoni, R., Mollo, B., & Capotorti, G. (2011). A landscape analysis of land cover change in the Municipality of Rome (Italy): Spatio-temporal characteristics and ecological implications of land cover transitions from 1954 to 2001. Landscape and Urban Planning, 100(1-2), 117-128. Elsevier B.V. doi: 10.1016/j.landurbplan.2010.12.002.
Geertman, S., Hagoort, M., & Ottens, H. (2007). Spatial-temporal specific neighbourhood rules for cellular automata land-use modelling. International Journal of Geographical Information Science, 21(5), 547-568. doi: 10.1080/13658810601064892.
Geoghegan, J., Wainger, L. a, & Bockstael, N. E. (1997). Spatial landscape indices in a hedonic framework: an ecological economics analysis using GIS. Ecological Economics, 23(3), 251-264. doi: 10.1016/S0921-8009(97)00583-1.
Girvetz, E., Thorne, J., Berry, a, & Jaeger, J. (2008). Integration of landscape fragmentation analysis into regional planning: A statewide multi-scale case study from California, USA. Landscape and Urban Planning, 86(3-4), 205-218. doi: 10.1016/j.landurbplan.2008.02.007.
Greenhill, D. R., Ripke, L. T., Hitchman, a P., Jones, G. a, & Wilkinson, G. G. (2003). Characterization of suburban areas for land use planning using landscape ecological indicators derived from Ikonos-2 multispectral imagery. IEEE Transactions on Geoscience and Remote Sensing, 41(9), 2015-2021. doi: 10.1109/TGRS.2003.814629.

83
Hahs, a, & Mcdonnell, M. (2006). Selecting independent measures to quantify Melbourneʼs urban–rural gradient. Landscape and Urban Planning, 78(4), 435-448. doi: 10.1016/j.landurbplan.2005.12.005.
Herold, Martin, Noah C. Goldstein, K. C. C. (2003). The spatiotemporal form of urban growth: measurement, analysis and modeling. Remote Sensing of Environment, 86(3), 286-302. doi: 10.1016/S0034-4257(03)00075-0.
Herold, M., Scepan, J., & Clarke, K. C. (2002). The use of remote sensing and landscape metrics to describe structures and changes in urban land uses. Environment and Planning A, 34(8), 1443-1458. doi: 10.1068/a3496.
Huang, C., Geiger, E. L., & Kupfer, J. a. (2006). Sensitivity of landscape metrics to classification scheme. International Journal of Remote Sensing, 27(14), 2927-2948. doi: 10.1080/01431160600554330.
Huang, J., Lu, X., & Sellers, J. (2007). A global comparative analysis of urban form: Applying spatial metrics and remote sensing. Landscape and Urban Planning, 82(4), 184-197. doi: 10.1016/j.landurbplan.2007.02.010.
Huang, S.-L., Wang, S.-H., & Budd, W. W. (2009). Sprawl in Taipei’s peri-urban zone: Responses to spatial planning and implications for adapting global environmental change. Landscape and Urban Planning, 90(1-2), 20-32. doi: 10.1016/j.landurbplan.2008.10.010.
Hung, W.-C., Chen, Y.-C., & Cheng, K.-S. (2010). Comparing landcover patterns in Tokyo, Kyoto, and Taipei using ALOS multispectral images. Landscape and Urban Planning, 97(2), 132-145. Elsevier B.V. doi: 10.1016/j.landurbplan.2010.05.004.
Irwin, E. G., & Bockstael, N. E. (2007). The evolution of urban sprawl: evidence of spatial heterogeneity and increasing land fragmentation. Proceedings of the National Academy of Sciences of the United States of America, 104(52), 20672-7. doi: 10.1073/pnas.0705527105.
Jaeger, J. a G., Bertiller, R., Schwick, C., Cavens, D., & Kienast, F. (2010). Urban permeation of landscapes and sprawl per capita: New measures of urban sprawl. Ecological Indicators, 10(2), 427-441. doi: 10.1016/j.ecolind.2009.07.010.
Jat, M., Garg, P., & Khare, D. (2008). Monitoring and modelling of urban sprawl using remote sensing and GIS techniques. International Journal of Applied Earth Observation and Geoinformation, 10(1), 26-43. doi: 10.1016/j.jag.2007.04.002.
Jat, M. K., Garg, P. K., & Khare, D. (2008). Modelling of urban growth using spatial analysis techniques: a case study of Ajmer city (India). International Journal of Remote Sensing, 29(2), 543-567. doi: 10.1080/01431160701280983.
Jenerette, G. D., & Wu, Jianguo. (2001). Analysis and simulation of land-use change in the central Arizona – Phoenix region , USA. Landscape Ecology, 16(7): 611-626.
Ji, W., Ma, J., Twibell, R., & Underhill, K. (2006). Characterizing urban sprawl using multi-stage remote sensing images and landscape metrics. Computers, Environment and Urban Systems, 30(6), 861-879. doi: 10.1016/j.compenvurbsys.2005.09.002.
Kong, F., & Nakagoshi, N. (2006). Spatial-temporal gradient analysis of urban green spaces in Jinan, China. Landscape and Urban Planning, 78(3), 147-164. doi: 10.1016/j.landurbplan.2005.07.006.
Li, X, He, H., Wang, X, Bu, R., Hu, Y, & Chang, Y. (2004). Evaluating the effectiveness of neutral landscape models to represent a real landscape. Landscape and Urban Planning, 69(1), 137-148. doi: 10.1016/j.landurbplan.2003.10.037.
Li, Yangfan, Zhu, X., Sun, X., & Wang, F. (2010). Landscape effects of environmental impact on bay-area wetlands under rapid urban expansion and development policy: A case study of Lianyungang, China. Landscape and Urban Planning, 94(3-4), 218-227. doi: 10.1016/j.landurbplan.2009.10.006.
Li, Z., Li, X., Wang, Y., Ma, a, & Wang, J. (2004). Land-use change analysis in Yulin prefecture, northwestern China using remote sensing and GIS. International Journal of Remote Sensing, 25(24), 5691-5703. doi: 10.1080/01431160412331291206.
Lin, Y.P., Chu, H. J., Wu, C.F., & Verburg, P. H. (2011). Predictive ability of logistic regression, auto-logistic regression and neural network models in empirical land-use change modeling – a case study. International Journal of Geographical Information Science,25(1), 65-87.
Liu, H., & Weng, Q. (2009). An examination of the effect of landscape pattern, land surface temperature, and socioeconomic conditions on WNV dissemination in Chicago. Environmental Monitoring and Assessment, 159(1-4), 143-61. doi: 10.1007/s10661-008-0618-6.

84
Liu, X., Li, Xia, Chen, Y., Tan, Z., Li, Shaoying, & Ai, B. (2010). A new landscape index for quantifying urban expansion using multi-temporal remotely sensed data. Landscape Ecology, 25(5), 671-682. doi: 10.1007/s10980-010-9454-5.
Long, H., Liu, Y., Wu, X, & Dong, G. (2009). Spatio-temporal dynamic patterns of farmland and rural settlements in Su–Xi–Chang region: Implications for building a new countryside in coastal China. Land Use Policy, 26(2), 322-333. doi: 10.1016/j.landusepol.2008.04.001.
Luck, M., & Wu, Jianguo. (2002). A gradient analysis of urban landscape pattern : a case study from the Phoenix metropolitan region , Arizona , USA. Landscape Ecology, 17(4), 327-339.
Manson, F., Loneragan, N. R., Phinn, S. R. (2003). Spatial and temporal variation in distribution of mangroves in Moreton Bay, subtropical Australia: a comparison of pattern metrics and change detection analyses based on aerial photographs. Estuarine, Coastal and Shelf Science, 57(4), 653-666. doi: 10.1016/S0272-7714(02)00405-5.
Marcos, S., & Ecology, A. (2005). Investigating landscape pattern and its dynamics in Daqing , China. International Journal of Remote Sensing, 26(11), 2259-2280.
Matsushita, B., Xu, M., & Fukushima, T. (2006). Characterizing the changes in landscape structure in the Lake Kasumigaura Basin, Japan using a high-quality GIS dataset. Landscape and Urban Planning, 78(3), 241-250. doi: 10.1016/j.landurbplan.2005.08.003.
Mitsova, D., Shuster, W., & Wang, Xinhao. (2011). A cellular automata model of land cover change to integrate urban growth with open space conservation. Landscape and Urban Planning, 99(2), 141-153. Elsevier B.V. doi: 10.1016/j.landurbplan.2010.10.001.
Peng, J., Wang, Y., Ye, M., Wu, J., & Zhang, Y. (2007). Effects of land-use categorization on landscape metrics: A case study in urban landscape of Shenzhen, China. International Journal of Remote Sensing, 28(21), 4877-4895. doi: 10.1080/01431160601075590.
Peng, Jian, Wang, Yanglin, Zhang, Yuan, Wu, Jiansheng, Li, W., & Li, You. (2010). Evaluating the effectiveness of landscape metrics in quantifying spatial patterns. Ecological Indicators, 10(2), 217-223. doi: 10.1016/j.ecolind.2009.04.017.
Peng, Jian, Wu, Jiansheng, Yin, H., Li, Zhengguo, Chang, Q., & Mu, T. (2008). Rural Land Use Change during 1986–2002 in Lijiang, China, Based on Remote Sensing and GIS Data. Sensors, 8(12), 8201-8223. doi: 10.3390/s8128201.
Pham, H. M., Yamaguchi, Y., & Bui, T. Q. (2011). A case study on the relation between city planning and urban growth using remote sensing and spatial metrics. Landscape and Urban Planning, 100(3), 223-230. Elsevier B.V. doi: 10.1016/j.landurbplan.2010.12.009.
Pijanowski, B. C., & Pithadia, S. (2005). Calibrating a neural network – based urban change model for two metropolitan areas of the Upper Midwest of the United States. International Journal of Geographical Information Science, 19(2), 37-41.
Proulx, R., & Fahrig, L. (2010). Detecting human-driven deviations from trajectories in landscape composition and configuration. Landscape Ecology, 25(10), 1479-1487. doi: 10.1007/s10980-010-9523-9.
Riitters, K. H., OʼNeill, R. V., Hunsaker, C. T., Wickham, J. D., Yankee, D. H., Timmins, S. P., et al. (1995). A factor analysis of landscape pattern and structure metrics. Landscape Ecology, 10(1), 23-39. doi: 10.1007/BF00158551.
Carrion-Flores, C., & Irwin, E. G. (2004). Determinants of Residential Land-use Conversion and Sprawl at the Rural-urban Fringe. Agricultural Economics, 86(4), 889-904.
Sancar, C., Turan, S. Ö., & Kadioğullari, A. L. (2009). Land use-cover change processes in Urban fringe areas: Trabzon case study, Turkey. Scientific Research and Essay, 4(12), 1454-1462.
Schneider, a, & Woodcock, C. E. (2008). Compact, Dispersed, Fragmented, Extensive? A Comparison of Urban Growth in Twenty-five Global Cities using Remotely Sensed Data, Pattern Metrics and Census Information. Urban Studies, 45(3), 659-692. doi: 10.1177/0042098007087340.
Schneider, A., Seto, K. C., & Webster, D. R. (2005). Urban growth in Chengdu, Western China: application of remote sensing to assess planning and policy outcomes. Environment and Planning B: Planning and Design, 32(3), 323-345.
Seto, K. C., & Fragkias, M. (2005). Quantifying Spatiotemporal Patterns of Urban Land-use Change in Four Cities of China with Time Series Landscape Metrics. Landscape Ecology, 20(7), 871-888. doi: 10.1007/s10980-005-5238-8.

85
Solon, J. (2009). Spatial context of urbanization: Landscape pattern and changes between 1950 and 1990 in the Warsaw metropolitan area, Poland. Landscape and Urban Planning, 93(3-4), 250-261. doi: 10.1016/j.landurbplan.2009.07.012.
Su, S., Jiang, Z., Zhang, Qi, & Zhang, Yuan. (2011). Transformation of agricultural landscapes under rapid urbanization: A threat to sustainability in Hang-Jia-Hu region, China. Applied Geography, 31(2), 439-449. Elsevier Ltd. doi: 10.1016/j.apgeog.2010.10.008.
Su, W., Gu, C., Yang, G., Chen, S., & Zhen, F. (2010). Measuring the impact of urban sprawl on natural landscape pattern of the Western Taihu Lake watershed, China. Landscape and Urban Planning, 95(1-2), 61-67. doi: 10.1016/j.landurbplan.2009.12.003.
Syphard, a, Clarke, K, & Franklin, J. (2005). Using a cellular automaton model to forecast the effects of urban growth on habitat pattern in southern California. Ecological Complexity, 2(2), 185-203. doi: 10.1016/j.ecocom.2004.11.003.
Taubenböck, H., Wegmann, M., Roth, a, Mehl, H., & Dech, S. (2009). Urbanization in India – Spatiotemporal analysis using remote sensing data. Computers, Environment and Urban Systems, 33(3), 179-188. Elsevier Ltd. doi: 10.1016/j.compenvurbsys.2008.09.003.
Thapa, R. B., & Murayama, Y. (2009). Examining Spatiotemporal Urbanization Patterns in Kathmandu Valley, Nepal: Remote Sensing and Spatial Metrics Approaches. Remote Sensing, 1(3), 534-556. doi: 10.3390/rs1030534.
Tian, G, Liu, J, Xie, Y, Yang, Z., Zhuang, D., & Niu, Z. (2005). Analysis of spatio-temporal dynamic pattern and driving forces of urban land in China in 1990s using TM images and GIS. Cities, 22(6), 400-410. doi: 10.1016/j.cities.2005.05.009.
Tian, Guangjin, Ouyang, Y., Quan, Q., & Wu, Jianguo. (2011). Simulating spatiotemporal dynamics of urbanization with multi-agent systems—A case study of the Phoenix metropolitan region, USA. Ecological Modelling, 222(5), 1129-1138. Elsevier B.V. doi: 10.1016/j.ecolmodel.2010.12.018.
Toit, M. J., & Cilliers, S. S. (2010). Aspects influencing the selection of representative urbanization measures to quantify urban–rural gradients. Landscape Ecology, 26(2), 169-181. doi: 10.1007/s10980-010-9560-4.
Turan, S. Ö., & Günlü, A. (2010). Spatial and temporal dynamics of land use pattern response to urbanization in Kastamonu. Journal of Biotechnology, 9(5), 640-647.
Uuemaa, E., Roosaare, J., Oja, T., & Mander, Ü. (2011). Analysing the spatial structure of the Estonian landscapes: which landscape metrics are the most suitable for comparing different landscapes? Estonian Journal of Ecology, 60(1), 70. doi: 10.3176/eco.2011.1.06.
Van Eetvelde, V., & Antrop, M. (2009). Indicators for assessing changing landscape character of cultural landscapes in Flanders (Belgium). Land Use Policy, 26(4), 901-910. doi: 10.1016/j.landusepol.2008.11.001.
Wang, Yang, & Li, Shuangcheng. (2011). Simulating multiple class urban land-use/cover changes by RBFN-based CA model. Computers & Geosciences, 37(2), 111-121. Elsevier. doi: 10.1016/j.cageo.2010.07.006.
Weng, Y. (2007). Spatiotemporal changes of landscape pattern in response to urbanization. Landscape and Urban Planning, 81(4), 341-353. doi: 10.1016/j.landurbplan.2007.01.009.
Wu, Jianguo, Jenerette, G. D., Buyantuyev, A., & Redman, C. L. (2011). Quantifying spatiotemporal patterns of urbanization: The case of the two fastest growing metropolitan regions in the United States. Ecological Complexity, 8(1), 1-8. Elsevier B.V. doi: 10.1016/j.ecocom.2010.03.002.
Wu, J., Shen, W., Sun, W., & Tueller, P. T. (2002). Empirical patterns of the effects of changing scale on landscape metrics. Landscape Ecology, 17, 761-782.
Wu, Q., Hu, D., Wan, R., & Wan, M. (2006). A GIS-based moving window analysis of landscape pattern in the Beijing metropolitan area, China. International Journal of Sustainable Development, 13, 419-434.
Wu, X., Hu, Y., He, H. S., Bu, R., Onsted, J., & Xi, F. (2009). Performance evaluation of the SLEUTH model in the Shenyang metropolitan area of Northeastern China. Environmental modeling & assessment, 14(2), 221-230.
Xie, Yichun, Yu, M., Bai, Y., & Xing, X. (2006). Ecological analysis of an emerging urban landscape pattern—desakota: a case study in Suzhou, China. Landscape Ecology, 21(8), 1297-1309. doi: 10.1007/s10980-006-0024-9.

86
Yeh, C.-T., & Huang, S.-L. (2009). Investigating spatiotemporal patterns of landscape diversity in response to urbanization. Landscape and Urban Planning, 93(3-4), 151-162. doi: 10.1016/j.landurbplan.2009.07.002.
Yu, X., & Ng, C. (2007). Spatial and temporal dynamics of urban sprawl along two urban–rural transects: A case study of Guangzhou, China. Landscape and Urban Planning, 79(1), 96-109. doi: 10.1016/j.landurbplan.2006.03.008.
Zhang, L., & Wang, H. (2006). Planning an ecological network of Xiamen Island (China) using landscape metrics and network analysis. Landscape and Urban Planning, 78(4), 449-456. doi: 10.1016/j.landurbplan.2005.12.004.
Zhang, L., Wu, J, Zhen, Y., & Shu, J. (2004).A GIS-based gradient analysis of urban landscape pattern of Shanghai metropolitan area, China. Landscape and Urban Planning, 69(1), 1-16. doi: 10.1016/j.landurbplan.2003.08.006.
Zhang, Qian, Ban, Y., Liu, Jiyuan, & Hu, Yunfeng. (2011). Simulation and analysis of urban growth scenarios for the Greater Shanghai Area, China. Computers, Environment and Urban Systems, 35(2), 126-139. Elsevier Ltd. doi: 10.1016/j.compenvurbsys.2010.12.002.
Zhao, B., Nakagoshi, N., Chen, J. K., & Kong, L. Y. (2003). The impact of urban planning on land use and land cover in Pudong of Shanghai, China. Journal of Environmental Sciences, 15(2), 205-214.
Zhou, X., & Wang, Y.-C. (2011). Spatial–temporal dynamics of urban green space in response to rapid urbanization and greening policies. Landscape and Urban Planning, 100(3), 268-277. Elsevier B.V. doi: 10.1016/j.landurbplan.2010.12.013.
Zhu, M., Xu, J., Jiang, N., Li, J., & Fan, Y. (2006). Impacts of road corridors on urban landscape pattern: a gradient analysis with changing grain size in Shanghai, China. Landscape Ecology, 21(5), 723-734. doi: 10.1007/s10980-005-5323-z.
Appendix 2. Literatures in using remote sensing on monitoring urban expansion in China
An, K., Zhang, J., & Xiao, Y. (2007). Object-oriented urban dynamic monitoring—a case study of Haidian District of Beijing. Chinese Geographical Science, 17(3): 236-242.
Chang, L.P., Zhang, S.W. (2002). Analysis of the expansion of the built-up area of Dalian city. Chinese Geographical Science, 12(4): 373-377
Chen, J., Gong, P., He, C., Pu, R., & Shi, P. (2003). Land-use/land-cover change detection using improved change-vector analysis. Photogrammetric Engineering and Remote Sensing, 69(4): 369-380.
Chen, S., Zeng, S., & Xie, C. (2000). Remote sensing and GIS for urban growth analysis in China. Photogrammetric Engineering & Remote Sensing, 66(5): 593-598.
Chen, S. S., Chen, L. F., Liu, Q. H., Li, X., & Tan, Q. (2005). Remote sensing and GIS-based integrated analysis of coastal changes and their environmental impacts in Lingding Bay, Pearl River Estuary, South China. Ocean and Coastal Management, 48(1): 65-83.
Chen, S. et al. (1995) Application of aerial remote sensing in the study of vegetation in Guangzhou, China. Journal of Environmental Sciences, 7:107-114
Chen, X. L., Zhao, H. M., Li, P. X., & Yin, Z. Y. (2006). Remote sensing image-based analysis of the relationship between urban heat island and land use/cover changes. Remote Sensing of Environment, 104(2): 133-146.
Dai, E., Wu, S., Shi, W., Cheung, C. K., & Shaker, A. (2005). Modeling change-pattern-value dynamics on land use: An integrated GIS and artificial neural networks approach. Environmental Management, 36(4): 576-591.
Deng, J. S., Wang, K., Deng, Y. H., & Qi, G. J. (2008). PCA-based land�use change detection and analysis using multitemporal and multisensor satellite data. International Journal of Remote Sensing, 29(16): 4823-4838.
Deng, J. S., Wang, K., Hong, Y., & Qi, J. G. (2009). Spatio-temporal dynamics and evolution of land use change and landscape pattern in response to rapid urbanization. Landscape and Urban Planning, 92(3): 187-198.
Deng, J. S., Wang, K., Li, J., & Deng, Y. H. (2009). Urban land use change detection using multisensor satellite images. Pedosphere, 19(1): 96-103.

87
Deng, J.S., Li, J., Wang, K. (2009). Detecting Land Use Change Using PCA-Enhancement and Multi-Source Classifier from SPOT Images. Spectroscopy And Spectral Analysis, 29(6): 1627-1631
Deng, X., Huang, J., Rozelle, S., & Uchida, E. (2008). Growth, population and industrialization, and urban land expansion of China. Journal of Urban Economics, 63(1): 96-115.
Deng, X., Huang, J., Rozelle, S., & Uchida, E. (2010). Economic growth and the expansion of urban land in China. Urban Studies, 47(4): 813-843.
Ding, H., Wang, R. C., Wu, J. P., Zhou, B., Shi, Z., & Ding, L. X. (2007). Quantifying land use change in Zhejiang coastal region, China using multi-temporal Landsat TM/ETM+ images. Pedosphere, 17(6): 712-720.
Ding H, Wang G, Wang R. (2007). Land-use change and cropland loss in the Zhejiang coastal region of China. New Zealand Journal of Agricultural Research, 50(5): 1235-1242.
Dong, J., Zhuang, D., Xu, X., & Ying, L. (2008). Integrated evaluation of urban development suitability based on remote sensing and GIS techniques–a case study in Jingjinji Area, China. Sensors, 8(9): 5975-5986.
Du, Y., Xie, Z., Zeng, Y., Shi, Y., & Wu, J. (2007). Impact of urban expansion on regional temperature change in the Yangtze River Delta. Journal of Geographical Sciences, 17(4): 387-398.
Fan, F., Wang, Y., & Wang, Z. (2008). Temporal and spatial change detecting (1998–2003) and predicting of land use and land cover in Core corridor of Pearl River Delta (China) by using TM and ETM+ images. Environmental Monitoring and Assessment, 137(1-3): 127-147.
Fan, F., Weng, Q., & Wang, Y. (2007). Land use and land cover change in Guangzhou, China, from 1998 to 2003, based on Landsat TM/ETM+ imagery. Sensors, 7(7): 1323-1342.
Gong, J., Liu, Y., & Xia, B. (2009). Spatial heterogeneity of urban land-cover landscape in Guangzhou from 1990 to 2005. Journal of Geographical Sciences, 19(2): 213-224.
Guo, L., Wang, D., Qiu, J., Wang, L., & Liu, Y. (2009). Spatio-temporal patterns of land use change along the Bohai Rim in China during 1985–2005.Journal of Geographical Sciences, 19(5): 568-576.
Han, J., Hayashi, Y., Cao, X., & Imura, H. (2009). Application of an integrated system dynamics and cellular automata model for urban growth assessment: A case study of Shanghai, China. Landscape and Urban Planning, 91(3): 133-141.
Han, J., Hayashi, Y., Cao, X., & Imura, H. (2009). Evaluating land-use change in rapidly urbanizing China: Case study of Shanghai. Journal of Urban Planning and Development, 135(4): 166-171.
Hu, D., Yang, G., Wu, Q., Li, H., Liu, X., Niu, X., Wang, Z. & Wang, Q. (2008). Analyzing land use changes in the metropolitan Jilin City of northeastern China using remote sensing and GIS. Sensors, 8(9): 5449-5465.
Hu, Y.H., Jia, G.S., Guo, H.D. (2009) Linking primary production, climate and land use along an urban-wildland transect: a satellite view. Environmental Research Letters, 4(4): 044009
Huang, J.L., Tu, Z.S., Lin, J. (2009). Land-use dynamics and landscape pattern change in a coastal gulf region, southeast China. International Journal of Sustainable Development and World Ecology, 16(1): 61-66
Jiang, L., Bergen, K. M., Brown, D. G., Zhao, T., Tian, Q., & Qi, S. (2008). Land-cover change and vulnerability to flooding near Poyang Lake, Jiangxi Province, China. Photogrammetric Engineering and Remote Sensing, 74(6): 775.
Li, D., Wang, M., & Hu, F. (2009). Utilizing Chinese high-resolution satellite images for inspection of unauthorized constructions in Beijing. Chinese Science Bulletin, 54(14): 2524-2534.
Li, W., Wang, Y., Peng, J., & Li, G. (2005). Landscape spatial changes associated with rapid urbanization in Shenzhen, China. The International Journal of Sustainable Development and World Ecology, 12(3): 314-325.
Li, X. (2005). A four-component efficiency index for assessing land development using remote sensing and GIS. Photogrammetric Engineering and Remote Sensing, 71(1): 47-57.
Li, X., & Yeh, A. G. O. (1998). Principal component analysis of stacked multi-temporal images for the monitoring of rapid urban expansion in the Pearl River Delta. International Journal of Remote Sensing, 19(8): 1501-1518.
Li, Y., Zhu, X., Sun, X., & Wang, F. (2010). Landscape effects of environmental impact on bay-area wetlands under rapid urban expansion and development policy: a case study of Lianyungang,

88
China. Landscape and Urban Planning, 94(3): 218-227. Liao, M., Jiang, L., Lin, H., Huang, B., & Gong, J. (2008). Urban change detection based on coherence
and intensity characteristics of SAR imagery. Photogrammetric Engineering and Remote Sensing, 74(8): 999-1006.
Lin, W., Zhang, L., Du, D., Yang, L., Lin, H., Zhang, Y., & Li, J. (2009). Quantification of land use/land cover changes in Pearl River Delta and its impact on regional climate in summer using numerical modeling. Regional Environmental Change, 9(2): 75-82.
Lin, W. S., Sui, C. H., Yang, L. M., Wang, X. M., Deng, R. R., Fan, S. J., ... & Lin, H. (2007). A numerical study of the influence of urban expansion on monthly climate in dry autumn over the Pearl River Delta, China. Theoretical and Applied Climatology, 89(1-2): 63-72.
Liu, H., & Zhou, Q. (2004). Accuracy analysis of remote sensing change detection by rule-based rationality evaluation with post-classification comparison. International Journal of Remote Sensing, 25(5): 1037-1050.
Liu, W., & Seto, K. C. (2008). Using the ART-MMAP neural network to model and predict urban growth: a spatiotemporal data mining approach. Environment And Planning B: Planning And Design, 35(2): 296-317.
Liu, Y., Yue, W., & Fan, P. (2011). Spatial determinants of urban land conversion in large Chinese cities: a case of Hangzhou. Environment and Planning B: Planning and Design, 38(4): 706.
Liu, Y. S., Wang, J. Y., & Long, H. L. (2010). Analysis of arable land loss and its impact on rural sustainability in Southern Jiangsu Province of China. Journal of Environmental Management, 91(3): 646-653.
Long, H., Liu, Y., Wu, X., & Dong, G. (2009). Spatio-temporal dynamic patterns of farmland and rural settlements in Su–Xi–Chang region: Implications for building a new countryside in coastal China. Land Use Policy, 26(2): 322-333.
Luo, J., & Wei, Y. H. (2009). Modeling spatial variations of urban growth patterns in Chinese cities: the case of Nanjing. Landscape and Urban Planning, 91(2): 51-64.
Ma, T., Zhou, C., Pei, T., Haynie, S., & Fan, J. (2012). Quantitative estimation of urbanization dynamics using time series of DMSP/OLS nighttime light data: A comparative case study from China's cities. Remote Sensing of Environment, 124, 99-107.
Ma, Y., Kuang, Y., & Huang, N. (2010). Coupling urbanization analyses for studying urban thermal environment and its interplay with biophysical parameters based on TM/ETM+ imagery. International Journal of Applied Earth Observation and Geoinformation, 12(2): 110-118.
Ma, Y., & Xu, R. (2010). Remote sensing monitoring and driving force analysis of urban expansion in Guangzhou City, China. Habitat International, 34(2): 228-235.
Millward, A. A., Piwowar, J. M., & Howarth, P. J. (2006). Time-series analysis of medium-resolution, multisensor satellite data for identifying landscape change. Photogrammetric Engineering and Remote Sensing, 72(6): 653-664.
Pan, X. Z., & Zhao, Q. G. (2007). Measurement of urbanization process and the paddy soil loss in Yixing city, China between 1949 and 2000. Catena, 69(1): 65-73.
Pham, H. M., Yamaguchi, Y., & Bui, T. Q. (2011). A case study on the relation between city planning and urban growth using remote sensing and spatial metrics. Landscape and Urban Planning, 100(3): 223-230.
Qi, S., & Luo, F. (2008). Land Use Change and Environmental Hazard in the Coastal Areas: The Case of Laizhou Gulf, China. Journal of Coastal Research, 24(5): 1189-1193.
Qian, L. X., Cui, H. S., & Chang, J. (2006). Impacts of land use and cover change on land surface temperature in the Zhujiang Delta. Pedosphere, 16(6): 681-689.
Ren, L., Yue, W., Li, J., & Wu, C. (2010). Impact of economic development on wetlands in Hangzhou Bay Industrial Belt. Journal of Geographical Sciences,20(3): 406-416.
Seto, K. C., & Fragkias, M. (2005). Quantifying spatiotemporal patterns of urban land-use change in four cities of China with time series landscape metrics. Landscape Ecology, 20(7): 871-888.
Seto, K. C., & Kaufmann, R. K. (2003). Modeling the drivers of urban land use change in the Pearl River Delta, China: integrating remote sensing with socioeconomic data. Land Economics, 79(1): 106-121.

89
Seto, K. C., Woodcock, C. E., Song, C., Huang, X., Lu, J., & Kaufmann, R. K. (2002). Monitoring land-use change in the Pearl River Delta using Landsat TM. International Journal of Remote Sensing, 23(10): 1985-2004.
Shi, P. J., Yuan, Y., Zheng, J., Wang, J. A., Ge, Y., & Qiu, G. Y. (2007). The effect of land use/cover change on surface runoff in Shenzhen region, China. Catena, 69(1): 31-35.
Streets, D., Chung, C., Krummel, J., & Su, H. (1995). Remote sensing of global change: growth in China's Jiangsu Province. The International Journal of Sustainable Development & World Ecology, 2(4): 257-266.
Sun, C., Wu, Z. F., Lv, Z. Q., Yao, N., & Wei, J. B. (2013). Quantifying different types of urban growth and the change dynamic in Guangzhou using multi-temporal remote sensing data. International Journal of Applied Earth Observation and Geoinformation, 21: 409-417.
Tan, M., Li, X., & Lu, C. (2005). Urban land expansion and arable land loss of the major cities in China in the 1990s. Science in China Series D: Earth Sciences, 48(9): 1492-1500.
Tan, M., Li, X., Xie, H., & Lu, C. (2005). Urban land expansion and arable land loss in China—a case study of Beijing–Tianjin–Hebei region. Land Use Policy, 22(3): 187-196.
Tang, J., Wang, L., & Zhang, S. (2005). Investigating landscape pattern and its dynamics in Daqing, China. International Journal of Remote Sensing, 26(11): 2259-2280.
Tang, J., Wang, L., & Yao, Z. (2006). Analyzing urban sprawl spatial fragmentation using multi-temporal satellite images. GIScience and Remote Sensing, 43(3): 218-232.
Tang, J., Wang, L., & Yao, Z. (2007). Spatio-temporal urban landscape change analysis using the Markov chain model and a modified genetic algorithm. International Journal of Remote Sensing, 28(15): 3255-3271.
Tang, J., Wang, L., & Yao, Z. (2008). Analyses of urban landscape dynamics using multi-temporal satellite images: A comparison of two petroleum-oriented cities. Landscape and Urban Planning, 87(4): 269-278.
Tang, J. (2009). Spatial Analysis and Temporal Simulation of Landscape Patterns in Two Petroleum-Oriented Cities. IEEE Journal of Selected Topics in Applied Earth Observations and Remote Sensing, 2(2): 54-60.
Tian, G., Yang, Z., & Xie, Y. (2007). Detecting spatiotemporal dynamic landscape patterns using remote sensing and the lacunarity index: a case study of Haikou city, China. Environment and Planning B: Planning And Design, 34(3): 556.
Tong, X., Zhang, X., & Liu, M. (2010). Detection of urban sprawl using a genetic algorithm-evolved artificial neural network classification in remote sensing: a case study in Jiading and Putuo districts of Shanghai, China. International Journal of Remote Sensing, 31(6): 1485-1504.
Wang, L., Li, C., Ying, Q., Cheng, X., Wang, X., Li, X., Hu, L., Liang, L., Yu, L., Huang, H. & Gong, P. (2012). China’s urban expansion from 1990 to 2010 determined with satellite remote sensing. Chinese Science Bulletin, 57(22): 2802-2812.
Wang, W. W., Zhu, L. Z., Wang, R. C., & Shi, Y. J. (2003). Analysis on the spatial distribution variation characteristic of urban heat environmental quality and its mechanism. Chinese Geographical Science, 13(1): 39-47.
Weng, Q. (2001). A remote sensing? GIS evaluation of urban expansion and its impact on surface temperature in the Zhujiang Delta, China. International Journal of Remote Sensing, 22(10): 1999-2014.
Weng, Q., & Yang, S. (2006). Urban air pollution patterns, land use, and thermal landscape: an examination of the linkage using GIS. Environmental Monitoring and Assessment, 117(1-3): 463-489.
Wu, F. (1998). Polycentric urban development and land-use change in a transitional economy: the case of Guangzhou. Environment and Planning A, 30: 1077-1100.
Wu, F. (2012). An empirical model of intrametropolitan land-use changes in a Chinese city. Environment and Planning B: Planning and design, 25(2): 245-263.
Wu, F., & Yeh, A. G. O. (1997). Changing spatial distribution and determinants of land development in Chinese cities in the transition from a centrally planned economy to a socialist market economy: a case study of Guangzhou. Urban Studies, 34(11): 1851-1879.
Wu, Q., Li, H. Q., Wang, R. S., Paulussen, J., He, Y., Wang, M., Wang, B. & Wang, Z. (2006).

90
Monitoring and predicting land use change in Beijing using remote sensing and GIS. Landscape and Urban Planning, 78(4): 322-333.
Xia, L. (1993). Measurement of rapid agricultural land loss in the Pearl River Delta with the integration of remote sensing and GIS. Environment and Planning B: Planning and Design, 25(3): 447-461.
Xiao, R. B., Ouyang, Z. Y., Zheng, H., Li, W. F., Schienke, E. W., & Wang, X. K. (2007). Spatial pattern of impervious surfaces and their impacts on land surface temperature in Beijing, China. Journal of Environmental Sciences, 19(2): 250-256.
Xie, Y., Mei, Y., Guangjin, T., & Xuerong, X. (2005). Socio-economic driving forces of arable land conversion: A case study of Wuxian City, China. Global Environmental Change, 15(3): 238-252.
Xie, Y., Yu, M., Bai, Y., & Xing, X. (2006). Ecological analysis of an emerging urban landscape pattern—desakota: a case study in Suzhou, China. Landscape Ecology, 21(8):1297-1309.
Xu, C., Liu, M., An, S., Chen, J. M., & Yan, P. (2007). Assessing the impact of urbanization on regional net primary productivity in Jiangyin County, China. Journal of Environmental Management, 85(3): 597-606.
Xu, H., Wang, X., & Xiao, G. (2000). A remote sensing and GIS integrated study on urbanization with its impact on arable lands: Fuqing City, Fujian Province, China. Land Degradation and Development, 11(4): 301-314.
Xu, H. Q., & CHEN, B. Q. (2004). Remote sensing of the urban heat island and its changes in Xiamen City of SE China. Journal of Environmental Sciences,16(2): 276-281.
Xu, C., Liu, M., Zhang, C., An, S., Yu, W., & Chen, J. M. (2007). The spatiotemporal dynamics of rapid urban growth in the Nanjing metropolitan region of China. Landscape Ecology, 22(6): 925-937.
Xu, H., Ding, F., & Wen, X. (2009). Urban expansion and heat island dynamics in the Quanzhou region, China. IEEE Journal of Selected Topics in Applied Earth Observations and Remote Sensing, 2(2): 74-79.
Yeh, A. G. O., & Xia, L. (2001). Measurement and monitoring of urban sprawl in a rapidly growing region using entropy. Photogrammetric Engineering and Remote Sensing, 67(1): 83-90.
Yin, J., Yin, Z., Zhong, H., Xu, S., Hu, X., Wang, J., & Wu, J. (2011). Monitoring urban expansion and land use/land cover changes of Shanghai metropolitan area during the transitional economy (1979–2009) in China. Environmental Monitoring and Assessment, 177(1-4): 609-621.
Yu, D., Shao, H., Shi, P., Zhu, W., & Pan, Y. (2009). How does the conversion of land cover to urban use affect net primary productivity? A case study in Shenzhen city, China. Agricultural and Forest Meteorology,149(11): 2054-2060.
Yu, X., & Ng, C. (2006). An integrated evaluation of landscape change using remote sensing and landscape metrics: a case study of Panyu, Guangzhou. International Journal of Remote Sensing, 27(6): 1075-1092.
Yu, X. J., & Ng, C. N. (2007). Spatial and temporal dynamics of urban sprawl along two urban–rural transects: A case study of Guangzhou, China. Landscape and Urban Planning, 79(1): 96-109.
Yue, W., Liu, Y., & Fan, P. (2010). Polycentric urban development: the case of Hangzhou. Environment and Planning A, 42(3), 563.
Zha, Y., Gao, J., & Ni, S. (2003). Use of normalized difference built-up index in automatically mapping urban areas from TM imagery. International Journal of Remote Sensing, 24(3): 583-594.
Zhang, H., & Wang, X. R. (2007). Land-use dynamics and flood risk in the hinterland of the Pearl River Delta: The case of Foshan City. The International Journal of Sustainable Development and World Ecology, 14(5): 485-492.
Zhang, L., Liao, M., Yang, L., & Lin, H. (2007). Remote sensing change detection based on canonical correlation analysis and contextual bayes decision. Photogrammetric Engineering and Remote Sensing, 73(3): 311-318.
Zhang, Q., Wang, J., Peng, X., Gong, P., & Shi, P. (2002). Urban built-up land change detection with road density and spectral information from multi-temporal Landsat TM data. International Journal of Remote Sensing, 23(15): 3057-3078.
Zhang, X., Chen, J., Tan, M., & Sun, Y. (2007). Assessing the impact of urban sprawl on soil resources of Nanjing city using satellite images and digital soil databases. Catena, 69(1): 16-30.
Zhang, X. C., Pan, Q., Zhao, L. L., & Ye, S. T. (2002). GIS-based analysis of urban land-use changes – a case study of Haizhu District of Guangzhou city, China. Chinese Geographical Science, 12(4):

91
339-345. Zhang, Y. (2001). Detection of urban housing development by fusing multisensor satellite data and
performing spatial feature post-classification. International Journal of Remote Sensing, 22(17): 3339-3355.
Zhou, Q., & Sun, B. (2010). Analysis of spatio-temporal pattern and driving force of land cover change using multi-temporal remote sensing images. Science China Technological Sciences, 53(1): 111-119.
Appendix 3. Literatures in spatial differentiation and polycentricity
Spatial differentiation Dong, W., Zhang, X., Wang, B., & Duan, Z. (2007). Expansion of Ürümqi urban area and its spatial
differentiation. Science in China Series D: Earth Sciences, 50(S1) Han, S. S. (2010). Urban expansion in contemporary China: What can we learn from a small town? Land
Use Policy, 27(3), 780-787 Lin, G. (2001). Metropolitan Development in a Transitional Socialist Economy: Spatial Restructuring in
the Pearl River Delta, China. Urban Studies, 38(3), 383-406
Madrazo, B., & van Kempen, R (2012). Explaining divided cities in China. Geoforum, 43(1), 158-168 Wang, K., Gao, X., & Chen, T. (2008). Influencing factors for formation of urban and rural spatial
structure in metropolis fringe area-Taking Shuangliu County of Chengdu in China as a case. Chinese Geographical Science, 18(3), 224-234.
Wei, Y.D., & Li, W. (2002) Reforms, Globalization, and Urban Growth in China: The Case of Hangzhou. Eurasian Geography and Economics, 43(6), 459-475
Wu, F. (2002) Sociospatial differentiation in urban China: evidence from Shanghai’s real estate markets. Environment and Planning A, 34(9), 1591-1615
Ning, Y., & Yan, Z. (1995) The changing industrial and spatial structure in Shanghai. Urban Geography, 16(7), 577-594
Yeh, A.G., & Wu, F. (1995) Internal structure of Chinese cities in the midst of economic reform. Urban Geography, 16(6), 521-554
Polycentricity Yao, S. & Liu, T. (1995). The evolution of urban spatial structure in the open area of southeastern coastal
China. Urban Geography, 16(7), 561-576
Feng, J., Wang, F., & Zhou, Y. (2009). The spatial restructuring of population in metropolitan Beijing: toward policentricity in the post-reform era. Urban Geography,30(7),779-802
Gaubatz, P. (1999). China’s Urban Transformation: Patterns and Processes of Morphological Change in Beijing, Shanghai and Guangzhou. Urban Studies, 36(9), 1495-1521
Heikkila, E. J. (2007) Three Questions Regarding Urbanization in China. Journal of Planning Education and Research, 27(1), 65-81
Lehmann, S. (2013). Low-to-no carbon city: Lessons from western urban projects for the rapid transformation of Shanghai. Habitat International, 37, 61-69
Lin, G. C. S. (1999). State Policy and Spatial Restructuring in Post-reform China, 1978-95. International Journal of Urban and Regional Research, 23(4), 670-696.
Lin, G. C. S. (2007). Reproducing Spaces of Chinese Urbanisation: New City-based and Land-centred Urban Transformation. Urban Studies, 44(9), 1827-1855
Ma, L. (2004). Economic reforms, urban spatial restructuring, and planning in China. Progress in Planning, 61(3), 237-260

92
Qian, H., & Wong, C. (2012). Master Planning under Urban – Rural Integration : The Case of Nanjing , China. Urban Policy and Research, 30(4), 403-421
Wei, Y. H. D. (2012). Restructuring for growth in urban China: Transitional institutions, urban development, and spatial transformation. Habitat International, 36(3), 396-405
Wei, Y., & Zhao, M. (2009). Urban spill over vs. local urban sprawl: Entangling land-use regulations in the urban growth of China’s megacities. Land Use Policy, 26(4), 1031-1045
Whitehand, J. W. R., & Gu, K. (2006). Research on Chinese urban form: retrospect and prospect. Progress in Human Geography, 30(3), 337-355.
Wu, F. (1998). Polycentric urban development and land-use change in a transitional economy : the case of Guangzhou. Environment and Planning A, 30(1989), 1077-1100.
Yao, S., & Liu, T. (1995). The evolution of urban spatial structure in the open area of southeastern coastal China. Urban Geography, 16(7), 561-576
Yue, W., Liu, Y., & Fan, P. (2010). Polycentric urban development: the case of Hangzhou. Environment and Planning A, 42(3), 563-577
Zhou, Y., & Ma, L. J. C. (2000). Economic Restructuring and Suburbanization in China. Urban Geography, 21(3), 205-236
Zhu, X., Zhang, J., & Chen, H. (2002). A case study on concentration and decentralization: behavior and dynamic mechanism of spatial evolution in metropolitan area, Nanjing, China. Chinese Geographical Science, 12(3), 212-217.