understanding the interface between electrode and ... · understanding the interface between...
TRANSCRIPT

1
Supporting Information
Understanding the Interface between Electrode and
Electrolyte: A Hybrid Organic/Inorganic Design
for Fast Ion Conductivity
Dong Young Chung1,2
, Young-Hoon Chung3, Sungmin Kim
4, Ju Wan Lim
2,
Kyung Jae Lee1,2
, Namgee Jung5, Hyeyoung Shin
4, Ok-Hee Kim
6, Hyungjun
Kim4, Sung Jong Yoo
3,* and Yung-Eun Sung
1,2,*

2
1. Modified TLM for EIS analysis
Figure S1. Equivalent circuit for modified transmission line model under H2/N2 non-faradaic
condition
Figure S2. Cyclic voltammetry curves for commercial Pt/C MEA H2/N2 anode and cathode,
respectively.
3
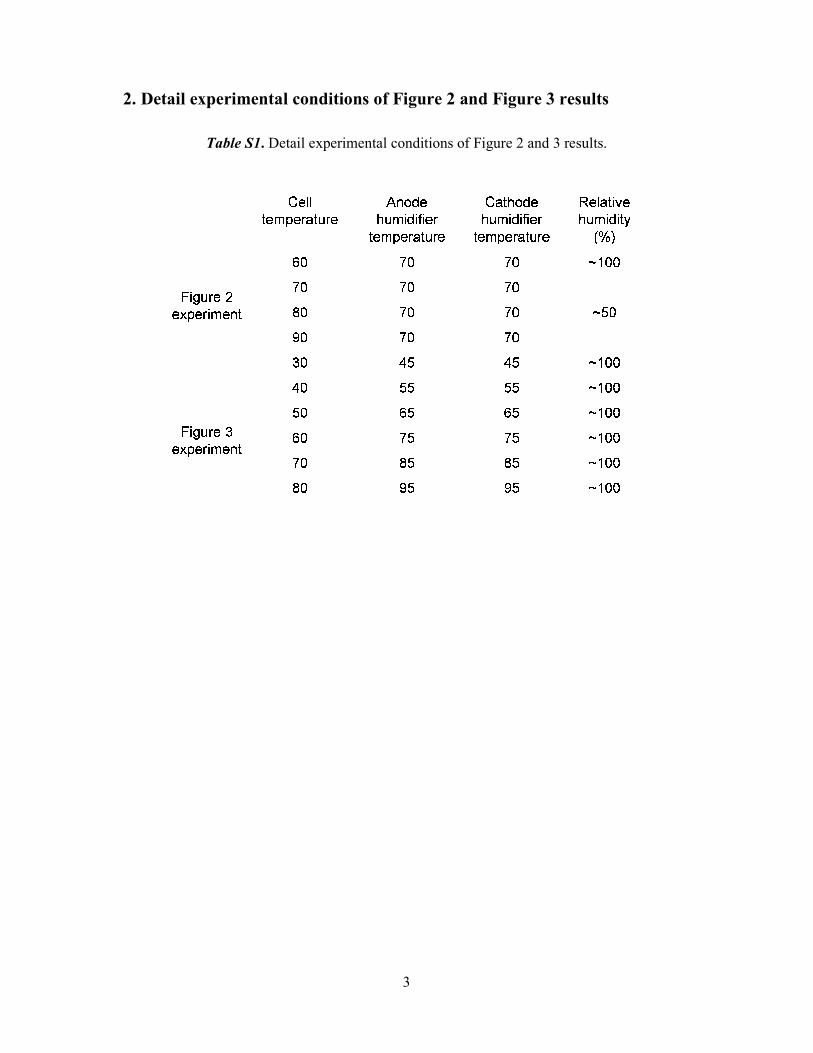
2. Detail experimental conditions of Figure 2 and Figure 3 results
Table S1. Detail experimental conditions of Figure 2 and 3 results.
4
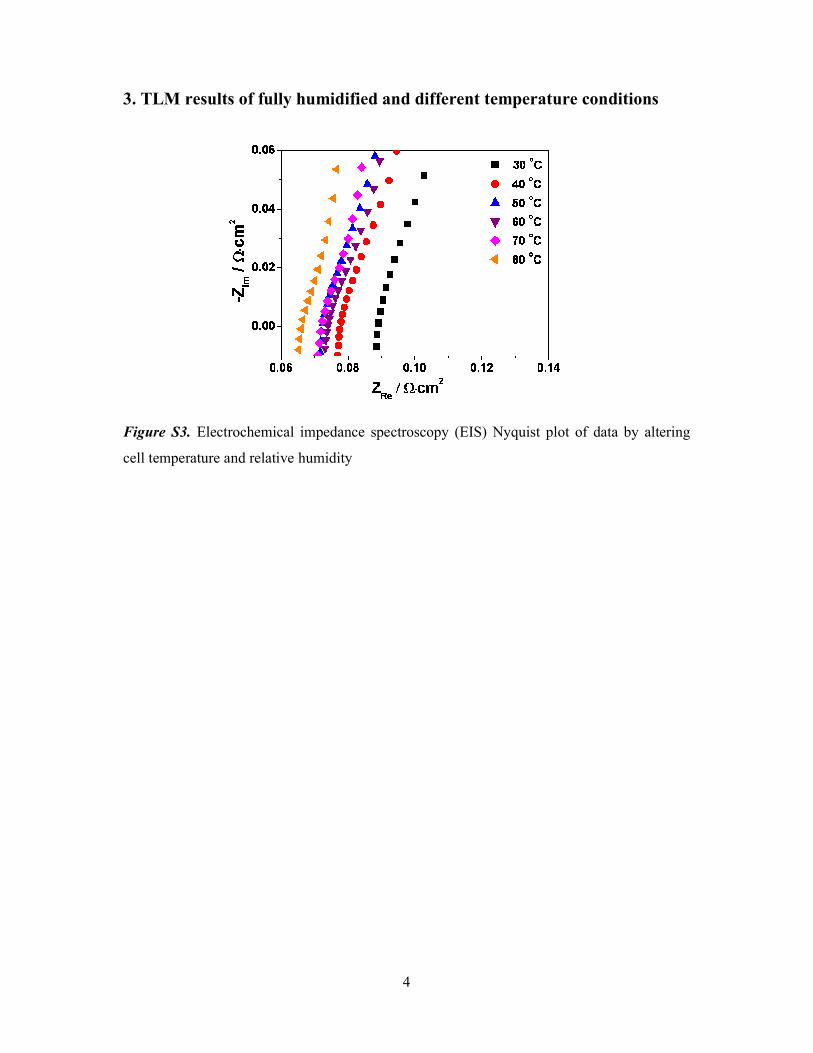
3. TLM results of fully humidified and different temperature conditions
Figure S3. Electrochemical impedance spectroscopy (EIS) Nyquist plot of data by altering
cell temperature and relative humidity
5
4. Molecular dynamics (MD) method and details
Computational Details
Molecular dynamics (MD) simulations were performed to understand the effect of 3-MPA
molecules adsorbed on the electrode system using the LAMMPS software program. 1
To achieve full equilibration in the polymeric phase, we used the scaled-effective-solvent
(SES) method where all non-bonded interactions are effectively scaled down over the course
of the rotation-configurational space sampling 2.To attain insights about the catalyst-polymer
membrane interface at the operational conditions, we compared cases when our model system
for Pt electrode is uncharged and that is charged by +5.
We considered bare and 3-MPA modified Pt systems where the coverage of the 3-MPA
molecules is chosen to be ~25 % in aqueous solutions. When the electrode was charged by +5,
we further included 5 Cl- ions to satisfy the charge balance of the simulation cell. Our Pt
electrode is modelled by a three-layer Pt (111) slab with (8 × 9) periodicity.
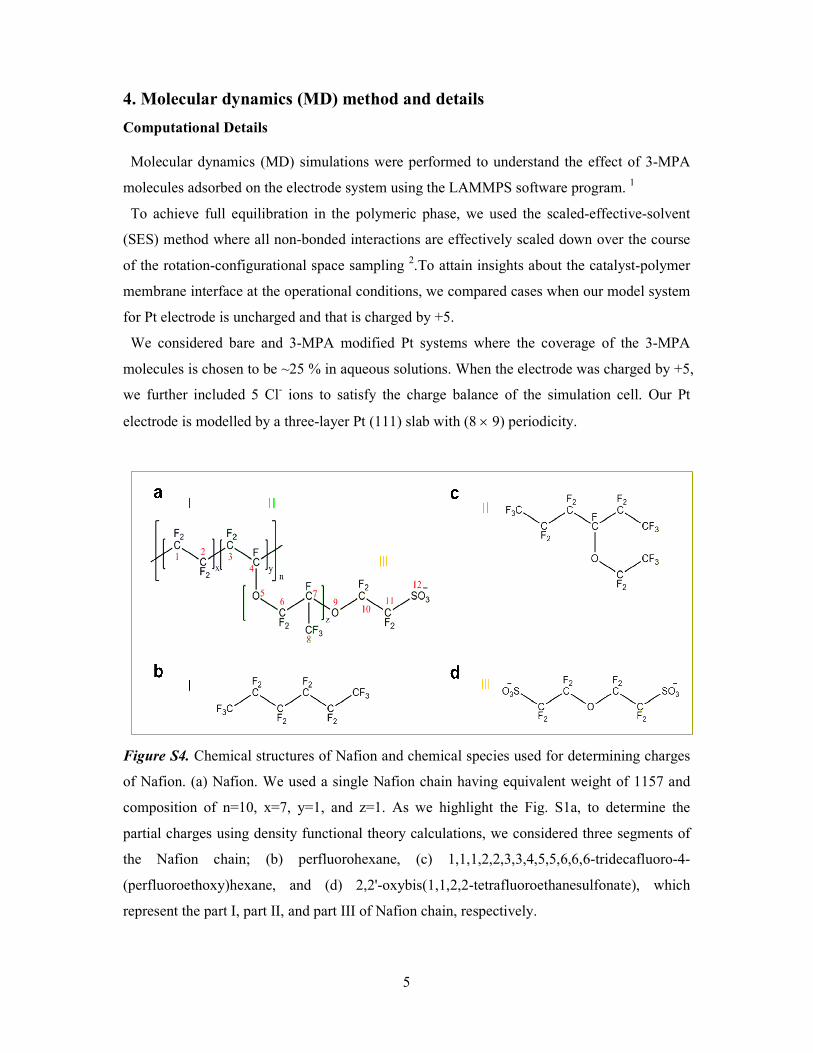
Figure S4. Chemical structures of Nafion and chemical species used for determining charges
of Nafion. (a) Nafion. We used a single Nafion chain having equivalent weight of 1157 and
composition of n=10, x=7, y=1, and z=1. As we highlight the Fig. S1a, to determine the
partial charges using density functional theory calculations, we considered three segments of
the Nafion chain; (b) perfluorohexane, (c) 1,1,1,2,2,3,3,4,5,5,6,6,6-tridecafluoro-4-
(perfluoroethoxy)hexane, and (d) 2,2'-oxybis(1,1,2,2-tetrafluoroethanesulfonate), which
represent the part I, part II, and part III of Nafion chain, respectively.
6
The polymer membrane is modeled using a single chain of Nafion (equivalent weight of
1157, Figure S4a) and with 11 weight percent of water (70 H2O and 10 H3O+ ions) is
immersed in the polymer membrane. To describe interatomic potential, we used DREIDING
generic force field potential. 3 Using density functional theory (DFT) calculations and
Mulliken population analysis 4, we determined the partial charges of Nafion and H3O+ ion
(B3LYP 5-6 / 6-31G** 7 level using Jaguar 7.9 Program 8. Figure S4 shows the segments of
Nation chain used to determine the partial charge distribution using DFT calculations, and
partial charges are shown in Table S2. To model the partial charge distribution of the Pt
electrode surface, we used the charge equilibrium (QEq) method 9. Water molecules were
described using the flexible three-centered (F3C) water model 10.
Our overall MD simulation procedures were summarized as follows:
1. Scaled effective solvent (SES) procedure 2 to predict the equilibrium structure of
Nafion.
2. Inclusion of H2O, H3O+, and Cl- on the Nafion system using grand canonical Monte
Carlo (GCMC) simulations with fixed final number of the species to introduce them
into favorable positions.
3. Canonical ensemble (NVT) dynamics to heat up the system from 10 K to 343 K for 10
ps.
4. Annealing dynamics changing the temperature from 343 K to 413K for 5 cycles.
5. Isothermal-isobaric ensemble (NPT) dynamics along with the z-dimension at 1 atm
and 343K for 4 – 45 ns until the volume of the complex system reach to the
equilibrium state.
6. NVT dynamics at 343 K with the volume determined from the NPT dynamics step for
5 – 30 ns until the systems reach to the equilibrium.
Here, the simulation time step is set as 1 fs and all Pt atoms are fixed for the whole procedure.
All analysis is based on the final 5 ns NVT trajectories.

7
Table S2. Partial charges of a Nafion (Figure S4a) determined from Mulliken charges using
DFT calculations with B3LYP/6-31G** level for perfluorohexane (Figure S4b, for part Ⅰ),
1,1,1,2,2,3,3,4,5,5,6,6,6-tridecafluoro-4-(perfluoroethoxy)hexane (Figure S4c, for part Ⅱ),
and 2,2'-oxybis(1,1,2,2-tetrafluoroethanesulfonate) (Figure S4d, for part Ⅲ).
Part Atom type Charge
I
C1 0.538
F1 -0.269
C2 0.538
F2 -0.269
II
C3 0.584
F3 -0.271
C4 0.491
F4 -0.276
O5 -0.514
C6 0.749
F6 -0.254
C7 0.491
F7 -0.276
C8 0.774
F8 -0.258
III
O9 -0.514
C10 0.803
F10 -0.271
C11 0.336
F11 -0.290
S12 1.092
O12 -0.598

8
Figure S5. Molar concentration of proton sources (water molecules and hydronium ions) as a
function of distance from the Pt surface along its normal direction when the electrode is (a)
uncharged and (b) charged by +5. Bare Pt electrode is shown as black, and 3-MPA modified
Pt electrode is shown as red. This shows that 3-MPA adsorbates significantly contribute to
enhance the surface wettability near the Pt surface.
Figure S6. Local densities of proton sources (water molecules and hydronium ions) near the
Pt surface (within 5 Å) are shown for bare Pt case (black) and 3-MPA modified Pt case (red),
which are obtained from the final 5 ns MD trajectories. To attain insights about the catalyst-
polymer membrane interface at the operational conditions, we compared cases when our
model system for Pt electrode is uncharged and that is charged by +5. In both cases, we find
the surface wettability dramatically increases by modifying the catalyst surface with 3-MPA,
which is expected to enhance the proton transfer kinetics.

9
Figure S7. Radial distribution function, g(r), of the oxygen atoms of the proton sources
(water molecules and hydronium ions) around oxygen atoms of carboxylate groups of 3-MPA
molecules. We note that the first peak of g(r) is very sharp and it indicates that there is a
strong interaction between the proton sources and carboxylate groups of 3-MPA molecules by
forming hydrogen bonds.

10
5. Analysis of faradaic EIS (Figure 6c left in MS)
To analyze the EIS data more details conducted faradaic condition, equivalent circuit fitting
was used. A general equivalent circuit contains wire inductance (Lw), constant phase element
of anode and cathode (CPE), charge transfer resistance of both electrodes (Ranode, Rcathode),
total ohmic resistance (RPEM), and Warburg element (ZWS) which is related to mass transport
resistance. EIS was conducted at 0.6V with feeding of humidified H2 and air at anode and
cathode respectively.
Figure S8. Equivalent circuit of PEMFC under the faradaic condition
EIS data is shown at Figure 6c left and fitting results are presented Table S3
Table S3. Results of the fitting with an equivalent circuit for analysis of resistance of
individual parts.
RPEM
(Ω cm2)
Rcathode
(Ω cm2)
REF Pt/C 0.078 0.18
3-MPA Modified Pt/C 0.069 0.24
Ranode was extremely low value compared to Rcathode. Hydrogen oxidation reaction resistance
in anode could be disregarded.11-12 Cathode charge transfer resistance of modified with 3-
MPA increased about 33% relative to reference one. These results were well correlated to
decrease of ECSA measured by CV. ZWO-R that is related to the mass transport issues also
increased. The reason of these results is that high current induces the more water in system.
11
6. Quantitative analysis of electrochemical surface area (ECSA), EIS results
of non-faradaic condition. (Figure 6c right in MS)
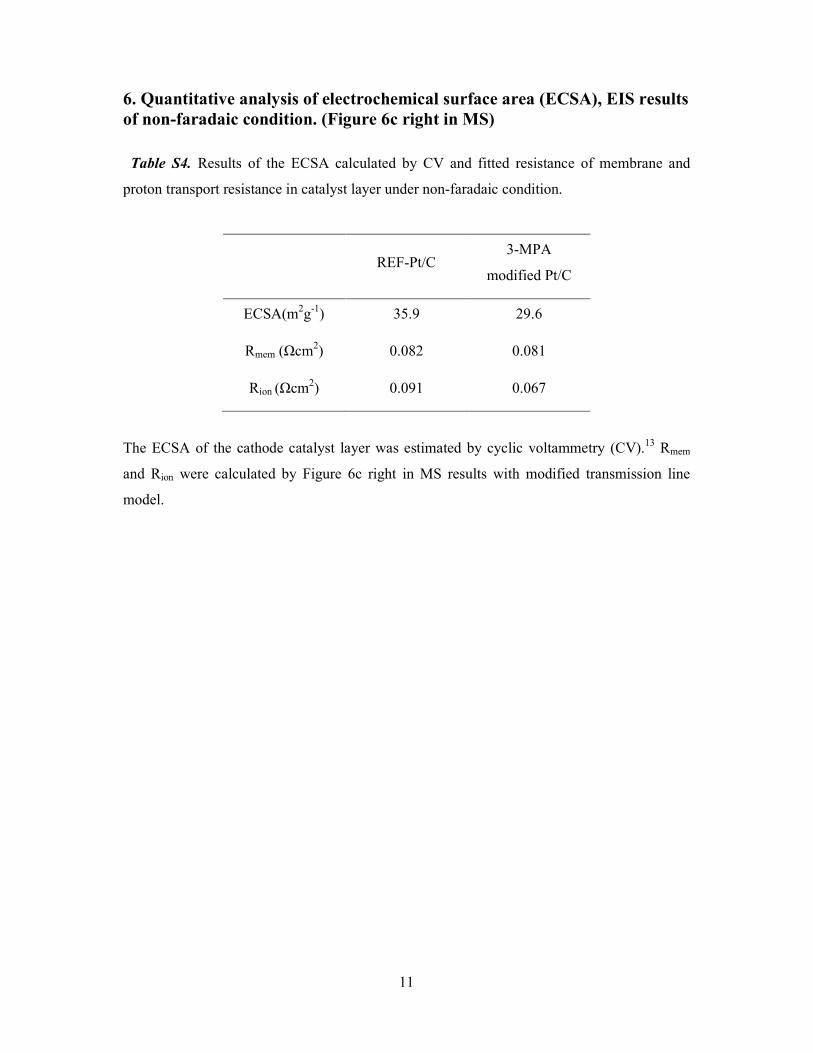
Table S4. Results of the ECSA calculated by CV and fitted resistance of membrane and
proton transport resistance in catalyst layer under non-faradaic condition.
The ECSA of the cathode catalyst layer was estimated by cyclic voltammetry (CV).13 Rmem
and Rion were calculated by Figure 6c right in MS results with modified transmission line
model.
REF-Pt/C 3-MPA
modified Pt/C
ECSA(m2g-1) 35.9 29.6
Rmem (Ωcm2) 0.082 0.081
Rion (Ωcm2) 0.091 0.067
12
7. References 1. Plimpton, S. Fast parallel algorithms for short-range molecular dynamics. Journal of
Computational Physics 1995, 117 (1), 1-19.
2. Shin, H.; Pascal, T. A.; Goddard, W. A.; Kim, H. Scaled effective solvent method for
predicting the equilibrium ensemble of structures with analysis of thermodynamic properties
of amorphous polyethylene glycol-water mixtures. J. Phys. Chem. B 2013, 117 (3), 916-927.
3. Mayo, S. L.; Olafson, B. D.; Goddard Iii, W. A. DREIDING: A generic force field for
molecular simulations. J. Phys. Chem. 1990, 94 (26), 8897-8909.
4. Mulliken, R. S. Electronic population analysis on LCAO-MO molecular wave
functions. I. The Journal of Chemical Physics 1955, 23 (10), 1833-1840.
5. Becke, A. D. Density-functional thermochemistry. III. The role of exact exchange. The
Journal of Chemical Physics 1993, 98 (7), 5648-5652.
6. Lee, C.; Yang, W.; Parr, R. G. Development of the Colle-Salvetti correlation-energy
formula into a functional of the electron density. Physical Review B 1988, 37 (2), 785-789.
7. Krishnan, R.; Binkley, J. S.; Seeger, R.; Pople, J. A. Self-consistent molecular orbital
methods. XX. A basis set for correlated wave functions. The Journal of Chemical Physics
1980, 72 (1), 650-654.
8. Suite 2012: Jaguar version 7.9, S., LLC, New York, NY, 2012.
9. Rappé, A. K.; Goddard Iii, W. A. Charge equilibration for molecular dynamics
simulations. J. Phys. Chem. 1991, 95 (8), 3358-3363.
10. Levitt, M.; Hirshberg, M.; Sharon, R.; Laidig, K. E.; Daggett, V. Calibration and
testing of a water model for simulation of the molecular dynamics of proteins and nucleic
acids in solution. J. Phys. Chem. B 1997, 101 (25), 5051-5061.
11. Springer, T. E.; Zawodzinski, T. A.; Wilson, M. S.; Gottesfeld, S. Characterization of
polymer electrolyte fuel cells using AC impedance spectroscopy. J. Electrochem. Soc. 1996,
143 (2), 587-599.

13
12. Wu, J.; Yuan, X. Z.; Wang, H.; Blanco, M.; Martin, J. J.; Zhang, J. Diagnostic tools in
PEM fuel cell research: Part I Electrochemical techniques. Int. J. Hydrogen Energy 2008, 33
(6), 1735-1746.
13. Brummer, S. B. The use of large anodic galvanostatic transients to evaluate the
maximum adsorption on platinum from formic acid solutions. J. Phys. Chem. 1965, 69 (2),
562-571.