understanding the links in the green supply chain
TRANSCRIPT

149Understanding the Links in the Green Supply Chain
Understanding the Links in the Green Supply Chain©
Shelly Fuller48 Ringwood Drive, Pinelands, 7405, Cape Town, South Africa Email: [email protected]
INTRODUCTIONGood morning ladies and gentlemen. It’s great to be among green-fingered people. My background: National Diplomain Horticulture, Bachelors of Technology in En-vironmental Management, owned a landscaping business for several years, before continuing my studies and completing a Masters of Science (MSc) in Conservation Ecology. I now focus my energy on addressing environmental issues (more specifi-cally climate change-related) within the land-use-based sector.
What I’m offering you today is a holistic view of risks and opportunities (in rela-tion to climate change) as I see it for this industry (a broad level approach), what they mean for your business, and how you can start addressing them.
First and foremost, effective collaboration and linking together — both within industries/sectors and with government — is the only way to tackle the challenges of changing climate both in terms of effectiveness of the action, as well as financial feasibility of technological and process changes.
WHAT IS CLIMATE CHANGE?In essence it’s all about greenhouse gases (GHG). In natural quantities these GHG are vital in forming a thin layer around the earth that regulate earth’s tempera-ture, thereby allowing life on earth to exist.
However, in recent history (post-industrial revolution) unnatural or human-in-duced increases in these GHG are causing an excessive build up of these GHG in the atmosphere. This changes the natural systems — to tipping point — which is where we are now. The bottom line is, we caused this mess and we need to act now to prevent it from worsening.
DIFFERENT GREENHOUSE GASES Carbon dioxide (CO2) — the most abundant GHG in atmosphere — is the unit of measure that all other GHG are valued against. For example, methane is 21 times stronger (in terms of global warming potential or GWP) than CO2 and therefore 1 unit of methane equals 21 units of carbon dioxide equivalent (CO2e). Similarly (and important for this industry) nitrous oxide (N2O),which is released when nitrogen-based fertilizers break down and combine with oxygen to release nitrous oxide, is 298 times stronger than CO2, therefore 1 unit of N2O equals 298 units of CO2e.
Some of the most predominant impacts of the increase in GHG on global scale are increase in temperatures, decrease in water availability, and increase in season variability.
For example, if a line is drawn down South Africa, the east is expected to get wet-ter and cooler, while the west drier and hotter. What is important to note is that not all the impacts of climate change are bad. Some agricultural crops for example, may increase in yield due to more productive growing conditions. However the big-gest problem is change in seasonal patterns (e.g., chill units, rainfall patterns), and understanding how to work with the new climate.

Combined Proceedings International Plant Propagators’ Society, Volume 59, 2009150
The link between GHGs and temperature is clear (Fig. 1). As explained, since the industrial revolution there has been a radical increase in the levels of GHGs in the atmosphere and it is clear how that increase impacts on a consistent rise in aver-age temperatures since that same time period. It is now undisputed that climate change is human-induced.
Figure 1. Carbon dioxide and temperature link. (NASA, 2007)
Parts per million (ppm) is the measure of GHG in the atmosphere and we are currently sitting at approximately 350–400 ppm. This clearly equates to an unstop-pable increase in temperature worldwide. Recent reports are saying that the Inter-governmental Panel on Climate Change (IPCC) figures (Fig. 2) are too conservative and that we are heading more to 4 oC increase. You can imagine what that would do to this industry. What is also very important to understand and remember is the “lag effect” of GHGs in the atmosphere. What this means is that the gases build
Figure 2. Intergovernmental Panel on Climate Change (IPCC) figures for CO2 and projected temperature change. [Adapted from Intergovernmental Panel on Climate Change (2007).]
151
up over time and will remain in the atmosphere even if we all stopped driving cars tomorrow and stopped polluting — there will still be an increase in temperature and the associated impacts, but it may just be manageable. If we carry on doing what we’re doing, the impacts become compounded and will become more intense and catastrophic.
CLIMATE CHANGE LINGOI have already covered GHGs and CO2 in the above text.
There are two ways of dealing with the GHG emissions and the changing envi-ronmental patterns:
1) Mitigation: which is action taken to directly reduce GHG (such as switching to renewable fuels).
2) Adaptation: which is the long-term strategies that are put in place to prepare for and deal with the change. While mitigation tackles the causes of climate change, adaptation tackles the effects of the experience, and both are therefore crucial in reducing vul-nerability to climate change.
Kyoto Protocol is a binding agreement that requires 37 countries and the Eu-ropean Union to reduce their anthropogenic greenhouse gases by 5% collectively from the baseline 1990 levels by the end of the first commitment period, which is 2008–2012.
The United Nations Framework Convention on Climate Change (UNFCCC) was adopted on 1992 and established general principles to stabilize greenhouse gas con-centrations and prevent dangerous human-induced interference with the climate systems. The treaty includes requirements such as preparing national inventories of greenhouse gas emissions, and a commitment to reduce emissions to the global 1990 levels. The convention has nearly universal membership, with over 190 signa-tory countries.
Conference of the Parties (COP) is an annual meeting of scientists, governmen-tal agencies, and negotiators to discuss a way forward in terms of climate change and GHG reductions. This December is a particularly crucial one in Copenhagen because the end of the first commitment period (2008–2012) is fast approaching and so the development of a new framework (post 2012) is underway which will outline the rules and regulations into the future. There is particular focus on land-use, forestry, and ecosystem services and the role they play in stabilizing the GHG emissions around the world (they are carbon “sinks”). The trick is to put a realistic value to these “ecosystem services” and that is what is currently unknown. This is of course very important for this industry.
Intergovernmental Panel on Climate Change (IPCC) is the international scien-tific body established in 1988 to provide an objective and neutral source of infor-mation on climate change. The IPCC releases period assessment reports that are reviewed and approved by experts and governments.
In terms of the international legislation, South Africa can also be proud as we are leading the way in many aspects.
Long-term Mitigation Scenerios (LTMS), which was published at the end of 2007, is a high level policy document that is currently forming the framework for our GHG emission reduction targets and sustainable development pathway The report offers different scenerios and paints environmental and economic implications of
Understanding the Links in the Green Supply Chain

Combined Proceedings International Plant Propagators’ Society, Volume 59, 2009152
each, for example: “act now,” “required by science,” and “business as usual.” The document is freely available on the web.
Carbon footprinting is a way to measure the impact of activities on the environ-ment, particularly in terms of GHGs. The unit of measure is tonnes of CO2e emitted per product or process (per wine bottle produced or per business unit). Similarly, Water Footprinting is a measure of water quality, wastage, recycling that result from business or personal activities.
Different Standards. There are many different standards which offer guidance on how to undertake GHG audits. The value is really in everyone using same stan-dard so as to have a true comparison. The GHG Protocol is the leading internation-al GHG auditing and reporting standard for businesses and corporates, while the PAS 2050 is a more in-depth analysis (life cycle) aimed at product-specific processes throughout the supply chain.
Emission reduction opportunities are identified within the audit — often called “GHG HOTSPOTS” — as areas where emissions are high but can be viabily re-duced through energy-effecient technologies or changes in behaviour.
Carbon Credits is a complicated process, but to offer a simple version: Factory A emits (is a “source”) over-and-above its mandatory limit of GHGs and
so has a “debt” of 1 tonne of CO2.Project B is absorbing (sequestering) (is a “sink”) GHGs in excess for its needs and
therefore has a “credit” of 1 tonne of CO2.Factory A purchases the carbon credit (1 tonne) from Project B and is therefore
now within its GHG limit. Project B then receives funds to continue its work. “Pol-lution is paying for conservation.”
This is controversial and needs some fine tuning as it effectively still “allows” the polluter to pollute and doesn’t necessarily enforce strict on-site emission reductions.
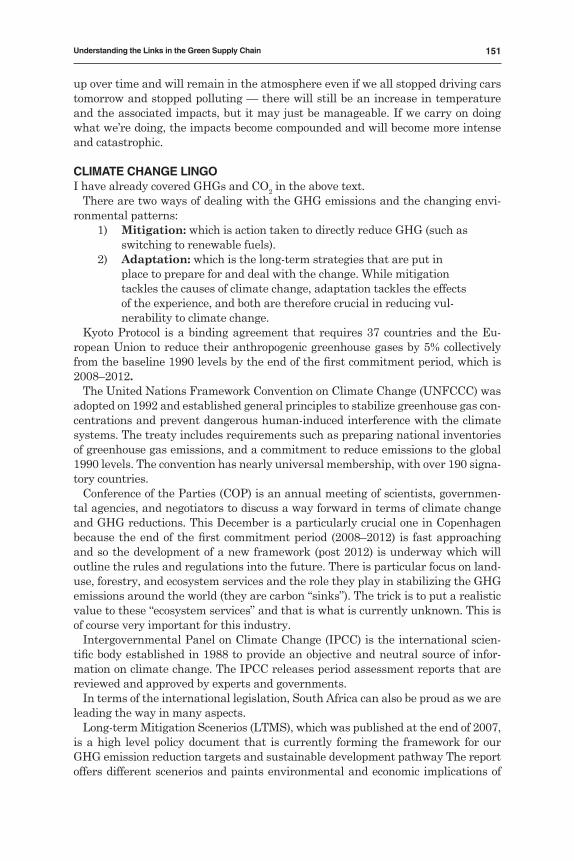
HOW DOES IT IMPACT US?Now we’re all on the same page what does this mean and how does it impact us (Fig. 3)?
Direct Impacts. Increased levels of CO2, lower rainfall, and increase in average tem-peratures. What is important to remember is not to see each impact in isolation — they are all interlinked and it is their compounded impact that we must consider.
Indirect Impacts. Are impacts such as market-based purchasing impacts, the re-cent trend of everything being labeled “GREEN” is making people think about what they are buying. This points out the importance of a properly informed customer.
WHICH SECTORS ARE MOST RESPONSIBLE? Globally. Agriculture and land-use are responsible for one-fourth of the total emis-sions. This is much higher than one would expect, considering this is a “green” industry. One has to look at the big picture. Although we work with plants, that is not all we do, and we are still too dependant on fossil fuels and grid electricity. That is what makes the difference. Overall, it is energy-producing industries that play the most significant role in the global footprint, but that doesn’t mean we can shrug out shoulders and pretend it’s not our problem. We are all involved.
153
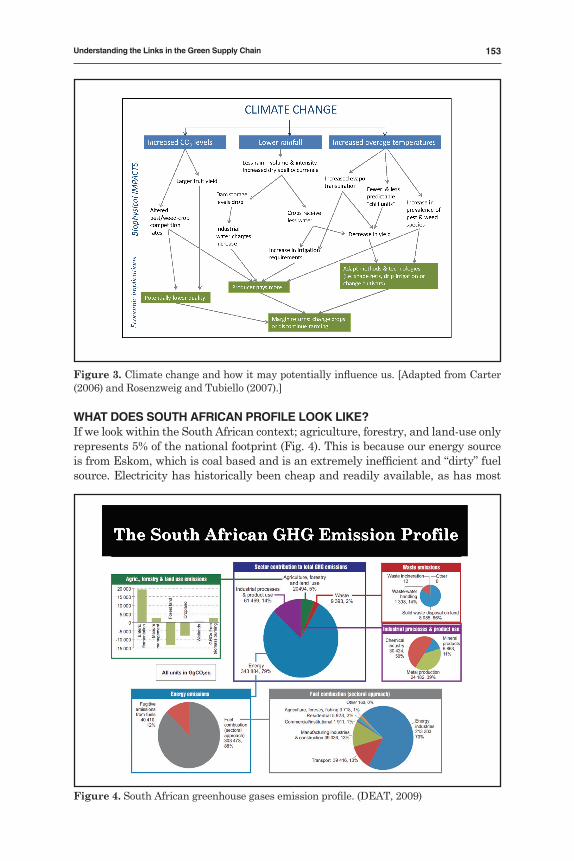
WHAT DOES SOUTH AFRICAN PROFILE LOOK LIKE?If we look within the South African context; agriculture, forestry, and land-use only represents 5% of the national footprint (Fig. 4). This is because our energy source is from Eskom, which is coal based and is an extremely inefficient and “dirty” fuel source. Electricity has historically been cheap and readily available, as has most
Figure 3. Climate change and how it may potentially influence us. [Adapted from Carter (2006) and Rosenzweig and Tubiello (2007).]
Figure 4. South African greenhouse gases emission profile. (DEAT, 2009)
Understanding the Links in the Green Supply Chain

Combined Proceedings International Plant Propagators’ Society, Volume 59, 2009154
fossil fuels in this country. Our economy is based on such readily available com-modities and at such cheap prices. That is why, in this light, land-use doesn’t look so bad (at only 5%), but it’s all relative. What’s important to take away from these figures is that the “Green Industry” is not as green as originally thought.
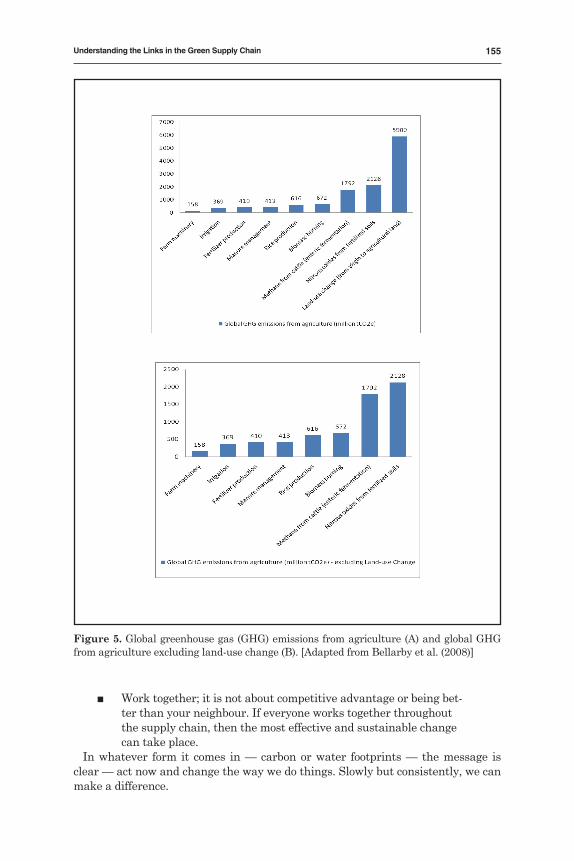
Let’s look at land-use breakdown (Fig. 5). These graphs show the GHG emissions linked to the different activities of agriculture (adapted from Bellarby et al., 2008.) It is obvious that land conversion from virgin to agricultural land use is by far the major contributing factor. This is due to the nitrous oxide that is released from the soil during the plowing process as well as the carbon storage capacity that is lost when the vegetation is removed. If we were to look at the GHG emissions from ex-isting agricultural land over-fertilized soils, methane (CH4) and nitrous oxide (N2O) have powerful global warming potentials (GWP) and contribute significantly to cli-mate change. Important for this industry, is the role of over-fertilized soils, even if only in 4-kg black bags, it is still the leading source of GHGs in the land-use sector.
All these figures are based on international studies. South Africa is only just be-ginning to cover this on a sector basis. Overall, land use change contributes 25% of global anthropogenic GHG emissions and is the leading cause of species extinction. We are involved in this game and we need to take responsibility for our actions.
VALUING ECOSYSTEM FUNCTIONING AND THE ROLE SYSTEMS CAN PLAY IN REDUCING THE IMPACT OF CLIMATE CHANGEThis audience is well versed on the value of a functioning ecosystem — to name a few: nutrient cycling, soil health, erosion control, sponge effect (energy conserva-tion), biodiversity, aesthetics (horticulture), and most recently, understanding the role of ecosystems in MITIGATING against climate change. Ecosystems are the GREEN LUNGS of the world.
TRENDS IN THE GREEN GAMECarbon and water footprinting, although currently “market based” to give competi-tive edge, are actually a reality and a necessity in order to get a baseline (or starting point) for any business.
You don’t know how to move forward without knowing where you are.What’s also important to remember is that it’s bigger than just a foot printing
exercise; it’s about understanding the change that is required in terms of shifting consumption patterns. It is no longer a “green/hippy” thing to do. It will become mandatory in the very near future, once that happens, the biggest (forced) changes will take place. And it will be because it hurts your pocket not to. Emission reduc-tion is both good for the environment and the pocket. Understanding your risks and taking advantage of opportunities is what any business model is about, this time, though it’s including climate change in the equation. There are opportunities and there’s lots of room for innovation. These are exciting times and the better prepared you are, the better you will cope with the change and the more you will succeed.
SUMMARYI urge you to take a look at how you do things in your business and life in general. The “Green Industry” is not so green after all?
Be aware and educate yourself on the RISKS of a changing climate and the relevant legislative requirements.
Be an early mover and take advantage of the opportunities that exist especially within this industry.
155
Figure 5. Global greenhouse gas (GHG) emissions from agriculture (A) and global GHG from agriculture excluding land-use change (B). [Adapted from Bellarby et al. (2008)]
Understanding the Links in the Green Supply Chain
Work together; it is not about competitive advantage or being bet-ter than your neighbour. If everyone works together throughout the supply chain, then the most effective and sustainable change can take place.
In whatever form it comes in — carbon or water footprints — the message is clear — act now and change the way we do things. Slowly but consistently, we can make a difference.
Combined Proceedings International Plant Propagators’ Society, Volume 59, 2009156
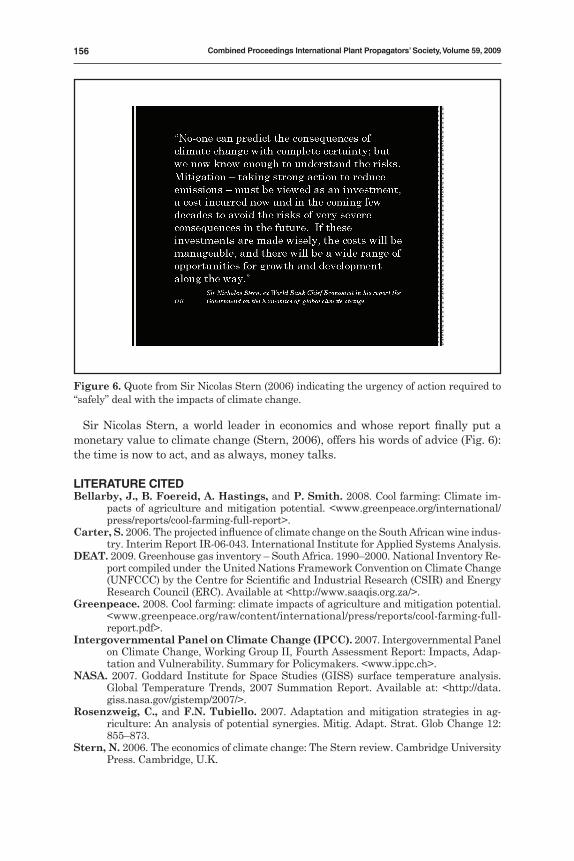
Sir Nicolas Stern, a world leader in economics and whose report finally put a monetary value to climate change (Stern, 2006), offers his words of advice (Fig. 6): the time is now to act, and as always, money talks.
LITERATURE CITEDBellarby, J., B. Foereid, A. Hastings, and P. Smith. 2008. Cool farming: Climate im-
pacts of agriculture and mitigation potential. <www.greenpeace.org/international/press/reports/cool-farming-full-report>.
Carter, S. 2006. The projected influence of climate change on the South African wine indus-try. Interim Report IR-06-043. International Institute for Applied Systems Analysis.
DEAT. 2009. Greenhouse gas inventory – South Africa. 1990–2000. National Inventory Re-port compiled under the United Nations Framework Convention on Climate Change (UNFCCC) by the Centre for Scientific and Industrial Research (CSIR) and Energy Research Council (ERC). Available at <http://www.saaqis.org.za/>.
Greenpeace. 2008. Cool farming: climate impacts of agriculture and mitigation potential. <www.greenpeace.org/raw/content/international/press/reports/cool-farming-full-report.pdf>.
Intergovernmental Panel on Climate Change (IPCC). 2007. Intergovernmental Panel on Climate Change, Working Group II, Fourth Assessment Report: Impacts, Adap-tation and Vulnerability. Summary for Policymakers. <www.ippc.ch>.
NASA. 2007. Goddard Institute for Space Studies (GISS) surface temperature analysis. Global Temperature Trends, 2007 Summation Report. Available at: <http://data.giss.nasa.gov/gistemp/2007/>.
Rosenzweig, C., and F.N. Tubiello. 2007. Adaptation and mitigation strategies in ag-riculture: An analysis of potential synergies. Mitig. Adapt. Strat. Glob Change 12: 855–873.
Stern, N. 2006. The economics of climate change: The Stern review. Cambridge University Press. Cambridge, U.K.
Figure 6. Quote from Sir Nicolas Stern (2006) indicating the urgency of action required to “safely” deal with the impacts of climate change.