understanding the mechanisms of amorphous creep through
TRANSCRIPT
ENG
INEE
RIN
G
Understanding the mechanisms of amorphous creepthrough molecular simulationPenghui Caoa, Michael P. Shorta, and Sidney Yipa,b,1
aDepartment of Nuclear Science and Engineering, Massachusetts Institute of Technology, Cambridge, MA 02139; and bDepartment of Materials Science andEngineering, Massachusetts Institute of Technology, Cambridge, MA 02139
Edited by Sharon C. Glotzer, University of Michigan, Ann Arbor, MI, and approved October 27, 2017 (received for review May 24, 2017)
Molecular processes of creep in metallic glass thin films are sim-ulated at experimental timescales using a metadynamics-basedatomistic method. Space–time evolutions of the atomic strainsand nonaffine atom displacements are analyzed to reveal detailsof the atomic-level deformation and flow processes of amorphouscreep in response to stress and thermal activations. From the sim-ulation results, resolved spatially on the nanoscale and tempo-rally over time increments of fractions of a second, we derive amechanistic explanation of the well-known variation of creep ratewith stress. We also construct a deformation map delineating thepredominant regimes of diffusional creep at low stress and hightemperature and deformational creep at high stress. Our find-ings validate the relevance of two original models of the mech-anisms of amorphous plasticity: one focusing on atomic diffusionvia free volume and the other focusing on stress-induced sheardeformation. These processes are found to be nonlinearly coupledthrough dynamically heterogeneous fluctuations that character-ize the slow dynamics of systems out of equilibrium.
creep | molecular simulation | deformation mechanism | atomisticmodeling | metallic glass
Deformation and flow are fundamental in the rheologicalbehavior of many materials (1–4). For the molecular under-
standing of plastic response under stress (creep), a standingchallenge is to know the details by which the constituent atomsrearrange themselves individually and collectively in a local envi-ronment of stress and temperature. Creep experiments havebeen extensively reported on amorphous materials, includingmetallic glasses and colloidal systems (5–9). Yet, the relationshipbetween stress and temperature effects on creep and the under-lying microscopic processes remains an open question. Theo-retical models have been proposed to describe the mechanismsof molecular deformation and flow responsible for amorphousplasticity. Spaepen (10) considered the distinction betweenhomogeneous and inhomogeneous flows in metallic glasses andintroduced the concept of the local free volume as an orderparameter. In this view, local strain production and dissipa-tion are assumed to be associated with individual atomic jumps.Argon (11) proposed a plastic deformation model of metallicglasses based on the notion of local shear transformations drivenby stress and in the presence of thermal fluctuations. The atomsparticipating in such processes essentially undergo an inelasticshear deformation. Falk and Langer (12) later introduced theterm shear transformation zone (STZ) in interpreting simula-tion results of viscoplastic deformation of amorphous solids. TheSTZ theory was further extended to be capable of describingtemperature- and rate-dependent amorphous plasticity (13, 14).The term STZ has become widely adopted in studies of amor-phous materials. (4, 8, 15–20).
We seek to identify the elementary processes of deforma-tion and flow in amorphous creep through atomistic simulation.A bottleneck well-known in the literature is that the temporalscales relevant to creep are beyond the reach of traditionalmolecular dynamics (MD). To compensate for its inherentlymicroscopic timescales, MD simulations of creep had to resort
to extreme conditions of stress, temperature, and strain rate(21, 22). Here, we implement a metadynamics formulation thatallows transition-state trajectories to be generated on apprecia-bly longer timescales on the order of fractions of seconds. Byanalyzing the distributions of atomic strain and nonaffine particledisplacement, we observe the effects of stress and temperatureon the evolution of activated states at the microscale. We findthat the processes of single-particle diffusion and of shear defor-mation of small clusters of particles are both active in steady-state creep; in particular, their interplay gives rise to a char-acteristic upturn behavior of stress effects on creep rate. Thesimulation results also support a mechanism map showing aregime of low stress and high temperature where diffusionalcreep dominates and a high-stress regime governed by sheardeformation creep. Our findings suggest that, while the two orig-inal models of amorphous plasticity (10, 11) are complementaryin their individual focus, their combined effects need to be ana-lyzed using more fundamental theories capable of treating theeffects of nonlinear feedback.
Simulation Methods and ModelWe consider a model Cu50Zr50 metallic glass system in twodimensions. The atoms interact through a Lennard–Jones poten-tial (23, 24), which has been used to study plastic deforma-tion (25) and thermally activated flows in metallic glass (26).Two amorphous structures with different sizes, 39.5 × 19.7 nm(containing 10,000 atoms) and 62.5 × 31.2 nm (25,000 atoms),are prepared by quenching from a high-temperature liquid state(Materials and Methods has additional details). We apply uniaxialtensile stress to the system and follow the procedure described inMaterials and Methods to simulate the time evolution of creep.
Significance
The individual and collective molecular displacements in anamorphous solid undergoing plastic deformation are simu-lated by an atomistic method that allows incremental motionsto be observed over a time window of fractions of sec-onds. Because the timescale matches well with the condi-tions of experimental measurements, simulation details pro-vide dynamical evidence for the fundamental mechanisms ofamorphous creep. In particular, knowledge of the interplaybetween diffusion (flow) and mechanical deformation pro-cesses enables us to explain the stress and temperature behav-ior of the experimental data as well as the validity of modeldescriptions of molecular mechanisms in terms of spatially andtemporally heterogeneous fluctuations.
Author contributions: P.C. and S.Y. designed research; P.C. performed research; P.C.,M.P.S., and S.Y. analyzed data; and P.C., M.P.S., and S.Y. wrote the paper.
The authors declare no conflict of interest.
This article is a PNAS Direct Submission.
Published under the PNAS license.1To whom correspondence should be addressed. Email: [email protected].
This article contains supporting information online at www.pnas.org/lookup/suppl/doi:10.1073/pnas.1708618114/-/DCSupplemental.
www.pnas.org/cgi/doi/10.1073/pnas.1708618114 PNAS Early Edition | 1 of 6

The algorithms allow us to investigate creep strain evolution andthe corresponding molecular mechanisms at various stresses andtemperatures, in particular at low stress and slow creep rate. Toquantify the atomic-level plastic deformations in creep, we com-pute two local strains: deviatoric strain D2
min and von Mises strainηMises . In addition, we compute nonaffine displacement as a mea-sure of single-particle dynamics. Detailed descriptions of atomicstrains and displacement are discussed in Materials and Methods.We find negligible system size effects on the results; therefore,our discussions will refer to the larger system unless explicitlystated otherwise.
Creep CurvesFig. 1 shows the time development of the system strain deter-mined by metadynamics simulation. The creep curve shows theclassical behavior of three stages of strain evolution. The initialperiod of strain nucleation and distribution, consisting of a steepincrease followed by a gradual approach to saturation, is knownas primary or transient creep. The secondary stage of steady-statecreep is a period of linear strain increase in time. The extentof this stage depends on the combination of applied stress andsystem temperature. For relatively low stresses, the secondarystage may have a considerable extent before the onset of ter-tiary creep, where the strain rate increases without apparent limit(Fig. 2). In the case of Fig. 1, the onset of structural instability ata strain level of ∼2.5% is readily observed. Notice that the rel-evant timescale of creep is of the order of fractions of seconds,comparable with those of laboratory measurements and beyondthe capabilities of traditional MD.
Fig. 2 shows a series of creep curves spanning the stress rangefrom 42 to 258 MPa simulated at a temperature of 0.68Tg . Atlow stresses, one sees only the primary and secondary stages ofcreep during the simulation. For these cases, the creep rate givenby the slope in the secondary stage is sufficiently small that thesystem remains in steady-state creep throughout the simulation.In contrast, for the two highest stresses, one sees the onset oftertiary creep. While our interest is in the mechanisms sustain-ing steady-state creep, nevertheless, it is pertinent to note thattertiary creep will be triggered by the appearance and persistent
Fig. 1. Simulated creep curve: time evolution of system strain ε at stress198 MPa and temperature 0.68Tg. The creep rate ε of the secondary stageis essentially constant and at a minimum. The background colors are drawnschematically to denote the creep rate.
Fig. 2. Simulated creep curves at indicated stress levels at a temperatureof 0.68Tg.
growth of a localized region of high strain, leading to structuralinstability (failure) of the system (a discussion of atomic strainsevolution in creep is in Supporting Information) (8, 27).
Nonaffine Displacement and Deviatoric Strain Distributions(Dynamical Heterogeneities)Fig. 2 indicates that the applied stress has a significant effecton the time evolution of the creep (system-level) strain. Onecan ask for the atomic rearrangements and displacements asso-ciated with the observed deformation. In Fig. 3, we show howthe probability distributions of nonaffine particle displacementδx in the tensile direction vary with stress. Each distributionis seen to be composed of a Gaussian core and exponentiallyvarying wings. This behavior has been observed previously bothin simulations (22, 28) and in experiments (29) of glassy mate-rials close to jamming and glass transitions. They have beeninterpreted as local fluctuations known as dynamical hetero-geneities. Here, as stress increases, we observe that the exponen-tial wings become broader and that a significantly larger fractionof atoms undergoes large displacement. The increasingly morepronounced non-Gaussian behavior can be interpreted as stress-reinforced dynamical heterogeneities. The coexistence of atomsmoving appreciably faster or slower than the average is regardedas a characteristic attribute of space–time fluctuations in drivensystems. From inspection of Fig. 3, one can also see a changein the overall shape of the probability distributions starting from143 MPa.
The nonaffine displacement δx plays the role of a dynami-cal order parameter for single-particle diffusion. Similarly, theatomic strains, ηMises and D2
min , could be associated with localcollective deformation. We will focus on D2
min as a more discrim-inating indicator for local plastic rearrangement (a discussion ofD2
min and ηMises is in Supporting Information). Fig. 4 shows thevariation with stress of the distributions of D2
min . The distribu-tions of small D2
min follow a power law decay with different expo-nents, and at large D2
min , the distributions show a fall off that isdecidedly slower for larger stress, implying more numerous acti-vations of high-strain sites. Fig. 4, Inset shows that the number ofatoms participating in large strain deformation indeed increasessharply with increasing stress. Corresponding to the stress regimeseparation noted in Fig. 3, an appreciable increase in the number
2 of 6 | www.pnas.org/cgi/doi/10.1073/pnas.1708618114 Cao et al.

ENG
INEE
RIN
G
Fig. 3. Statistical distributions of nonaffine particle displacement p(δx) at0.68Tg and the various stresses indicated. The solid line represents the fittedGaussian function, whereas the dashed line is exponential function used toguide the eye. The displacements δx are measured with a time interval ofδt = 0.01 s.
of atoms involved in shear transformations is seen starting at astress of 143 MPa. This suggests that stress plays a fundamentalrole in the physical manifestation of deformation and flow behav-ior in driven systems.
To see what molecular mechanisms could be associated withFigs. 3 and 4, we show in Fig. 5 the local space–time distribu-tions. The spatial maps are resolved at the nanoscale and tempo-rally measured over a time interval of 0.01 s. Maps of nonaffinedisplacements δx are shown in Fig. 5 A and B. Correspondingly,maps of D2
min (local deformation) are seen in Fig. 5 C and D. Fig.5 A and C refers to low (64 MPa) stress, and Fig. 5 B and D forhigh (258 MPa) stress.
In Fig. 5A, the features of the nonaffine displacement mapcan be essentially attributed to thermally activated atomic dif-fusion, as initially proposed by Spaepen (10). It could serve asthe baseline for measuring responses through single-particle dis-placements at higher stress. Fig. 5B indicates that the displace-ment magnitude of the sites of high mobility is about a factor ofthree larger than the displacements at low stress. Moreover, wesee the presence of bidirectional flow (red–blue interface in Fig.5B), as several such active zones appear along the 45◦ direction.When looking at Fig. 5D, these activated events appear as localstrain bursts, a striking effect of stress-induced deformation. Weregard this to be a specific simulation result, obtained at a physi-cally meaningful timescale, that illustrates the synergistic effectsof stress activation.
In Fig. 5C, we see little or no local shear deformation activ-ity, which suggests that thermally diffusional rearrangements atthe temperature of the simulation produce relatively small localplastic strain. These weak events seem quite random in space anddo not align in any particular direction. We conclude that, at lowstress, creep proceeds mostly by single-particle diffusion ratherthan cooperative atom deformation. However, at high stress, Fig.5 B and D implies that diffusive and deformation processes areboth activated and coupled through heterogeneous stress fieldsin the driven system.
We apply the above findings to predict the variation of creeprate with tensile stress, a behavior of fundamental interest inthe mechanics and physics of creep (30, 31). At very low stress,we expect the effects of thermal activation to dominate, which
should lead to a mild increase of creep rate with stress. As stressincreases, both flow and deformation mechanisms contributesmoothly until the stress exceeds a threshold, at which point ther-mal and stress activations accelerate. The significant increase inshear transformation deformation events, shown in Fig. 4, Insetand the gap noted in Figs. 3 and 4, are hallmarks of a threshold(cross-over) behavior that is widely observed in experiments (Fig.6B). We consider this stress threshold to reveal a regime of non-linear response, which has not been previously interpreted at themolecular level.
Creep Rate UpturnThe simulated creep curves allow us to determine a steady-state creep rate at each stress. Plotting the results in Fig. 6A,we see a bimodal behavior in the monotonic variation of creeprate ε with stress σ, a behavior visible in both the large andsmall systems. At low stress, ε is characterized by a creeprate slope of n ∼ 1.5, where n is known as the stress expo-nent. At high stress, n increases to ∼5. Notice that the stressvalue for the change in index n coincides with the stress gapmentioned in the discussions of Figs. 3 and 4. The transitionin creep rate behavior is well-known in experiments on dif-ferent materials (32–34). It is generally understood to signifythermal activation processes at low stress, changing over tostress activation for reasons that have not yet been resolvedparticularly regarding the roles of atomic diffusion and sheardeformation.
To compare our results with experiments, the simulation dataare shown again in Fig. 6B along with two sets of measurements(9, 33). Reduced stress σ/σ0 and strain rate ε/ε0 are plotted,where σ0 and ε0 are threshold values for creep rate upturn. Theupturn in creep rate indicated by the simulation data matcheswell with the experiments. Our discussions concerning Figs. 3–5 lead us to interpret the creep rate behavior as evidence of thenonlinear response involving the coupling of the atomic diffusionand shear transformation deformation.
Creep Mechanism MapThe creep simulations that we have conducted cover three tem-peratures, 0.57, 0.68, and 0.91Tg , and stress values ranging
Fig. 4. Statistical distributions of deviatoric strain p(D2min) at a temperature
of 0.68Tg and the various stresses indicated. The strains are calculated withthe time interval δt = 0.01 s. Inset shows variation of the number of sheartransformation deformation (STD) atoms with strain that is larger than 0.05.
Cao et al. PNAS Early Edition | 3 of 6

0.15
-0.15
0.05
-0.05
displacement
displacement
BA
C D
strain
strain
Fig. 5. Spatial distributions of nonaffine dis-placement (A and B) and of deviatoric strain (Cand D). All measures are time incremental takenover a time interval of 0.01 s. Atoms are coloredaccording to the magnitude of their displace-ments or strains. At each level, A and C denotelow stress (64 MPa), and B and D denote highstress (258 MPa).
from 15 to 290 MPa. At each temperature, a stress-dependentcreep rate (the rate for steady-state creep) curve was obtained,from which the stress exponent n was determined. The stress–temperature values of our simulations are plotted in Fig. 7 usingsquares and circles to denote whether the corresponding value ofn is ∼1 or > 5, respectively. Fig. 7 is effectively a creep mecha-nism map for our model metallic glass. It delineates the stress–temperature regimes, where single-particle diffusion and sheartransformation deformation are the limiting behaviors.
Looking at the simulation data across the temperature range,one can visualize a mechanism boundary separating the map intotwo domains, where either diffusion or shear deformation pre-dominates. To motivate such a boundary, we recall well-knownempirical expressions based on transition-state theory for thelimiting behavior of strain rate in amorphous systems. At lowstress, the creep rate ε is written in the form (10)
ε= γ0 · exp(−Qd
kT)Vd
kTσ, [1]
where Qd and Vd are the activation energy and activation vol-ume for diffusion, respectively. This is derived based on the freevolume diffusion model. At high stress, a more appropriate formis (8, 11)
ε= γ0 · exp(−Qst −σVst
kT
), [2]
where the subscript st denotes shear transformation. This is com-patible with the shear transformation deformation model. Set-ting Eq. 1 equal to Eq. 2 and treating these activation parametersnumerically, we find the locus of (σ, T) values for the mechanismboundary to be essentially a straight line: σ(T )= a + bT (Sup-porting Information has details). The red dashed curve in Fig. 7 isdrawn having this functional form and adjusted to separate thegroups of squares and circles. Thus, the simulation data are ableto accommodate a boundary that would have the two limitingbehaviors described by Eqs. 1 and 2.
For experimental validation, we show in Fig. 7 mechanicaldeformation measurements on a five-component metallic glass(9). Except for an overall shift, the experimental and simula-tion results both display the same predominant domains of dif-fusional and deformational creep. One can offer only qualitativereasons why a comparison between this simulation and experi-ment should be considered meaningful. For example, differencesbetween the simulation system and the experimental samplescan be quite significant. These could arise from their respectivepreparations, such as cooling rate and casting defects and sur-face polish imperfections. Another factor is that an idealized 2Dbinary mixture model is being compared with measurements on
a 3D five-component material. Although a 2D model could becapable of capturing aspects of thermally activated diffusion andstress-induced shear transformation processes, one could arguethat the system dimensionality could affect activation energy
A
B
Fig. 6. (A) Stress dependence of creep rate from simulations with two dif-ferent system sizes of 25,000 and 10,000 atoms. (B) Stress variation of creeprate. The two sets of experimental data 1 (crosses) and 2 (triangles) areadapted from refs. 9 and 33, respectively; σ0 and ε0 are threshold valuesin the creep rate–stress curve.
4 of 6 | www.pnas.org/cgi/doi/10.1073/pnas.1708618114 Cao et al.

ENG
INEE
RIN
G
barriers of elementary processes, which in turn, could influencethe creep rate. In addition, the cooling rate in sample prepara-tion will affect the underlying potential energy landscape, andtherefore the creep rate response. Indeed, we have performedadditional simulations at a cooling rate three orders of magni-tude higher and found the mechanism boundary to shift down-ward in a manner that brings experiments and simulations inFig. 7 closer together (a discussion of cooling rate is in Support-ing Information). Other than sample preparation, the shift of themechanism boundary also may be rationalized by noting that dif-ferent spatial correlation lengths are involved in single-particlejumps vs. collective distortions of particle clusters, the formerbeing more short-ranged and therefore less cooling-rate sensi-tive than the latter (35).
DiscussionIn this work, we relate the simulation results to the mecha-nisms proposed by Spaepen (10) and by Argon (11), becauseeach provides a clear-cut physical description for identifying themolecular processes governing creep under varying stress andtemperature conditions. An appropriate next step would be toconnect the simulation results to theoretical analysis, such asthe STZ concept of plastic deformation in amorphous materi-als. The term STZ, initially conceived to describe a transientflow defect, has evolved as a statistical thermodynamics-basedtheoretical description of system-level response in a thermal andstress environment. The original theory (12) has been reformu-lated (14), reviewed (36), and updated (37). At the this time,STZ seems to play two different roles: a mechanism combiningthe ideas of Spaepen (10) and Argon (8, 11, 38) or a theoreticalframework for interpreting experiments or simulations (39, 40).
In discussing Fig. 6, we have regarded the creep rate upturnas signifying the synergistic actions involving single-particle dif-fusion and shear-induced deformation. One can imagine quan-tifying this interpretation by using STZ theory to explicitly cal-culate the creep rate response to stress. Recently, Langer (37)
Fig. 7. Creep mechanism map showing normalized stress–temperatureregions of dominance; µ represents the elastic modulus of materials. Sim-ulation data are denoted as circles (n< 2) and squares (n> 5). The bound-ary separating the predominant shear transformation deformation (STD)mechanism from atomic diffusion mechanism regions is indicated by the reddashed curve. Also shown are experimental data (9) with diamonds (n> 5)and crosses (n ∼ 1).
has reported a study of a similar problem, in which the density ofSTZs and an effective thermodynamic temperature were intro-duced as dynamical variables in a set of coupled equations ofmotion with a stress-dependent deformation rate.
We believe that the increase of the stress exponent from approx-imately two to five delineates a regime of nonlinear response inthe rheological behavior of amorphous materials, a consequenceof the nonlinear coupling between atomic diffusion and shear-induced deformation. More generally, it indicates an interplaybetween thermal and stress-activated processes, involving loadingeffects, thermal noise, and stress-induced fluctuations (41).
In summary, we present findings to quantify the molecularmechanisms of steady-state creep in a model metallic glass. Atlow stress and high temperature, the dominant mechanism isobserved to be thermally activated particle flow, while at highstress, the mechanism is a more complex process of stress-induced enhanced local shear deformation and atomic diffu-sion. Taking these processes together leads to an interpretationof the experimentally observed stress and temperature behav-ior of amorphous creep as well as a unifying picture of single-particle diffusion and collective atom rearrangements. This per-spective motivates revisiting the existing notion of dynamicalheterogeneities (42–44) and a variant of self-organization inslowly driven threshold systems (45) in the spirit of assessingvarious theoretical frameworks, such as the STZ theory (37),expanded mode-coupling formalism (46), mean field approacheswith weakening mechanism (47), and time-dependent transitiontheory modeling (48).
Materials and MethodsModel Metallic Glass. To prepare the metallic glass thin film configura-tion for atomistic simulations, we quench from a high-temperature, well-equilibrated liquid state at 0.14 K/ps at zero pressure using MD with peri-odic boundary conditions in all directions. We observe an inflection point inthe volume–temperature curve at 440 K, which is regarded as the glass tran-sition temperature Tg (Supporting Information). To model a uniaxial stressexperiment, two free surfaces in the y-direction are created by removingperiodic boundary conditions, so that the stress is free in that direction. Weperform another 400-ps MD simulation to relax the system to zero averagestress. The mechanical properties of the thin film, such as elastic modulusand yield strength, are then characterized (Supporting Information).
Metadynamics Simulation of Creep. To simulate creep using a metadynamicsalgorithm, we apply a prescribed uniaxial tensile stress to the system andexecute the following steps.
i) Perform energy minimization on the relaxed system to bring it to thenearest local energy minimum.
ii) Apply the autonomous basin climbing (ABC) algorithm (49, 50) toobtain the transition-state pathway and determine the neighboringlocal energy minimum state.
iii) Compare the internal stress of the new state with the prescribed tensilestress. If the two stresses deviate by more than 1%, perform step iv;otherwise, go back to step ii.
iv) Perform cell relaxation in the presence of the external stress. The atomsare rescaled to new positions whenever the size of simulation cell ischanged, and the final configuration converges to a new local minimum.
The output of ABC is a set of transition-state pathway trajectories, eachbeing an ordered sequence of energy minima and saddle points. The sys-tem evolution is then determined by examining the newly sampled config-urations of the local energy minima. The activation time of each evolution
step is estimated through transition-state theory, ∆ti = [v0 exp (−∆EikBT )]
−1,
with the attempt frequency v0 typically taken to be 1012 s−1. ∆Ei is theenergy barrier of activation path i. ∆Ei could be overestimated by ABC, andtherefore, we use the nudged elastic band method (51) to refine the barrierconnecting the two neighboring energy minima. The metadynamics simu-lation is terminated when either tertiary failure occurs or 15,000 activationpathways have been explored.
Atomic-Level Strain and Nonaffine Displacement. We consider two atomic-level strains, the deviatoric strain D2
min and the local von Mises strain ηMises ,
Cao et al. PNAS Early Edition | 5 of 6

as measures of local plastic deformation (12, 52). Imagine that a regionsurrounding an atom undergoes a strain deformation during a time intervalδt. The deviatoric strain is defined as
D2min (δt) =
n∑i=1
[Xi (t + δt) −X0 (t + δt) − J× (Xi (t) −X0 (t))]2, [3]
where X (t) is the reference configuration at time t, X (t + δt) is the currentconfiguration at time t + δt, and the index i runs over all atoms within theinteraction cutoff relative to the reference position of atom zero. J is theaffine deformation tensor that transforms a nearest neighbor separation,Xi (t) −X0 (t), to what would be expected under an affine deformation.The deformation tensor J is determined by minimizing D2
min, with the min-imum value being the atomic-level deviatoric strain. For each J, a Greenstrain tensor η can be written as η = 1/2(J • JT − I). The local atomic straininvariant ηMises in two dimensions is computed by
ηMises =
√η2
xy +η2
xx + η2yy − η2xxη
2yy
3. [4]
Note that ηMises is directly derived from J, while D2min is a measure of the
deviation from deformation tensor J. The atomic strains ηMises and D2min are
computed by considering all of the n neighboring atoms. Both can serve asan indicator for cooperative local rearrangement.
The nonaffine displacement is useful for tracking single-atom dynamics.For a time interval (t, t + δt), it is defined as
δuα(t, t + δt) = Xα(t + δt)− FαβXβ (t), [5]
where the Greek indices α and β indicate the Cartesian components andthe deformation gradient F is related to the system-level creep strain εαβ
by Fαβ = 1 + [εαβ (t + δt)− εαβ (t)] = 1 + ∆εαβ (t, t + δt). In the simulation,the nonaffine displacement in the tensile direction δx is calculated for char-acterization of single-atom dynamics.
ACKNOWLEDGMENTS. We thank A. S. Argon, J. S. Langer, and K.Kamrin for discussions, and the Massachusetts Institute of Technol-ogy (MIT) Nuclear Science and Engineering Department for computa-tional resources. P.C. was supported by US Department of Energy (DOE)Grant DE-NE0008450. M.P.S. was supported by National Science Foun-dation CAREER Grant DMR-1654548. S.Y. was supported by DOE-BasicEnergy Sciences Grant DE-SC0002633 and the Kuwait-MIT Center Signa-ture Project. S.Y. is a founding member of the MIT Concrete Sustainabil-ity Hub.
1. Mason T, Bibette J, Weitz D (1996) Yielding and flow of monodisperse emulsions. JColloid Interface Sci 179:439–448.
2. Johnson WL, Lu J, Demetriou MD (2002) Deformation and flow in bulk metallic glassesand deeply undercooled glass forming liquids-a self consistent dynamic free volumemodel. Intermetallics 10:1039–1046.
3. Debregeas G, Tabuteau H, Di Meglio JM (2001) Deformation and flow of a two-dimensional foam under continuous shear. Phys Rev Lett 87:178305.
4. Schall P, Weitz DA, Spaepen F (2007) Structural rearrangements that govern flow incolloidal glasses. Science 318:1895–1899.
5. Krisponeit JO, et al. (2014) Crossover from random three-dimensional avalanches tocorrelated nano shear bands in metallic glasses. Nat Commun 5:3616.
6. Huang Y, Shen J, Chiu Y, Chen J, Sun J (2009) Indentation creep of an Fe-based bulkmetallic glass. Intermetallics 17:190–194.
7. Siebenburger M, Ballauff M, Voigtmann T (2012) Creep in colloidal glasses. Phys RevLett 108:255701.
8. Schuh CA, Hufnagel TC, Ramamurty U (2007) Mechanical behavior of amorphousalloys. Acta Mater 55:4067–4109.
9. Lu J, Ravichandran G, Johnson WL (2003) Deformation behavior of the Zr 41.2 Ti13.8 Cu 12.5 Ni 10 Be 22.5 bulk metallic glass over a wide range of strain-rates andtemperatures. Acta Mater 51:3429–3443.
10. Spaepen F (1977) A microscopic mechanism for steady state inhomogeneous flow inmetallic glasses. Acta Metall 25:407–415.
11. Argon AS (1979) Plastic deformation in metallic glasses. Acta Metall 27:47–58.12. Falk ML, Langer JS (1998) Dynamics of viscoplastic deformation in amorphous solids.
Phys Rev E 57:7192–7205.13. Falk M, Langer J, Pechenik L (2004) Thermal effects in the shear-transformation-
zone theory of amorphous plasticity: Comparisons to metallic glass data. Phys RevE 70:011507.
14. Bouchbinder E, Langer J (2009) Nonequilibrium thermodynamics of driven amor-phous materials.II. Effective-temperature theory. Phys Rev E 80:031132.
15. Mayr S (2006) Activation energy of shear transformation zones: A key for understand-ing rheology of glasses and liquids. Phys Rev Lett 97:195501.
16. Tanguy A, Leonforte F, Barrat JL (2006) Plastic response of a 2D Lennard-Jones amor-phous solid: Detailed analysis of the local rearrangements at very slow strain rate. EurPhys J E 20:355–364.
17. Pan D, Inoue A, Sakurai T, Chen M (2008) Experimental characterization of sheartransformation zones for plastic flow of bulk metallic glasses. Proc Natl Acad Sci USA105:14769–14772.
18. Cao P, Park HS, Lin X (2013) Strain-rate and temperature-driven transition in the sheartransformation zone for two-dimensional amorphous solids. Phys Rev E 88:042404.
19. Greer A, Cheng Y, Ma E (2013) Shear bands in metallic glasses. Mater Sci Eng R Rep74:71–132.
20. Cao P, Lin X, Park HS (2014) Surface shear-transformation zones in amorphous solids.Phys Rev E 90:012311.
21. Yamakov V, Wolf D, Phillpot SR, Mukherjee AK, Gleiter H (2002) Dislocation processesin the deformation of nanocrystalline aluminium by molecular-dynamics simulation.Nat Mater 1:45–49.
22. Sentjabrskaja T, et al. (2015) Creep and flow of glasses: Strain response linked to thespatial distribution of dynamical heterogeneities. Sci Rep 5:11884.
23. Kobayashi S, Maeda K, Takeuchi S (1980) Computer simulation of deformation ofamorphous Cu57Zr43. Acta Metall 28:1641–1652.
24. Deng D, Argon A, Yip S (1989) A molecular dynamics model of melting and glasstransition in an idealized two-dimensional material I. Philos Trans R Math Phys EngSci 329:549–573.
25. Schuh CA, Lund AC (2003) Atomistic basis for the plastic yield criterion of metallicglass. Nat Mater 2:449–452.
26. Rodney D, Schuh C (2009) Distribution of thermally activated plastic events in a flow-ing glass. Phys Rev Lett 102:235503.
27. Cao A, Cheng Y, Ma E (2009) Structural processes that initiate shear localization inmetallic glass. Acta Mater 57:5146–5155.
28. Chaudhuri P, Berthier L, Kob W (2007) Universal nature of particle displacements closeto glass and jamming transitions. Phys Rev Lett 99:060604.
29. Weeks ER, Crocker JC, Levitt AC, Schofield A, Weitz DA (2000) Three-dimensionaldirect imaging of structural relaxation near the colloidal glass transition. Science287:627–631.
30. Cottrell AH (1953) Dislocations and Plastic Flow in Crystals (Clarendon, Oxford).31. Nabarro FRN, De Villiers F (1995) Physics of Creep and Creep-Resistant Alloys (CRC,
Boca Raton, FL).32. Boyle JT, Spence J (2013) Stress Analysis for Creep (Elsevier, Amsterdam).33. Nieh T, Wadsworth J (2006) Homogeneous deformation of bulk metallic glasses. Scr
Mater 54:387–392.34. Klueh R (2005) Elevated temperature ferritic and martensitic steels and their applica-
tion to future nuclear reactors. Int Mater Rev 50:287–310.35. Cheng Y, Ma E (2011) Atomic-level structure and structure–property relationship in
metallic glasses. Prog Mater Sci 56:379–473.36. Falk ML, Langer JS (2011) Deformation and failure of amorphous, solidlike materials.
Annu Rev Condens Matter Phys 2:353–373.37. Langer J (2015) Shear-transformation-zone theory of yielding in athermal amorphous
materials. Phys Rev E 92:012318.38. Hufnagel TC, Schuh CA, Falk ML (2016) Deformation of metallic glasses: Recent devel-
opments in theory, simulations, and experiments. Acta Mater 109:375–393.39. Langer J (2017) Yielding transitions and grain-size effects in dislocation theory. Phys
Rev E 95:033004.40. Kamrin K, Bouchbinder E (2014) Two-temperature continuum thermomechanics of
deforming amorphous solids. J Mech Phys Sol 73:269–288.41. Chattoraj J, Caroli C, Lemaıtre A (2010) Universal additive effect of temperature on
the rheology of amorphous solids. Phys Rev Lett 105:266001.42. Kob W, Donati C, Plimpton SJ, Poole PH, Glotzer SC (1997) Dynamical heterogeneities
in a supercooled Lennard-Jones liquid. Phys Rev Lett 79:2827–2830.43. Hoffmann S, et al. (2000) Origin of dynamic heterogeneities in miscible polymer
blends: A quasielastic neutron scattering study. Phys Rev Lett 85:772–775.44. Becker T, Smith JC (2003) Energy resolution and dynamical heterogeneity effects
on elastic incoherent neutron scattering from molecular systems. Phys Rev E 67:021904.
45. Jensen HJ (1998) Self-Organized Criticality: Emergent Complex Behavior in Physicaland Biological Systems (Cambridge Univ Press, Cambridge, UK), p 126.
46. Gruber M, Abade GC, Puertas AM, Fuchs M (2016) Active microrheology in a colloidalglass. Phys Rev E 94:042602.
47. Antonaglia J, et al. (2014) Bulk metallic glasses deform via slip avalanches. Phys RevLett 112:155501.
48. Fan Y, Yildiz B, Yip S (2013) Analogy between glass rheology and crystal plasticity:Yielding at high strain rate. Soft Matter 9:9511–9514.
49. Kushima A, et al. (2009) Computing the viscosity of supercooled liquids. J Chem Phys130:224504.
50. Cao P, Li M, Heugle RJ, Park HS, Lin X (2012) A self-learning metabasin escapealgorithm and the metabasin correlation length of supercooled liquids. Phys Rev E86:016710.
51. Henkelman G, Uberuaga B, Jonsson H (2000) A climbing image nudged elastic bandmethod for finding saddle points and minimum energy paths. J Chem Phys 113:9901–9904.
52. Shimizu F, Ogata S, Li J (2007) Theory of shear banding in metallic glasses and molec-ular dynamics calculations. Mater Trans 48:2923–2927.
6 of 6 | www.pnas.org/cgi/doi/10.1073/pnas.1708618114 Cao et al.

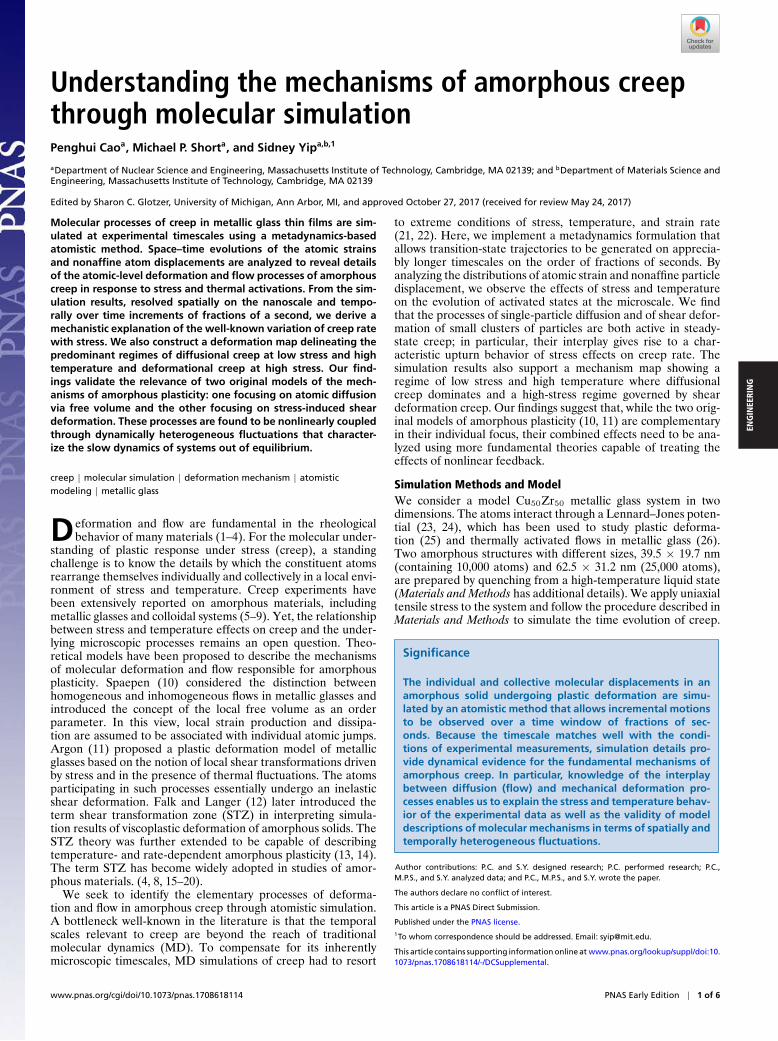
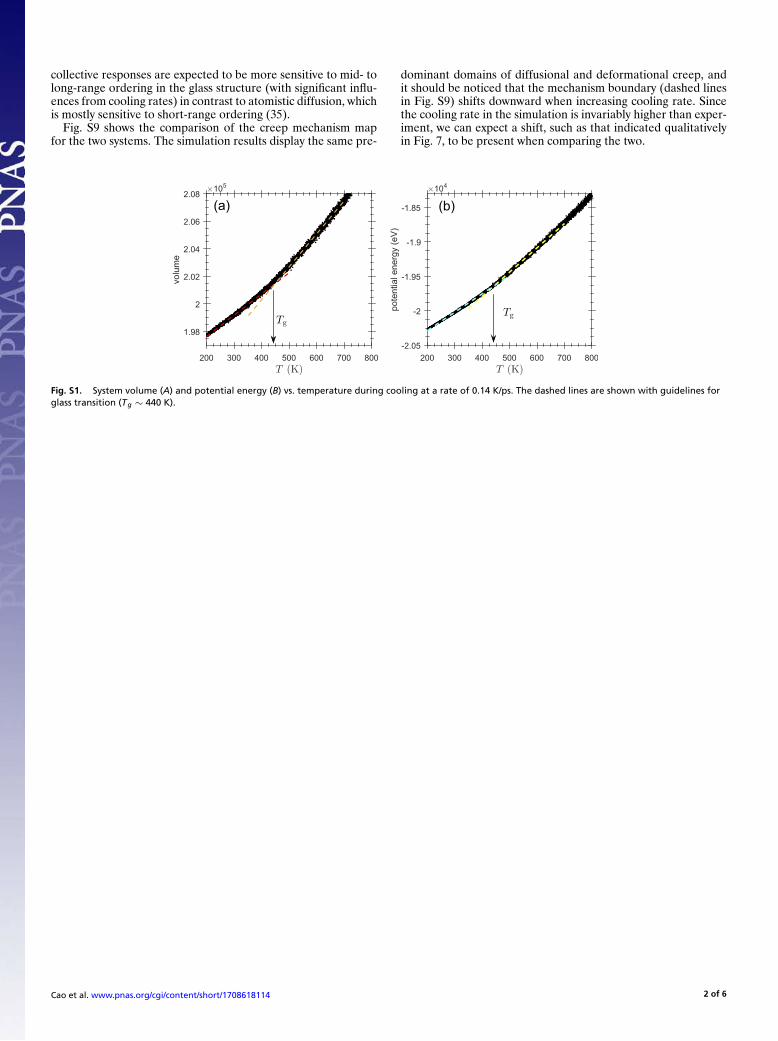
Supporting InformationCao et al. 10.1073/pnas.1708618114SI Characterization of Model Metallic GlassWe estimate the glass transition temperature of the model metal-lic glass by looking at the volume and potential energy changesduring cooling. The high-temperature liquid is quenched at zeropressure and a cooling rate of 0.14 K/ps. In Fig. S1A, we plot sys-tem volume as a function of temperature at constant zero pres-sure. An apparent glass transition temperature of Tg ∼ 440 K isobserved from the cooling curve. Similarly, the transition tem-perature is also seen in the potential energy vs. temperaturebehavior as shown in Fig. S1B. An example of quenched metallicglass structure is shown in Fig. S2.
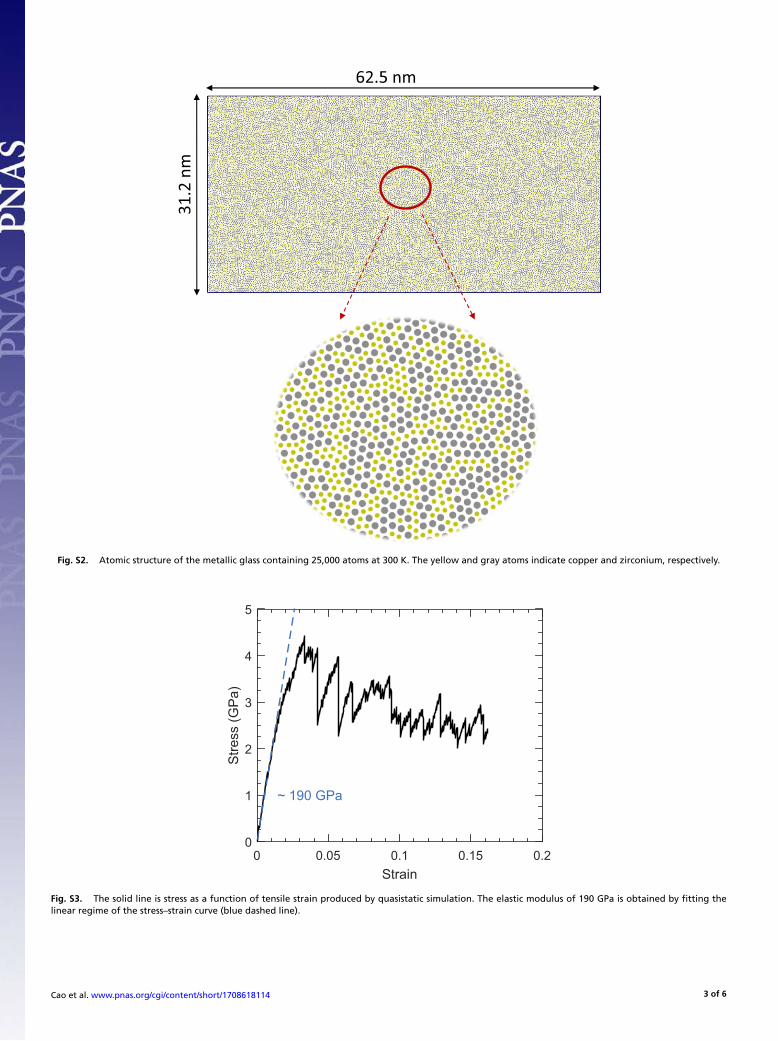
The mechanical properties of the metallic glass, such asYoung’s modulus and yield stress, are calculated using conven-tional quasistatic tension simulation. A small strain increment of10−4 is applied in the horizontal direction, and potential energyminimization is performed at the fixed strain. We repeat theprocedure until 16% tensile strain. Fig. S3 presents the stressand strain behavior of the model metallic glass. The stress-straincurve shows an essentially linear regime followed by plastic yield-ing at 4.3 GPa and a subsequent plastic flow regime. We fit theelastic part of the curve. From the slope we extract a modulus∼190 GPa.
SI Evolution of Atomic Strains During Three Stages of CreepFrom the corresponding atomic configurations along the evo-lution trajectory, we extract details of the collective rearrange-ments in the different creep stages. An example of the spatialdistribution of local atomic strains is shown in Fig. S4. Eachpanel shows the cumulative strains from the start of simulationup to the time indicated. A shear transformation deformation(STD) event is identified by a local strain measure of signifi-cant magnitude. Two strain measures are shown in Fig. S4: thevon Mises strain ηMises and deviatoric strain D2
Min . Comparisonwith the strain evolution through the three stages of creep showsclearly the behavior of STD. In the primary stage (less than 1%strain), one sees only a few events appearing randomly. In thesecondary stage (around 2% strain), shear transformations occurin sufficient numbers that different sites begin to interact witheach other. At about 3% strain (tertiary stage), an incipient local-ized structure spanning the entire system can be observed. Closercomparison of the two strain measures shows the ηMises distribu-tion to be relatively more continuous and smooth. Since we areinterested in identifying the plastic deformation mechanisms, wewill focus on D2
Min as the more discriminating indicator.
SI Determination of Mechanism Boundary on Creep MapDiffusional Flow (High T , Low σ). Let us define a parameter Qd,representing the activation barrier for atom diffusion at zeroexternal force. When a tensile stress σ is applied, the forwardactivation barrier becomes smaller than the backward barrier.The atomic diffusion is biased in the tensile direction, and for-ward diffusion is much faster, which results in driven diffusionflow. At steady-state condition, the creep rate ε can be writtenas (10)
ε= γ0exp(− Qd
kT
)sinh
(σVd
KT
), [S1]
where γ0 is the numerical factor and Vd is the activation volume.At high temperature and low stress (σVd �KT ), the aboveequation becomes
εd = γ0exp(− Qd
kT
)σVd
kT. [S2]
The creep rate ε is linearly proportional to stress σ, indicatingNewtonian fluid behavior at the limiting high-temperature andlow-stress condition.
STD (Low T , High σ). The shear transformation operation is themechanism occurring at low temperature and high stress. Wedefine activation barrier Qst for a shear transformation nucle-ation at zero applied stress. At finite external stress, the activa-tion barrier is a decreasing function of stress Q =Qst −σVst ,where Vst is activation volume of shear transformation (8, 11).The strain rate can be written as
εst = γ0 exp
(− Qst −σVst
kT
). [S3]
Determine the Mechanism Boundary. The steady-state strain ratesare described in Eqs. 2 and 3 by two atomistic mechanisms:atomic diffusion and STD. Each mode determines the defor-mation rate at certain temperature and stress conditions. Wedetermine the mechanism boundary between diffusional flowand STD creep by setting εd(T , σ)= εst(T , σ).
Let us first look at how to determine a mechanism bound-ary for a case of constant temperature. Assuming the activationenergy Qd =1, kT = 0.05, and prefactor γ0 =1 of Eq. 2, we areable to calculate εd as a function σVd (circles shown in Fig.S5). Computing the strain rate εst in Eq. 3 requires the sheartransformation activation energy Qst . Since we are interestedin εst = εd , Qst is treated parametrically in a numerical analy-sis. We find that, when Qst =1.051, the εst (squares in Fig. S5) isstarting to touch εd . We then determine the cross point, showingthe boundary of two mechanisms to be σV =0.054.
Similarly, we calculate the mechanism boundaries at differ-ent temperatures, which are shown in Fig. S6. As tempera-ture increases, the critical stress points determining the mech-anism cross-over also increase. We plot the values of thecritical stress as a function of temperature in Fig. S7 and findthat the calculated boundary is a linear line. Thus, the mecha-nism boundary is determined by the two limiting mechanisms:high T and low σ diffusion flow and the STD occurring at lowT and high σ. It separates the stress–temperature map into tworegimes, in which one or the other mechanism predominates.
SI Discussion of Cooling Rate Effects on Creep MechanismBoundaryIt is known the potential energy landscape of glasses dependson the cooling rate, which in turn, can influence their creepbehavior. To understand the cooling rate effects, we prepareanother system of 25,000 atoms at a much higher rate of140 K/ps, three orders faster in comparison with 0.14 K/ps. Wefollow the same procedure in applying tensile stress to the sys-tem and measuring steady-state creep rate ε at various stresses.Fig. S8 presents ε as a function of stress for the two systems. Wesee the same bimodal behavior in the variation of creep rate εwith stress σ for both systems, implying that the deformationaland diffusional creep mechanisms are also operating in the high-cooling rate system. It is worth noting that the characteristicstress value for the change in index n at the high cooling rateis smaller than that at the low cooling rate. This implies that alower characteristic (cross-over) stress is involved in the creeprate upturn at a higher cooling rate. Fig. S8 also indicates thatcreep rates in a high-stress region, associated with STD, are moresensitive to the cooling rate than those in a low-stress region,associated with atomistic diffusion. This is reasonable, since
Cao et al. www.pnas.org/cgi/content/short/1708618114 1 of 6
collective responses are expected to be more sensitive to mid- tolong-range ordering in the glass structure (with significant influ-ences from cooling rates) in contrast to atomistic diffusion, whichis mostly sensitive to short-range ordering (35).
Fig. S9 shows the comparison of the creep mechanism mapfor the two systems. The simulation results display the same pre-
Fig. S1. System volume (A) and potential energy (B) vs. temperature during cooling at a rate of 0.14 K/ps. The dashed lines are shown with guidelines forglass transition (Tg ∼ 440 K).
dominant domains of diffusional and deformational creep, andit should be noticed that the mechanism boundary (dashed linesin Fig. S9) shifts downward when increasing cooling rate. Sincethe cooling rate in the simulation is invariably higher than exper-iment, we can expect a shift, such as that indicated qualitativelyin Fig. 7, to be present when comparing the two.
Cao et al. www.pnas.org/cgi/content/short/1708618114 2 of 6
62.5 nm
mn 2.13
Fig. S2. Atomic structure of the metallic glass containing 25,000 atoms at 300 K. The yellow and gray atoms indicate copper and zirconium, respectively.
Strain0 0.05 0.1 0.15 0.2
Stre
ss (G
Pa)
0
1
2
3
4
5
~ 190 GPa
Fig. S3. The solid line is stress as a function of tensile strain produced by quasistatic simulation. The elastic modulus of 190 GPa is obtained by fitting thelinear regime of the stress–strain curve (blue dashed line).
Cao et al. www.pnas.org/cgi/content/short/1708618114 3 of 6

Fig. S4. Spatial distribution of ηMises (A) and D2Min (B) during three stages of creep: primary (t = 0.005 s, ε ∼ 0.8% ), secondary (t = 0.064 s, ε ∼ 2% ), and
tertiary (t = 0.12 s, ε ∼ 3% ). The atomic strains shown are cumulative results by taking the initial configuration to be the reference. The applied stress is198 MPa, and temperature is T = 0.68Tg. The corresponding creep curve is shown in Fig. 1.
Fig. S5. Theoretically predicted stress-dependent strain rate at temperature kT = 0.05. The circles are calculated values using Eq. S2, while the squares presentstrain rate of Eq. S3. The cross point is the mechanism boundary, and the red solid line represents the strain rate variation with stress endorsed by mechanismcross-over.
Cao et al. www.pnas.org/cgi/content/short/1708618114 4 of 6

Fig. S6. Theoretically predicted stress-dependent strain rate at different temperatures. The critical stress (mechanism boundary; red dots) increases withincreasing temperature.
Temperature0 0.2 0.4 0.6 0.8 1
Stre
ss
10-2
10-1
100
101
Temperature0 0.5 1
Stre
ss
0
0.5
1
shear transf.(low T, high )
diffusion flow (high T, low )
Fig. S7. Theoretically predicted creep mechanism map. The dashed line σ (T)= aT indicates the mechanism boundary separating the two limiting behaviors:diffusion flow and shear transformation deformation. Inset shows the boundary σ(T) in linear scales.
Cao et al. www.pnas.org/cgi/content/short/1708618114 5 of 6

Fig. S8. Stress dependence of steady-state ε from two simulation systems prepared at different cooling rates.
Fig. S9. Creep mechanism map obtained for two different cooling rates. The black dashed line represents mechanism boundaries for the low cooling rateof 0.14 K/ps, while the blue dashed line denotes the high cooling rate of 140 K/ps.
Cao et al. www.pnas.org/cgi/content/short/1708618114 6 of 6