understanding the real performance of geotechnical
TRANSCRIPT

RIVISTA ITALIANA DI GEOTECNICA 4/2014
Understanding the real performance of geotechnical structures using an innovative fibre optic distributed strain measurement technology
Kenichi Soga*
SummaryField monitoring is essential in geotechnical engineering in order to ensure that (i) the design is sound, (ii) the construction is
executed safely, and (iii) the geotechnical structure we built satisfies the specifications set by the clients. It has to be part of gaining engineering experience by comparing the actual behaviour with the design prediction. In this paper, an innovative distributed fibre optic strain measurement system is introduced. The system allows us to have thousands of “strain gauges” along a single cable con-nected to structures, embedded in soil or grouted into boreholes. Because of the simple and quick installation technique, distributed optical fibre sensing can be as equally practical as the other conventional measurements. This paper describes several case studies where fibre optic based distributed strain measurement systems were used to monitor the performance of geotechnical structures dur-ing construction or when influenced by adjacent structures. The distributed nature of strain data provided additional insights into the “real” behaviour of piles, retaining walls and tunnels, which would be difficult to gain from conventional monitoring systems. The understanding of the actual or ‘real’ performance of geotechnical structures provides more opportunity for us to make potentially more economical (i.e. smaller diameter pile, thinner wall or less reinforcement) and yet safe geotechnical structures. By using recent advances in field instrumentation and monitoring systems, we can be more proactive than we used to in closing the gap between theory and applications.
1. Introduction
Being proactive to ‘close the gap between theo-ry and applications’, which was promoted by the late Professor Arrigo Croce, should be at the heart of any engineering discipline. The geotechnical engineer-ing community has embraced this challenge through designing geotechnical structures using rigorous analysis methods (e.g. upper bound and lower bound theories, stress equilibrium and kinematic compati-bility) and comparing the computed results to the ac-tual performance. Laboratory tests and field tests are used to determine the engineering properties neces-sary to use these design methods. Uncertainty is ad-dressed through past experience, for example by em-bedding safety factors and developing robust design standards. Numerical methods, such as the finite el-ement method, now allow designing structures with complicated geometries and boundary conditions. However, in some complex problems, field experi-ence is limited. This is where physical model testing, in particular centrifuge testing, plays an important role in gaining engineering experience.
Field monitoring is essential in geotechnical en-gineering in order to ensure that (i) the design is sound, (ii) the construction is executed safely, and (iii) the geotechnical structure we built satisfies the specifications set by the clients. It has to be part of gaining engineering experience by comparing the actual behaviour with the design prediction. In this paper I argue that, by using recent advances in field instrumentation and monitoring systems, we can be more proactive than we used to in closing the gap between theory and applications.
Our construction practice is moving very fast to meet the societal demand for better infrastructure. Table I shows the change in the dimensions of piles from the 1980s to the present. Piles are becoming larger and longer. For instance, the diameter of con-tinuous flight auger piles can be as large as 1.2 m now, compared to 0.6 m in the 1980s. The diame-ter of rotary bored piles is as large as 2.7 m now, compared to 1.8 m in the 1980s. The length has increased 50% from 50 m to 75 m in the past thir-ty years. New piling technologies such as cased se-cant piles (CSP/DSK) and rotary displacement piles have been developed thanks to innovation in piling equipment. The construction process is often com-puter controlled, allowing for more reliable installa-tion of piles.
* Professor of Civil Engineering, Department of Engineering, University of Cambridge, UK

RIVISTA ITALIANA DI GEOTECNICA
8 SOGA
Despite such improvement in construction tech-nology, the design methodologies of piles have not changed much in the past thirty years. Although un-certainty in design is better defined in new design codes (e.g. Eurocode), the overall factor of safety has not changed. At present, it appears that the speed of innovation in construction technology is greater than the speed at which our understanding of its en-gineering performance is improving. For example, the following questions can be posed: is it appropri-ate to extrapolate our design methodologies devel-oped for shorter and smaller piles to longer and larg-er piles? Is it safe or is it overdesigned? How much do we know of the actual performance of such large diameter piles?
Similar developments have been observed in re-taining walls. Table II shows the change in the di-mensions of retaining walls in the past thirty years. The length of diaphragm wall has increased from 45 m in the 1980s to 70 m or more at present. Such an increase in length also implies an increase in wall thickness due to larger earth pressures at greater depths. Nowadays we see walls 1500 mm in thickness, which is 50% greater than the maximum wall thick-ness of 1000 mm in the 1980s. Similarly the maxi-mum length of piled walls has increased 100% from 30 m in the 1980s to 60 m at present. Accordingly the maximum thickness has doubled from 750 mm to 1500 mm.
The construction technologies for in-situ wall in-stallation are also rapidly developing. Thanks to such developments, underground structures can be con-
structed at deeper locations, increasing the capac-ity of available space dramatically for urban living. As the excavation level increases, the bending mo-ment applied to the wall increases. The wall thick-ness therefore needs to be greater but the required thickness is often based on the design methodologies developed for shallower walls. More steel reinforce-ments are installed in the concrete walls, which leads to very congested cage geometry inside deep trench-es in the ground. This makes the tremie concreting process more difficult where fresh concrete does not always fill up the wall uniformly causing “volcano” ef-fects and little scour of filter cake [NICHOLSON, 2014]. This leads to wall defects such as shadow zones and mattress effects as shown in figure 1. Are we overde-signing them but making them more difficult to con-struct? Again, we have limited understanding of the actual performance of deep retaining walls with large thickness and congested reinforcements. A similar argument can be made for long bored piles.
In this paper, it is hypothesised that any extrapo-lation of design methods of geotechnical structures established from shorter piles and walls to longer ones requires more validation in order to develop confidence in our design. The understanding of the actual or ‘real’ performance of geotechnical struc-tures provides more opportunity for us to make po-tentially more economical (i.e. smaller diameter pile, thinner wall or less reinforcement) and yet safe geotechnical structures.
Although there is long history of developing ro-bust monitoring methods for geotechnical engineer-
Process
Year 1985 Year 2013
Widths(mm)
Depths(m)
Retained Heights (m)
Widths(mm)
Depths(m)
Retained Heights (m)
Diaphragm Wall 600 – 1000 6 – 45 8 – 15 600 – 1500 6 – 70 8 – 30
Piled Wall 600 – 750 6 – 30 2 – 8 600 – 1500 6 – 60 6 – 20
(From J. Dunbar, Cementation Skanska)
Process
Year 1985 Year 2013
Diameters(mm)
Ave Depths(m)
Diameters(mm)
Ave Depths(m)
Continuous Flight Auger Piles 300 – 600 6 – 24 300 – 1200 6 – 28
Screw Displacement Piles 300 – 600 6 – 30 300 – 600 6 – 49
Large Diameter Bored Piles 600 – 1800 6 – 50 600 – 2700 6 – 75
Driven Piles 200 – 600 4 – unlimited 200 – 600 4 – unlimited
Cased Secant Piling Not available Not available 400 – 1000 6 – 18 (27)
Rotary Displacement Pile Not available Not available 300 – 600 4 – 25
(From J. Dunbar, Cementation Skanska)
Tab. I – Dimensions of piles in Year 1985 – and Year 2013.Tab. I – Dimensioni dei pali negli anni 1985 e 2013.
Tab. II – Dimensions of Retaining Walls in Year 1985 – and Year 2013.Tab. II – Dimensione dei muri di sostegno negli anni 1985 e 2013.

9
OTTOBRE - DICEMBRE 2014
UNDERSTANDING THE REAL PERFORMANCE OF GEOTECHNICAL STRUCTURES USING AN INNOVATIVE FIBRE OPTIC…
ing problems, emerging sensor technologies pro-vide a new way of understanding the performance of geotechnical structures. In particular, advances in the development of computer vision, fibre optic sens-ing, miniature sensors (such as Micro-electro-me-chanical systems, MEMS) and Nano-electro-mechan-ical systems (NEMS)) and wireless sensor network of-fer intriguing possibilities that can radically alter the paradigms underlying existing methods of condition assessment and monitoring of geotechnical struc-tures (e.g. HOULT et al., 2009; BENNETT et al., 2010a, b; FERRI et al., 2010; STAJANO et al., 2010; SOGA, 2012, 2013; HOULT and SOGA, 2014; STENT et al., 2014).
Engineering design limits are often based on strain and/or stress developing in the structure. Point-wise strain measurement is well established using vibrating wire or metal foil strain gauges. For building components such as columns or beams, strain distribution is a function of the end conditions and applied loading and hence these point sensors are often suitable for evaluating the complete strain profile. However, for structures interacting with soil (e.g. underground infrastructure such as founda-tions, tunnels or pipelines), the ground loads are distributed spatially (not point loads) and hence the state of the structure cannot be fully understood un-less the complete in situ strain regime is known. Fur-thermore, due to uncertainties in ground heteroge-neity, capturing the continuous strain profile is often useful to pinpoint localised problem areas such as joint rotations, deformations and non-uniformly dis-tributed soil-structure interaction loads.
This paper describes several case studies where fibre optic based distributed strain measurement sys-tems were used to monitor the performance of geo-technical structures during construction or when in-fluenced by adjacent structures. Some of the cases
presented here can be considered to be simple and routine ones, but I argue that the distributed strain data have provided additional insights into the “re-al” behaviour of piles, retaining walls and tunnels, which would be difficult to gain from conventional monitoring systems.
2. Distributed strain measurement system using optical fibres
2.1. General principle
Scattering is a phenomenon where waves, such as light, that are travelling in a non-uniform mate-rial are forced to deviate from a straight trajectory. In 1922, Léon Brillouin predicted that the propaga-tion of monochromatic light in a medium would suf-fer diffraction, which would induce a frequency shift through the light-matter interaction. This diffrac-tion called “Brillouin” scattering was experimentally verified in the 1930s, but the frequency shift was too small for detection until 1960 when lasers were able to provide strong coherent light waves [CHIAO et al., 1964]. Optical fibre was then introduced and its low-loss character led to the development of optical fibre sensors in the 1990s.
Optical fibres have a glass core through which light pulses can propagate to transfer information on the basis of total internal reflection as shown in fig-ure 2. The core is the physical medium that trans-ports optical data signals from an attached light source to a receiving device. It is normally made from silica glass and has a typical diameter of 8 µm for single-mode fibres and around 50–62.5 µm for multi-mode fibres. Single mode fibres allow only one mode of propagation, whereas multi-mode fibres al-
Fig. 1 – Wall defects - Cavities in diaphragm panel inside a tunnel, Lubach (2010).Fig. 1 – Difetti dei muri. Cavità in un pannello di un diaframma all’interno di una galleria.

RIVISTA ITALIANA DI GEOTECNICA
10 SOGA
low multiple discrete modes of propagation. Single mode fibres, which are used in this study, therefore do not suffer from intermodal dispersion and hence have lower attenuation. Cladding is a thin glass layer that surrounds the fibre core and serves as a bounda-ry that contains the light waves and causes the refrac-tion, enabling data to travel throughout the length of the fibre segment. The overall diameter of the core and cladding has been standardised for most applica-tions at 125 µm. The cladding is usually coated with a layer of acrylate polymer to reinforce the fibre core, help absorb shocks, and provide extra protection against excessive cable bends. These buffer coatings vary in size from 250 to 900 µm. One or several layers of protective sheathing are added around the buffer to form the cable jacket. The material and geometry of the cable jacket is tailored to specific applications.
When a pulse of light travels down an optical fi-bre, a small fraction is scattered back at every loca-tion of the fibre. There are several unique scattering signatures (such as Raman and Brillouin) in the fre-quency spectrum of the back-scattered light as shown in figure 3. Brillouin scattering in particular can be useful in civil engineering as it can be used to meas-ure physical quantities, such as strain. Since 1989, when Brillouin scattering was proposed to measure temperature for the first time [CULVERHOUSE et al., 1989; HORIGUCHI and TATEDA, 1989; KURASHIMA et al., 1990], the technique has developed rapidly. It pro-vides the ability to monitor temperature and strain in large infrastructure without having to use thou-sands of point sensors [HORIGUCHI, et al. 1995; SHIMI-ZU, et al., 1995; GARUS et al., 1996; NIKLES et al., 1996]. In the past decade a wide range of industry appli-cations have evolved with advances in analysers ca-pable of longer measuring distances, faster data ac-quisition times, and more accurate and reliable sys-tem configuration [OHNO, et al., 2001; BAO and CHEN, 2011].
The innovative part of this technology comes from the fact that standard optical fibres (with no or limited modification) become sensors and that tens of kilometres of fibre can be sensed at once for continuous distributed strain/temperature meas-urement, providing a relatively cheap but highly ef-fective monitoring system. Top of the range com-mercial analysers can provide strain values every 20 mm at a resolution of 5-10 microstrain with a “weighted” spatial gauge length of 0.5 m. That is, a given strain value at a point is an average strain of a section +_0.25 m from that point with more weights around the point. With some assumptions, it is also possible to deconvolute the data to obtain more ac-curate reading of strains at a given location (see for example CHEUNG et al. [2010] and MOHAMAD et al.
Fig. 2 – Optical fibre cable.Fig. 2 – Cavo a fibra ottica.
Fig. 3 – Back scattering and different scattering signatures.Fig. 3 – Spettro tipico della dispersione dovuta alla riflessione ed altri fenomeni.

11
OTTOBRE - DICEMBRE 2014
UNDERSTANDING THE REAL PERFORMANCE OF GEOTECHNICAL STRUCTURES USING AN INNOVATIVE FIBRE OPTIC…
[2010]. However, there are new generations of re-search-based FO analysers that can measure strains at much better spatial resolution; that is, the capa-bility at the detection side is continuously improv-ing. This means that fibre optic cables installed in the past can potentially provide better data using improved FO analysers, which is also a unique fea-ture of this technology.
2.2. How fibre optic based distributed strain measure-ment systems work
In this section, a brief summary of the general concept of Brillouin-based sensing is given. More in-formation can be obtained from publications in the area of photonics (e.g. HORIGUCHI et al., 1995), which is out of the scope of this paper.
When light with a wave length of 1550 nm is pumped into an optical fibre scattering is gener-ated and the Brillouin spectrum of the back-scat-tered light can be analysed from the origin of the fibre. It has roughly 25 to 30 MHz bandwidth and the central peak frequency is around 11 GHz for standard fibres when no strain is applied. The back-scattered Brillouin central frequency vb is related to the input light based on the following equation.
(1)
where nf is the fibre core refractive index, va is the acoustic velocity in the fibre and λl is the wave length of the input light.
Changes in temperature and/or strain induce density changes in the fibre which affect the acous-tic velocity va and the refractive index. As the strain or temperature at a given location changes, the fre-quency of the backscattered light is shifted by an amount linearly proportional to the applied strain or temperature.
(2)
where vbo is the central Brillouin peak frequency at zero strain and at a given temperature, ∆ε is the change in strain, ∆T is the change in temperature, and M and N are the proportionality constants for strain (about 0.5 GHz per percent strain) and tem-perature (about 1 MHz per degree Celsius). For the incident wavelength of 1550nm, the Brillouin fre-quency shift can varies from 9GHz to 13GHz de-pends on the fibre properties. Therefore monitor-ing of this frequency shift gives information about strain and temperature change at the location where the back scattered light is generated. As the speed of light is constant, the location can be evaluated by measuring the time elapsed between when the light was pumped into the fibre and the time at which it comes back to the analyser. By resolving both time and frequency, it is therefore possible to generate a continuous strain or temperature change profile
Fig. 4 – BOTDR. Fig. 4 – Schema di funzionamento di un Brillouin optical time-domain reflectometer (BOTDR).

RIVISTA ITALIANA DI GEOTECNICA
12 SOGA
along the fibre for distances of a few kilometres or more.
Although there are various fibre optic based dis-tributed sensing technologies, the case studies pre-sented here make use of time domain techniques called ‘Brillouin optical time-domain reflectome-tery (BOTDR)’ and ‘Brillouin optical time domain analysis (BOTDA)’. The former relies on the spon-taneous Brillouin scattering, which uses the inci-dent light to generate the Brillouin signal. The lat-ter relies on stimulated Brillouin scattering, which uses an external excitation signal to amplify the Brillouin signal.
In BOTDR, a light pulse is sent from one end of the cable and the back-scattered signal is detected from the same end (see Fig. 4). A BOTDR analyser detects the frequency component of the back-scat-tered signal with a high spectral resolution analysis and the location of this frequency component from the time domain analysis. At each location, the fre-quency spectrum is constructed incrementally from the local oscillator and the change in the central frequency is used to create a strain-temperature de-pendent profile. The length of the optical pulse de-termines the system spatial resolution. For example, 10 ns of pulse width will provide 1 m of spatial reso-lution. A longer pulse gives better back-scattered sig-nal but the spatial gauge becomes longer. A short-er pulse would be better but the back-scattered sig-nal tends to show high noise levels. A typical resolu-tion of strain for a 10 ns pulse is 30-50 µε after signal
stacking to reduce the signal-to-noise ratio, which leads to longer data acquisition time.
In BOTDA, one light wave (pump) is injected into the cable from one end of the cable, whereas anoth-er light wave (probe) is injected from the other end of the cable. Therefore it requires a loop configura-tion with access from both ends of the cable (see Fig. 5), which may be a major drawback in harsh environ-ments where cable breakages are possible. With BOT-DR, if a breakage occurs and both ends are accessible, it is still possible to obtain the whole strain profile.
As shown in figure 5, BOTDA utilises these two counter propagating waves coupled through a non-linear parametric process where the energy transfers from the pump into the probe. The two waves propa-gate in opposite directions and generate an acoustic wave corresponding to their beat frequency. This al-lows better detection of the Brillouin scattering sig-nal. The position-dependent information can be ob-tained by pulsing one of the optical waves and ob-serving the local coupling on the counter-propagat-ed wave. The spatial resolution can be improved to 0.5 m or less and the strain resolution to 30 µε or less.
There are advantages and limitations of BOTDR and BOTDA systems currently available on the mar-ket and the selection should depend on user’s con-fidence and experience in installing fibre optic ca-ble in the structure. Because of the simple and quick installation technique, distributed optical fibre sens-ing can be as equally practical as other convention-al strain measurement systems. The cost of a stand-
Fig. 5 – BOTDA.Fig. 5 – Schema di funzionamento di un sensore basato su Brillouin optical time-domain analysis (BOTDA).

13
OTTOBRE - DICEMBRE 2014
UNDERSTANDING THE REAL PERFORMANCE OF GEOTECHNICAL STRUCTURES USING AN INNOVATIVE FIBRE OPTIC…
ard optical fibre is potentially very low compared to other point measurement sensors. Most of the capi-tal investment relates to the analyser, which can be connected to a number of fibres or be shared be-tween different sites. More choice from more manu-facturers will drive the price of BOTDR or BOTDA analysers down. The area of optoelectronics is fast moving and new generations of analyser, which over-comes various limitations, are expected to appear in the near future.
2.3. Fibre optic cables for strain and temperature meas-urement
As described earlier, the fibre optic sensing cable itself is the sensor. A direct interpretation of the be-haviour of a structure can be made by embedding fi-bre optic cables inside it or attaching them to its sur-face. Fibre optic cables should be robust enough to
survive in harsh construction environments, as well as sensitive enough to report the structural perform-ance.
Strain measuring cables used in the case stud-ies presented in this paper are shown in figure 6a to 6c. The various coating layers and the inner glass core and cladding are bonded together so that the strain applied externally is fully transferred from the surface coating to the inner core. Additionally there should be no creep between the cable and the struc-ture so that strain due to structure deformation is fully transferred to the cable.
Figure 6a shows a standard single fibre cable used in some of the case studies presented in this paper. It is very small (0.9 mm diameter). The fi-bre cable shown in figure 6b combines eight single cables into one cable. Both cables require delicate handling. On the other hand, figure 6c shows a rein-forced cable, which is used for piling and diaphragm wall monitoring. It has steel wires on both sides and
Fig. 6 – Fibre optics cables used in this study.Fig. 6 – Cavi a fibra ottica utilizzati nel presente studio.

RIVISTA ITALIANA DI GEOTECNICA
14 SOGA
strong nylon is used for coating to protect the fragile optical fibres. However, it is more expensive than the former two cables.
As the Brillouin frequency shift is sensitive to both strain and temperature, temperature com-pensation may be needed. In the case studies pre-sented in this paper, the unitube cable shown in fig-ure 6d is installed alongside strain sensing cable for temperature compensation. It consists of several op-tical fibres installed in a gel filled loose tube so that any mechanical deformation applied to the jacket is not transferred to the cores (M in Eq. 2) is therefore zero). The cores contract or expand due to chang-es in temperature only. Further information on tem-perature compensation can be found in MOHAMAD et al. [2014].
The cables shown in figure 6 are the ones used in the case studies presented in the next section. Ad-vances in fibre optic cables are rapid and both strain and temperature cables are expected to become more robust and less expensive as long as there is market demand.
3. Case studies
Eight case studies on piles, retaining walls and tunnels are presented in this paper. The aims are (i) to show how fibre optic cables were attached to or embedded into the structures, (ii) to present some selected distributed strain data and (iii) to demon-strate how the data was used to understand the en-gineering performance of the monitored structures. The details of some of the case studies have been re-ported elsewhere and the readers interested in the specific details can check the papers given in the ref-erence section.
3.1. Pile testing at Broadgate Road, London
3.1.1. SITE
A fourteen-storey office building with two base-ment level was constructed at Broadgate Road, Lon-don. A series of 25 m long mini piles (305 mm diam-eter) were installed with tight space restrictions to support the superstructure. The pile layout is shown in figure 7. The ground conditions were River Ter-rance gravel deposits overlain by London clay, which is firm at the top and then becomes stiff at greater depths. A pile test was conducted to verify the design capacity of the mini piles. Three consecutive load-ing and unloading cycles were applied on top of the test pile.
The bored piles had two reinforcement cage sections. The reinforced FO cable (Fig. 6c) and the unitube cable (Fig. 6d) were used for strain
and temperature measurement, respectively. The installation process is shown in figure 8. Prior to installation of the bottom cage, FO cables were at-tached along its two sides. A pretension of approx-imately 1500-2000µ� was applied on the strain ca-ble during attachment and the FO cables at the two ends were coiled at the top of the cage. After the bottom cage was lowered in the borehole, the two FO cables were attached to the top cage when it was spliced to the bottom cage. While the top cage was lowered into the borehole, the end cables were gradually uncoiled and attached to the two sides of the top cage, following the same pattern as with the bottom cage. After the installation of the top cage was completed, the end cables were ten-sioned and clamped at the ends of the cage. The ends of both temperature and strain cables were used to carry out measurements with the analyser. This cable installation procedure provided two sets of strain and temperature cables in the axial direc-tion of the pile.
3.1.2. DATA AND INTERPRETATION
Figure 9 shows the axial strain profile at the peak values of the three cycles. Both distributed FO strain data as well as point-wise vibrating wire strain gauge (VWSG) data are shown and the two data in general agree with each other. The scatter in the FO data is about 30µ�, which corresponds to the resolution of the BOTDR analyser used for this test. The scatter becomes relatively less significant when larger loads are applied. Figure 10 shows the displacement profiles relative to the bottom of the
Fig. 7 – Mini-pile layout at Broadgate.Fig. 7 – Schema del micropalo utilizzato a Broadgate.

15
OTTOBRE - DICEMBRE 2014
UNDERSTANDING THE REAL PERFORMANCE OF GEOTECHNICAL STRUCTURES USING AN INNOVATIVE FIBRE OPTIC…
pile by integrating the strain data. If the top dis-placement is measured, then it would provide a complete displacement profile, which provide us further understanding of the soil-pile interaction along its length.
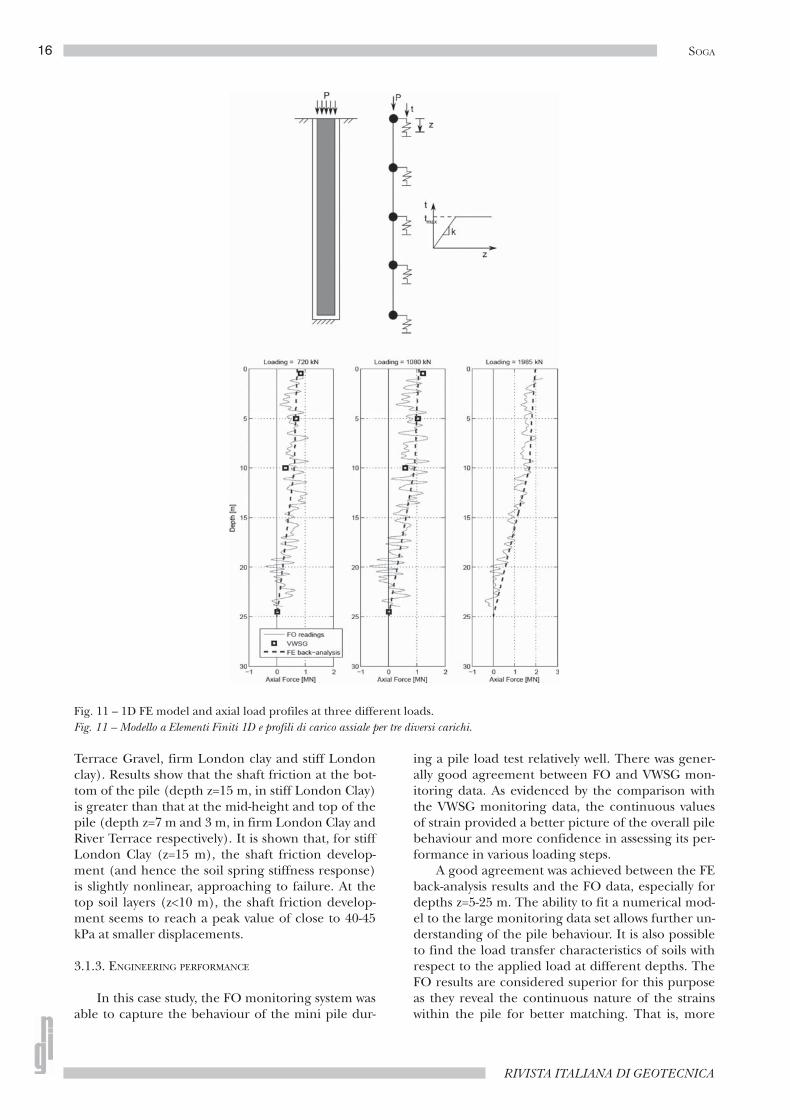
The strain data can be converted to the axial force profile using the axial pile stiffness (which can be estimated from the top end of the strain data with a given applied load) as shown in figure 11. In this study, a simple one-dimensional beam-spring finite element code was used to find the development of shaft friction with load. This was done by back-analysis fitting of the displacement and load profiles with the model prediction. The dotted lines in figure 11 are the back analysed axial load profiles.
From the back analysis, it is possible to evaluate the mobilised shaft resistances of different soil lay-ers at different displacements at the location where the layers exist. Figure 12 shows such load-transfer relations evaluated for the three soil layers (River
Fig. 8 – FO cable installation process.Fig. 8 – Modalità di installazione di un cavo a fibra ottica.
Fig. 9 – Strain profiles at three different loads.Fig. 9 – Profili di deformazione per tre carichi diversi.
Fig. 10 – Displacement profiles at five different loads.Fig. 10 – Profili di spostamento per cinque carichi diversi.
RIVISTA ITALIANA DI GEOTECNICA
16 SOGA
Terrace Gravel, firm London clay and stiff London clay). Results show that the shaft friction at the bot-tom of the pile (depth z=15 m, in stiff London Clay) is greater than that at the mid-height and top of the pile (depth z=7 m and 3 m, in firm London Clay and River Terrace respectively). It is shown that, for stiff London Clay (z=15 m), the shaft friction develop-ment (and hence the soil spring stiffness response) is slightly nonlinear, approaching to failure. At the top soil layers (z<10 m), the shaft friction develop-ment seems to reach a peak value of close to 40-45 kPa at smaller displacements.
3.1.3. ENGINEERING PERFORMANCE
In this case study, the FO monitoring system was able to capture the behaviour of the mini pile dur-
ing a pile load test relatively well. There was gener-ally good agreement between FO and VWSG mon-itoring data. As evidenced by the comparison with the VWSG monitoring data, the continuous values of strain provided a better picture of the overall pile behaviour and more confidence in assessing its per-formance in various loading steps.
A good agreement was achieved between the FE back-analysis results and the FO data, especially for depths z=5-25 m. The ability to fit a numerical mod-el to the large monitoring data set allows further un-derstanding of the pile behaviour. It is also possible to find the load transfer characteristics of soils with respect to the applied load at different depths. The FO results are considered superior for this purpose as they reveal the continuous nature of the strains within the pile for better matching. That is, more
Fig. 11 – 1D FE model and axial load profiles at three different loads.Fig. 11 – Modello a Elementi Finiti 1D e profili di carico assiale per tre diversi carichi.

17
OTTOBRE - DICEMBRE 2014
UNDERSTANDING THE REAL PERFORMANCE OF GEOTECHNICAL STRUCTURES USING AN INNOVATIVE FIBRE OPTIC…
confidence in the results of the back-analysed mod-el is gained because a continuous strain profile gives the full picture of the displacements over the whole length of the pile.
3.2. O-Cell pile testing for a new light storey
3.2.1. SITE
A new four, is currently being constructed in Lon-don. The building consists of four-storey-deep base-ment and the eight-storey concrete frame. There are 260 piles and the typical dimension of the piles is 30 metres long with a diameter of up to 2.4 metres, as shown in figure 13. The ground consists of both Lon-don Clay and Lambeth Clay/Silt mixtures in vary-ing undrained shear strength ranging from 60kPa to 360kPa.
In order to understand the engineering perfor-mance of these piles, a bored pile of 31.5m long and 1500mm diameter was tested prior to construction. The site was congested and hence an Osterberg Cell (O-Cell) was used to apply load from the bottom of the pile to understand the development of the mobi-lised shaft and base resistance.
Reinforced FO cable (Fig. 6c) and unitube cable (Fig. 6d) were used for strain and temperature meas-urement, respectively. The instrumentation process is shown in figure 14. The installation process was sim-ilar to that at the Boradgate Road site as described above. Fibre optic cables were routed along opposite sides of the reinforcement cage from the pile head to the top of O-Cell where a 10m long reference loop was located. A prestrain of 2000µ� was induced onto the strain cable. Vibrating wire strain gauges (VWSGs) were installed at four different depths.
The load test lasted for approximately 10 hours with six loading steps until the pile failed at 8.33 MN from the bottom; subsequently the pile followed the unloading schedule.
3.2.2. TEST DATA AND INTERPRETATION
Figure 15 give the mobilised strain profiles at dif-ferent loading stages along with the corresponding levels of VWSGs and OFS cables. It is noted that the second level of VWSG data (-17.5m below top of con-crete level (-8.00mOD)) was significantly different from the VWSG data of the other levels. Typically in such situation, the VWSG data from the second level are considered not to be representative (sometimes interpreted as malfunction of the instrument) and would be ignored for engineering interpretation.
Results show that the fibre optics data corre-sponds well with the VWSG data throughout the tests. In general, the load decreases as it moves fur-ther away from the O-Cell as skin friction develops along the pile shaft. The data also agree with the trend showing a highly strained section of the pile at the level of the second VWSG location. The two sets of independent data indicate that the pile itself probably had some inhomogeneity. The reasons for this are not clear. The borehole logs of a nearby lo-cation shows that the geology at this depth is in the Lambeth Group, which comprises a mixture of stiff and hard clays, silts, sands and gravel. The variable li-
Fig. 12 – Shaft friction development with displacement.Fig. 12 – Andamento della resistenza laterale in funzione dello spostamento.
Fig. 13 – Pile layout at the Francis Crick Building site.Fig. 13 – Schema del palo utilizzato a Francis Crick.

RIVISTA ITALIANA DI GEOTECNICA
18 SOGA
thology and strength may have caused the observed nature of the pile, causing weak spots with high com-pressibility compared to other intact concrete pile sections.
3.2.3. ENGINEERING PERFORMANCE
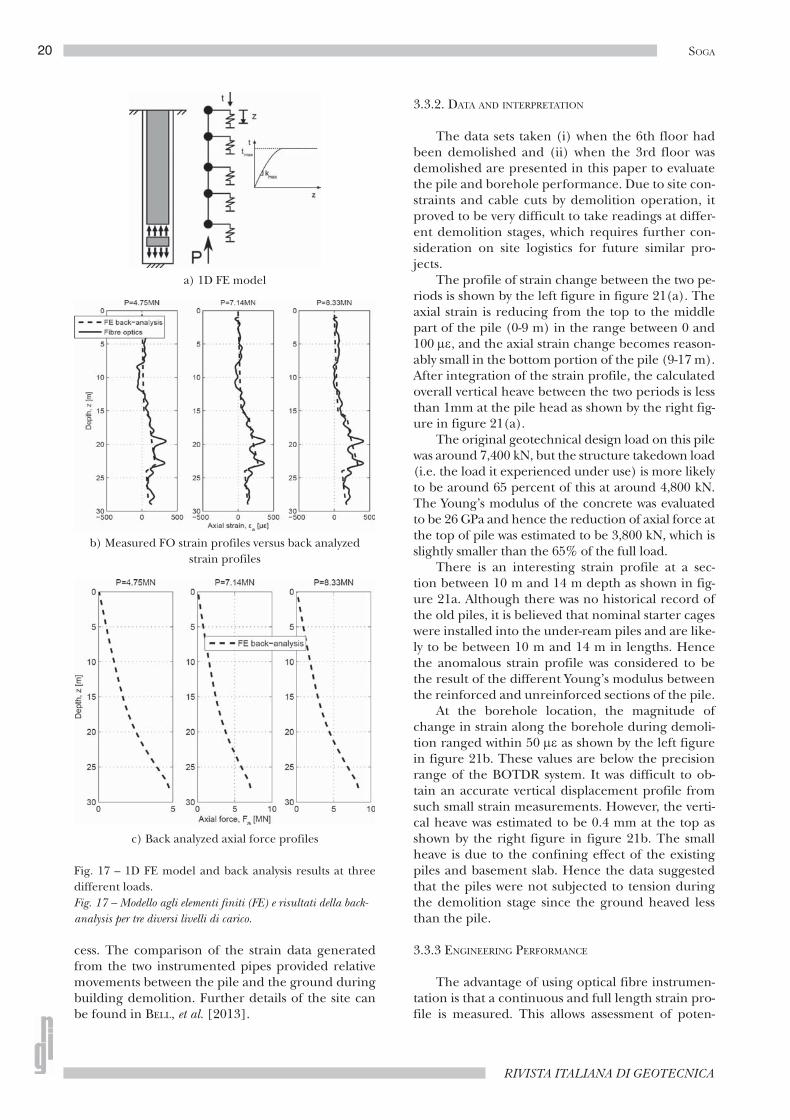
Figure 16 shows the displacement profiles at different O-cell loads. The displacement at the top of the pile was monitored, which can be used as a boundary condition for integration of the strain da-ta. This data set can be used to back analyse the load transfer characteristic of the soils using a simple 1D FE model as shown in figure 17a. The axial stiffness at the region where large strains were measured was reduced compared to the other parts of the pile so that the strain profiles can be matched with the back-analyses results. In this case, it was necessary to re-duce the stiffness to 30% of the original stiffness to
match the distributed data. The back analysed strain profiles are shown in figure 17b. Figure 17c gives the axial load profiles at three different O-cell loads. Fig-ure 18 shows the back-calculated load transfer curves of the three soils (Lambeth group, London clay and Terrace gravel). The bottom Lambeth group layer gives the largest shaft friction. The London clay at 23 m depth develops slightly smaller shaft resistance than the Lambeth group layer.
This test highlighted the usefulness of continu-ous strain profile when compared to a situation in which a limited number of point sensors is installed. In this site, the second VWSG level showed much larger values than the others and hence in conven-tional practice this set of data would be ignored and an attempt would be made to deduce the mobilised shaft friction from the remaining data set. In con-trast, fibre optic cables were able to provide a con-tinuous strain profile which enabled to derive a gen-eralised skin friction across the anomaly. This case study indicates the need to measure continuous strain profiles rather than limited number of dis-crete point measurements when a structure is sub-jected to distributed loads.
3.3. Pile reuse monitoring at Bevis Marks, London
3.3.1. SITE
FO instrumentation was conducted on an exist-ing pile of a building at Bevis Marks, London, which was demolished for a new building. The aim of the instrumentation was to monitor the movement of the pile during unloading (i.e. building demolition) and to ensure the quality of the pile for reuse for the new building.
The original 1980s building was an eight sto-rey building with a double basement. The ground is made ground overlying Terrace Gravels, which in turn overlies on London Clay. The existing and new piles are founded within London clay. As shown in figure 19a, the original building was supported by 67 bored under-reamed piles attached to a basement slab. The existing foundations system included (i) piles located inside the basement, which is approx-imately 7.0m below pavement level, and (ii) piles constructed in the Bevis Marks pavement, which is approximately 3.5m below pavement level. Building demolition was completed at the end of 2011.
The new building was a sixteen storey build-ing with a basement. The foundation design re-used 67 existing piles and added 37 new straight shafted piles, as shown in figure 19b. The existing piles were designed to carry total building loads of 350,100kN and 33,900kN for those inside and outside the basement, respectively. A 1.0 to 1.5 m thick transfer slab was constructed on the existing
Fig. 14 – FO cable installation.Fig. 14 – Installazione del cavo a fibra ottica.

19
OTTOBRE - DICEMBRE 2014
UNDERSTANDING THE REAL PERFORMANCE OF GEOTECHNICAL STRUCTURES USING AN INNOVATIVE FIBRE OPTIC…
basement slab to enable strain compatibility to be achieved between the new and existing piles. The thickness of new pile caps varied between 1500 mm and 4150 mm. These slabs and pile caps effectively increased the raft thickness in order to reduce dif-ferential deformations.
Prior to demolishing the building, one of the un-der-ream piles (E47, see Fig. 19b) was selected to be cored to full depth for inspecting and assessing con-crete quality. A 100 mm borehole was drilled into the pile to a depth of 20 m. An 80 mm diameter drain pipe with strain and temperature FO cables attached along the sides was installed inside the borehole. The length of the instrumented pipe was 20 m. A hose was then installed to inject grout from the bore-hole bottom. The perforations along the FO cable instrumented pipe ensured that the grout seeped outwards filling the internal void as well as the annu-lus between the pipe and the borehole. The FO in-stallation is shown in figure 20.
Another borehole was drilled in the ground to 35.5 m depths and was instrumented using anoth-er FO instrumented pipe to full depth to capture potential ground heave during the demolition pro-
Fig. 15 – Distributed FO strain data and VWSG data.Fig. 15 – Profili di deformazione ottenuti mediante sensori a fibra ottica (FO) e sensori a corda vibrante (VWSG).
Fig. 16 – Displacement profiles at different O-cell loads.Fig. 16 – Profili di spostamento per diversi carichi applicati mediante celle Osterberg.
RIVISTA ITALIANA DI GEOTECNICA
20 SOGA
cess. The comparison of the strain data generated from the two instrumented pipes provided relative movements between the pile and the ground during building demolition. Further details of the site can be found in BELL, et al. [2013].
3.3.2. DATA AND INTERPRETATION
The data sets taken (i) when the 6th floor had been demolished and (ii) when the 3rd floor was demolished are presented in this paper to evaluate the pile and borehole performance. Due to site con-straints and cable cuts by demolition operation, it proved to be very difficult to take readings at differ-ent demolition stages, which requires further con-sideration on site logistics for future similar pro-jects.
The profile of strain change between the two pe-riods is shown by the left figure in figure 21(a). The axial strain is reducing from the top to the middle part of the pile (0-9 m) in the range between 0 and 100 µε, and the axial strain change becomes reason-ably small in the bottom portion of the pile (9-17 m). After integration of the strain profile, the calculated overall vertical heave between the two periods is less than 1mm at the pile head as shown by the right fig-ure in figure 21(a).
The original geotechnical design load on this pile was around 7,400 kN, but the structure takedown load (i.e. the load it experienced under use) is more likely to be around 65 percent of this at around 4,800 kN. The Young’s modulus of the concrete was evaluated to be 26 GPa and hence the reduction of axial force at the top of pile was estimated to be 3,800 kN, which is slightly smaller than the 65% of the full load.
There is an interesting strain profile at a sec-tion between 10 m and 14 m depth as shown in fig-ure 21a. Although there was no historical record of the old piles, it is believed that nominal starter cages were installed into the under-ream piles and are like-ly to be between 10 m and 14 m in lengths. Hence the anomalous strain profile was considered to be the result of the different Young’s modulus between the reinforced and unreinforced sections of the pile.
At the borehole location, the magnitude of change in strain along the borehole during demoli-tion ranged within 50 µε as shown by the left figure in figure 21b. These values are below the precision range of the BOTDR system. It was difficult to ob-tain an accurate vertical displacement profile from such small strain measurements. However, the verti-cal heave was estimated to be 0.4 mm at the top as shown by the right figure in figure 21b. The small heave is due to the confining effect of the existing piles and basement slab. Hence the data suggested that the piles were not subjected to tension during the demolition stage since the ground heaved less than the pile.
3.3.3 ENGINEERING PERFORMANCE
The advantage of using optical fibre instrumen-tation is that a continuous and full length strain pro-file is measured. This allows assessment of poten-
Fig. 17 – 1D FE model and back analysis results at three different loads.Fig. 17 – Modello agli elementi finiti (FE) e risultati della back-analysis per tre diversi livelli di carico.
c) Back analyzed axial force profiles
a) 1D FE model
b) Measured FO strain profiles versus back analyzed strain profiles

21
OTTOBRE - DICEMBRE 2014
UNDERSTANDING THE REAL PERFORMANCE OF GEOTECHNICAL STRUCTURES USING AN INNOVATIVE FIBRE OPTIC…
tial cracking of the piles during load removal. If any cracking occurs, localized peaks will appear in the strain profile. In this case study, there were no signs of cracking along the instrumented pile throughout the whole depth.
The loading-unloading-reloading process in the foundation was modelled by a pile-raft foundation code developed at Cambridge University [LEUNG, 2010; SHEA, 2012]. The code uses a finite element mesh to model foundation systems and analyses soil behaviour using a non-linear load transfer approach under cyclic loading [CHIN and POULOS, 1991] and is thus appropriate for the simulation of pile reuse behaviour. Further details can be found in LEUNG [2010] and SHEA [2012].
The analysis was conducted in an incremental manner; (i) apply the original building loads on the original foundation, (ii) remove the building loads, (iii) add additional piles and transfer slabs, and (iiii) apply new building loads. The deformation plots of the foundation due to the original and new build-ing loads are shown in figures 22 a and b respec-tively. The amount of load carried by each pile is al-so shown and the piles near the centre are heavily loaded. The largest deformations therefore occur around the centre of the raft.
Figure 23a shows the variation of displacement with depth of the instrumented pile during the load-unload-reload process. The load is mostly carried to-ward the base of the pile. During unloading (or dem-olition), the pile appears to be unloaded completely with negligible residual displacement, indicating the pile behaviour remained approximately elastic. The computed pile movement during the two FO moni-toring dates was extracted and compared with the FO derived displacement profile as shown in figure 23b. The numerical simulation overestimates the rel-ative deformation along the pile length but in gen-eral agrees well. On reloading, the foundation expe-rienced much higher displacement than on the first loading as shown in figure 23a.
The proportion of total load carried by the piles (old and new) and raft for both the original and new Bevis Marks buildings was computed from the simu-lation results. For the old building, the piles are load-ed to less than 20% of their capacity. No pile is load-ed beyond 36% of its ultimate capacity. For the new building, the old piles carry 72.5% of the new build-ing load as there are more old piles than new piles. The old piles mobilise only 23% of their capacity, whereas the new piles mobilise 46% of their capac-ity (FoS = 2.17). Considering the uncertainly in the performance of the old piles, this foundation design was provided to be effective and the FO monitoring data provided confidence in both direct assessment of crack potentials and validation of the numerical model to understand the overall performance of the foundation.
3.4. Thermal pile testing at Lambeth College, London
3.4.1. SITE
Ground source heat pump (GSHP) system is a technology that can provide heating and cooling to buildings and infrastructure with geothermal ener-gy. The ground is used as a heat source for heating or a sink for cooling and the balance of the two can keep the average ground temperature constant for long-term operation. A typical GSHP system used in urban settings consists of a closed pipe system buried in the ground and filled with thermal trans-fer fluid. When the fluid travels around the pipe loops, it absorbs heat from, or gives heat out to the ground. For new building and infrastructure devel-opments, it is possible to incorporate the mecha-nism for heat transfer between the building and the ground through the foundation elements (e.g. piles and diaphragm walls). Since the mid-1980s, such thermally active foundations have found ap-plication across Northern Europe [BRANDL, 2006; ADAM and MARKIEWICZ, 2009] and started to find application in the UK since 2001 [SUCKLING and SMITH, 2002]. In the UK, there have been a num-ber of landmark thermal pile schemes constructed such as the ‘One New Change’ project [GARBER et al., 2013b], as well as many smaller projects (Kee-ble college, SUCKLING and SMITH, 2002; Lambeth college, BOURNE-WEBB et al., 2009; Oxford Earth Sci-ence building, GARBER et al., 2013a).
To quantify the thermal influence on pile be-haviour for use in engineering practice, a thermo-mechanical pile loading test was performed at the Clapham Centre of Lambeth College in South Lon-don in 2007. The pile load test scheme included (i) one main test pile with a diameter of 600 mm and a length of 23 m and (ii) one heat sink pile with a diameter of 600 mm and a length of 30 m to discharge the extracted energy from the main test pile. The piles were installed in London clay and different temperature cycles were applied under an extended period of maintained physical load (for the main pile). Figure 24 shows the schematic lay-out of the test.
A FO system and other conventional instrumen-tation were used to record temperature and strain change throughout the test. The instrumentation lay-out of the main pile is shown in figure 25. The ground conditions were a superficial layer of Made Ground (1-1.5 m thick), River Terrace Deposits (3-4 m thick) and the London Clay Formation, which extends well below the toe level of the piles. Ground water table was found within the river terrace deposit which was about 3 m below ground level. Other measurements includ-ed applied physical load at the pile head, pile head movement, ambient air temperature and the input or output temperature of fluid in the heat pump system.

RIVISTA ITALIANA DI GEOTECNICA
22 SOGA
Before conducting the thermal test, the main pile had a two mechanical loading cycles of 1800 kN and then to 1200 kN to understand the bearing characteristic
without thermal load. The thermal test then lasted for about seven weeks with sequences of cooling and heat-ing as shown in figure 26. The ground temperature on site ranged from 18 to 20 degrees, which was roughly 3 to 5 degrees higher than the average range of ground temperature in London. It is believed that the tem-perature was raised by the heat from the surrounding London underground tunnels. Further details of the test can be found in BOURNE-WEBB et al. [2009], AMATYA et al. [2012] and OUYANG [2014].
3.4.2. DATA AND INTERPRETATION
Figure 27a shows a strain profile of the heat sink pile during heating. The heat sink pile did not have any mechanical load and hence the pile expand-ed during the first heating phase. The top expands freely upwards (e.g. thermal expansion coefficient of concrete x change in temperature) and the bot-tom also expands downwards. The expansive strain reduces from the two ends and becomes the small-est in the midsection. This implies the thermal ex-pansion of the pile has been resisted by negative soil friction at the top and positive soil friction at the bot-tom as shown by a simple mechanism presented in figure 28.
Fig. 18 – Load transfer curves of three soils estimated from the back analysis of FO strain data.Fig. 18 – Curve di trasferimento per tre terreni dedotte mediante back-analysis delle misure effettuate mediante sensori a fibra ottica (FO).
Fig. 19 – Foundation layout of Bavis Marks Building.Fig. 19 – Schema della fondazione dell’edificio Bavis Marks.
b) Plan view of the foundation
a) Foundation overview.

23
OTTOBRE - DICEMBRE 2014
UNDERSTANDING THE REAL PERFORMANCE OF GEOTECHNICAL STRUCTURES USING AN INNOVATIVE FIBRE OPTIC…
The thermally induces pile force (∆F T) can be computed by the following equation.
∆F T = EA(∆εmeasured – α∆T) (3)
where E is the Young’s modulus of the pile material, A is the cross-sectional area, ∆εmeasured is the measu-red strain, α is the thermal expansion of the concre-te and ∆T is the change in temperature.
Figure 27b shows the load distributions within the pile during heating. It was estimated using equa-tion (3) with the FO strain data as input. The shaft friction generated by thermal loading can then be estimated from the gradient of the load distribution profiles. The mobilisation of shaft friction increases with temperature as shown in figure 29. Upon heat-ing, the top portion develops negative friction as the pile tends to expands upwards, whereas the bottom portion develops positive friction as the pile tends to expands downwards. The amount of mobilisation ap-pears to be proportional to temperature increase.
For the main test pile, the heating and cooling effects observed in the heat sink pile can be super-imposed on the mechanical loading only case and a conceptual model of load distribution by heating and cooling can be illustrated in figure 30a. During the cooling phase, the mobilised shaft friction in-creases in the upper part of the pile but decreases in the lower part of the pile. An opposite trend is ob-served in the heating phase; shaft resistance decreas-es at the top and increases at the bottom.
The main pile was loaded to 1200 kN prior to the thermal test, and maintained at the same mag-
nitude throughout the thermal testing period. Fig-ure 30b and c show the load profiles at the stages of cooling and heating, respectively. The load profile during the initial physical loading test phase (the sol-id lines) follows the typical characteristics of a long slim pile in London clay. The majority of the load were mobilised by the pile shaft with very little base resistance. The mechanical load is transferred by shaft friction and the average mobilised shaft resist-ance prior to the thermal test is found to be around 30 kPa along the pile. This is shown by the dotted line in the shaft friction profile of figure 31.
Figure 30b shows the cooling phase load profile obtained from the FO strain data. The cooling process effectively introduces further compressive stress at the pile top section, which mobilises a greater amount of the shaft friction to around 60 kPa by 20 degrees tem-perature decrease as shown by the black line in figure 31. At the bottom section, shaft resistance reduces and tensile stress develops inside the pile in extreme con-ditions, as shown by the dotted line in figure 30b.
Figure 30c shows the heating phase profile ob-tained from the FO strain data. The pile is subjected
Fig. 21 – Changes in strain and displacement between two demolition stages.Fig. 21 – Variazioni delle deformazioni e degli spostamenti tra due stadi di demolizione.
Fig. 20 – FO instrumentation in a pile.Fig. 20 – Strumentazione a fibra ottica installata.
a) Strain change and displacement in Pile E47
b) Strain change and displacement of borehole

RIVISTA ITALIANA DI GEOTECNICA
24 SOGA
to greater compressive load at the midway than the pile head. This implies that negative skin friction was generated at the top section of the pile. The shaft re-sistance at the bottom increases up to around 70 kPa with roughly 10 degrees increase in thermal load as shown by the grey solid line in figure 31.
3.4.3. ENGINEERING PERFORMANCE
The change in thermally induced stress with temperature is evaluated at three locations: 6 m
depth where the compressive stress was largest in the heating phase, 12 m depth the mid-depth of the pile, and 15 m depth where the tensile stress was largest in the cooling phase. The results are shown in figure 32. During the heating phase, a unit degree change in temperature mobilised an additional axial stress within the pile of between 261 kPa/°C (77% of fully restrained value) and 329 kPa/°C (97%). During the cooling stage, the maximum stress (at 15 m depth) in the pile equates to an additional axial stress of about 177 kPa/°C.
Fig. 22 – Simulation results from the pile-raft analysis.Fig. 22 – Risultati dell’analisi della fondazione su pali.
a) Simulated deformation plot due to original building loads
b) Simulated deformation plot due to new building loads

25
OTTOBRE - DICEMBRE 2014
UNDERSTANDING THE REAL PERFORMANCE OF GEOTECHNICAL STRUCTURES USING AN INNOVATIVE FIBRE OPTIC…
This means that the magnitude of shaft resistance during pile expansion by heating is greater than that during pile contraction by cooling. This in-teresting behaviour may be due to (i) increase in radial stress by pile expansion in the radial direc-tion during heating or vice versa in cooling, and (ii) stress reversal along the shaft which result in
stiffer response when the relative displacement in-crement direction becomes opposite to the previ-ous loading condition (such as top portion during heating and bottom portion during cooling after a mechanical load is applied). It seems further work is needed here.
The continuous strain profile provided bet-ter understanding of the soil-pile interaction dur-ing thermal loading cycles. The forces mobilised
Fig. 23 – Computed results from the pile-raft analysis.Fig. 23 – Previsione dell’analisi della fondazione su pali.
a) Computed displacement profiles b) Computed relative displacement profile between two mo-nitoring periods versus the estimate from the FO strain data
Fig. 24 – Thermal pile testing layout at Lambeth College site.Fig. 24 – Schema della prova nel sito del Lambeth College.
Fig. 25 – FO Instrumentation.Fig. 25 – Strumentazione a fibra ottica.

RIVISTA ITALIANA DI GEOTECNICA
26 SOGA
in the pile and the resistance mobilised at the pile-soil interface were inferred from the optical fibre distributed strain data response and a simplified conceptual model for thermal pile behaviour was proposed [AMATYA et al., 2012; BOURNE-WEBB et al., 2013]. This model explained the pile response in an idealised situation. Although the model sim-plified the complicated thermo-mechanical inter-action between pile and soil, it provided straight-
forward guideline to interpret the pile behaviour. It also formed the basis for extending knowledge about the thermal pile with different restrained head cases. This finding led to the development of the thermal pile standard recently published by the UK Ground Source Heat Pump Association [2012]. The standard is considered to be the most comprehensive document on thermal piles in the world.
Fig. 26 – Thermal loads applied to Main and Heat sink piles.Fig. 26 – Carichi termici applicati ai pali di prova.
Fig. 27 – Strain and load distribution in the heat sink pile.Fig. 27 – Profili della deformazione e del carico assiale per il palo dispersore.
a) Axial strain profile b) Axial load profile

27
OTTOBRE - DICEMBRE 2014
UNDERSTANDING THE REAL PERFORMANCE OF GEOTECHNICAL STRUCTURES USING AN INNOVATIVE FIBRE OPTIC…
3.5. Secant piled wall for UCLH building, London
3.5.1. SITE
The new Cancer Centre, part of University College London Hospitals (UCLH) NHS Founda-tion Trust, is located at Huntley Street in central London. The new building replaced an existing building which had occupied four floors in addi-tion to a one-level underground basement. The building at the North Western corner of the site, the Rayne Institute (see Fig. 33), presented a chal-lenge due to its very close proximity to the exca-vation works.
Figure 34 gives an overview of the site. Most cru-cial was the monitoring of the 508 mm secant piled wall next to the Rayne building. The first line of bearing piles was only about 1.4m away from the centre-line of the new wall. The ground conditions are Made Ground at the top underlain by London Clay, the Lambeth Group, the Thanet Sands and Chalk. To minimise the excavation induced ground movement, a secant piled wall with reduced diam-eter piles were used to minimise the impact during the wall installation. Two levels of propping were adopted.
Ribbon FO cables (see Fig. 6b) were attached to the outside of the inclinometer casing to enable di-
Fig. 28 – Mechanism of heating of thermal pile without mechanical loadFig. 28 – Meccanismo di generazione degli sforzi per il palo dispersore privo di carichi aggiuntivi.
Fig. 29 – Development of shaft friction with temperature.Fig. 29 – Mobilitazione dell’attrito laterale al variare della temperatura.

RIVISTA ITALIANA DI GEOTECNICA
28 SOGA
rect comparisons between the two systems as shown in figure 35. The cables were first fixed to the bottom of the casing using epoxy glue and high duty tape in a loop configuration. A pre-tension of approximately 4000 µε was applied. On site the bottom casing was orientated so that the two FO cables were perpen-dicular to the wall for bending measurement. While additional casings were being lowered into the in-clinometer borehole, the FO cables were uncoiled from the two cable drums. They were pre-tensioned and fixed with high duty tape at the top of each ad-ditional piece of the inclinometer casing.
The FO cable installation was carried out in March 2010. The baseline readings were taken a few days after the casing had been grouted into the hole and before excavation started. Further sets of readings were taken at different excavation stages. The bending strain distribution of the wall can be obtained by taking the difference between the two FO strain data. Knowing the distance d between outer and inner fibre allows to calculate the delta-curvature, ∆κ (z’), as given in equation 4 (see Fig. 36).
(4)
The delta-slope, ∆α(z’), and the delta-wall de-flections, ∆u(z’), can be calculated:
(5)
(6)
Two boundary conditions are required to calculate the displacements from the strain data; it was assumed that the bottom of the pile is fixed (no rotation and no
a) Conceptual model b) Cooling c) Heating
Fig. 30 – Load distributions on the main test pile.Fig. 30 – Profilo del carico assiale sul palo di prova.
Fig. 31 – Shaft resistance profiles derived from the load profiles.Fig. 31 – Andamento della resistenza laterale in funzione dei tipi di carico applicato.

29
OTTOBRE - DICEMBRE 2014
UNDERSTANDING THE REAL PERFORMANCE OF GEOTECHNICAL STRUCTURES USING AN INNOVATIVE FIBRE OPTIC…
lateral displacement). The lateral displacements ob-tained, ∆u(z’), can then be plotted over pile depth z to give the required displacement profiles u(z).
3.5.2. DATA AND INTERPRETATION
Figure 37 shows the lateral displacements of the wall along the depth of the wall as evaluated from the FO strain data. For Pile 249 (Fig. 37a) and 219 (Fig, 37b), the wall deflections increases with increasing depth of excavation. The calculated deflection profile for exca-vation stage 1 indicates a cantilever deflected shape pro-file with a maximum deflection of approximately 2.4 mm at the top. The deflection profiles for excavation stages 2 and 3 for both piles show that the retaining wall exhibited a bulge into the excavation reaching its max-imum at roughly mid-depth while the top of the wall moved into the retained soil. The obtained maximum wall deflections were 3 mm and 3.2 mm (Pile 249) and 1.3 mm and 2.7 mm (Pile 219) at the end of excavation stages 2 and 3, respectively. For Pile 219 the measure-ments taken at excavation stage 1 could not be analysed due to high optical losses during data collection.
The results obtained from the optical fibres were compared with the inclinometer readings as shown in figure 37. It can be seen that the inclinometer data provides a data point every 0.5 m compared to 0.05 m for the BOTDR. The inclinometer had a specified displacement error of ±2 mm/25 m indicated by the thin dotted lines the figures. In general it can be seen, from both techniques, that the movements were very small (less than 4 mm at the end of excavation stage 3) and imposed no significant risk to the Rayne Insti-tute building.
Fig. 32 – Thermally induced stress increment with temper-ature at the middle of the main test pile.Fig. 32 – Incremento dello sforzo assiale nella sezione intermedia del palo, indotto dalla variazione di temperatura.
Fig. 33 – UCLH site view – Existing building was demolished for a new building.Fig. 33 – Vista d’insieme dell’UCLH – L’edificio preesistente è stato demolito per far posto ad una nuova costruzione.

RIVISTA ITALIANA DI GEOTECNICA
30 SOGA
3.5.3. ENGINEERING PERFORMANCE
The deflections of a secant pile wall, supporting a basement excavation for the new Cancer Centre, were monitored by using a number of inclinometers at specified locations. The maximum wall deflections were small (did not exceed 4 mm) and the inferred and measured wall deflections corresponded reason-ably well, confirming the ability of the BOTDR tech-nique to provide both bending strain and inferred wall deflections.
The wall deflections obtained from the optical fi-bre strain data consistently exhibited a similar shape to the inclinometer data, but some differences were observed in the magnitude of the displacements. The wall displacements calculated from the optical fibre strain measurements for Pile 249, during ex-cavation stages 1 and 2, were greater than the incli-nometer data by approximately 2 mm at the top; the agreement was good for excavation stage 3. Although
the shape of movements measured are realistic, the movements (about 4 mm maximum) are very small and are within the limits of the instrumentation accu-racy. Inclinometer data is integrated once to obtain the displacement profile, whereas FO data is integrat-ed twice to obtain the profile. The range of errors for the inclinometers is about 1.5 mm at the top of the wall as shown in the figure. The BOTDR analyser measures strain with an accuracy of 40 µε. Any biased error in one direction (say 10 µε) pushes the BOTDR instrument to the limit of its capability to measure 1.2 mm for 12 m excavation.
Another factor of uncertainty is introduced with the integration boundary conditions in equations 2 and 3. In particular, the assumption that the bottom of the pile experienced no rotation is open to ques-tion. In this study it was assumed that the bottom inclination angle was zero, which might not be the case. When examining the inclinometer data near the bottom of the pile, it can be seen that the incli-
Fig. 34 – a) Overview of excavation with inclinometer locations; b) Secant pile wall to be monitored with inclinometers and fibre optics instrumentation in Pile 249 – and 219 – and Rayne Institute piles.Fig. 34 – a) Planimetria generale dello scavo con indicazione della posizione degli inclinometri; b) paratia di pali secanti da monitorare con inclinometri e strumentazione a fibra ottica nei pali 249 e 219 e nei pali del Rayne Institute.

31
OTTOBRE - DICEMBRE 2014
UNDERSTANDING THE REAL PERFORMANCE OF GEOTECHNICAL STRUCTURES USING AN INNOVATIVE FIBRE OPTIC…
nation was not zero. Ideally the borehole would be deeper, so that the assumption of zero inclination angles at the bottom would be reasonable.
To obtain movement estimates from FO data, any biased error needs to be minimised with some data processing similar to what is conventionally per-formed for inclinometer data. As presented in the next section, this proved to be difficult for the case study of a very deep diaphragm wall. The movement was very small (5 mm) relative to the wall depth of 80 m and hence it was difficult to evaluate movement from the FO data. However, since the FO data pro-vided bending strain profile directly, it was very valua-ble to examine the structural performance of the wall during excavation.
3.6. Deep circular diaphragm wall at Abbey Mills
3.6.1. SITE
A FO monitoring was conducted at Thames Wa-ter’s Abbey Mills Shaft F, which is an integral part of the Lee Tunnel project in London. The project in-volved construction of four large diameter shafts and a 7.2 m diameter, 6.9 km Lee tunnel from Abbey Mills pumping station to the Beckton treatment works in east London. The shafts were the largest ever con-structed in the UK. The monitored shaft consisted of twenty 1.2 m thick and 84 m deep diaphragm wall panels, creating a 30 m diameter circular wall. The depth of excavation was 73 m deep and the wall pen-etrated into a series of soil layers (Terrace Gravel, London Clay, Lambeth Group, Thanet Sand Forma-tion, and Chalk Formation) as shown in figure 38. The hydrogeological conditions comprised two aqui-fers, a shallow and a deep aquifer separated by the London Clay and the Lambeth Group clay.
During the diaphragm wall installation, three out of the twenty 1.2 m thick and 84 m deep diaphragm wall panels were equipped with fibre optic instru-mentation. A capping beam was then constructed at the top of the diaphragm wall. The 71 m deep exca-vation started in April 2012 and was completed in September 2012. A 2 m thick base slab and a second-
Fig. 35 – Installation of optical fibre onto the inclinometer casing.Fig. 35 – Sistemazione della fibra ottica all’interno del tubo di rivestimento dell’inclinometro.
Fig. 36 – Obtaining delta-curvature, delta-inclination angle and delta-lateral displacement between excavation stages and reference data set.Fig. 36 – Stima della curvatura, dell’inclinazione e dello spostamento laterale tra le varie fasi di scavo con riferimento alla posizione iniziale.

RIVISTA ITALIANA DI GEOTECNICA
32 SOGA
ary lining were then installed inside the shaft. The 0.6 m wide annulus between the diaphragm walls and the secondary lining was filled with grout in April 2013.
The FO instrumentation was designed to meas-ure the development of the bending strain and the circumferential hoop strain of the wall during shaft excavation, as shown in figure 39. Six cages were spliced together to form a long reinforcement inside
the trench. Fibre optic cables were first attached on both sides of the bottom reinforcing cage in the ver-tical direction with pretension up to 2000 µε. The re-maining length of cable needed for the subsequent cages were coiled on cable drums, which were tempo-rarily fixed to the top of the bottom cage. While the bottom cage was placed in the bentonite-supported trench and spliced to the second cage, the FO cables in the drums were attached to the second cage. As
Fig. 37 – Lateral displacement profiles of a) Pile 249 – and b) Pile 219.Fig. 37 – Spostamenti laterali dei pali 249 (a) e 219 (b).
b) Pile 219
a) Pile 249

33
OTTOBRE - DICEMBRE 2014
UNDERSTANDING THE REAL PERFORMANCE OF GEOTECHNICAL STRUCTURES USING AN INNOVATIVE FIBRE OPTIC…
the cage was lowered into the trench, the FO cables were gradually unrolled from the drums and were at-tached to the cage using a special clamp. The four remaining cages were instrumented in a similar man-ner. The circumferential hoop strain cable was at-tached either on the second or third cage, where the hoop stresses were expected to be largest. Concreting was then done to construct a diaphragm wall. Further
details on the installation, data acquisition and data processing of the FO instrumentation can be found in SCHWAMB et al. [2014] and SCHWAMB [2014].
3.6.2. DATA AND INTERPRETATION
Selected curvature (i.e. bending strain) results are shown by the dotted lines in figure 40 in which
Fig. 38 – Site Layout at Abby Mills site.Fig. 38 – Disposizione della strumentazione presso il sito di Abbey Mills.

RIVISTA ITALIANA DI GEOTECNICA
34 SOGA
an incremental curvature change between different construction stages is given. Full details of the moni-toring data can be found in SCHWAMB [2014]. The ac-tual movement of the wall was very small; the later-al wall displacement was less than 4 mm. Therefore, the incremental plots were used to present the effect of the excavation on the bending behaviour. The in-cremental curvatures of approximately 1.5 x 10⁻⁴ m-1 and bending moments of 800 kNm were measured. The absolute values were slightly smaller with 1x10⁻⁴ m-1 and 550 kNm. A positive value indicates tension on the soil face and compression on the excavation
face. As expected, the wall was bending towards the shaft below the excavation level and away from the shaft above the excavation level. The design predic-tion is also plotted as the solid line in the figure; the incremental curvatures exceeded the predictions significantly when the excavation was done in Chalk. This is discussed further in the next section.
In figure 41, the hoop strain measurements at around 60 mbgl are plotted against the excavation level. The compressional hoop strain increased at shallow excavation depths; that is, strains between 0 and -200 µε (tension positive) are measured at an ex-cavation level of 15 mbgl. It then stays relatively con-stant until the excavation depth reaches the moni-toring level when a significant increase on compres-sive strain can be seen as expected; approximately -500 ±130 µε (tension positive) is measured at the fi-nal excavation depth.
Figure 41 also presents the design predictions. The measured hoop strain was approximately twice as large as that predicted at the final excavation depth. This is related to the increase in hoop strain when excavation is made at shallow depths. It ap-pears unrealistic that an excavation of 15 m induced hoop strains in the wall at deeper depth, as the clay layers present a hydraulic barrier which hinders the sump dewatering to affect the pore water pressures below them. Although speculative, this phenom-enon might be related to creep in the Chalk. Dia-phragm wall installation changed the stress states in the Chalk and may have led to time-dependent de-
Fig. 39 – FO cable instrumentation.Fig. 39 – Strumentazione mediante cavo a fibra ottica.
Fig. 40 – Bending strain profile at different level of excavation.Fig. 40 – Deformazioni flessionali per differenti livelli di scavo.

35
OTTOBRE - DICEMBRE 2014
UNDERSTANDING THE REAL PERFORMANCE OF GEOTECHNICAL STRUCTURES USING AN INNOVATIVE FIBRE OPTIC…
formation under constant stress. Further investiga-tion and modelling of the mechanical behaviour of Chalk are needed to better understand the perfor-mance of the wall.
3.6.3. ENGINEERING PERFORMANCE
As shown in figure 42, the bending predictions using the original design values (the solid black line) differed from the measurements when the excava-tion was done in Chalk (the two dashed lines. The
design used Mohr Coulomb model with a cohesion c’ of 20 kPa and a friction φ’ of 35°. Results show that plastic yielding occurred around the excavation lev-el, making the chalk deformable and hence allows the wall to gradually develop a bulge. When much larger yield stress was assigned (grey line, “Modified” in Fig. 42), the chalk behaves elastically during the excavation, which resulted in a sharper wall bulge and hence larger curvatures and bending moments. It therefore appears that the assumed yield surface was unrealistic with a small cohesion of c’ = 20 kPa.
Fig. 41 – Hoop strain development with increasing excavation depth.Fig. 41 – Sviluppo delle deformazioni trasversali all’aumentare delle profondità di scavo.
Fig. 42 – Computed bending strain profiles versus FO measurements.Fig. 42 – Confronto tra la curvatura calcolata e quella misurata mediante fibra ottica.

RIVISTA ITALIANA DI GEOTECNICA
36 SOGA
This value was recommended in the Geotechnical Interpretative Report as ‘moderately conservative’ based on CIRIA C574 [LORD et al. 2002]. While it is conservative for ground movement estimates, the above has shown that it is not for the structure. It should be noted here that, although the measured bending moments exceed the SLS predictions, the reinforcement in the wall was sufficient enough to carry the larger bending moments, as it has been designed according to the more conservative ULS loading. Further study is required for better under-standing of the mechanical behaviour of the Chalk in London and modelling of it (including creep).
Monitoring of the shaft gave valuable informa-tion on the bending and hoop response of the struc-ture, which was used to back-analyse the design. The data was very valuable for the design of future similar shafts, including those on the Thames Tideway Tun-nel project, which will start in 2015.
3.7. Tunnelling effect on an old masonry tunnel in London
3.7.1. SITE
Thameslink Tunnel (8.5 m diameter) is an old masonry tunnel constructed between 1865 and 1868 in London using the cut and cover method. In 2005, a new tunnel with an internal diameter of 6m was constructed underneath the existing masonry tun-nel at an angle of 21 degrees between the two align-ments (see Fig. 43a). Tunnelling was conducted in
stiff to very stiff London Clay using a semi-mecha-nized open shield tunnel boring machine. Over 100 m of the masonry tunnel was considered to be po-tentially affected. As shown in figure 43b, the mini-mum clearance was about 3.6 m from the extrados of the new tunnels to the extrados of the masonry tunnel. There was a surface line running above the ground and a canal crosses the surface line close to the position of the tunnel. One side of the canal had a masonry retaining wall and this wall was founded directly on the shoulder of the masonry tunnel over a length of about 50 m. This situation added further complication to the tunnel construction.
In addition to the extensive monitoring program using conventional monitoring technologies, FO ca-bles were attached at five cross sections and at three longitudinal sections (side walls and crown) of the old masonry tunnel as shown in figure 44. Along the circumferential sections, standard FO cable (Fig. 6a) was attached at eleven discrete sections per section. Figure 44 also shows the details of sensing fibre at-tachment along the circumference of tunnel. It was placed on the surface of the tunnel by spot gluing the cable at every steel hook that was drilled onto the brick-lining. The gluing was made once a pre-strain value of approximately 2000 µε was imposed on the optical fibre in order to measure compressive strains and to identify the positions of the measured section along the fibre from the BOTDR readout. A base reading was also taken before the tunnelling con-struction took place. Further details can be found in MOHAMAD et al. [2010] and MOHAMAD [2008].
Fig. 43 – Site geometry of Thames Link Tunnel project.Fig. 43 – Schema di progetto del Thames Link Tunnel.
a) Plan view b) Cross section

37
OTTOBRE - DICEMBRE 2014
UNDERSTANDING THE REAL PERFORMANCE OF GEOTECHNICAL STRUCTURES USING AN INNOVATIVE FIBRE OPTIC…
3.7.2. DATA AND INTERPRETATION
Figure 45 shows examples of the measured dis-tributed strain data along the circumference of the tunnel (CH514, CH516, CH518, CH520 and CH522 in Fig. 44) at different times of tunnelling. The solid lines represent the strain profile after the tunnelling machine passed under the old tun-nel and one or two rings of lining was installed, whereas the grey lines represent the strain profile when the tunnelling was completed. Conceptu-al models as well as expected strain development are also shown in the figure. Measurements show that the masonry structure elongated toward the new tunnel position as shown in the figures. The readings show compression to tension at CH522/CH520 (Fig. 45a), tension–compression-tension at CH518 (Fig. 45b) and tension–compression at CH516/CH514 (Fig. 45c). This corresponds well to the expected strain profile shown in the figure. At the point of the exact crossover (CH518, Fig. 45b), a symmetric deformation is observed, in-dicating vertical elongation of the tunnel. When the new tunnel moved away from the centreline of the old tunnel, the strain profile shifted. This is shown well in CH520 of figure 45a where larger tensile strains are measured in the east side where
the new tunnel is positioned, while in CH516 (Fig. 45c) larger tensile strains are recorded on the west side.
In CH516 (see Fig. 45c), the strain increased as the shield machine approached and a maxi-mum tensile strain of 0.25% was recorded when the TBM had reached seven metres beyond the masonry tunnel. This highly localized strain then reduced to about 0.13% after the tunnelling work completed. This indicates that the west wall side of the tunnel settled first as the tunnel was dragged toward the new tunnel. As the excavation contin-ued and the volume loss increased, the east wall side then settled causing less strain in the west wall.
Total station monitoring was conducted at ap-proximately every 5 m along the masonry tunnel and the largest movement recorded was approxi-mately 30 mm at the invert and west wall of HC516. The comparison of the two monitoring systems can be made by examining the changes in the distance between two prism points in the direction of fibre optics cable. Figure 46 compares the two measure-ment systems at HC520, HC518 and HC516. As de-scribed earlier, BOTDR gives a weighted average strain of a 1 m section. Since the lengths of some FO sections are less than 1 m, the actual strain be-tween two fixed points needs to be estimated from
Fig. 44 – FO cable installation.Fig. 44 – Installazione del cavo a fibra ottica.

RIVISTA ITALIANA DI GEOTECNICA
38 SOGA
the distributed strain profile using a deconvolution process given in MOHAMAD et al. [2010] and CHEUNG et al. [2010]. Figure 46 shows that the two measure-ment systems are broadly comparable and only two total station data points in figures 46a and 46b show
significantly different compressive strain, the exact cause of which is difficult to evaluate. At HC516 (see Fig. 46c), the total station gives a high tensile strain of about 0.13%, which corroborates well with the FO data.
Fig. 45 – Strain development at different times and deformation mechanism.Fig. 45 – Sviluppo delle deformazioni nel tempo e meccanismo di deformazione.
CH522
CH516
a) New tunnel on the east side of the existing tunnel
c) New tunnel on the west side of the existing tunnel.
b) New tunnel under the existing tunnel
CH520
CH514
CH518

39
OTTOBRE - DICEMBRE 2014
UNDERSTANDING THE REAL PERFORMANCE OF GEOTECHNICAL STRUCTURES USING AN INNOVATIVE FIBRE OPTIC…
3.7.3. ENGINEERING PERFORMANCE
The monitoring data provided an illustration of how an old tunnel behaves during construction of a new tunnel nearby. In this study, the strain begins to develop in advance of TBM reaching the area moni-tored. When the face of the TBM is in line with the monitoring section, the strains are approximately half of the peak value, which is subsequently reached when the shield has passed and one or two rings have been completed. The strains then decrease and sta-bilise leaving a residual strain change when the face of the TBM is four diameters past the monitoring lo-cation. The distributed strain data showed the defor-mation mechanism. Further details can be found in MOHAMAD et al. [2010].
The continuous data allowed identification of potential crack locations. After the tunnel construc-tion, a visual inspection was made and there was evi-
dence of hairline cracking around the west side of HC516, which recorded the largest tensile strain. The cracks were along the horizontal mortar of the brickwork and the width was about 0.5 mm. Using the residual strain profile measured from BOTDR, the displacement between the two FO fixing points near the crack was evaluated to be about 1.8 mm. When the largest tensile strain occurred (i.e. 0.25%), the displacement would be about 3.5 mm. Hence, it is possible that the crack width would probably have temporarily been bigger than the final residual value of 0.5 mm.
The FO data, total station measurements and vis-ual observations provided insights into the mecha-nism behind the engineering performance of the masonry tunnel subjected to tunnelling underneath. The FO data provided information on the distortion mechanism of the tunnel, which is often the key in-terest in engineering analysis. The accuracy of the analyser used in this study is 50 µε or about 0.05 mm for a gauge length of 1 m. The total station data, on the other hand, provides absolute movements of the tunnel because it often uses a reference outside the zone of influence and a typical accuracy is about 1-2 mm. At present, the monitoring criteria is often dis-placement based. Perhaps this is because the total station that gives displacement as output is often adopted. FO monitoring provides strain profile with potentially more accurate assessment in terms of dis-tortion. Further discussion among the geotechnical engineering community on how monitoring crite-ria are set when new sensor technologies emerge is needed.
3.8. Twin tunnel interaction during construction, Singapore
3.8.1. SITE
A field trial of BOTDR tunnel monitoring was conducted at the Circle Line 3 of the Singapore Mass Rapid Transit in 2006. The newly constructed Line consisted of twin circular bored tunnels of 6.35 m outer diameter, as shown in figure 47. A section of the tunnel alignments was constructed less than one tunnel diameter apart in order to avoid under-pinning the foundations of adjacent buildings. The zone of close proximity tunnelling was about 580 lin-ear metres of the tunnel alignment with a minimum clearance between the twin tunnels of 2.3 m (0.4 times the tunnel diameter). The aim of the monitor-ing was to analyse tunnel lining movement caused by the excavation of the second of the two tunnels (the inner-bound tunnel).
The twin tunnels were bored in granitic residu-al soils with various degrees of weathering. Each of the tunnels was bored with earth-pressure balance
Fig. 46 – Comparison of strain measurements between BOTDR and total station at (a) CH520, (b) CH518 and (c) CH516.Fig. 46 – Confronto tra le misure effettuate mediante fibra ottica BOTDR e quelle ottenute con la stazione totale nelle sezioni CH520 (a), CH518 (b) e CH516 (c).

RIVISTA ITALIANA DI GEOTECNICA
40 SOGA
tunnel boring machines (TBMs) operated in closed-mode. The outer bound tunnel was constructed be-fore the inner bound Tunnel with the two TBMs maintained at a minimum of 100 m apart. At the close proximity region, the soil between the two tunnels was reinforced with glass reinforced poly-mer dowels as shown in figure 48. They were drilled through the outer bound concrete segments and grouted prior the arrival of the second tunnel bor-ing machine.
A 900 micron tight buffered optical fibre (Fig. 6a) was attached around the circumference of the tunnel ring at 11 cross-sections as shown in fig-ure 48. At each cross-section, the fibre was epoxied onto pulleys to form gauge lengths of 1.1 m. After drilling 30mm into the segmental lining, wall plugs and hooks were inserted in the holes and used to
support the 30 mm diameter pulleys which were fixed onto the hooks by epoxy. Before the epoxy was applied the optical fibre was pre-strained, so that in the event of compression the optical fibre should not go slack. The pre-strain applied in this case was approximately 1500 µε. Further details can be found in MOHAMAD [2008] and MOHAMAD et al. [2012].
3.8.2. DATA AND INTERPRETATION
Figure 49 shows strain measurements record-ed along the optical fibre in selected instrumented rings. Tensile strain is taken as positive. BOTDR da-ta was taken every 30 minutes but the figure shows data (i) at the time of baseline reading, (ii) at the time when the face of the shield machine was next to the monitoring point and (iii) at the time when
a) Plan View
b) Subsurface Cross-section
Fig. 47 – Circle Line 3 of Singapore Mass Rapid Transit.Fig. 47 – Schema del tratto strumentato della Linea 3 della Mass Rapid Transit di Singapore.

41
OTTOBRE - DICEMBRE 2014
UNDERSTANDING THE REAL PERFORMANCE OF GEOTECHNICAL STRUCTURES USING AN INNOVATIVE FIBRE OPTIC…
the tunnel face was at least 2D away from the moni-toring point. When a new tunnel is excavated close-ly side by side to an existing tunnel, the existing tunnel is expected to deform in such way that the lining springlines are in compression while the crown and invert are in tension. A schematic dia-gram of such deformation is also shown in figure 49a. The average maximum compressive strain was roughly 400 µε. The maximum strain did not show any trend suggesting that the presence of the joints resulted in higher strains. The segments were joint-ed together using curve bolts vertically along the ring and horizontally between the rings. Because the joint positions always differ between the adja-cent rings, the effect of additional movement at the joint appears to be small.
Displacements of the inner bound tunnel were measured using total stations and convergence me-ters. The total station displacements were up to 4 mm, which was similar to the survey error of 3 mm. Several segments were monitored using more pre-cise convergence meters and they were compared indirectly with strains measured by BOTDR as ex-plained below.
It is not possible to convert strain measurements into lining displacements without having the fibre optic placed on both faces of the segment. The de-flection of any structural element can be obtained by having the fibre optics installed on two opposite fac-es of the concrete segments which gives the change of curvature or bending moments across the lining. The process of obtaining the deformed shape from distributed FO stain data requires analysis consider-ing the influence of the joints.
If it is assumed that the thrust force in the lining does not change and the measured strain is pure-ly due to bending moments (no joint rotation), it is possible to estimate the radial deflection for the data obtained in this case study. Figure 50 shows the estimated radial displacement profiles at se-lected rings. It is assumed that the maximum dis-placement occurs at the position where maximum compressive strain is located. The diameter change across the springlines of these rings are also shown in the figure. In general, an increase of tunnel dia-meter between 4 and 6 mm is observed. These val-ues are slightly larger than the field observation of 3-4 mm, which is mainly because of the relatively
Fig. 48 – Schematic of the outer bound/inner bound tunnels.Fig. 48 – Schema delle gallerie interna ed esterna.
a) Plan view
b) Cross-section

RIVISTA ITALIANA DI GEOTECNICA
42 SOGA
Fig. 49 – Strain profiles at differnet times.Fig. 49 – Profili di deformazione in momenti diversi.
a) Conceptual model
b) FO strain data

43
OTTOBRE - DICEMBRE 2014
UNDERSTANDING THE REAL PERFORMANCE OF GEOTECHNICAL STRUCTURES USING AN INNOVATIVE FIBRE OPTIC…
small tensile section near the crown associated with the development of axial compressive strain. The inward movement at R531 shows the assumption used is probably invalid, suggesting a larger propor-tion of the measured strain may come from the ax-ial strain. In fact, the strain distributions of R531 are mainly in compression with only minor tensile strain.
3.8.3. ENGINEERING PERFORMANCE
Figure 51 shows strain development against tun-nel face distance. A large proportion of the move-ment occurs ahead of the tunnel boring machine. The averaged proportion of strain in the lining when the face of the machine is located next to the meas-ured ring (εf) to the final measured strain (εmax) at the end of tunnelling is 0.7. The surface settlements above the three rings follow the typical longitudi-nal surface settlement and the averaged Sf/Smax (Sf is the surface settlement directly above the machine face and Smax is the maximum settlement) is 0.28. Hence a much larger proportion of the total strain change occurs in advance of the TBM face reaching the monitoring point than the proportion of surface settlement. This is an interesting behaviour of tun-nel-tunnel interaction and detailed numerical analy-sis such as by the Finite Element Method can be used to study the interaction between the two tunnels us-ing the appropriate tunnel and soil models, together with the appropriate type of analysis and taking into account of tunnel construction.
As discussed before, it is not possible to convert strain measurements into lining displacements with-out having the fibre optic placed on both faces of the segment. It is possible to do this by embedding FO cables inside tunnel segments as shown in figure 52. Such FO instrumented segments were recently installed in a power cable tunnel in London and we expect to present the data in the near future.
4. Conclusions
In recent years, sensor and communications re-search has been undergoing a quiet revolution, promising to have significant impacts on new genera-tion of monitoring technologies for civil engin-eering infrastructure. For example, an innovative distribut-ed fibre optic strain measurement system, which is in-troduced in this paper, can have thousands of “strain gauges” along a single cable connected to structures, embedded in soil or grouted into boreholes.
Because of the simple and quick installation technique, distributed optical fibre sensing can be as equally practical as the other conventional measure-ments. For extensive application to develop ‘smart’ geotechnical structures’, in which strain measure-ment becomes more routine than at present, cost is particularly important. As the cost of a standard op-tical fibre is very low compared to other point meas-urement sensors, most of the capital investment re-lates to the analyser, which can be connected to a number of fibres or be shared at different sites. More choice from more manufacturers will give a reduc-tion in price of analysers. It has considerable poten-tial as a system for long-term monitoring.
There are other numerous opportunities of using the distributed strain measurement techno-logy for other geotechnical structures. To accelerate the usage of emerging technologies, however, field demonstrations such as the ones shown in this paper are essential so that confidence within the communi-ty can be built. Other works at Cambridge University on distributed FO strain monitoring, which was not presented in this paper, are the following:(a) monitoring of water main pipeline during con-
struction of a tunnel underneath [VORSTER et al., 2006a-b];
(b) ground movement monitoring of clay cuttings and embankments along motorways [JANMONTA et al., 2008];
a) R531 b) R552
Fig. 50 – Radial displacements integrated from measured FO strain data.Fig. 50 – Spostamenti radiali dedotti mediante integrazione dei dati misurati dai sensori a fibra ottica.
c) R559

RIVISTA ITALIANA DI GEOTECNICA
44 SOGA
(c) performance monitoring of soil nails for stabiliz-ing steep highway curt slope [AMATYA et al., 2008];
(d) joint movement monitoring of tunnel lining in London Underground tunnel [CHEUNG et al., 2010];
(e) lateral movement monitoring of a secant piled wall [MOHAMAD et al., 2011];
(f) monitoring of an old cast iron tunnel affected by new tunnel construction [ALHADDAD et al., 2014; GUE et al., 2014].Although more case studies are required to build
further confidence in using such sensor systems for routine usage, the potential advantages of using distrib-
uted fibre optic systems for monitoring geotechnical structures are discussed in this paper. At the same time, the current limitations are identified for future work.
There are a number of benefits of using new innovative sensor technologies such as distributed FO sensing. The most obvious one is the increased safety levels they can provide to cope with adjacent new constructions and with natural disasters such as flood warnings and earthquakes. It is envisaged that the application of emerging sensor technologies to advanced health monitoring of new and existing crit-ical infrastructure assets will reduce the risk of fail-ure. Furthermore, byh understating the real perfor-
a) Ring 503
b) Ring 510
c) Ring 524
Fig. 51 – Development of compressive strain and surface settlement with distance away from the Inner Tunnel TBM.Fig. 51 – Sviluppo degli sforzi di compressione e dei cedimenti in superficie in funzione della distanza della TBM della galleria interna.

45
OTTOBRE - DICEMBRE 2014
UNDERSTANDING THE REAL PERFORMANCE OF GEOTECHNICAL STRUCTURES USING AN INNOVATIVE FIBRE OPTIC…
mance of geotechnical structures, cost savings and improve competitiveness can be expected, which in turn induces a step change in the construction in-dustry’s conservative design approach. Ultimate-ly the development of ‘smart’ geostructures means true realisation of performance based design and maintenance, which resonates well to Professor Ar-rigo Croce’s sprit of ‘closing the ga p between theory and applications’.
Acknowledgements
First I would like to thank Dr Loizos Pelacanos for conducting the FE pile analyses and drawing several figures presented in this paper. Dr Cedric Kechavarzi kindly reviewed the manuscript. The case studies presented in this paper are the out-
comes of the intellectually stimulating and hard work done by my past and present research col-leagues at Cambridge. These include Keita Abe, Mehdi Alhaddad, Mohamad Alserdare, Binod Amatya, Peter Bennett, Xuesong Cheng, Loret-ta Cheung, Mohammed Elshafie, Njemile Faus-tin, C.Y. Gue, Akio Hada, Koson Janmonta, Assaf Klar, Peter Knott, Yusuke Kobayashi, Andy Leung, Robert Mair, Tsukasa Mizutani, Hisham Moham-ad, Masanari Nakashima, Echo Ouyang, Satoko Ryuou, Tina Schwamb, Clara Shea, Seda Torisu, Kiwamu Tsuno, Taro Uchimura, Eduard Vorst-er, Fei Wang, Matthew Wilcock, Xiaomin Xu, Jize Yan and Dan Zhang. The field studies could not be done by commitments from my industry part-ners. In particular, I would like to thank Rab Fern-ie of Cementation Skanska, who suggested to me about ten years ago that I should try fibre optics
Fig. 52 – FO instrumented tunnel segments.Fig. 52 – Segmenti di una galleria con strumentazione a fibra ottica.

RIVISTA ITALIANA DI GEOTECNICA
46 SOGA
monitoring. The people who supported the early work of FO monitoring research at Cambridge in-cludes Cementation Skanska (Peter Bourne-Webb, Andrew Bell, Martin Pedley), Geothermal Inter-national (Tony Amis and Chris Davidson), Lon-don Underground (Keith Bowers and Neil Moss), Tubelines-Halcrow-CH2MHill (Peter Wright), Highways Agency (Raphael Lung), GCG (Kelvin Higgins, Hugh St John), Kellar-Geotechique (Phil-ip Ball), Arup (Duncan Nicholson, Adam Pellow, Mike Devriendt), Laing O’Rourke and Thames Water (John Greenwood).
References
ADAM D., MARKIEWICZ R. (2009) – Energy from earth-coupled structures, foundations, tunnels and sewers. Géotechnique, vol. LIX, n. 4, pp. 229-236.
ALHADDAD M., WILCOCK M., GUE C.Y., BEVAN H., STENT S., ELSHAFIE M.Z.E.B., SOGA K., DEVRIENDT M., WRIGHT P., WATERFALL P. (2014) – Multi-suite monitoring of an existing cast iron tunnel subjected to tunnelling-induced ground movements. Geotechnical Special Publica-tion, pp. 293-307, ISSN 0895-0563.
AMATYA B.L., SOGA K. BENNETT P.J., UCHIMURA T., BALL P., LUNG R. (2008) – Installation of optical fibre strain sensors on soil nails used for stabilising steep highway cut slope, Proceedings of 1st ISSMGE Internation-al Conference on Transportation Geotechnics, pp. 276-282.
AMATYA B. L., SOGA K., BOURNE-WEBB P.J., AMIS T., LA-LOUI L. (2012) – Thermomechanical behaviour of ener-gy piles. Géotechnique, vol. LXII, n. 6, pp. 503-519.
BAO X., CHEN L. (2011) – Recent Progress in Brillouin Scattering Based Fibre Sensors. Sensors, vol. XI, pp. 4152-4187.
BELL A., SOGA K., OUYANG Y., YAN J., WANG F. (2013) – The role of fibre optic instrumentation in the re-use of deep foundations. Proceedings of the 18th International Conference on Soil Mechanics and Geotechnical Engineering, Paris, pp. 1863-1866.
BENNETT P.J., KOBAYASHI Y., SOGA K., WRIGHT P. (2010a) – Wireless Sensor Network for Monitoring of Under-ground Tunnel. Proceedings of ICE, Geotechnical Engineering, vol. LXIII, n. GE3, pp. 147–156.
BENNETT P.J., SOGA K., WASSELL I.J., FIDLER P., ABE K., KOBAYASHI Y., VANICEK M. (2010b) – Wireless Sensor Networks for Underground Railway Applications: Case studies in Prague and London. Smart Structures and Systems, vol. VI, nn. 5-6, pp. 619-639.
BOURNE-WEBB P. J., AMATYA B., SOGA K., AMIS T., DAVID-SON C., PAYNE P. (2009) – Energy pile test at Lambeth College, London: geotechnical and thermodynamic as-pects of pile response to heat cycles. Géotechnique, vol. LIX, n. 3, pp. 237-248.
BOURNE-WEBB P.J., AMATYA B., SOGA K. (2013) – A frame-work for understanding energy pile behaviour. Proceed-
ings of the ICE, Geotechnical Engineering, 166, n. 2, pp. 170-177.
BRANDL H. (2006) – Energy foundations and other ther-mo-active ground structures. Géotechnique, vol. LVI, n. 5, pp. 81-122.
CHEUNG L.L.K., SOGA K., BENNETT P.J., KOBAYASHI Y., AMATYA B., WRIGHT P. (2010) – Optical fibre strain measurement for tunnel lining monitoring. Proceedings of ICE, Geotechnical Engineering, vol. CLXIII, n. GE3, pp. 119–130.
CHIAO R., TOWNES C., STOICHEFF B. (1964) – Stimulated Brillouin Scattering and Coherent Generation of Intense Hypersonic Waves. Physical Review Letters, n. 12, pp. 592-595.
CHIN J.T., POULOS H.G. (1991) – A “T-Z” approach for cyclic axial loading analysis of single piles. Computers And Geotechnics, vol. XII, pp. 289-320.
CULVERHOUSE D., FARAHI F., PANNELL C., JACKSON D. (1989) – Potential of stimulated Brillouin scattering as sensing mechanism for distributed temperature sensors. Electronics Letters, vol. XXV, n. 14, pp. 913-915.
DUNBAR J. (2013) – Personal communication.FERRI M., MANCARELLA F., SESHIA A., RANSLEY J., SOGA
K., ZALESKY J., RONCAGLIA A. (2009) – Development of MEMS strain sensors for crack monitoring in ageing civ-il infrastructures. Smart Structures and Systems, vol. VI, n. 3, pp. 225-238.
GARBER D., CHOUDHARY R., SOGA K. (2013a) – Risk based lifetime costs assessment of a ground source heat pump (GSHP) system design: Methodology and case study. Building and Environment, vol. CL, n. 2, pp. 66-80.
GARBER D., SOGA K., CHOUDHARY R. (2013b) – Post-oc-cupancy assessment of thermal-pile and open-well Ground Source Heat Pump. ASHRAE Transactions, vol. CXIX, n. 7, pp. 2.
GARUS D., KREBBER K., SCHLIEP F. (1996) – Distributed sensing technique based on Brillouin optical-fiber frequen-cy-domain analysis. Opt. Lett., vol. XXI, pp. 1402-1404.
GROUND SOURCE HEAT PUMP ASSOCIATION (2012) – Ther-mal Pile Design, Installation & Materials Standards. National Energy Centre.
GUE C.Y., WILCOCK M., ALHADDAD M.M., ELSHAFIE M.Z.E.B., SOGA K., MAIR R.J. (2014) – BOTDR Dis-tributed Fibre Optic Strain Sensing for the Monitoring of an Existing Cast Iron Tunnel. The 5th International Forum on Opto-electronic Sensor-based Monitor-ing in Geo-engineering, Nanjing, China.
HORIGUCHI T., TATEDA M. (1989) – Optical-fiber-attenu-ation investigation using stimulated Brillouin scattering between a pulse and a continuous wave. Opt. Lett., vol. XIV, pp. 408-410.
HORIGUCHI T., SHIMIZU K., KURASHIMA T., TATEDA M., KOYAMADA Y. (1995) – Development of a distributed sens-ing technique using Brillouin scattering: Optical fiber sensors. Journal of lightwave technology, vol. XIII, n. 7, pp. 1296-1302.

47
OTTOBRE - DICEMBRE 2014
UNDERSTANDING THE REAL PERFORMANCE OF GEOTECHNICAL STRUCTURES USING AN INNOVATIVE FIBRE OPTIC…
HOULT N.A., BENNNET P.J., STOIANOV I., MAKSIMOVI� C., MIDDLETON C.R., GRAHAM N.J.G., SOGA K. (2009) – Wireless Sensor Networks: creating ‘Smart Infrastructure’. Proceedings of ICE, Civil Engineering, vol. CLXII, August 2009, pp. 136-143.
HOULT N.A., SOGA K. (2013) – Sensing solutions for as-sessing and monitoring tunnels. In: Sensor Technolo-gies for Civil Infrastructures, volume II, Applica-tions in Structural Health Monitoring, Wang, M.L., Lynch, J.P. and Sohn, H. (Eds.), Woodhead Pub-lishing.
JANMONTA K., UCHIMURA T., AMATYA B.L., SOGA K., BEN-NETT P.J., LUNG R., ROBERTSON I. (2008) – Fibre Optics Monitoring of Clay Cuttings and Embankments along London’s Ring Motorway. GeoCongress 2008, “Char-acterization, Monitoring and Modeling of Geosys-tems”, ASCE Geotechnical Special Publication n. 179, pp. 509-516.
KURASHIMA T., HORIGUCHI T., TATEDA M. (1990) – Dis-tributed-temperature sensing using stimulated Brillouin scattering in optical silica fibers. Opt. Lett., vol. XV, pp. 1038-1040.
LEUNG A.Y. (2010) – Foundation optimization and its ap-plication to pile reuse. PhD dissertation, University of Cambridge.
LORD J., CLAYTON C., MORTIMORE R. (2002) – CIRIA C574 Engineering in chalk. CIRIA, London.
LUBACH A. (2010) – Bentonite cavities in diaphragm walls: Case studies, process decomposition, scenario analysis and laboratory experiments. MSc thesis, Delft University of Technology.
MOHAMAD H. (2008) – Distributed Optical Fibre Strain Sensing of Geotechnical Structures. PhD thesis, Univer-sity of Cambridge.
MOHAMAD H., BENNETT P.J., SOGA K. MAIR R.J., BOWERS K. (2010) – Behaviour of an Old Masonry Tunnel Due to Tunnelling Induced Ground Settlement. Géotech-nique, vol. LX, n. 12, pp. 927-938.
MOHAMAD H., SOGA K., PELLOW A. (2011) – Performance Monitoring of a secant piled wall using distributed fibre optic strain sensing. Journal of Geotechnical and Geoenvironmental Engineering, vol. CXXXVII, n. 12, pp. 1236-1243.
MOHAMAD H., SOGA K., BENNETT P.J., MAIR R.J., LIM C.S. (2012) – Monitoring Twin Tunnel Interactions Using Distributed Optical Fiber Strain Measurements. Jour-nal of Geotechnical and Geoenvironmental Engin-eering, American Society of Civil Engineers, vol. CXXXVIII, n. 8, pp. 957-967.
MOHAMAD H., SOGA K., AMATYA B. (2014) – Ther-mal Strain Sensing of Concrete Piles Using Brillouin Optical Time Domain Reflectometry. Geotechnical Testing Journal, ASTM, vol. XXXVII, n. 2, pp. 20120176.
NICHOLSON D. (2013) – Personal communication.NIKLES M., THEVENAZ L., ROBERT P.A. (1996) – Simple
distributed fiber sensor based on Brillouin gain spectrum analysis. Opt. Lett., vol. XXI, pp. 758-760.
OHNO H., NARUSE H., KIHARA M., SHIMADA A. (2001) – Industrial applications of the BOTDR optical fiber strain sensor. Optical fiber technology, vol. VII, n. 1, pp. 45-64.
OUYANG Y. (2014) – Geotechnical behaviour of energy piles. PhD thesis, University of Cambridge.
SCHWAMB T. (2014) – Performance Monitoring and Nu-merical Modelling of a Deep Circular Excavation. PhD thesis, University of Cambridge.
SCHWAMB T., SOGA K., MAIR R. J., ELSHAFIE M. Z., SUT-HERDEN R., BOQUET C., GREENWOOD J. (2014) – Fibre optic monitoring of a deep circular excavation. Proceed-ings of the ICE - Geotechnical Engineering, vol. CLXVII, n. 2, pp 144-154.
SHEA C. (2012) – Development of non-linear soil model for foundation reuse. M. Eng. Thesis, University of Cam-bridge.
SHIMIZU K., HORIGUCHI T., KOYAMADA Y. (1995) – Meas-urement of distributed strain and temperature in a branched optical fiber network by use of Brillouin opti-cal time-domain reflectometry. Opt. Lett., vol. XX, pp. 507-509.
SOGA K., SHOURESHI R. (2010) – Special Issue on Innova-tive Monitoring Technologies for Civil Infrastructure Sys-tems Preface. Smart Structures and Systems, vol. VI, n. 3, pp. I-I.
SOGA K. (2012) – Emerging sensing technologies for geo-technical engineering – a case study. Proc. of the In-ternational Workshop on ICT in Geo-Engineering, Miyata, Y., Okayasu, T., Furuya, H., Uchimura, T. and Otani, J. (Eds.), pp. 13-23.
SOGA K. (2013) – Smart Geo-Infrastructure – Opportu-nities for new sensor monitoring systems. Geotechnics for Sustainable Development - Geotec Hanoi 2013, Phung (Eds.). Construction Publisher.
STAJANO F., HOULT N., WASSELL I., BENNETT P., MIDDLE-TON C., SOGA K. (2010) – Smart Bridges, Smart Tun-nels: Transforming Wireless Sensor Networks from Re-search Prototypes into Robust Engineering Infrastructure. Ad Hoc Networks, vol. VIII, pp. 872-888.
STENT S., GHERARDI R., STENGER B., SOGA K., CIPOLLA R. (2014) – Visual Change Detection on Tunnel Linings. Machine Vision and Applications, to appear.
SUCKLING T. P., SMITH P. E. H. (2002) – Environmentally Friendly Geothermal Piles At Keble College, Oxford, UK. In: Proceedings of the “Ninth International Con-ference on Piling and Deep Foundations”, 2002, Nice, France, Deep Foundations Institute, New Jer-sey, USA.
VORSTER T.E.B., SOGA K., MAIR R.J., BENNETT P.J., KLAR A., CHOY C.K. (2006a) – The use of fibre optic sensors to monitor pipeline behaviour. ASCE Geocongress 2006, pp. 1-6. doi: 10.1061/40803(187)33.
VORSTER T.E.B., MAIR R.J, SOGA K., KLAR A., BENNETT P.J. (2006b) – Using BOTDR fiber optic sensors to moni-tor pipeline behavior during tunneling. 3rd European Workshop on Structural Health Monitoring, July 5-7, Granada, Spain, pp. 930-937.

RIVISTA ITALIANA DI GEOTECNICA
48 SOGA
Comprensione del comportamento reale di opere geotecniche attraverso un sistema innovativo per la misura delle deformazioni tramite sensori distribuiti in fibra ottica
Sommario
Nell'ingegneria geotecnica il monitoraggio in situ è fondamentale per assicurarsi che il progetto sia affidabile, che la costruzione sia eseguita in sicurezza e che l'opera geotecnica in costruzione soddisfi le specifiche stabilite dalla committenza. Il monitoraggio deve arricchire il bagaglio di esperienza ingegneristica attraverso il confronto del comportamento reale con quello previsto dal progetto. In questa conferenza viene presentato un sistema innovativo per la misura delle deformazioni tramite sensori distribuiti in fibra ottica. Il sistema equivale a miglia di estensimetri disposti lungo un cavo
connesso a strutture, immerso nel terreno o cementato in un foro di sondaggio. La semplice e veloce procedura d’installazione fa sì che la misura con sensori distribuiti in fibra ottica sia confrontabile con quella di altre tecniche convenzionali. In questa nota sono descritti diversi casi di studio in cui i sensori distribuiti in fibra ottica sono stati utilizzati per monitorare il comportamento di strutture geotecniche durante la costruzione o sotto l'influenza di strutture adiacenti.
La disponibilità di dati di deformazione distribuiti all’interno delle strutture ha fornito ulteriori conoscenze sul comportamento “reale”di pali, muri di sostegno e gallerie, difficilmente ottenibili con sistemi di monitoraggio di tipo convenzionale. La comprensione del comportamento effettivo o “reale” delle opere geotecniche consente di costruire strutture che siano potenzialmente più economiche (ridotto diametro dei pali, paratie più sottili e minori strutture di rinforzo) e tuttavia sicure. L’utilizzazione dei più recenti ritrovati nel campo della strumentazione in situ e dei sistemi di monitoraggio, consente di raggiungere una maggiore incisività nel colmare lo iato esistente tra teoria e applicazioni pratiche.