understanding the report on hiv/aids in ontario
DESCRIPTION
Understanding the Report on HIV/AIDS in Ontario. Greta Bauer, PhD, MPH Epidemiology & Biostatistics The University of Western Ontario. John Maxwell Director of Policy and Communications AIDS Committee of Toronto. Report on HIV/AIDS in Ontario. Annual report produced since 1998 - PowerPoint PPT PresentationTRANSCRIPT

ACT Research Day --- 7 May 2009
Understanding the Report on Understanding the Report on HIV/AIDS in OntarioHIV/AIDS in Ontario
Greta Bauer, PhD, MPH
Epidemiology & BiostatisticsThe University of Western Ontario
John Maxwell
Director of Policy and Communications
AIDS Committee of Toronto

ACT Research Day --- 7 May 2009
Report on HIV/AIDS in OntarioReport on HIV/AIDS in Ontario
Annual report produced since 1998
Funded by the AIDS Bureau
Produced by the Ontario HIV Epidemiologic Monitoring Unit at the University of Toronto
Authors (2008): Robert Remis, Carol Swantee, Lorraine Schiedel, Juan Liu
Tracks the HIV epidemic in Ontario
Available at: www.phs.utoronto.ca/ohemu

ACT Research Day --- 7 May 2009
Jargon AlertJargon Alert

ACT Research Day --- 7 May 2009
HIV/AIDS EpidemiologyHIV/AIDS Epidemiology
1.Not perfect2.Not meaningless

ACT Research Day --- 7 May 2009
What is needed to have perfect versions What is needed to have perfect versions of current statistics?of current statistics?
1. Know HIV status of everyone
2. Identify new infections when acquired
3. Be able to determine exactly how each transmission occurred
4. Have accurate AIDS diagnoses for everyone
5. Know perfectly whether HIV/AIDS was a cause for each death
6. Know exact population sizes for exposure categories (e.g. MSM, IDU, people from endemic countries, high-risk heterosexual…)

ACT Research Day --- 7 May 2009
STATISTICS = DATA + STATISTICS = DATA + ASSUMPTIONSASSUMPTIONS

ACT Research Day --- 7 May 2009
Where do data used in the Ontario Where do data used in the Ontario Report come from?Report come from?
HIV test numbers and results HIV Laboratory – Central Public Health Laboratory, Ontario Ministry of Health and Long-Term Care (and five regional laboratories)
AIDS case diagnoses Public Health Division, Ontario Ministry of Health and Long-Term Care
Population size estimates by health region
Statistics Canada
Infant HIV infections Canadian Pediatric AIDS Research Group, Ontario Region
HIV-related deaths (ICD codes) Vital records - Registrar General
ACT Research Day --- 7 May 2009
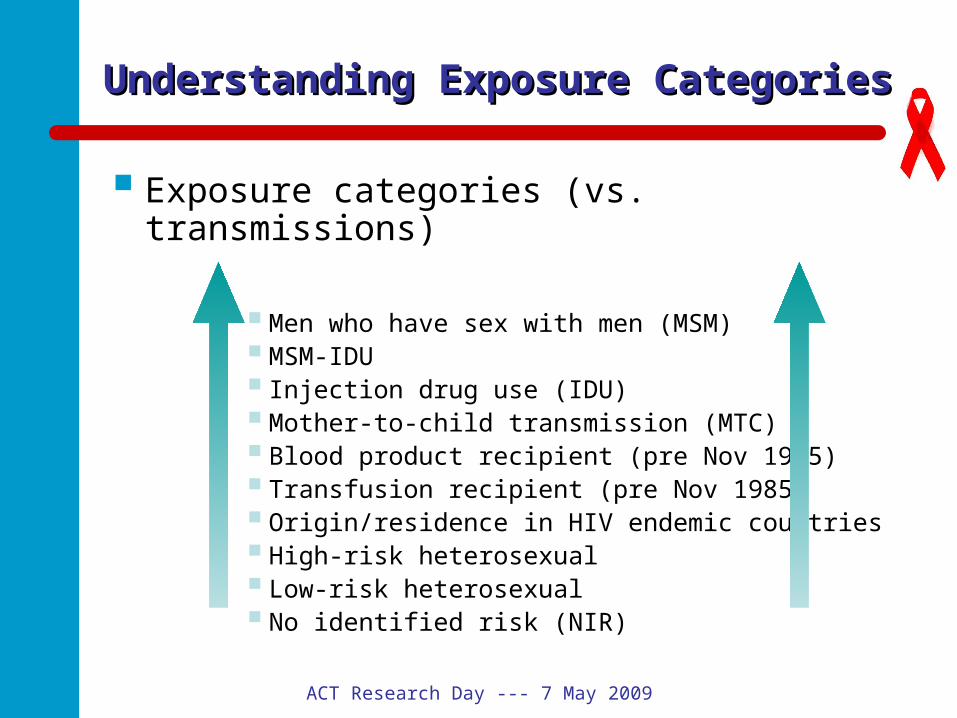
Understanding Exposure Understanding Exposure CategoriesCategories
Exposure categories (vs. transmissions)
Men who have sex with men (MSM)MSM-IDU Injection drug use (IDU)Mother-to-child transmission (MTC) Blood product recipient (pre Nov 1985) Transfusion recipient (pre Nov 1985)Origin/residence in HIV endemic countriesHigh-risk heterosexual Low-risk heterosexualNo identified risk (NIR)

ACT Research Day --- 7 May 2009
Some assumptions…Some assumptions…
Continued…

ACT Research Day --- 7 May 2009
Proportion of New HIV Diagnoses, Proportion of New HIV Diagnoses, Including Unknown Exposure GroupIncluding Unknown Exposure Group
0%
20%
40%
60%
80%
100%
1985
1986
1987
1988
1989
1990
1991
1992
1993
1994
1995
1996
1997
1998
1999
2000
2001
2002
2003
2004
2005
2006
MSM MSM-I DU I DU Clotting Factor
Transfusion HI V-endemic HR Hetero LR Hetero
MTC Other Unknown

ACT Research Day --- 7 May 2009
Proportion of New HIV Diagnoses, Proportion of New HIV Diagnoses, Where Exposure Group KnownWhere Exposure Group Known
0%
10%
20%
30%
40%
50%
60%
70%
80%
90%
100%
1985
1986
1987
1988
1989
1990
1991
1992
1993
1994
1995
1996
1997
1998
1999
2000
2001
2002
2003
2004
2005
2006
MSM MSM-I DU I DU Clotting Factor
Transfusion HI V-endemic HR Hetero LR Hetero
MTC Other

ACT Research Day --- 7 May 2009
Number and Proportion of Number and Proportion of New HIV DiagnosesNew HIV Diagnoses
0
500
1000
1500
2000
2500
1985
1986
1987
1988
1989
1990
1991
1992
1993
1994
1995
1996
1997
1998
1999
2000
2001
2002
2003
2004
2005
2006
MSM MSM-I DU I DU Clotting Factor
Transfusion HI V-endemic HR Hetero LR Hetero
MTC Other Unknown

ACT Research Day --- 7 May 2009
Raw vs. Modelled StatisticsRaw vs. Modelled Statistics
Modelling Adjust for duplicate HIV tests
Estimate proportion undiagnosed
Assume those with unknown exposure group distributed in accordance with known exposure groups
Estimate distribution by sex and geographic area
Adjust for different rates of testing
Estimate HIV infection numbers
Estimate AIDS cases, adjusting for reporting delays
Adjust estimates of HIV-related mortality for under ascertainment
Estimate population sizes

ACT Research Day --- 7 May 2009
Some Statistics in the ReportSome Statistics in the Report
HIV Diagnoses (case counts)
Proportion of HIV Diagnoses by Exposure Category
HIV Prevalence
HIV Cumulative Incidence
HIV Incidence / Incidence Density
AIDS Diagnoses (case counts)
Proportions of AIDS Cases by Exposure Category
AIDS Cumulative Incidence
HIV-related Mortality

ACT Research Day --- 7 May 2009
PREVALENCE vs INCIDENCEPREVALENCE vs INCIDENCE
Prevalence – How common is it for people to be living with HIV?
Incidence – At what rate do new infections occur amongst those at risk?

ACT Research Day --- 7 May 2009
HIV PREVALENCEHIV PREVALENCE
# People Living with HIV # People Living with HIV
== x 100x 100
# in Population# in Population
presented as a percentagepresented as a percentage
ACT Research Day --- 7 May 2009
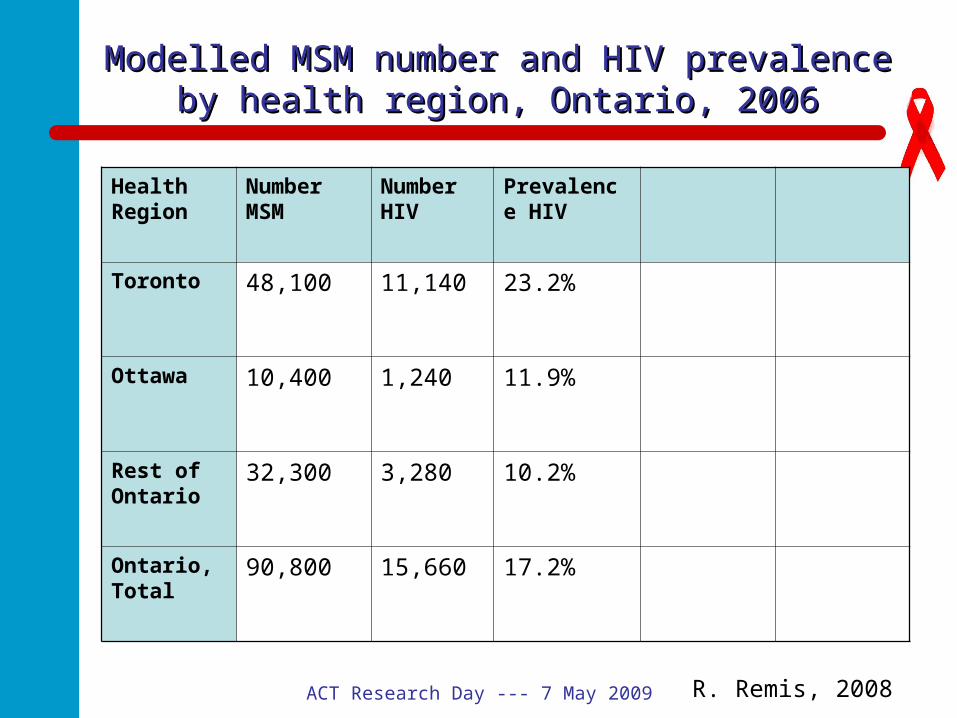
Modelled MSM number and HIV prevalence by Modelled MSM number and HIV prevalence by health region, Ontario, 2006health region, Ontario, 2006
Health Region
Number MSM
Number HIV
Prevalence HIV
Toronto 48,100 11,140 23.2%
Ottawa 10,400 1,240 11.9%
Rest of Ontario
32,300 3,280 10.2%
Ontario, Total
90,800 15,660 17.2%
R. Remis, 2008

ACT Research Day --- 7 May 2009
What influences changes in HIV What influences changes in HIV prevalence statistics over time?prevalence statistics over time?
Changes in number of new cases of HIV Changes in duration of illness
Longer survival = higher prevalence of HIV
Changes in HIV testing Overall changes in rates of testing Different rates of testing between groups
(adjusted statistically) Policies (immigration testing, prenatal testing)
Improvements in HIV testing Changes in estimates of (sub)population
size

ACT Research Day --- 7 May 2009
What influences changes in proportion What influences changes in proportion of prevalent cases over time?of prevalent cases over time?
Changes in prevalence for the group you’re interested in
Changes in prevalence for all other groups

ACT Research Day --- 7 May 2009
PREVALENCE vs INCIDENCEPREVALENCE vs INCIDENCE
Prevalence – How common is it for people to be living with HIV?
Incidence – At what rate do new infections occur amongst those at risk?

ACT Research Day --- 7 May 2009
HIV CUMULATIVE INCIDENCEHIV CUMULATIVE INCIDENCE
# cumulative HIV diagnoses# cumulative HIV diagnoses
==
1996 population (midpoint)1996 population (midpoint)

ACT Research Day --- 7 May 2009
HIV INCIDENCE DENSITYHIV INCIDENCE DENSITY
# new HIV diagnoses# new HIV diagnoses
= x = x 100100
Person-years at riskPerson-years at risk
presented per 100 person-yearspresented per 100 person-years

ACT Research Day --- 7 May 2009
Example: 1 per 50 person-yearsExample: 1 per 50 person-years

ACT Research Day --- 7 May 2009
Modelled MSM number, HIV prevalence andModelled MSM number, HIV prevalence andincidence by health region, Ontario, 2006incidence by health region, Ontario, 2006
Health Region
Number MSM
Number HIV
Prevalence HIV
Annual HIV Incidence (no.)
Annual HIV Incidence (%)
Toronto 48,100 11,140 23.2% 620 1.7%
Ottawa 10,400 1,240 11.9% 100 1.1%
Rest of Ontario
32,300 3,280 10.2% 170 0.59%
Ontario, Total
90,800 15,660 17.2% 890 1.2%
R. Remis, 2008

ACT Research Day --- 7 May 2009
What influences changes in HIV What influences changes in HIV incidence statistics over time?incidence statistics over time?
Changes in number of new cases of HIV Changes in estimates of prevalence Changes in HIV testing
Overall changes in rates Different rates of testing between groups
(adjusted statistically) Policies (immigration testing, prenatal testing)
Improvements in HIV testing Changes in estimates of (sub)population
size

ACT Research Day --- 7 May 2009
AIDS Diagnoses and AIDS Diagnoses and Cumulative IncidenceCumulative Incidence
HIV vs. AIDS

ACT Research Day --- 7 May 2009
What influences changes in AIDS What influences changes in AIDS statistics over time?statistics over time?
Changes in treatment and duration of illness Healthier survival = lower prevalence of
AIDS
Different rates of AIDS diagnosis between groups
Changes in definition of AIDS Changes in estimates of
(sub)population size
ACT Research Day --- 7 May 2009
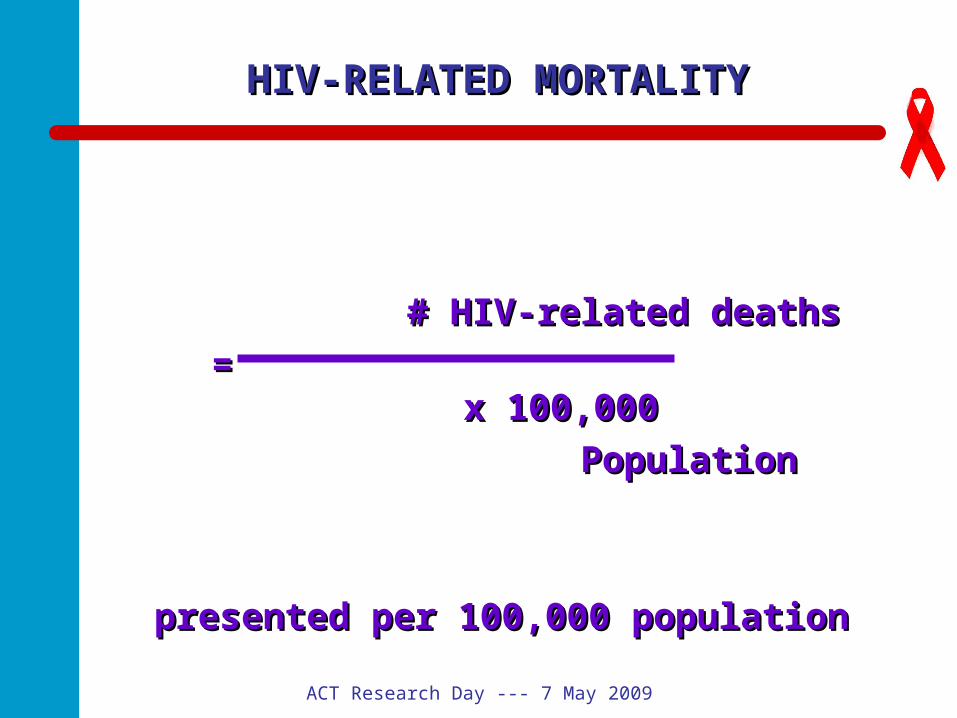
HIV-RELATED MORTALITYHIV-RELATED MORTALITY
# HIV-related deaths# HIV-related deaths
= x = x 100,000100,000
PopulationPopulation
presented per 100,000 populationpresented per 100,000 population

ACT Research Day --- 7 May 2009
What influences changes in HIV-related What influences changes in HIV-related mortality statistics over time?mortality statistics over time?
Changes in incidence of HIV Changes in treatment and duration of
illness Healthier survival = lower mortality
Changes in HIV testing – number of people who are known to have HIV Overall changes in rates Different rates of testing between groups Policies (immigration testing, prenatal testing)
Changes in ICD codes

ACT Research Day --- 7 May 2009
Major changes to be aware ofMajor changes to be aware of
1985 – Testing of the blood supply 1993 – Change in AIDS definition
Increased classification of women with AIDS 1996 – Introduction of protease inhibitors
Decreased AIDS cases, increased survival (and prevalence) 2000 – Change in ICD definitions from ICD-9 to ICD-10
10% increase in HIV-related deaths 2002 – Required testing of all immigrants
Ontario tests for visa purposes: 1294 in 2001, 28,712 in 2006 54% increase in testing for the HIV-endemic exposure
classification Prenatal HIV testing
41% in 1999, 89% in 2006 62% increase in testing and 41% increase in new diagnoses in
the low-risk heterosexual exposure classification from 2001 to 2006
