understanding the stem pipeline - eric · understanding the stem pipeline ... who tend to be ......
TRANSCRIPT

W O R K I N G P A P E R 1 2 5 • J A N U A R Y 2 0 1 5
Understanding the STEM Pipeline
T I M R . S A S S
NATIONAL CENTER for ANALYSIS of LONGITUDINAL DATA in EDUCATION RESEARCH
A program of research by the American Institutes for Research with Duke University, Northwestern University, Stanford University, University of Missouri-Columbia, University of Texas at Dallas, and University of Washington
TRACKING EVERY STUDENT’S LEARNING EVERY YEAR

Understanding the STEM Pipeline
Acknowledgements I wish to thank the staff of the Florida Department of Education’s Education Data Warehouse for their help in obtaining and interpreting the data used in this study. Funding for this research was provided by the Gates and Smith Richardson Foundations as part of a grant to the Center for the Analysis of Longitudinal Data in Education Research (CALDER) and American Institutes for Research. Any opinions or errors are solely attributable to me, however.
CALDER working papers have not undergone final formal review and should not be cited or distributed without permission from the authors. They are intended to encourage discussion and suggestions for revision before final publication.
The views expressed are those of the authors and should not be attributed to the American Institutes for Research, its trustees, or any of the funders or supporting organizations mentioned herein. Any errors are attributable to the authors.
CALDER • American Institutes for Research 1000 Thomas Jefferson Street N.W., Washington, D.C. 20007 202-403-5796 • www.caldercenter.org
ii
Understanding the STEM Pipeline Tim R. Sass CALDER Working Paper No. 125 January 2015
Abstract
I investigate the determinants of high school completion and college attendance, the likelihood of taking science, technology, engineering or math (STEM) courses in the first year of college and the probability of earning a degree in a STEM field. The focus is on women and minorities, who tend to be underrepresented in STEM fields. Tracking four cohorts of students throughout Florida, I find that large differences in math achievement across racial lines exist as early as elementary school and persist through high school. These achievement differences lead to higher drop-out rates in high school and a reduced probability of attending college for black students. However, conditional on immediately attending a four-year college after high school, black and Hispanic students are more likely than whites to take STEM courses during their first year in college. Increased exposure to Hispanic math and science teachers in middle and high school tends to increase the likelihood that Hispanic students take STEM courses during their first year in college, though pairing black students and black math/science teachers does not have the same positive effect. For all students, having high school math and science teachers with a degree in biology, chemistry or math (as opposed to education) is associated with a higher likelihood of taking STEM courses as college freshmen. When pre-college differences in income and math achievement are taken into account, black and Hispanic students are at least as likely as white students to successfully complete a STEM major. Racial/ethnic pairing of students and college instructors in first-year STEM courses does not increase the likelihood of majoring in a STEM field. In contrast to underrepresented minorities, women perform nearly as well as men on math achievement tests through high school and are more likely to finish high school and attend college than males. Among college students, however, women are less likely than men to take courses in the physical sciences in their first year and are less likely to earn a degree in physics or engineering, even after adjusting for pre-college test scores. Gender matching of students and math/science teachers in middle and high school tends to increase the likelihood that female college freshman will take at least one STEM course, However, conditional on first-year coursework, neither gender matching at the secondary or college levels appears to have any effect on the likelihood of completing a major in a STEM field.
iii
I. Introduction
There is growing concern that the United States does not produce a sufficient number of majors
in science, technology, engineering and math (STEM) fields in order to remain globally competitive. Of
particular concern is the underrepresentation of women and minorities in STEM fields. Various
hypotheses have been forwarded to explain why there are relatively few women and minorities in STEM
fields. These include negative peer effects of male students in math and science courses, lack of same
gender/same race instructors as role models and the extent of institutional focus on undergraduate
education.
Most of the existing evidence on enrollment and persistence in STEM majors is based on
experiences while in college. However, this may obscure important influences of student preparation
and experiences in high school and early grades. The focus on courses, instructors and grades while in
college is primarily a matter of data availability. Most extant studies have relied on college transcript
data which provide little information about what has happened to a student prior to attending college.
The present study of STEM degree attainment is the first to employ K-12 data linked to college
transcripts in order to track individual students all the way from elementary school through the end of
college. These data allow one to determine where gaps emerge between males and females and
between whites and under-represented minorities. Such information is important in determining where
to target interventions designed to promote female and minority participation in STEM fields. Indeed,
the evidence reveals that gaps in math achievement between blacks and whites occur as early as
elementary school and have substantial effects on high school completion, college attendance and
ultimately STEM major completion. In contrast, women perform nearly as well as men on math
achievement tests through high school, are more likely to finish high school and attend college than
males. Among college students, however, women are much less likely than men to earn a degree in a
STEM field, even after adjusting for prior test scores. There is some evidence that gender and ethnic
matching of students and secondary teachers increases the likelihood that women and Hispanics take
STEM classes as college freshmen. Likewise, taking high school high school courses from teachers who
possess a baccalaureate degree in math or science (rather than education) is associated with a higher
probability of taking STEM courses as a college freshman. However, conditional on first-year college
coursework, gender or ethnic/racial matching of students and college instructors is not associated with
completing a degree in a STEM field.
II. Existing Evidence
Spurred by the intense policy interest in the underrepresentation of women and minorities in
STEM fields, there has been a recent surge in research on the determinants of entry and persistence in
STEM majors. Most of this recent work focuses on major choice conditional upon enrolling in college.
A. STEM Persistence Among College Students
Bettinger and Long (2005) employ individual level data on students who entered four-year
public colleges and universities in Ohio in 1998 and 1999. They find that exposure to a female college
instructor in their first college course in a subject has mixed effects on female students’ participation in
STEM. Female students who initially had a female instructor were less likely to take additional courses
in biology and physics than similar students whose first professor in the subject was male. However,
initial exposure to a female instructor boosted the likelihood that a female student would take an
additional course in the subject and the total number of hours of credit hours in geology, mathematics
and statistics. They found no effects of instructor gender on the major choices of female college
students in STEM fields. In later work, Bettinger (2010), finds STEM fields only retain about one-half of
students. Further, the proportion of first-year courses that are taken in STEM fields is directly correlated
with an eventual major in STEM.
2
Price (2010) analyzes the same Ohio data, but for a longer time period, 1998-2002. He focuses
on the impact of race and gender matching of students and instructors in first-semester freshman STEM
courses on student persistence in STEM majors. He finds that black students are more likely to persist in
a STEM major if they have a STEM course taught by a black instructor. As in Bettinger and Long, female
students are less likely to persist the greater the proportion of their STEM courses which are taught by
female instructors.
Hoffman and Oreopoulos (2009) use data from the University of Toronto to analyze the impact
of instructor gender in large first-year undergraduate courses on persistence within a course and later
course taking in the same subject. With multiple subjects they are able to employ student fixed effects
to control for unobserved student heterogeneity. In the fixed-effects models they find that gender
matching of students and instructors has no effect on the likelihood of dropping the course, but does
increase the number of additional courses taken in the subject. This later effect does not hold for math
and science courses, however, where gender matching actually reduces the number of additional
courses taken in the subject.
Fairlie, Hoffman and Oreopoulos (2014) also conduct a single-institution analysis, but focus on
racial matching of students and instructors and employ data from a California community college, rather
than a four-year university. They find that under-represented minority students are less likely to drop a
course, more likely to earn a “B” or better if they complete the course and more likely to take an
additional course in the same subject the following term when taught by an under-represented minority
instructor. These effects tend to be stronger when there is an exact match between the race/ethnicity
of the student and instructor. The authors also uncover evidence that racial matching increases the
likelihood a student will remain in college for two quarters and boosts the probability an under-
represented minority student obtains an associates or vocational degree. The impact of student-
instructor racial matching on the likelihood of transferring to a four-year institution is mixed.
3
Kokkelenberg and Sinha (2010) analyze graduation probabilities of students at SUNY-
Binghamton. They find that student SAT math scores and having AP credits in a STEM field are positively
correlated with completing a major in a STEM field. However, conditional on AP credits and SAT scores,
women, blacks and Hispanics are all less likely than whites to graduate with a major in a STEM field.
Griffith (2010) finds that students at selective research institutions are less likely to persist in
STEM fields than their counterparts in lower ranked colleges and universities. Like Bettinger and Long,
Griffith finds a zero or negative correlation between percent of female faculty in STEM and female
persistence in a STEM major. However, for both women and minorities, the proportion of STEM PhDs
who are in the same gender/racial category is positively correlated with STEM persistence among
undergraduates.
Consistent with Griffith, Arcidiacono, et al. (2013) finds that students sort into majors based on
academic preparation (high school GPA, SAT scores). Among schools in the University of California (UC)
system, lower ranked schools were better at graduating less-prepared minority students. Most
minorities were more likely to graduate with a science degree if they attended a lower-ranked UC
school.
Carrell, Page and West (2010) analyze the effects of instructor gender on student achievement,
course taking and STEM major choice at the U.S. Air Force Academy. The Air Force Academy requires all
students to take a set of standardized introductory courses and randomly assigns students to
classrooms, thereby avoiding any possible selection bias associated with student course and instructor
choice. In contrast to other studies, they find substantial positive effects of female instructors on female
student’s performance in math and science courses at the Academy. Further, high-performing young
women, as measured by SAT math scores, are more likely to take additional STEM courses and graduate
with a degree in a STEM major if they have introductory courses from a female instructor. For these
high-ability women who take introductory courses from a female instructor, the STEM gender gap is
4
eliminated. It is unclear, however, whether their strong gender matching findings are due to their
rigorous experimental design or are related to unique aspects of the female students at an elite military
academy.
B. Pre-College Influences on Educational Attainment in STEM Fields
The literature relating pre-college experiences to college outcomes is much thinner. In a well-
known set of papers, Dee finds student teacher matching has positive effects on pre-college outcomes.
Dee (2004), using data from the STAR experiment in Tennessee finds that assignment to an own-race
teacher had positive effects on student achievement in math in early elementary grades. Dee (2007),
employing a cross-subject student fixed effects strategy, finds that 8th grade female students exposed to
a female science teacher had insignificant effects on science test scores and assignment to a female
math teacher significantly lowered math achievement for girls. However, Dee’s evidence ends at the
middle school level and provides no direct evidence on outcomes in high school and college.
Park, Behrman and Choi (2012) exploit the random assignment of students to high schools in
Korea to estimate the causal effects of same-sex schools on math college entrance exam scores, student
expectations of college attendance and major choice while in high school and actual college attendance
and major choice two years after high school. While attending an all-girls school has positive effects on
entrance exam scores in general math and calculus, no effects were found on interest in science,
student expectations or actual choice of a STEM major.
Anelli and Peri (2013) link data on graduates of college-preparatory high schools in Milan to
enrollment records of universities in Milan in order to study the effects of high school gender
composition on college major choice. In the Italian system high school students are grouped into
“classes” during their freshman year and maintain these groupings throughout high school. Rather than
study STEM fields, they divide majors into “high earning” and “not high earning” categories and consider
the determinants of initial major choice. They find that an increase in the proportion of female
5
classmates in high school classes is associated with an increased likelihood of women selecting a high
earning major.
III. Data
The data for this study come from a variety of sources. The primary source for student-level
information is the Florida Department of Education’s K-20 Education Data Warehouse (K-20 EDW), an
integrated longitudinal data base covering all public school students and teachers in the state of Florida.
For K-12 students, the K-20 EDW provides demographic information, enrollment and attendance,
program participation, disciplinary actions and achievement test scores, beginning in 1995. Florida
began testing students statewide in 1997/98, with the introduction of the “Sunshine State Standards”
Florida Comprehensive Achievement Test (FCAT-SSS). The FCAT-SSS is a criterion-based exam designed
to test for the skills that students are expected to master at each grade level. It is a “high-stakes” test
used to determine school grades, student retention in some grades and passage of the 10th grade exam
is a requirement for graduation from high school. The FCAT-SSS was initially administered to selected
grades but was later expanded to grades 3-10 in 2000/01. Beginning in 1999/2000, a second test, the
FCAT Norm-Referenced Test (FCAT-NRT) was added in each of grades 3-10. The FCAT-NRT, was a
custom form of the Stanford Achievement Test used throughout the country. No accountability
measures were tied to student performance on the NRT. Florida stopped administering the FCAT-NRT
after 2007/08. The FCAT-SSS exam was replaced with the FCAT 2.0 beginning in 2010/11.
As the name implies, the K-20 EDW also includes records for students enrolled in community
colleges or four-year public universities in Florida. The K-20 EDW also contains information on the
Florida Resident Assistance Grant (FRAG), a grant available to Florida residents who attend private
colleges and universities in the state. Data from the National Student Clearinghouse (NSC), a national
database that includes enrollment data from 3,300 colleges throughout the United States, is used to
6
track college attendance outside the state of Florida, as well as any private college enrollment in Florida
that the FRAG data do not pick up. Unfortunately, the Florida Department of Education’s data-sharing
agreement with the NSC expired in the latter part of the 2000s, so I can only reliably track students who
attended private colleges and universities within Florida or any postsecondary institution outside of
Florida through school year 2006–2007.1 Enrollment, coursework and degree attainment information
are available for all post-secondary students at public institutions in Florida. In addition, demographic
information on post-secondary instructors is available as well.
High school graduation is determined by withdrawal information and student award data from
the K-20 EDW. While various diploma options exist, including a GED and a special-education diploma, I
focus on receipt of a regular high school diploma. Students who withdrew with no intention of
returning or exited for other reasons such as non-attendance, court action, joining the military,
marriage, pregnancy, and medical problems, but did not later graduate, are counted as dropouts. It is
not possible to directly determine the graduation status of students who leave the Florida public school
system to attend a home-schooling program, to enroll in a private school or who move out of state.
The analysis sample covers four cohorts of 5th grade students. Statewide achievement testing
for 5th grade students began in the 1997/98 school year, so the first cohort in the sample are students
who attended 5th grade for the first time in 1997/98 and took the FCAT-SSS math exam. The final cohort
is composed of students who were enrolled in 5th grade for the first time in 2000/01. Descriptive
statistics for these four cohorts of students are provided in Table 1.
The last year for which student data are currently available is 2012/13. Given that it takes at
least three years to progress through middle school and high school completion typically takes four
years, this means the each of the four cohorts can be tracked through high school and into the
1 Information on the NSC is available at www.studentclearinghouse.org.
7
beginning of college. If we allow five years for college completion, all four cohorts can be followed all
the way through the end of college. In order to analyze baccalaureate completion, it is therefore
necessary to restrict the sample to students who do not repeat any grades in middle school. Descriptive
statistics for this restricted sample are provided in Table 2. As one would expect, students who follow
the normal progression through middle school have much higher test scores than those who repeat a
grade or drop out before completing high school and thus the test score means in Table 2 are higher
than those in Table 1.
IV. Analysis and Results
A. Descriptive Analysis of Pre-College Outcomes and College Attendance
In order to understand where the “leakages” in the STEM pipeline occur, I begin with a
descriptive analysis of achievement differences in math prior to high school entry. Tables 3A, 3B and 3C
report mean test scores in elementary and middle school by race, gender and school lunch status,
respectively. The differences between blacks and whites are striking. White students outperform black
students in math by roughly two-thirds of a standard deviation and this differential is essentially
constant across grades. The differences between Hispanics and Anglos are less pronounced. Hispanic
students tend to score around the mean, whereas Anglos score 0.3 to 0.4 standard deviations above the
mean. As with blacks, the differences between Hispanics and Anglos are relatively constant throughout
elementary and middle school.
Achievement scores across gender tell a much different story. Whereas large and persistent
gaps between racial/ethnic groups persist throughout elementary and middle school, any differences in
math achievement for boys and girls are relatively small and inconsistent. Based on the FCAT-NRT (i.e.
the Stanford Achievement Test) it appears that girls start out roughly on par with boys in 5th grade and
continue there through 8th grade. Results are less stable for the FCAT-SSS exam; girls start out slightly
8
below boys in 5th grade (about 0.04 standard deviations) and end up slightly above in 8th grade (about
0.04 standard deviations). The average test scores broken down by school lunch status (a measure of
poverty) mirror those by race. Children who receive lunch for free score about 0.7 standard deviations
below their counterparts who receive no lunch subsidy and the achievement gap remains constant over
time. Achievement levels of children who receive reduced-price lunches (and thus have family incomes
above those of free-lunch recipients) are in-between those of free-lunch recipients and students who do
not qualify for any lunch subsidy.
The high school experiences of students, broken down by race, gender and family income, play
out much like the achievement measures in elementary and middle school. Tables 4A, 4B and 4C
provide information on exit propensities by race/ethnicity, gender and family income, respectively.
Blacks and Hispanics are much more likely to drop out of high school (approximately 10 percent), than
whites or Asians (6 and 3 percent, respectively). These drop-out rates are conditional on students
progressing through middle school in three years. The disparities when students who repeat one or
more middle school grades are included (not reported) are even higher. As with test scores prior to high
school, the differences in drop-out rates between boys and girls are relatively small, with females about
1 percentage point less likely to drop out of high school. High school drop-out rates across income
categories mirror those by race; about 12 and one-half percent of free-lunch students drop out of high
school while only 4 percent of students with no lunch subsidy drop out.
Even if students complete five years of high school, they may not earn a regular high school
diploma. They could receive a GED or (if they are a special education student) a special diploma or
certificate of completion. Alternatively, they could remain enrolled, but still not have obtained a
diploma within five years. As demonstrated in Tables 5A and 5C, there are large differences in receipt of
a regular high school diploma between blacks and whites and between students from poor families and
those from more affluent families. About 58 percent of black students earn a regular high school
9
diploma within 5 years of entering high school whereas over 70 percent of white students obtain a
regular high school diploma. Asian students do better than any other racial/ethnic group; over 85
percent of Asian students obtain a regular high school diploma with five years. As with test scores and
drop-out rates, diploma attainment differences across family income levels mimic differences between
blacks and whites. If there is a gender gap in obtaining a regular high school diploma, it is in favor of
females. As shown in Table 5B, the diploma-receipt rate for young men is 64 percent compared to 70
percent, for young women.
A final measure of high school performance is achievement test scores. Tables 6A-6C provide
average math test scores broken down by race/ethnicity, gender and family income, respectively. Large
achievement gaps between blacks, whites and Hispanics remain essentially constant all the way from 5th
through 10th grade, even though students who drop out in the first two years of high school are
removed from the sample. Similarly, significant achievement gaps across family income categories
(proxied by lunch status) remain relatively constant from elementary through high school. The
achievement gap between boys and girls also persists through high school, though is much smaller than
disparities across race or income. Using the FCAT-NRT scores as a metric, boys outperform girls in 5th
grade by 0.025 standard deviations and this widens slightly to 0.041 standard deviations in 10th grade.
In contrast, scores from the FCAT-SSS suggest a slight narrowing in the math achievement gap between
boys and girls as they progress through school; the achievement differential is 0.062 standard deviations
in 5th grade and only 0.044 by grade 10. While the gaps are small in either case, the differential findings
across tests may reflect the fact that the NRT exam tends to test higher-level math skills than the SSS
exam.
Conditional on earning a regular high school diploma, we observe substantial differences in
post-secondary educational choices by race/ethnicity, gender and income. As shown in Table 7A, Blacks
are much less likely than whites to attend any college whereas the college-going rate for Hispanics is
10
comparable to that of whites.2 Similarly, a reported in Table 7C, the likelihood of attending either a two-
year or four-year college increases with family income. Table 7B documents the fact that the college
going rates of women are much higher than men (72 percent versus 64 percent).
Taken together, the descriptive evidence shows that for minorities and students from low-
income families, there are substantial “leakages” in the educational pipeline before college. For women,
however, their educational attainment and test scores would suggest they would be as likely as men to
complete a STEM major in college. I turn now to analyses of course selection, persistence and major
choice among those students who make it to college.
B. Determinants of Initial College Coursework
Table 8 presents probit estimates of the probability of taking one or more STEM courses in the
first year of college, conditional upon having earned a regular high school diploma within five years of
starting grade 9 and enrolling in a four-year public university within a year of receiving their high school
diploma. The first column reports estimates with only student race/ethnicity in the model. Without any
other controls, black and Hispanic students are more likely than whites (the omitted group) to take at
least one STEM course during their first year in college.3 In contrast, women are about 4 percentage
points less likely than men to take at least one STEM course in their freshman year. Controlling for
family income (5th-grade lunch status) and math test scores in middle and high school does not alter
these results.
As shown in Table 9, the relationships between STEM course taking and race/ethnicity and
gender remain largely the same when considering specific types of science courses. Conditional on pre-
2 While it appears that blacks are more likely to attend out-of-state colleges, this is likely due to a peculiarity of the National Student Clearinghouse Data. Universities with nationwide branch campuses, like the University of Phoenix are all assigned to the state of their headquarters, even if they have a physical presence in another state. 3 The level of courses is not taken into account, so some math and sciences could be remedial in nature.
11
college test scores and family income, both blacks and Hispanics who start college at a four-year public
university are more likely to take at least one science course during their freshman year and more likely
to take a biology or chemistry course as a freshman than are white (non–Hispanic) students. Women
are less likely than men to take any science course and less likely to take physics during their freshman
year. They are more likely than men, however, to take at least one biology course during their first year
of college.
In Table 10 I present estimates of the relationship of the characteristics of middle and high
school teachers to first-year college course selection.4 For Hispanic students who attend a four-year
public university immediately after completing high school, increases in the proportion of Hispanic
secondary math and science teachers they were exposed to are associated with a greater likelihood they
will take at least one STEM course as college freshmen. Likewise, increases in the proportion of middle
and high school math courses that were taught by female teachers is positively correlated with the
likelihood a female student will take at least one STEM course during their first year in college. These
positive matching effects do not hold for black students, however. Increases in exposure to black
middle and high school science and math teachers are in fact negatively correlated with the probability
of taking at least one STEM course as a college freshman.
While there is some evidence that gender or ethnic matching of students and teachers in
secondary school impacts initial college course selection, the preparation of math and science teachers
matters as well. Having a biology, chemistry or math course in high school taught by a teacher with a
bachelor’s degree in the relevant subject (rather than a math or science education degree or a degree in
4 Note that I control for pre-high school math test scores, but not scores in grades 9 and 10, so the high school teacher effects could be working through effects on high school math achievement.
12
another science field) has small but statistically significant effects on the likelihood a student later takes
at least one STEM course as a freshman in college.5
As illustrated in Table 11, the link between preparation of high school teachers and specific
STEM course selection for college freshman is less clear. Having had a high school chemistry course
taught by a teacher with a BA degree in chemistry is associated with an increased likelihood of taking
chemistry as a college freshman, but the same is not true for biology or physics. Having at least one high
school math course taught by at teacher with a BA in math appears to boost the likelihood of taking
biology, chemistry or at least one science course during the first year in college.6
C. Determinants of Completing a College Degree in a STEM Major
Table 12 presents results of estimating probit equations which predict completion of college
majors (conditional on attending a Florida public university immediately after earning a high school
degree), without any controls for pre-college family income or student achievement test scores. These
estimates reveal the expected pattern; black and Hispanic college students are less likely to earn a
degree in a STEM field than are white (non-Hispanic) students. Likewise, women are less likely than men
to successfully complete a major in a STEM field. These patterns generally hold across specific STEM
majors. The one notable exception is Biology and other life sciences, where women have a higher
likelihood of earning a bachelor’s degree than men.
Table 13 presents estimates of STEM major completion in which family income (proxied by
free/reduced-price lunch status in grade 5) and middle and high school math achievement scores are
included as controls. Holding constant family income and prior test scores, black college students are no
5 I find no effects for physics teachers with a BA degree in physics, but this may simply be due to the very small number of high school physics teachers in Florida who possess a degree in physics. 6 One possibility is that the college majors of high school math and science teachers are simply reflecting the general quality of a high school and not direct effects of teacher preparation on student interest in math and science.
13
less likely than whites to major in a STEM field and Hispanics are slightly more likely to successfully
complete a major in a STEM field than Anglos. For a variety of specific STEM majors, there are no
differences in degree attainment between white, black and Hispanic students conditional on family
income and prior math achievement. Put differently, if students make it to college and have equal
resources and pre-college preparation, I find no differences across race/ethnicity in the likelihood of
earning a bachelor’s degree in a STEM field.
In general, conditional on college entry, family income and prior math achievement, there is no
significant difference between women and men in the probability of graduating with a degree in a STEM
field. However, there are significant gender differences in the likelihood of degree attainment across
STEM majors. Women are more likely than men to complete a major in life sciences, but are less likely
to earn a degree in physics or engineering than men.
To explore possible differences in the likelihood of persisting in a major, I estimate models of
degree completion conditional on first-year course selection. Results are presented in Tables 14 and 15.
Not surprisingly, freshman-year coursework is strongly related to eventual degree attainment. The
greater the number of freshman-year engineering courses taken the more likely a student will
eventually earn an engineering degree. The same is true for math courses and math degrees and
freshman science courses and degrees in chemistry, physics and life sciences. Holding constant first-
year coursework, black students and female students are less likely to complete a degree in a STEM field
than are white males. In general, the probability of an Hispanic student persisting in a STEM field
(conditional on family income and pre-college math test scores) is no different than that of an Anglo
student.
In order to determine if student-teacher matching by race/ethnicity or gender effects
persistence in a STEM major I add controls for both middle/high school and first-year-in-college
matching of students and instructors. Estimates of this expanded model of degree attainment
14
conditional on initial college coursework are presented in Table 15. While student-teacher matching in
middle and high school math and science courses appeared to influence freshman-year course selection,
boosting freshman-year STEM course taking for women and Hispanics (see Table 10), the same is not
true for completion of a STEM major conditional on first-year coursework. In fact the correlation
between racial/ethnic and gender matching of students and teachers in middle and high school and
STEM major persistence is frequently negative.
V. Summary, Conclusions and Future Research
Growing concern about the low production of college graduates in STEM fields, particularly
among minorities and women, has led to a rapidly growing research literature seeking to understand the
causes of these disparities and hence provide guidance as to appropriate policies. The focus of this
research has been on the experiences of students once they attend college, including the identity of
their instructors and the institutions they enroll in. This college-level focus ignores the fact that
students have to get to college first before they can even stand a chance at obtaining a college degree in
a STEM field. It also forecloses the possibility that pre-college experiences, such as the quality and
identity of middle and high school instructors can shape future major choices in college.
In this paper, I present new data tracking individual students from elementary school through
college. I find that for blacks and students from low-income families, achievement gaps begin early and
persist through high school. These gaps are associated with higher drop out, reduction in the probability
of obtaining a regular high school diploma and decreased likelihood of attending college. However,
black and Hispanic students who enter a four-year college immediately after high school are more likely
than white students to take at least one STEM course during their freshman year. Increases in the
proportion of Hispanic math and science teachers in middle and high school are positively correlated
with the number of first-year STEM courses taken by Hispanic college freshmen. Pairing of black
15
students with black middle and high school math and science teachers does not boost the number of
first-year STEM courses taken by black college students, however. For all students, exposure to biology,
chemistry and math high school teachers who possess a bachelor’s degree in the relevant subject area is
associated with increased STEM course taking as college freshmen. While black and Hispanic college
students are less likely to complete a major in a STEM field than their white counterparts, if income and
pre-college achievement differences are taken into account, both blacks and Hispanics who make it to
college are no less likely than whites to graduate with a degree in a STEM field. Conditional on first-year
course selection, neither the identity of secondary math and science teachers nor the identity of college
instructors in first-year college courses appears to alter the likelihood that underrepresented minorities
will obtain a bachelor’s degree in a STEM field.
Gender gaps in math achievement are generally small throughout elementary, middle and high
school and women are more likely to successfully complete high school and attend college. Once they
get to college, however, they are much less likely than males to obtain a bachelor’s degree in a STEM
field. Although female college students are more likely to complete a major in biology or other life-
science fields, they are much less likely than men to earn a degree in engineering or the physical
sciences. Exposure to female math and science teachers in middle and high school are correlated with
increases in the number of STEM courses taken by female college freshmen. However, the gender
matching of students and teachers in secondary school does not increase persistence of women in STEM
fields after their freshman year. Similarly, conditional on first-year coursework, exposure to female
instructors in STEM courses taken during the freshman year does not increase the likelihood of
successfully completing a major in a STEM field.
The analyses conducted thus suggest that altering the gender and racial composition of college
faculty are unlikely to substantially change the relative numbers of women and underrepresented
minorities in STEM fields. However, increasing the proportion of female math and science teachers in
16
high school and hiring more high school math and science teachers with degrees in the relevant subject
area are likely to boost the number of STEM courses taken by both women and under-represented
minorities during their first year in college. The increased first-year coursework in turn will tend to
boost the numbers of women, blacks and Hispancis who successfully complete a STEM major. Further,
policies aimed at reducing racial achievement gaps in the early grades are also likely to enhance the
representation of blacks in STEM fields in the long run.
One potential drawback of the present analysis is that the identities of high school and college
instructors have been treated as exogenous. At both the secondary and college levels students have
some discretion over the identity of the instructors they take courses from and institutions make choices
about the composition of their faculties. Thus student-teacher matching effects could be biased by
student self-selection or unmeasured attributes of educational institutions. To alleviate this potential
problem I will pursue two strategies in future work. One approach will be to include high school fixed
effects, which should account for unmeasured factors that may be correlated with the gender and
racial/ethnic composition of high school faculties. The second approach, which has been employed in
previous work by others, will be to use the overall faculty composition as an instrument for the
matching of individual students and teachers.
The next phase of the research will be to link data on classroom composition at both the K-12
and post-secondary levels to individual students in math and science courses. This will allow tests of
peer effects on both college coursework and major choices. I can also expand the sample to include
students who start their college careers at community colleges to see if the patterns found in
universities also hold in two-year institutions.
17
References
Anelli, M., & Peri, G. (2013). The Long Run Effects of High-School Class Gender Composition: National Bureau of Economic Research.
Arcidiacono, P., Aucejo, E. M., & Hotz, V. J. (2013). University Differences in the Graduation of Minorities in STEM Fields: Evidence from California: National Bureau of Economic Research.
Bettinger, E. (2010). To Be or Not to Be: Major Choices in Budding Scientists American Universities in a Global Market (pp. 69-98): University of Chicago Press.
Bettinger, E. P., & Long, B. T. (2005). Do faculty serve as role models? The impact of instructor gender on female students. American Economic Review, 152-157.
Carrell, S. E., Page, M. E., & West, J. E. (2010). Sex and science: How professor gender perpetuates the gender gap. The Quarterly Journal of Economics, 125(3), 1101-1144.
Dee, T. S. (2004). Teachers, race, and student achievement in a randomized experiment. Review of Economics and Statistics, 86(1), 195-210.
Dee, T. S. (2007). Teachers and the gender gaps in student achievement. Journal of Human Resources, 42(3), 528-554.
Fairlie, R.W., Hoffman, F. & Oreopoulos, P. (2014). A Community College Instructor Like Me: Race and Ethnicity Interactions in the Classroom. American Economic Review, 104(8), 2567-2591.
Griffith, A. L. (2010). Persistence of women and minorities in STEM field majors: Is it the school that matters? Economics of Education Review, 29(6), 911-922.
Hoffman, F., & Oreopoulos, P. (2007). A professor like me: the influence of instructor gender on college achievement: National Bureau of Economic Research Cambridge, Mass., USA.
Kokkelenberg, E. C., & Sinha, E. (2010). Who succeeds in STEM studies? An analysis of Binghamton University undergraduate students. Economics of Education Review, 29(6), 935-946.
Park, H., Behrman, J., & Choi, J. (2012). Do Single-Sex Schools Enhance Students’ Stem (Science, Technology, Engineering, and Mathematics) Outcomes? Rochester, NY: Social Science Research Network.
Price, J. (2010). The effect of instructor race and gender on student persistence in STEM fields. Economics of Education Review, 29(6), 901-910.
Tyson, W. (2011). Modeling Engineering Degree Attainment Using High School and College Physics and Calculus Coursetaking and Achievement. Journal of Engineering Education, 100(4), 760-777.
18

Tyson, W., Lee, R., Borman, K. M., & Hanson, M. A. (2007). Science, Technology, Engineering, and Mathematics (STEM) Pathways: High School Science and Math Coursework and Postsecondary Degree Attainment. Journal of Education for Students Placed at Risk (JESPAR), 12(3), 243-270.
19
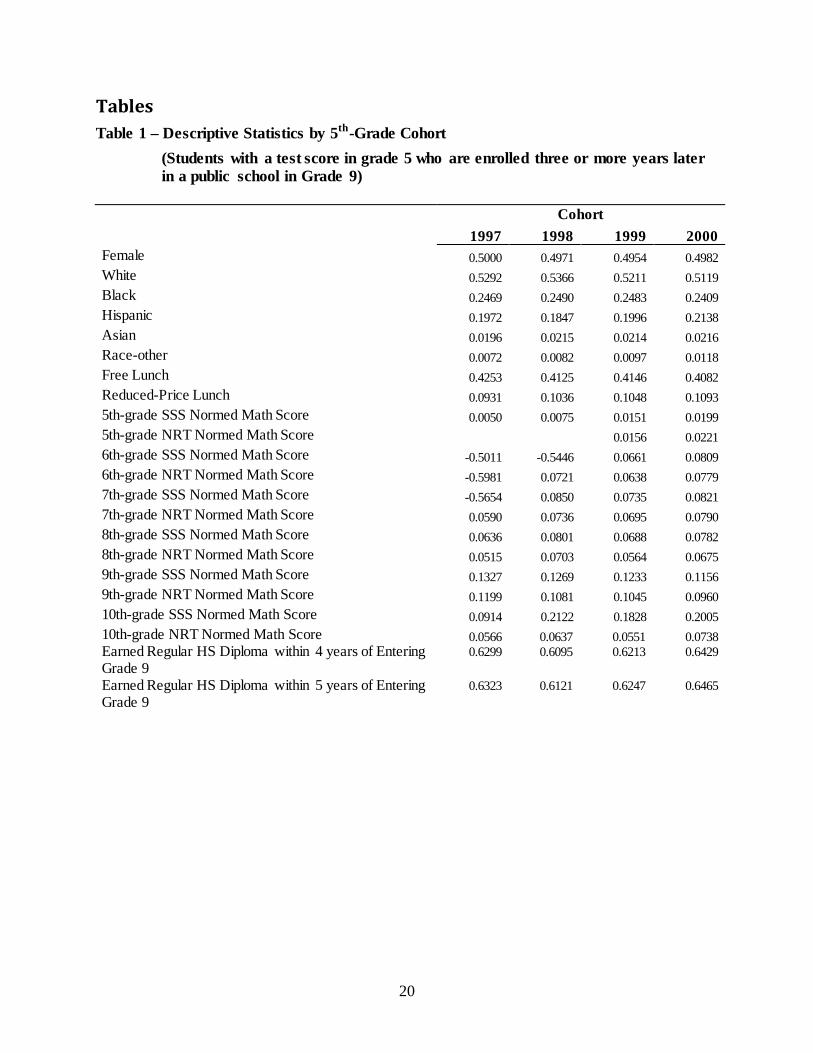
Tables Table 1 – Descriptive Statistics by 5th-Grade Cohort (Students with a test score in grade 5 who are enrolled three or more years later
in a public school in Grade 9)
Cohort
1997 1998 1999 2000
Female 0.5000 0.4971 0.4954 0.4982 White 0.5292 0.5366 0.5211 0.5119 Black 0.2469 0.2490 0.2483 0.2409 Hispanic 0.1972 0.1847 0.1996 0.2138 Asian 0.0196 0.0215 0.0214 0.0216 Race-other 0.0072 0.0082 0.0097 0.0118 Free Lunch 0.4253 0.4125 0.4146 0.4082 Reduced-Price Lunch 0.0931 0.1036 0.1048 0.1093 5th-grade SSS Normed Math Score 0.0050 0.0075 0.0151 0.0199 5th-grade NRT Normed Math Score 0.0156 0.0221 6th-grade SSS Normed Math Score -0.5011 -0.5446 0.0661 0.0809 6th-grade NRT Normed Math Score -0.5981 0.0721 0.0638 0.0779 7th-grade SSS Normed Math Score -0.5654 0.0850 0.0735 0.0821 7th-grade NRT Normed Math Score 0.0590 0.0736 0.0695 0.0790 8th-grade SSS Normed Math Score 0.0636 0.0801 0.0688 0.0782 8th-grade NRT Normed Math Score 0.0515 0.0703 0.0564 0.0675 9th-grade SSS Normed Math Score 0.1327 0.1269 0.1233 0.1156 9th-grade NRT Normed Math Score 0.1199 0.1081 0.1045 0.0960 10th-grade SSS Normed Math Score 0.0914 0.2122 0.1828 0.2005 10th-grade NRT Normed Math Score 0.0566 0.0637 0.0551 0.0738 Earned Regular HS Diploma within 4 years of Entering Grade 9
0.6299 0.6095 0.6213 0.6429
Earned Regular HS Diploma within 5 years of Entering Grade 9
0.6323 0.6121 0.6247 0.6465
20
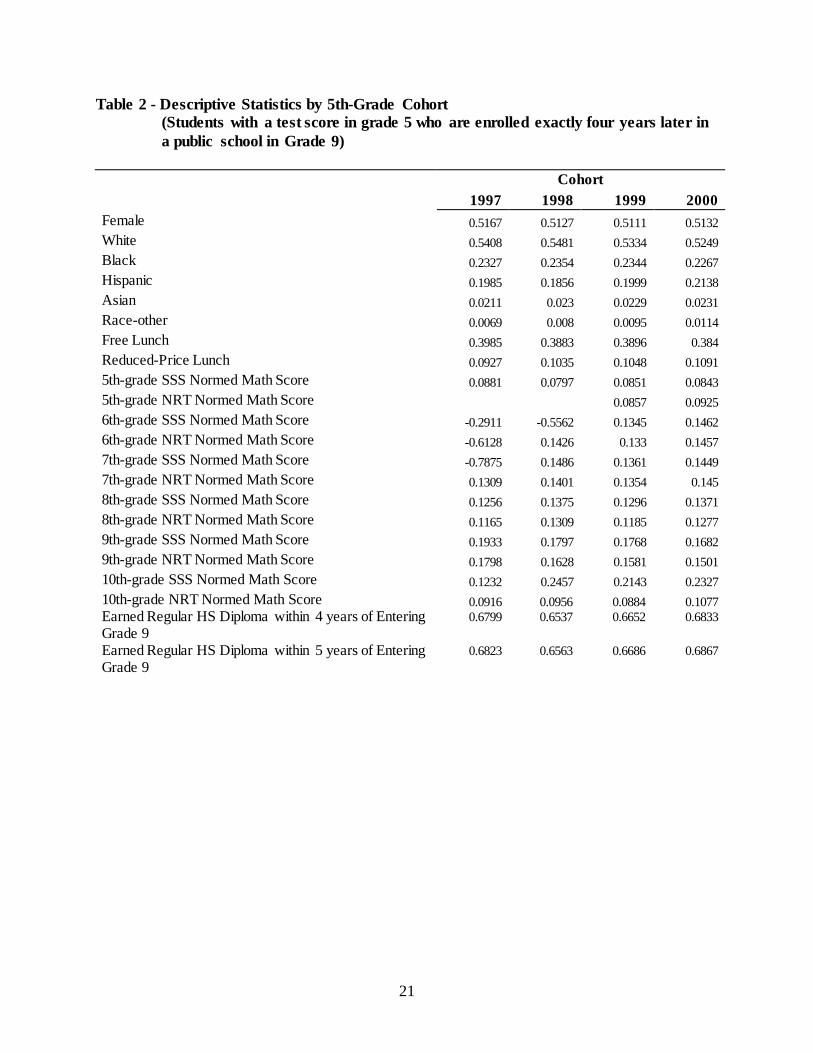
Table 2 - Descriptive Statistics by 5th-Grade Cohort (Students with a test score in grade 5 who are enrolled exactly four years later in
a public school in Grade 9)
Cohort
1997 1998 1999 2000
Female 0.5167 0.5127 0.5111 0.5132 White 0.5408 0.5481 0.5334 0.5249 Black 0.2327 0.2354 0.2344 0.2267 Hispanic 0.1985 0.1856 0.1999 0.2138 Asian 0.0211 0.023 0.0229 0.0231 Race-other 0.0069 0.008 0.0095 0.0114 Free Lunch 0.3985 0.3883 0.3896 0.384 Reduced-Price Lunch 0.0927 0.1035 0.1048 0.1091 5th-grade SSS Normed Math Score 0.0881 0.0797 0.0851 0.0843 5th-grade NRT Normed Math Score 0.0857 0.0925 6th-grade SSS Normed Math Score -0.2911 -0.5562 0.1345 0.1462 6th-grade NRT Normed Math Score -0.6128 0.1426 0.133 0.1457 7th-grade SSS Normed Math Score -0.7875 0.1486 0.1361 0.1449 7th-grade NRT Normed Math Score 0.1309 0.1401 0.1354 0.145 8th-grade SSS Normed Math Score 0.1256 0.1375 0.1296 0.1371 8th-grade NRT Normed Math Score 0.1165 0.1309 0.1185 0.1277 9th-grade SSS Normed Math Score 0.1933 0.1797 0.1768 0.1682 9th-grade NRT Normed Math Score 0.1798 0.1628 0.1581 0.1501 10th-grade SSS Normed Math Score 0.1232 0.2457 0.2143 0.2327 10th-grade NRT Normed Math Score 0.0916 0.0956 0.0884 0.1077 Earned Regular HS Diploma within 4 years of Entering Grade 9
0.6799 0.6537 0.6652 0.6833
Earned Regular HS Diploma within 5 years of Entering Grade 9
0.6823 0.6563 0.6686 0.6867
21
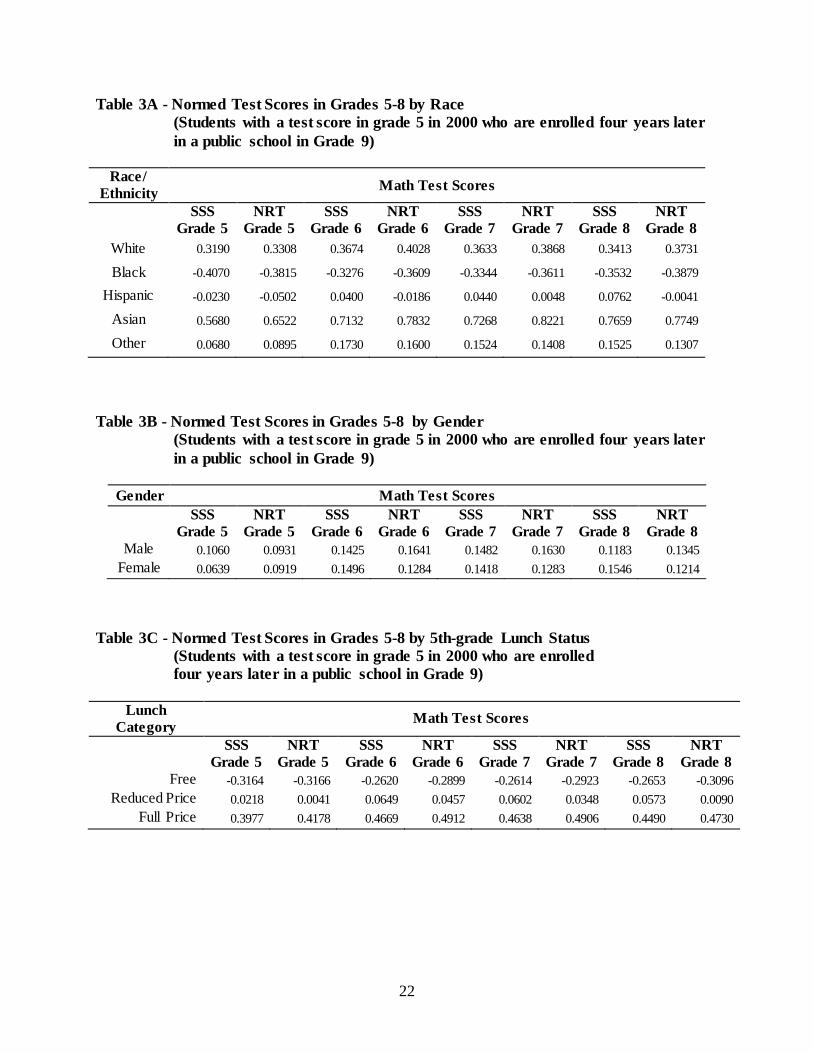
Table 3A - Normed Test Scores in Grades 5-8 by Race (Students with a test score in grade 5 in 2000 who are enrolled four years later
in a public school in Grade 9)
Race/ Ethnicity Math Test Scores
SSS Grade 5
NRT Grade 5
SSS Grade 6
NRT Grade 6
SSS Grade 7
NRT Grade 7
SSS Grade 8
NRT Grade 8
White 0.3190 0.3308 0.3674 0.4028 0.3633 0.3868 0.3413 0.3731
Black -0.4070 -0.3815 -0.3276 -0.3609 -0.3344 -0.3611 -0.3532 -0.3879
Hispanic -0.0230 -0.0502 0.0400 -0.0186 0.0440 0.0048 0.0762 -0.0041
Asian 0.5680 0.6522 0.7132 0.7832 0.7268 0.8221 0.7659 0.7749
Other 0.0680 0.0895 0.1730 0.1600 0.1524 0.1408 0.1525 0.1307
Table 3B - Normed Test Scores in Grades 5-8 by Gender
(Students with a test score in grade 5 in 2000 who are enrolled four years later in a public school in Grade 9)
Gender Math Test Scores
SSS
Grade 5 NRT
Grade 5 SSS
Grade 6 NRT
Grade 6 SSS
Grade 7 NRT
Grade 7 SSS
Grade 8 NRT
Grade 8 Male 0.1060 0.0931 0.1425 0.1641 0.1482 0.1630 0.1183 0.1345
Female 0.0639 0.0919 0.1496 0.1284 0.1418 0.1283 0.1546 0.1214
Table 3C - Normed Test Scores in Grades 5-8 by 5th-grade Lunch Status (Students with a test score in grade 5 in 2000 who are enrolled
four years later in a public school in Grade 9)
Lunch Category Math Test Scores
SSS Grade 5
NRT Grade 5
SSS Grade 6
NRT Grade 6
SSS Grade 7
NRT Grade 7
SSS Grade 8
NRT Grade 8
Free -0.3164 -0.3166 -0.2620 -0.2899 -0.2614 -0.2923 -0.2653 -0.3096 Reduced Price 0.0218 0.0041 0.0649 0.0457 0.0602 0.0348 0.0573 0.0090
Full Price 0.3977 0.4178 0.4669 0.4912 0.4638 0.4906 0.4490 0.4730
22
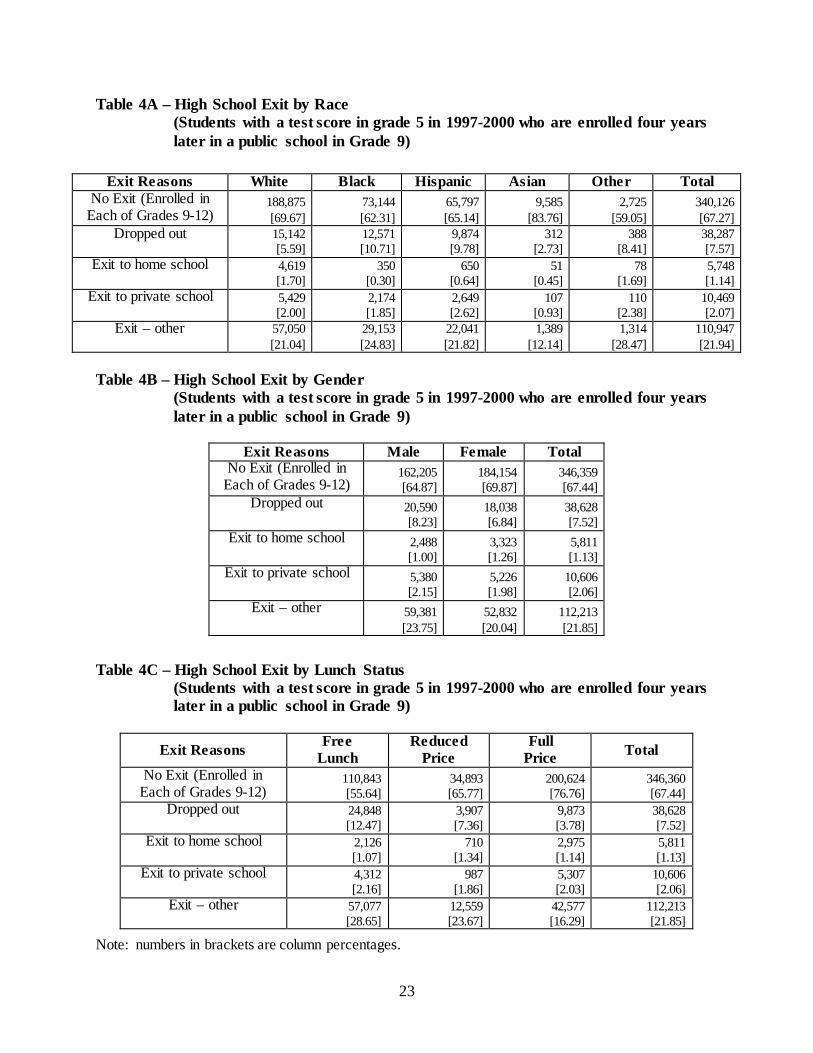
Table 4A – High School Exit by Race (Students with a test score in grade 5 in 1997-2000 who are enrolled four years
later in a public school in Grade 9)
Exit Reasons White Black Hispanic Asian Other Total No Exit (Enrolled in
Each of Grades 9-12) 188,875 [69.67]
73,144 [62.31]
65,797 [65.14]
9,585 [83.76]
2,725 [59.05]
340,126 [67.27]
Dropped out 15,142 [5.59]
12,571 [10.71]
9,874 [9.78]
312 [2.73]
388 [8.41]
38,287 [7.57]
Exit to home school 4,619 [1.70]
350 [0.30]
650 [0.64]
51 [0.45]
78 [1.69]
5,748 [1.14]
Exit to private school 5,429 [2.00]
2,174 [1.85]
2,649 [2.62]
107 [0.93]
110 [2.38]
10,469 [2.07]
Exit – other 57,050 [21.04]
29,153 [24.83]
22,041 [21.82]
1,389 [12.14]
1,314 [28.47]
110,947 [21.94]
Table 4B – High School Exit by Gender (Students with a test score in grade 5 in 1997-2000 who are enrolled four years
later in a public school in Grade 9)
Exit Reasons Male Female Total No Exit (Enrolled in
Each of Grades 9-12) 162,205 [64.87]
184,154 [69.87]
346,359 [67.44]
Dropped out 20,590 [8.23]
18,038 [6.84]
38,628 [7.52]
Exit to home school 2,488 [1.00]
3,323 [1.26]
5,811 [1.13]
Exit to private school 5,380 [2.15]
5,226 [1.98]
10,606 [2.06]
Exit – other 59,381 [23.75]
52,832 [20.04]
112,213 [21.85]
Table 4C – High School Exit by Lunch Status (Students with a test score in grade 5 in 1997-2000 who are enrolled four years
later in a public school in Grade 9)
Exit Reasons Free Lunch
Reduced Price
Full Price Total
No Exit (Enrolled in Each of Grades 9-12)
110,843 [55.64]
34,893 [65.77]
200,624 [76.76]
346,360 [67.44]
Dropped out 24,848 [12.47]
3,907 [7.36]
9,873 [3.78]
38,628 [7.52]
Exit to home school 2,126 [1.07]
710 [1.34]
2,975 [1.14]
5,811 [1.13]
Exit to private school 4,312 [2.16]
987 [1.86]
5,307 [2.03]
10,606 [2.06]
Exit – other 57,077 [28.65]
12,559 [23.67]
42,577 [16.29]
112,213 [21.85]
Note: numbers in brackets are column percentages.
23
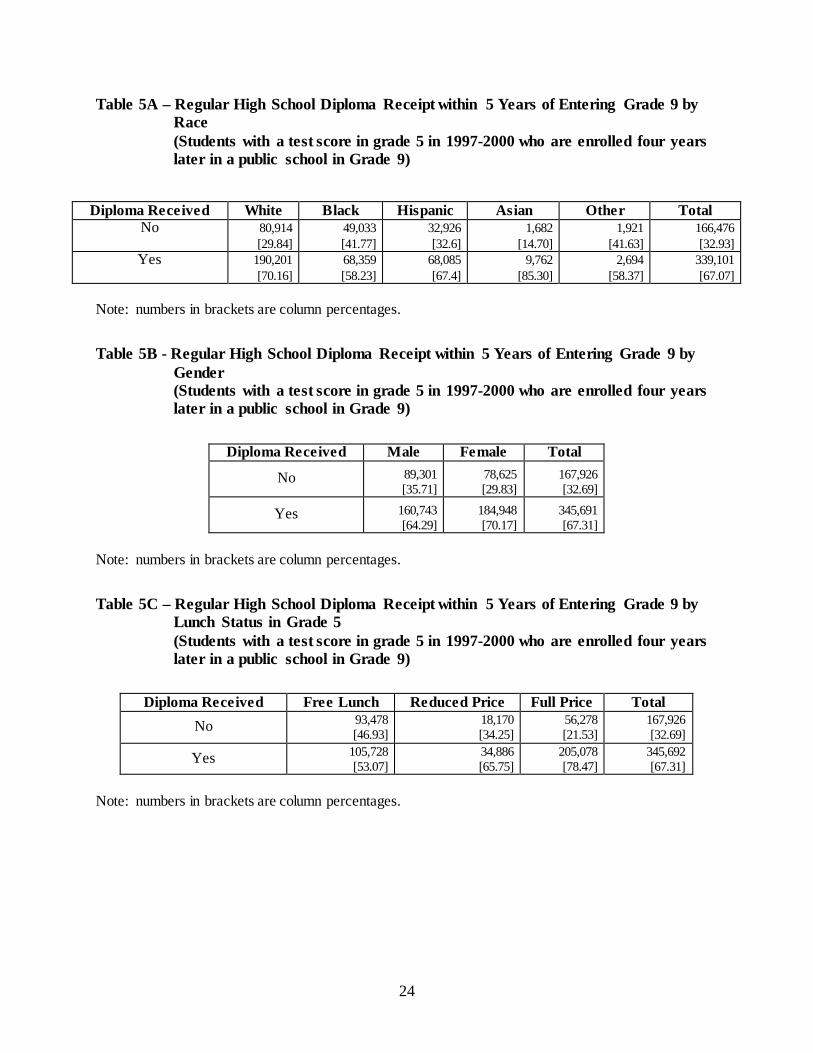
Table 5A – Regular High School Diploma Receipt within 5 Years of Entering Grade 9 by Race
(Students with a test score in grade 5 in 1997-2000 who are enrolled four years later in a public school in Grade 9)
Diploma Received White Black Hispanic Asian Other Total No 80,914
[29.84] 49,033 [41.77]
32,926 [32.6]
1,682 [14.70]
1,921 [41.63]
166,476 [32.93]
Yes 190,201 [70.16]
68,359 [58.23]
68,085 [67.4]
9,762 [85.30]
2,694 [58.37]
339,101 [67.07]
Note: numbers in brackets are column percentages.
Table 5B - Regular High School Diploma Receipt within 5 Years of Entering Grade 9 by
Gender (Students with a test score in grade 5 in 1997-2000 who are enrolled four years
later in a public school in Grade 9)
Diploma Received Male Female Total
No 89,301 [35.71]
78,625 [29.83]
167,926 [32.69]
Yes 160,743 [64.29]
184,948 [70.17]
345,691 [67.31]
Note: numbers in brackets are column percentages.
Table 5C – Regular High School Diploma Receipt within 5 Years of Entering Grade 9 by
Lunch Status in Grade 5 (Students with a test score in grade 5 in 1997-2000 who are enrolled four years
later in a public school in Grade 9)
Diploma Received Free Lunch Reduced Price Full Price Total No 93,478
[46.93] 18,170 [34.25]
56,278 [21.53]
167,926 [32.69]
Yes 105,728 [53.07]
34,886 [65.75]
205,078 [78.47]
345,692 [67.31]
Note: numbers in brackets are column percentages.
24
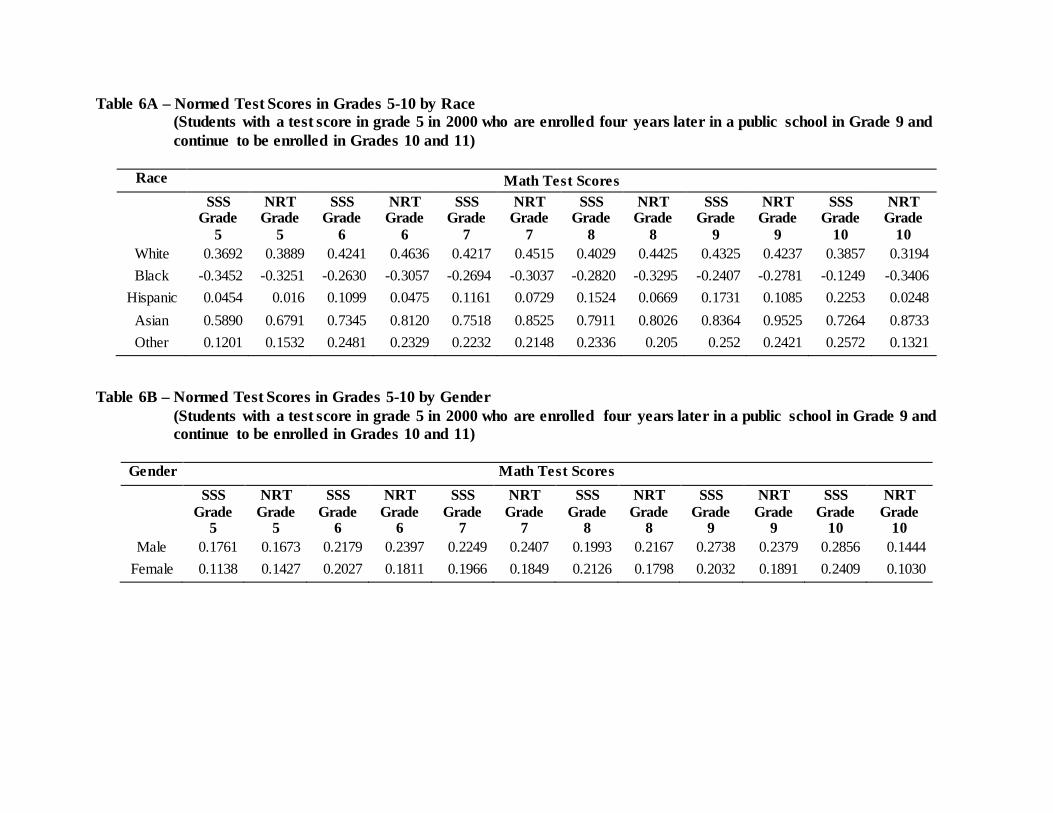
Table 6A – Normed Test Scores in Grades 5-10 by Race (Students with a test score in grade 5 in 2000 who are enrolled four years later in a public school in Grade 9 and
continue to be enrolled in Grades 10 and 11)
Race Math Test Scores SSS
Grade 5
NRT Grade
5
SSS Grade
6
NRT Grade
6
SSS Grade
7
NRT Grade
7
SSS Grade
8
NRT Grade
8
SSS Grade
9
NRT Grade
9
SSS Grade
10
NRT Grade
10 White 0.3692 0.3889 0.4241 0.4636 0.4217 0.4515 0.4029 0.4425 0.4325 0.4237 0.3857 0.3194 Black -0.3452 -0.3251 -0.2630 -0.3057 -0.2694 -0.3037 -0.2820 -0.3295 -0.2407 -0.2781 -0.1249 -0.3406
Hispanic 0.0454 0.016 0.1099 0.0475 0.1161 0.0729 0.1524 0.0669 0.1731 0.1085 0.2253 0.0248 Asian 0.5890 0.6791 0.7345 0.8120 0.7518 0.8525 0.7911 0.8026 0.8364 0.9525 0.7264 0.8733 Other 0.1201 0.1532 0.2481 0.2329 0.2232 0.2148 0.2336 0.205 0.252 0.2421 0.2572 0.1321
Table 6B – Normed Test Scores in Grades 5-10 by Gender (Students with a test score in grade 5 in 2000 who are enrolled four years later in a public school in Grade 9 and
continue to be enrolled in Grades 10 and 11)
Gender Math Test Scores SSS
Grade 5
NRT Grade
5
SSS Grade
6
NRT Grade
6
SSS Grade
7
NRT Grade
7
SSS Grade
8
NRT Grade
8
SSS Grade
9
NRT Grade
9
SSS Grade
10
NRT Grade
10 Male 0.1761 0.1673 0.2179 0.2397 0.2249 0.2407 0.1993 0.2167 0.2738 0.2379 0.2856 0.1444
Female 0.1138 0.1427 0.2027 0.1811 0.1966 0.1849 0.2126 0.1798 0.2032 0.1891 0.2409 0.1030
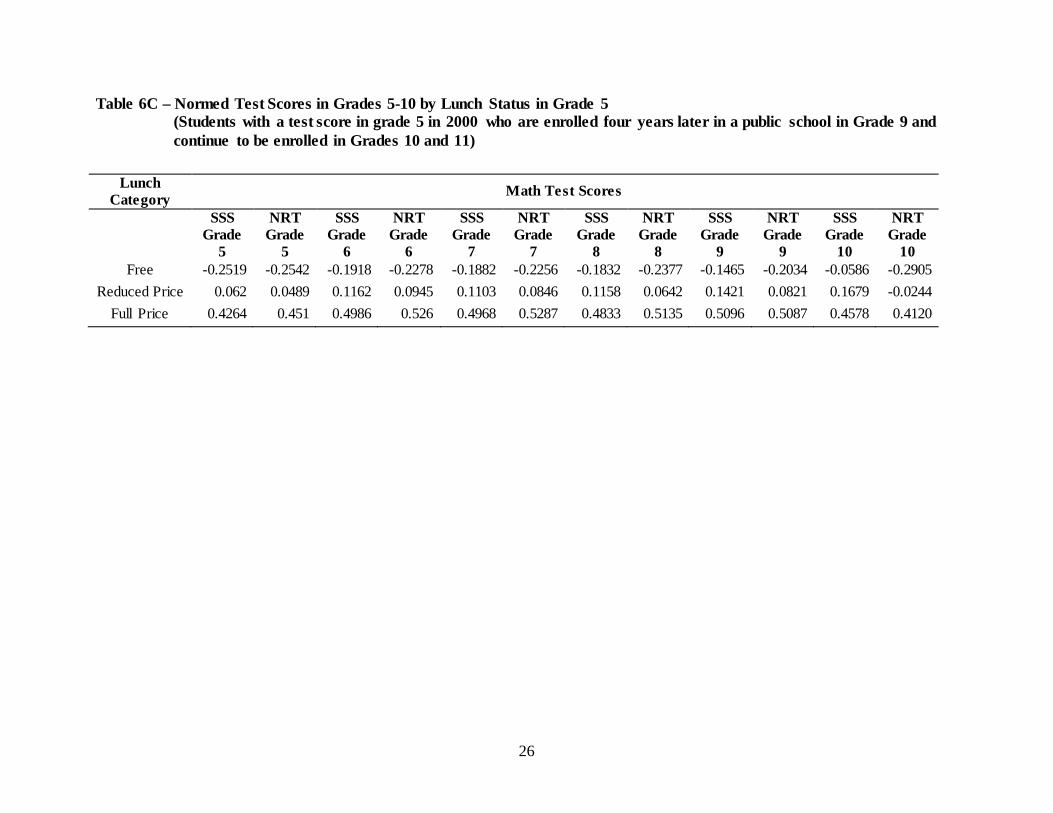
Table 6C – Normed Test Scores in Grades 5-10 by Lunch Status in Grade 5 (Students with a test score in grade 5 in 2000 who are enrolled four years later in a public school in Grade 9 and
continue to be enrolled in Grades 10 and 11)
Lunch Category Math Test Scores
SSS Grade
5
NRT Grade
5
SSS Grade
6
NRT Grade
6
SSS Grade
7
NRT Grade
7
SSS Grade
8
NRT Grade
8
SSS Grade
9
NRT Grade
9
SSS Grade
10
NRT Grade
10 Free -0.2519 -0.2542 -0.1918 -0.2278 -0.1882 -0.2256 -0.1832 -0.2377 -0.1465 -0.2034 -0.0586 -0.2905
Reduced Price 0.062 0.0489 0.1162 0.0945 0.1103 0.0846 0.1158 0.0642 0.1421 0.0821 0.1679 -0.0244 Full Price 0.4264 0.451 0.4986 0.526 0.4968 0.5287 0.4833 0.5135 0.5096 0.5087 0.4578 0.4120
26
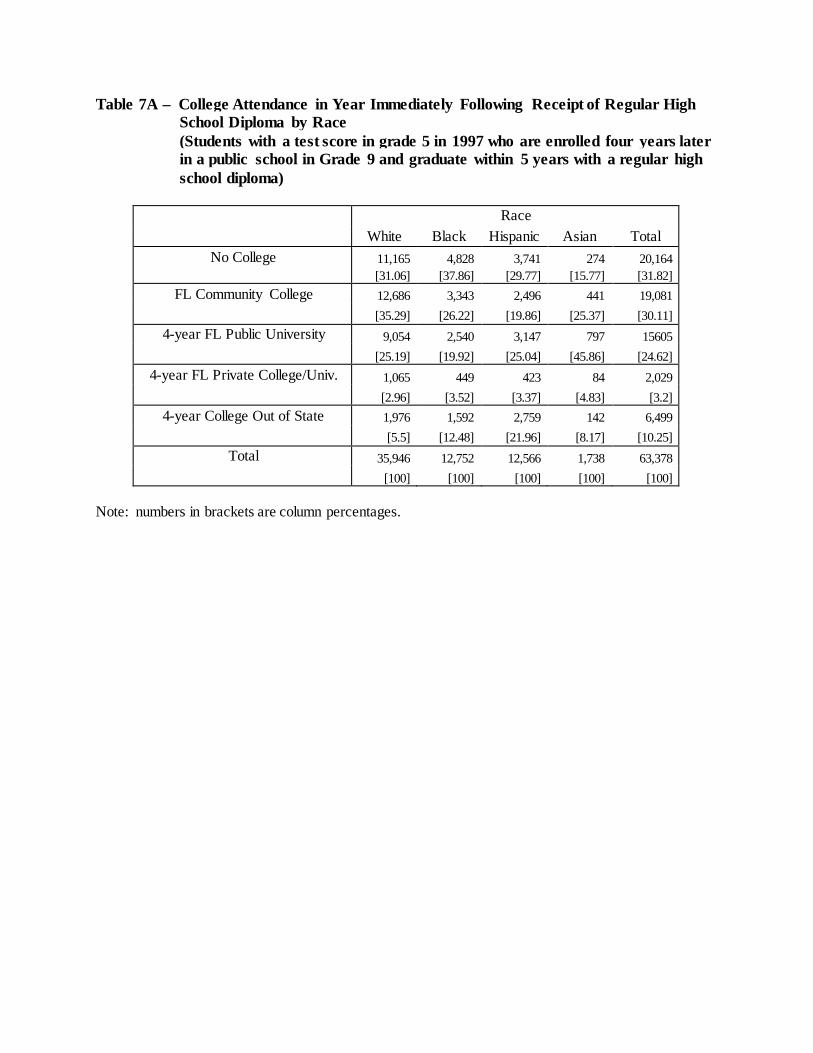
Table 7A – College Attendance in Year Immediately Following Receipt of Regular High School Diploma by Race
(Students with a test score in grade 5 in 1997 who are enrolled four years later in a public school in Grade 9 and graduate within 5 years with a regular high school diploma)
Race
White Black Hispanic Asian Total
No College 11,165 4,828 3,741 274 20,164
[31.06] [37.86] [29.77] [15.77] [31.82]
FL Community College 12,686 3,343 2,496 441 19,081
[35.29] [26.22] [19.86] [25.37] [30.11]
4-year FL Public University 9,054 2,540 3,147 797 15605
[25.19] [19.92] [25.04] [45.86] [24.62]
4-year FL Private College/Univ. 1,065 449 423 84 2,029
[2.96] [3.52] [3.37] [4.83] [3.2]
4-year College Out of State 1,976 1,592 2,759 142 6,499
[5.5] [12.48] [21.96] [8.17] [10.25]
Total 35,946 12,752 12,566 1,738 63,378
[100] [100] [100] [100] [100]
Note: numbers in brackets are column percentages.
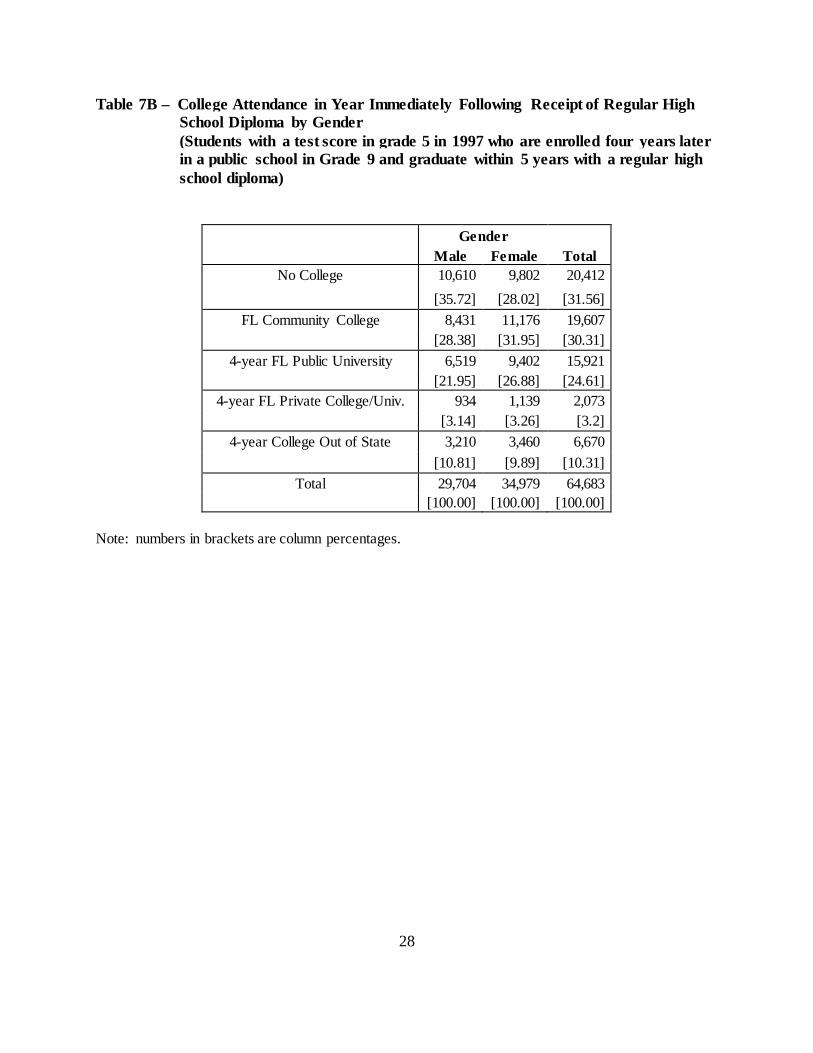
Table 7B – College Attendance in Year Immediately Following Receipt of Regular High School Diploma by Gender
(Students with a test score in grade 5 in 1997 who are enrolled four years later in a public school in Grade 9 and graduate within 5 years with a regular high school diploma)
Gender
Male Female Total No College 10,610 9,802 20,412
[35.72] [28.02] [31.56]
FL Community College 8,431 11,176 19,607
[28.38] [31.95] [30.31]
4-year FL Public University 6,519 9,402 15,921
[21.95] [26.88] [24.61]
4-year FL Private College/Univ. 934 1,139 2,073
[3.14] [3.26] [3.2]
4-year College Out of State 3,210 3,460 6,670
[10.81] [9.89] [10.31]
Total 29,704 34,979 64,683
[100.00] [100.00] [100.00]
Note: numbers in brackets are column percentages.
28
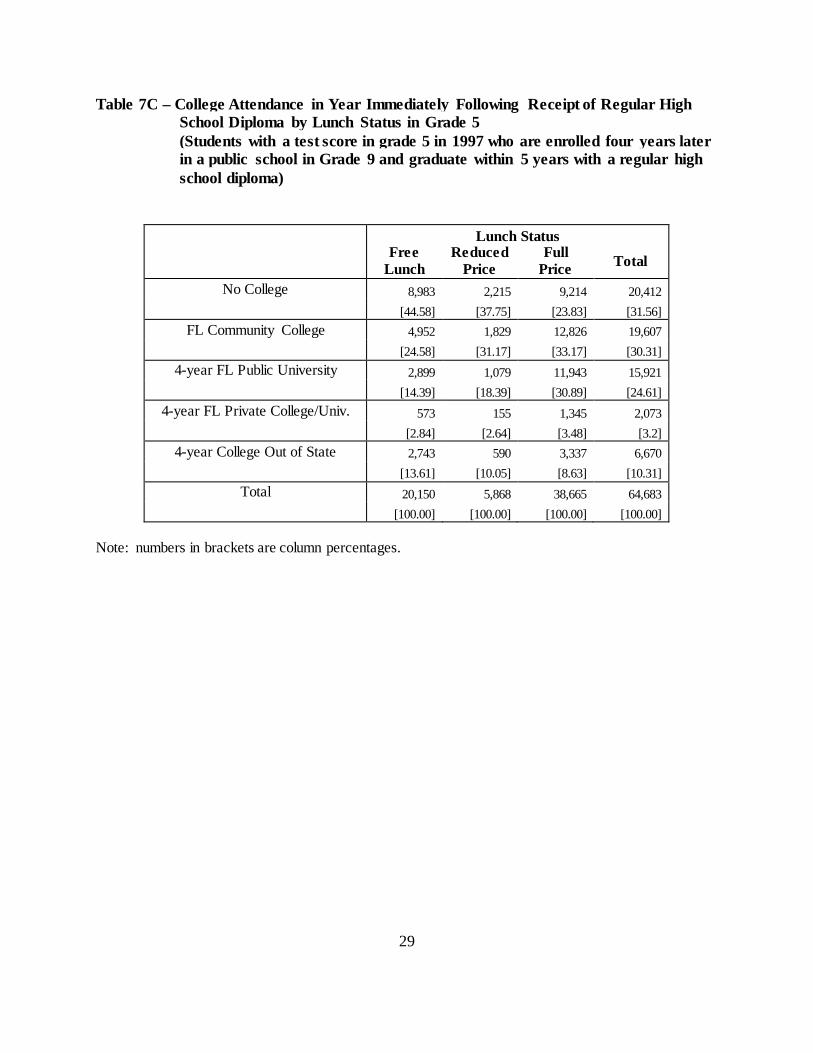
Table 7C – College Attendance in Year Immediately Following Receipt of Regular High School Diploma by Lunch Status in Grade 5
(Students with a test score in grade 5 in 1997 who are enrolled four years later in a public school in Grade 9 and graduate within 5 years with a regular high school diploma)
Lunch Status
Free Lunch
Reduced Price
Full Price Total
No College 8,983 2,215 9,214 20,412
[44.58] [37.75] [23.83] [31.56]
FL Community College 4,952 1,829 12,826 19,607
[24.58] [31.17] [33.17] [30.31]
4-year FL Public University 2,899 1,079 11,943 15,921
[14.39] [18.39] [30.89] [24.61]
4-year FL Private College/Univ. 573 155 1,345 2,073
[2.84] [2.64] [3.48] [3.2]
4-year College Out of State 2,743 590 3,337 6,670
[13.61] [10.05] [8.63] [10.31]
Total 20,150 5,868 38,665 64,683
[100.00] [100.00] [100.00] [100.00]
Note: numbers in brackets are column percentages.
29
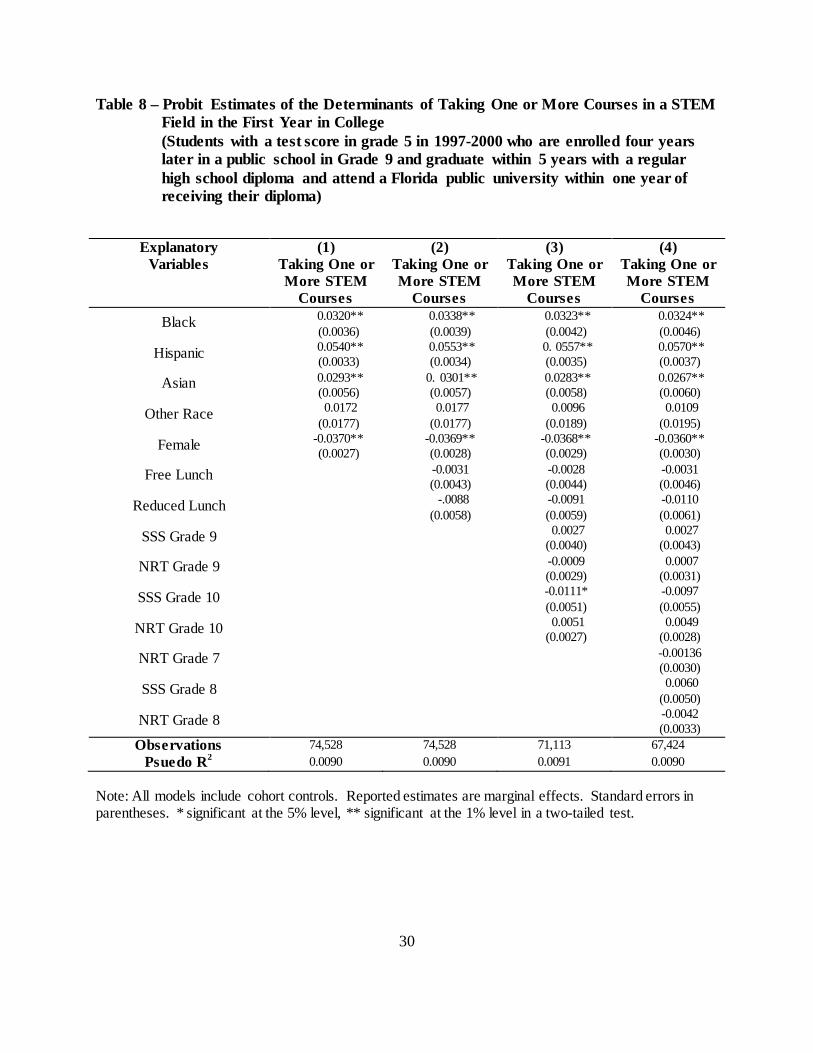
Table 8 – Probit Estimates of the Determinants of Taking One or More Courses in a STEM Field in the First Year in College
(Students with a test score in grade 5 in 1997-2000 who are enrolled four years later in a public school in Grade 9 and graduate within 5 years with a regular high school diploma and attend a Florida public university within one year of receiving their diploma)
Explanatory Variables
(1) Taking One or More STEM
Courses
(2) Taking One or More STEM
Courses
(3) Taking One or More STEM
Courses
(4) Taking One or More STEM
Courses Black 0.0320**
(0.0036) 0.0338** (0.0039)
0.0323** (0.0042)
0.0324** (0.0046)
Hispanic 0.0540** (0.0033)
0.0553** (0.0034)
0. 0557** (0.0035)
0.0570** (0.0037)
Asian 0.0293** (0.0056)
0. 0301** (0.0057)
0.0283** (0.0058)
0.0267** (0.0060)
Other Race 0.0172 (0.0177)
0.0177 (0.0177)
0.0096 (0.0189)
0.0109 (0.0195)
Female -0.0370** (0.0027)
-0.0369** (0.0028)
-0.0368** (0.0029)
-0.0360** (0.0030)
Free Lunch -0.0031 (0.0043)
-0.0028 (0.0044)
-0.0031 (0.0046)
Reduced Lunch -.0088 (0.0058)
-0.0091 (0.0059)
-0.0110 (0.0061)
SSS Grade 9 0.0027 (0.0040)
0.0027 (0.0043)
NRT Grade 9 -0.0009 (0.0029)
0.0007 (0.0031)
SSS Grade 10 -0.0111* (0.0051)
-0.0097 (0.0055)
NRT Grade 10 0.0051 (0.0027)
0.0049 (0.0028)
NRT Grade 7 -0.00136 (0.0030)
SSS Grade 8 0.0060 (0.0050)
NRT Grade 8 -0.0042 (0.0033)
Observations 74,528 74,528 71,113 67,424 Psuedo R2 0.0090 0.0090 0.0091 0.0090
Note: All models include cohort controls. Reported estimates are marginal effects. Standard errors in parentheses. * significant at the 5% level, ** significant at the 1% level in a two-tailed test.
30
Table 9 – Probit Estimates of the Determinants of Taking One or More Courses in Specific
Science Subjects During the First Year in College (Students with a test score in grade 5 in 1997-2000 who are enrolled four years later in a public school in Grade 9 and graduate within 5 years with a regular high school diploma and attend a Florida public university within one year of receiving their diploma)
Explanatory
Variables Taking One or More Science
Courses
Taking One or More Biology
Courses
Taking One or More
Chemistry Courses
Taking One or More Physics
Courses
Black 0.0527** (0.0061)
0.0208** (0.0055)
0.1212** (0.0061)
-0.0032 (0.0020)
Hispanic 0.0982** (0.0052)
0.0304** (0.0049)
0.1177** (0.0052)
0.0054** (0.0017)
Asian 0.0721** (0.0082)
0.0749** (0.0081)
0.1626** (0.0084)
0.0097** (0.0027)
Other Race 0.0000 (0.0267)
-0.0231 (0.0229)
0.0398 (0.0251)
-0.0024 (0.0074)
Female -0.0110** (0.0040)
0.0616** (0.0034)
-0.0048 (0.0034)
-0.0312** (0.0014)
Free Lunch -0.0117* (0.0059)
-0.0099* (0.0050)
0.0085 (0.0050)
0.0042* (0.0020)
Reduced Lunch -0.0165* (0.0078)
-0.0085 (0.0066)
0.0024 (0.0066)
0.0000 (0.0024)
SSS Grade 9 -0.0029 (0.0056)
-0.0174** (0.0051)
0.0248** (0.0047)
0.0055** (0.0013)
NRT Grade 9 0.0048 (0.0041)
0.0030 (0.0036)
0.0055 (0.0034)
0.0029** (0.0010)
SSS Grade 10 0.0170* (0.0073)
-0.0157* (0.0065)
0.0631** (0.0061)
0.0158** (0.0017)
NRT Grade 10 0.0083* (0.0037)
-0.0046 (0.0033)
0.0227** (0.0031)
0.0100** (0.0009)
NRT Grade 7 -0.0100* (0.0040)
-0.0097** (0.0035)
-0.0068* (0.0034)
0.0008 (0.0011)
SSS Grade 8 0.0128* (0.0065)
-0.0046 (0.0058)
0.0148** (0.0055)
0.0047** (0.0016)
NRT Grade 8 -0.0137** (0.0043)
-0.0087* (0.0038)
-0.0136** (0.0037)
0.0004 (0.0011)
Observations 67,424 67,424 67,424 67,424 Psuedo R2 0.0060 0.0144 0.0294 0.1401
Note: All models include cohort controls. Reported estimates are marginal effects. Standard errors in parentheses. * significant at the 5% level, ** significant at the 1% level in a two-tailed test.
31
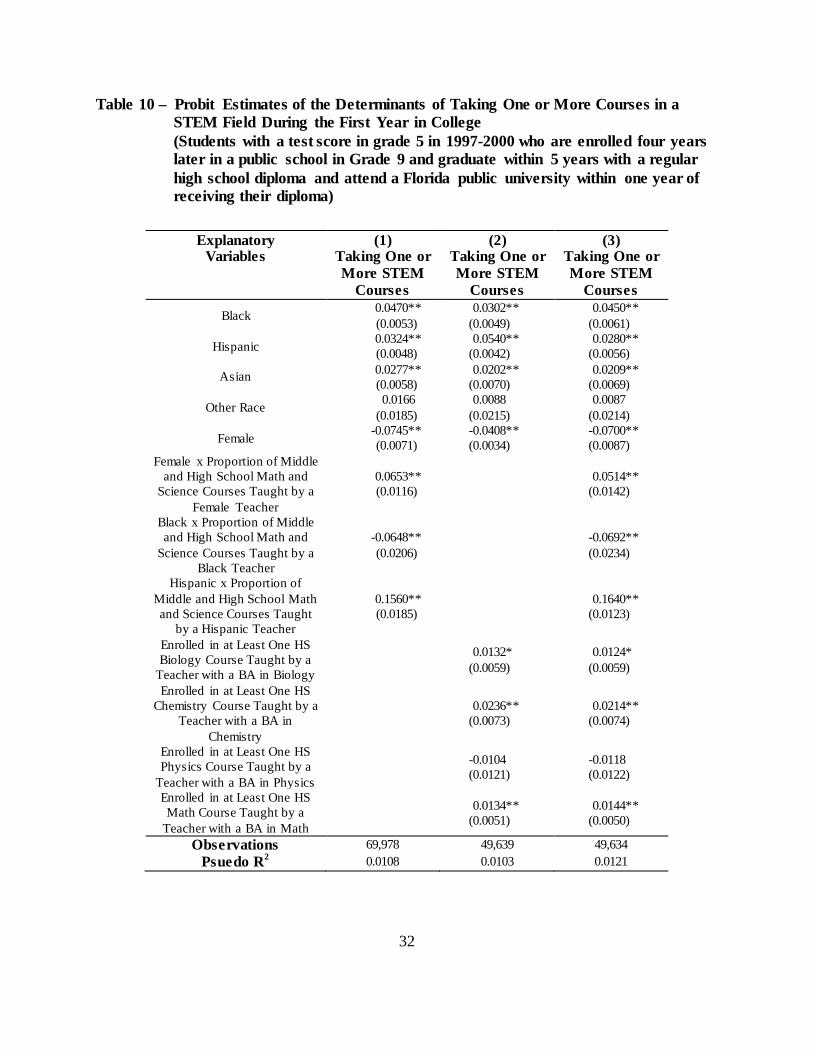
Table 10 – Probit Estimates of the Determinants of Taking One or More Courses in a STEM Field During the First Year in College
(Students with a test score in grade 5 in 1997-2000 who are enrolled four years later in a public school in Grade 9 and graduate within 5 years with a regular high school diploma and attend a Florida public university within one year of receiving their diploma)
Explanatory Variables
(1) Taking One or More STEM
Courses
(2) Taking One or More STEM
Courses
(3) Taking One or More STEM
Courses
Black 0.0470** (0.0053)
0.0302** (0.0049)
0.0450** (0.0061)
Hispanic 0.0324** (0.0048)
0.0540** (0.0042)
0.0280** (0.0056)
Asian 0.0277** (0.0058)
0.0202** (0.0070)
0.0209** (0.0069)
Other Race 0.0166 (0.0185)
0.0088 (0.0215)
0.0087 (0.0214)
Female -0.0745** (0.0071)
-0.0408** (0.0034)
-0.0700** (0.0087)
Female x Proportion of Middle and High School Math and
Science Courses Taught by a Female Teacher
0.0653** (0.0116) 0.0514**
(0.0142)
Black x Proportion of Middle and High School Math and
Science Courses Taught by a Black Teacher
-0.0648** (0.0206) -0.0692**
(0.0234)
Hispanic x Proportion of Middle and High School Math and Science Courses Taught
by a Hispanic Teacher
0.1560** (0.0185) 0.1640**
(0.0123)
Enrolled in at Least One HS Biology Course Taught by a
Teacher with a BA in Biology 0.0132*
(0.0059) 0.0124*
(0.0059)
Enrolled in at Least One HS Chemistry Course Taught by a
Teacher with a BA in Chemistry
0.0236** (0.0073)
0.0214** (0.0074)
Enrolled in at Least One HS Physics Course Taught by a
Teacher with a BA in Physics -0.0104
(0.0121) -0.0118 (0.0122)
Enrolled in at Least One HS Math Course Taught by a
Teacher with a BA in Math 0.0134**
(0.0051) 0.0144**
(0.0050)
Observations 69,978 49,639 49,634 Psuedo R2 0.0108 0.0103 0.0121
32

Note: All models include cohort controls, controls for free and reduced-price lunch in grade 5 and controls for math test scores in grades 5, 7 and 8. Reported estimates are marginal effects. Standard errors are in parentheses. * significant at the 5% level, ** significant at the 1% level in a two-tailed test.
33

Table 11 – Probit Estimates of the Determinants of Taking One or More Courses in Specific Science Subjects During the First Year in College
(Students with a test score in grade 5 in 1997-2000 who are enrolled four years later in a public school in Grade 9 and graduate within 5 years with a regular high school diploma and attend a Florida public university within one year of receiving their diploma)
Explanatory Variables
Taking One or More Science
Courses
Taking One or More Biology
Courses
Taking One or More
Chemistry Courses
Taking One or More Physics
Courses
Black -0.0457** (0.0069)
0.0252** (0.0064)
0.1082** (0.0069)
-0.0054 (0.0022)
Hispanic -0.0854** (0.0060)
0.0219** (0.0057)
0.1147** (0.0060)
0.0046 (0.0020)
Asian 0.0732** (0.0095)
0.0708** (0.0095)
0.1738** (0.0099)
0.0139 (0.0034)
Other Race -0.0134 (.0298)
-0.0120 (0.0263)
0.0198 (0.0276)
-0.0004 (0.0087)
Female -0.0141** (0.0046)
0.0678** (0.0040)
-0.0140** (0.0040)
-0.0342 (0.0017)
Enrolled in at Least One HS Biology Course Taught by a
Teacher with a BA in Biology
0.0082 (0.0081)
-0.0069 (0.0071)
0.0220** (0.0072)
0.0028 (0.0025)
Enrolled in at Least One HS Chemistry Course Taught by a
Teacher with a BA in Chemistry
-0.0216* (0.0101)
0.0008 (0.0090)
0.0185* (0.0090)
0.0022 (0.0032)
Enrolled in at Least One HS Physics Course Taught by a
Teacher with a BA in Physics
-0.0027 (0.0155)
-0.0070 (0.0137)
0.0251* (0.0136)
0.0032 (0.0044)
Enrolled in at Least One HS Math Course Taught by a
Teacher with a BA in Math
0.0393** (0.0068)
0.0159** (0.0062)
0.0210** (0.0061)
0.0083 (0.0023)
Observations 49,639 49,639 49,639 49,639 Psuedo R2 0.0053 0.0138 0.0256 0.1280
Note: All models include cohort controls, controls for free and reduced-price lunch in grade 5 and controls for math test scores in grades 5, 7 and 8. Reported estimates are marginal effects. Standard errors are in parentheses. * significant at the 5% level, ** significant at the 1% level in a two-tailed test.
34
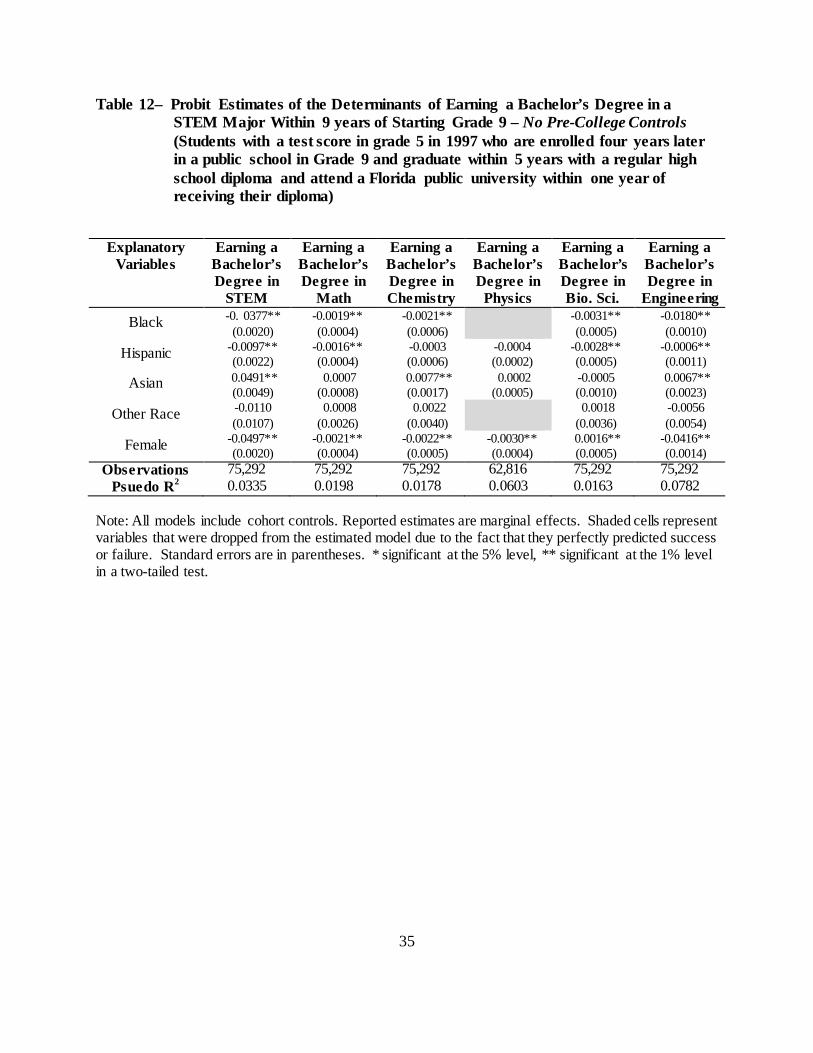
Table 12– Probit Estimates of the Determinants of Earning a Bachelor’s Degree in a STEM Major Within 9 years of Starting Grade 9 – No Pre-College Controls
(Students with a test score in grade 5 in 1997 who are enrolled four years later in a public school in Grade 9 and graduate within 5 years with a regular high school diploma and attend a Florida public university within one year of receiving their diploma)
Explanatory Variables
Earning a Bachelor’s Degree in
STEM
Earning a Bachelor’s Degree in
Math
Earning a Bachelor’s Degree in Chemistry
Earning a Bachelor’s Degree in
Physics
Earning a Bachelor’s Degree in Bio. Sci.
Earning a Bachelor’s Degree in
Engineering Black -0. 0377**
(0.0020) -0.0019** (0.0004)
-0.0021** (0.0006)
-0.0031** (0.0005)
-0.0180** (0.0010)
Hispanic -0.0097** (0.0022)
-0.0016** (0.0004)
-0.0003 (0.0006)
-0.0004 (0.0002)
-0.0028** (0.0005)
-0.0006** (0.0011)
Asian 0.0491** (0.0049)
0.0007 (0.0008)
0.0077** (0.0017)
0.0002 (0.0005)
-0.0005 (0.0010)
0.0067** (0.0023)
Other Race -0.0110 (0.0107)
0.0008 (0.0026)
0.0022 (0.0040)
0.0018 (0.0036)
-0.0056 (0.0054)
Female -0.0497** (0.0020)
-0.0021** (0.0004)
-0.0022** (0.0005)
-0.0030** (0.0004)
0.0016** (0.0005)
-0.0416** (0.0014)
Observations 75,292 75,292 75,292 62,816 75,292 75,292 Psuedo R2 0.0335 0.0198 0.0178 0.0603 0.0163 0.0782
Note: All models include cohort controls. Reported estimates are marginal effects. Shaded cells represent variables that were dropped from the estimated model due to the fact that they perfectly predicted success or failure. Standard errors are in parentheses. * significant at the 5% level, ** significant at the 1% level in a two-tailed test.
35
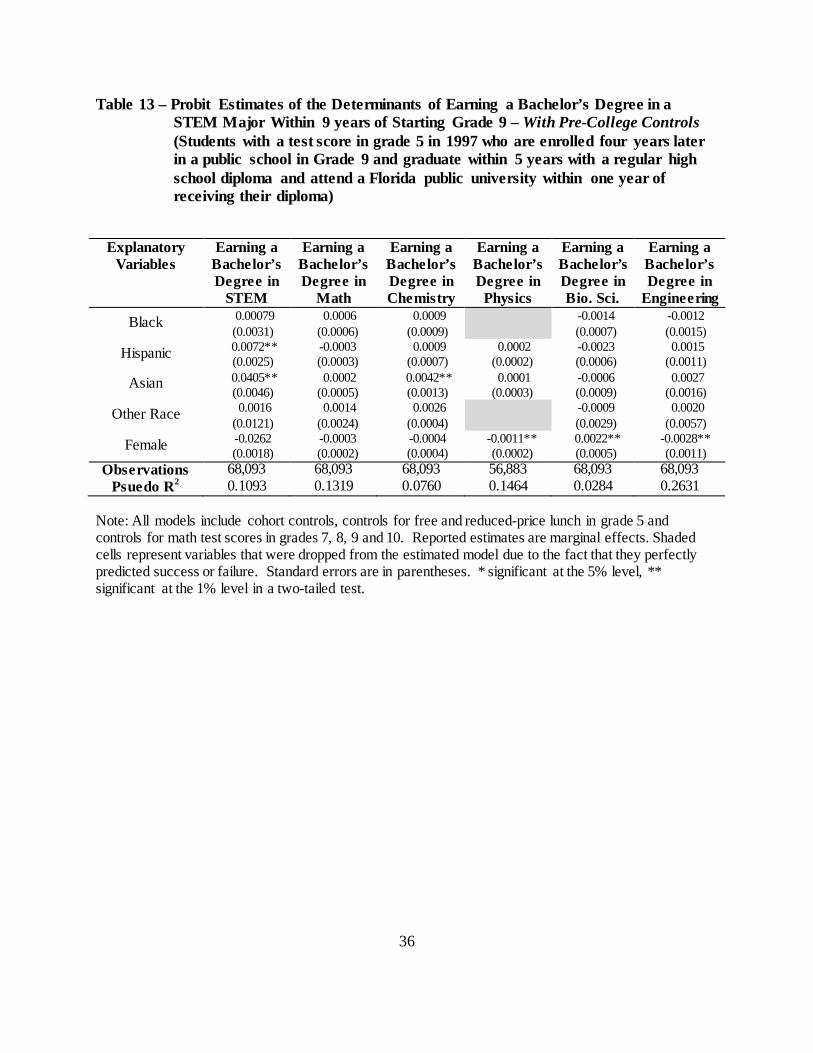
Table 13 – Probit Estimates of the Determinants of Earning a Bachelor’s Degree in a STEM Major Within 9 years of Starting Grade 9 – With Pre-College Controls
(Students with a test score in grade 5 in 1997 who are enrolled four years later in a public school in Grade 9 and graduate within 5 years with a regular high school diploma and attend a Florida public university within one year of receiving their diploma)
Explanatory Variables
Earning a Bachelor’s Degree in
STEM
Earning a Bachelor’s Degree in
Math
Earning a Bachelor’s Degree in Chemistry
Earning a Bachelor’s Degree in
Physics
Earning a Bachelor’s Degree in Bio. Sci.
Earning a Bachelor’s Degree in
Engineering Black 0.00079
(0.0031) 0.0006
(0.0006) 0.0009
(0.0009)
-0.0014 (0.0007)
-0.0012 (0.0015)
Hispanic 0.0072** (0.0025)
-0.0003 (0.0003)
0.0009 (0.0007)
0.0002 (0.0002)
-0.0023 (0.0006)
0.0015 (0.0011)
Asian 0.0405** (0.0046)
0.0002 (0.0005)
0.0042** (0.0013)
0.0001 (0.0003)
-0.0006 (0.0009)
0.0027 (0.0016)
Other Race 0.0016 (0.0121)
0.0014 (0.0024)
0.0026 (0.0004)
-0.0009 (0.0029)
0.0020 (0.0057)
Female -0.0262 (0.0018)
-0.0003 (0.0002)
-0.0004 (0.0004)
-0.0011** (0.0002)
0.0022** (0.0005)
-0.0028** (0.0011)
Observations 68,093 68,093 68,093 56,883 68,093 68,093 Psuedo R2 0.1093 0.1319 0.0760 0.1464 0.0284 0.2631
Note: All models include cohort controls, controls for free and reduced-price lunch in grade 5 and controls for math test scores in grades 7, 8, 9 and 10. Reported estimates are marginal effects. Shaded cells represent variables that were dropped from the estimated model due to the fact that they perfectly predicted success or failure. Standard errors are in parentheses. * significant at the 5% level, ** significant at the 1% level in a two-tailed test.
36
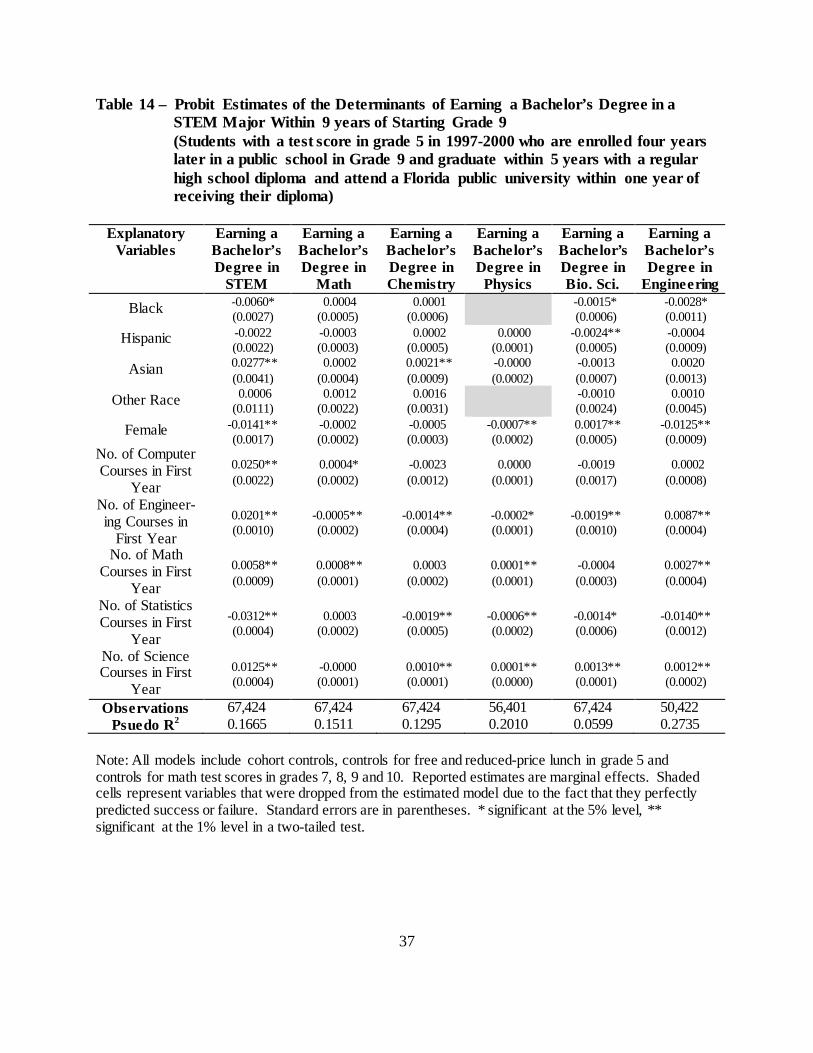
Table 14 – Probit Estimates of the Determinants of Earning a Bachelor’s Degree in a STEM Major Within 9 years of Starting Grade 9
(Students with a test score in grade 5 in 1997-2000 who are enrolled four years later in a public school in Grade 9 and graduate within 5 years with a regular high school diploma and attend a Florida public university within one year of receiving their diploma)
Explanatory
Variables Earning a
Bachelor’s Degree in
STEM
Earning a Bachelor’s Degree in
Math
Earning a Bachelor’s Degree in Chemistry
Earning a Bachelor’s Degree in
Physics
Earning a Bachelor’s Degree in Bio. Sci.
Earning a Bachelor’s Degree in
Engineering Black -0.0060*
(0.0027) 0.0004
(0.0005) 0.0001
(0.0006) -0.0015* (0.0006)
-0.0028* (0.0011)
Hispanic -0.0022 (0.0022)
-0.0003 (0.0003)
0.0002 (0.0005)
0.0000 (0.0001)
-0.0024** (0.0005)
-0.0004 (0.0009)
Asian 0.0277** (0.0041)
0.0002 (0.0004)
0.0021** (0.0009)
-0.0000 (0.0002)
-0.0013 (0.0007)
0.0020 (0.0013)
Other Race 0.0006 (0.0111)
0.0012 (0.0022)
0.0016 (0.0031)
-0.0010 (0.0024)
0.0010 (0.0045)
Female -0.0141** (0.0017)
-0.0002 (0.0002)
-0.0005 (0.0003)
-0.0007** (0.0002)
0.0017** (0.0005)
-0.0125** (0.0009)
No. of Computer Courses in First
Year 0.0250** (0.0022)
0.0004* (0.0002)
-0.0023 (0.0012)
0.0000 (0.0001)
-0.0019 (0.0017)
0.0002 (0.0008)
No. of Engineer- ing Courses in
First Year 0.0201** (0.0010)
-0.0005** (0.0002)
-0.0014** (0.0004)
-0.0002* (0.0001)
-0.0019** (0.0010)
0.0087** (0.0004)
No. of Math Courses in First
Year 0.0058** (0.0009)
0.0008** (0.0001)
0.0003 (0.0002)
0.0001** (0.0001)
-0.0004 (0.0003)
0.0027** (0.0004)
No. of Statistics Courses in First
Year -0.0312** (0.0004)
0.0003 (0.0002)
-0.0019** (0.0005)
-0.0006** (0.0002)
-0.0014* (0.0006)
-0.0140** (0.0012)
No. of Science Courses in First
Year 0.0125** (0.0004)
-0.0000 (0.0001)
0.0010** (0.0001)
0.0001** (0.0000)
0.0013** (0.0001)
0.0012** (0.0002)
Observations 67,424 67,424 67,424 56,401 67,424 50,422 Psuedo R2 0.1665 0.1511 0.1295 0.2010 0.0599 0.2735
Note: All models include cohort controls, controls for free and reduced-price lunch in grade 5 and controls for math test scores in grades 7, 8, 9 and 10. Reported estimates are marginal effects. Shaded cells represent variables that were dropped from the estimated model due to the fact that they perfectly predicted success or failure. Standard errors are in parentheses. * significant at the 5% level, ** significant at the 1% level in a two-tailed test.
37
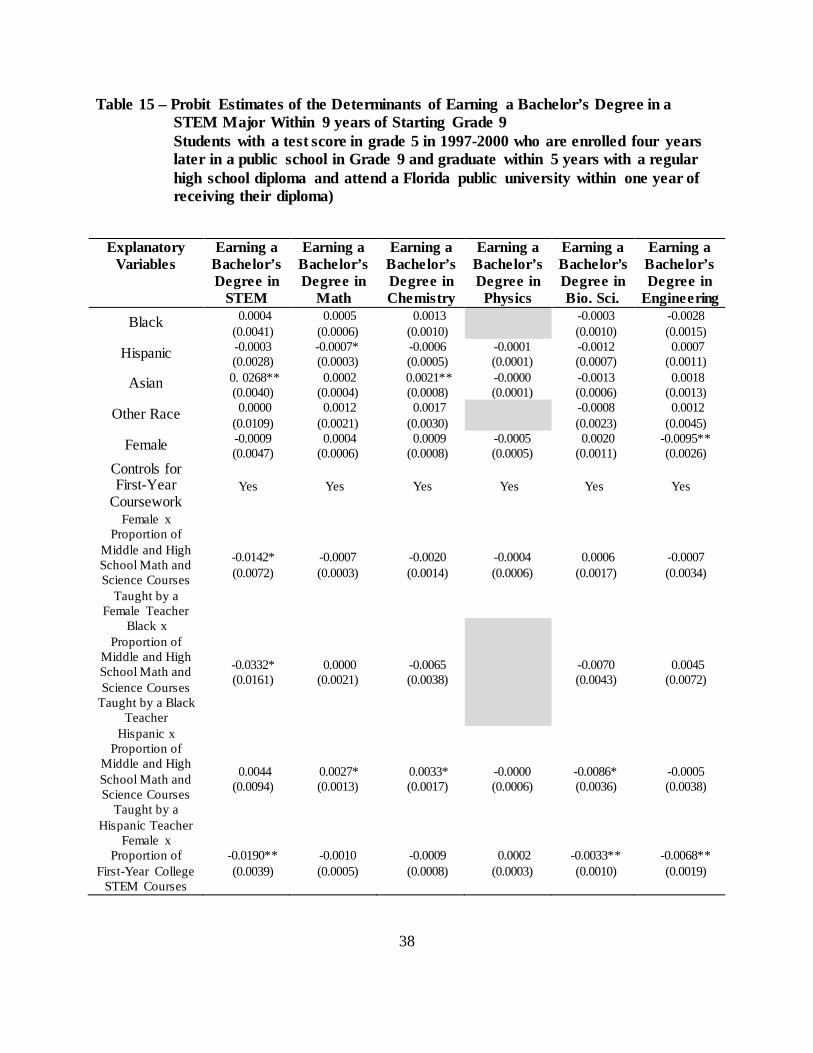
Table 15 – Probit Estimates of the Determinants of Earning a Bachelor’s Degree in a STEM Major Within 9 years of Starting Grade 9
Students with a test score in grade 5 in 1997-2000 who are enrolled four years later in a public school in Grade 9 and graduate within 5 years with a regular high school diploma and attend a Florida public university within one year of receiving their diploma)
Explanatory Variables
Earning a Bachelor’s Degree in
STEM
Earning a Bachelor’s Degree in
Math
Earning a Bachelor’s Degree in Chemistry
Earning a Bachelor’s Degree in
Physics
Earning a Bachelor’s Degree in Bio. Sci.
Earning a Bachelor’s Degree in
Engineering Black 0.0004
(0.0041) 0.0005
(0.0006) 0.0013
(0.0010) -0.0003 (0.0010)
-0.0028 (0.0015)
Hispanic -0.0003 (0.0028)
-0.0007* (0.0003)
-0.0006 (0.0005)
-0.0001 (0.0001)
-0.0012 (0.0007)
0.0007 (0.0011)
Asian 0. 0268** (0.0040)
0.0002 (0.0004)
0.0021** (0.0008)
-0.0000 (0.0001)
-0.0013 (0.0006)
0.0018 (0.0013)
Other Race 0.0000 (0.0109)
0.0012 (0.0021)
0.0017 (0.0030)
-0.0008 (0.0023)
0.0012 (0.0045)
Female -0.0009 (0.0047)
0.0004 (0.0006)
0.0009 (0.0008)
-0.0005 (0.0005)
0.0020 (0.0011)
-0.0095** (0.0026)
Controls for First-Year
Coursework Yes Yes Yes Yes Yes Yes
Female x Proportion of
Middle and High School Math and Science Courses
Taught by a Female Teacher
-0.0142* (0.0072)
-0.0007 (0.0003)
-0.0020 (0.0014)
-0.0004 (0.0006)
0.0006 (0.0017)
-0.0007 (0.0034)
Black x Proportion of
Middle and High School Math and Science Courses
Taught by a Black Teacher
-0.0332* (0.0161)
0.0000 (0.0021)
-0.0065 (0.0038) -0.0070
(0.0043) 0.0045
(0.0072)
Hispanic x Proportion of
Middle and High School Math and Science Courses
Taught by a Hispanic Teacher
0.0044 (0.0094)
0.0027* (0.0013)
0.0033* (0.0017)
-0.0000 (0.0006)
-0.0086* (0.0036)
-0.0005 (0.0038)
Female x Proportion of
First-Year College STEM Courses
-0.0190** (0.0039)
-0.0010 (0.0005)
-0.0009 (0.0008)
0.0002 (0.0003)
-0.0033** (0.0010)
-0.0068** (0.0019)
38
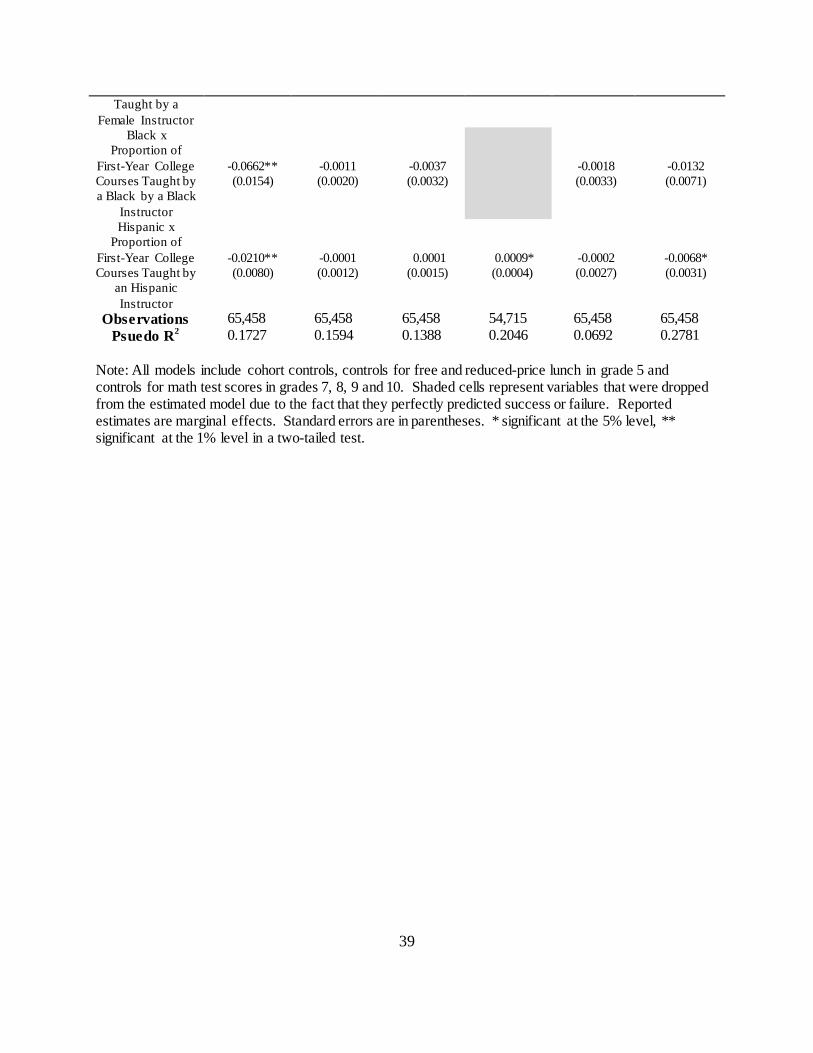
Taught by a Female Instructor
Black x Proportion of
First-Year College Courses Taught by a Black by a Black
Instructor
-0.0662** (0.0154)
-0.0011 (0.0020)
-0.0037 (0.0032) -0.0018
(0.0033) -0.0132 (0.0071)
Hispanic x Proportion of
First-Year College Courses Taught by
an Hispanic Instructor
-0.0210** (0.0080)
-0.0001 (0.0012)
0.0001 (0.0015)
0.0009* (0.0004)
-0.0002 (0.0027)
-0.0068* (0.0031)
Observations 65,458 65,458 65,458 54,715 65,458 65,458 Psuedo R2 0.1727 0.1594 0.1388 0.2046 0.0692 0.2781
Note: All models include cohort controls, controls for free and reduced-price lunch in grade 5 and controls for math test scores in grades 7, 8, 9 and 10. Shaded cells represent variables that were dropped from the estimated model due to the fact that they perfectly predicted success or failure. Reported estimates are marginal effects. Standard errors are in parentheses. * significant at the 5% level, ** significant at the 1% level in a two-tailed test.
39