understanding traffic patterns and regular travellers using registration plate data
TRANSCRIPT
Understanding traffic patterns and regular travellers using registration
plate data
Tom Cherrett, Fraser McLeodTransportation Research Group
University of Southampton
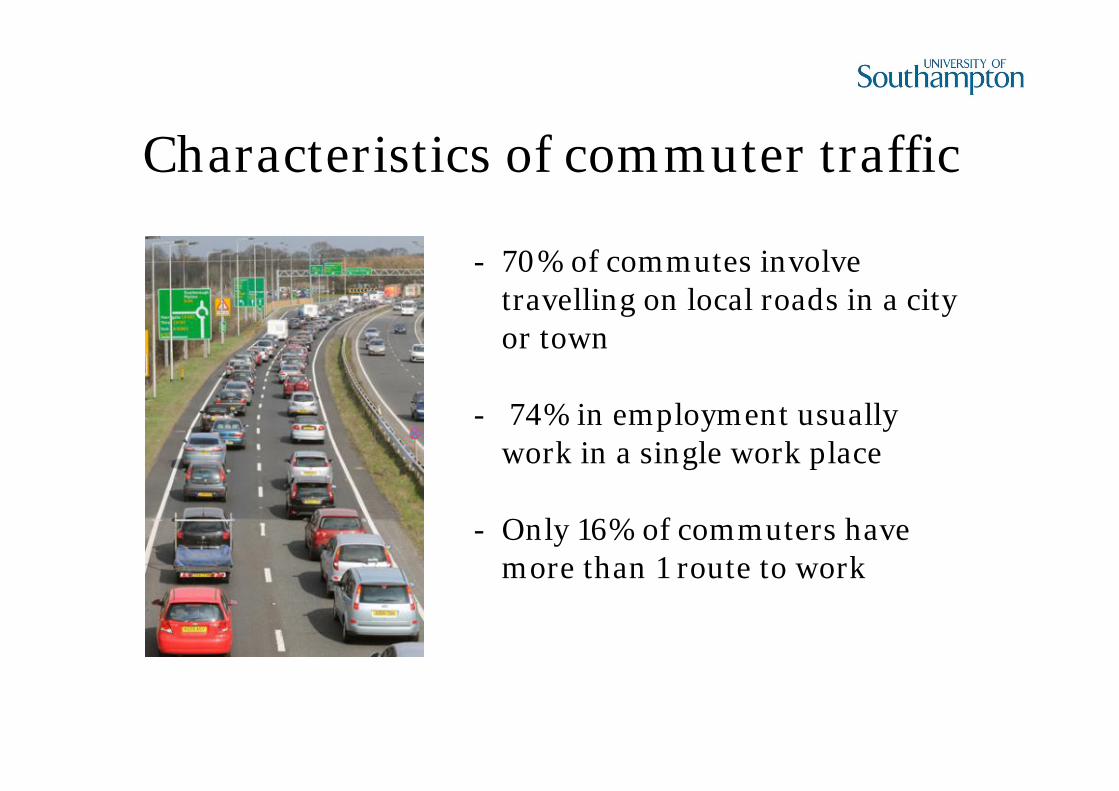
Characteristics of commuter traffic
- 70% of commutes involve travelling on local roads in a city or town
- 74% in employment usually work in a single work place
- Only 16% of commuters have more than 1 route to work

Characteristics of commuter traffic
- 34% change route because of traffic
seen up ahead
- > income or education levels use
more than one route to work
- > the JT, the > the frequency of route
change
- Males change route more
- Older commuters make less route
changes
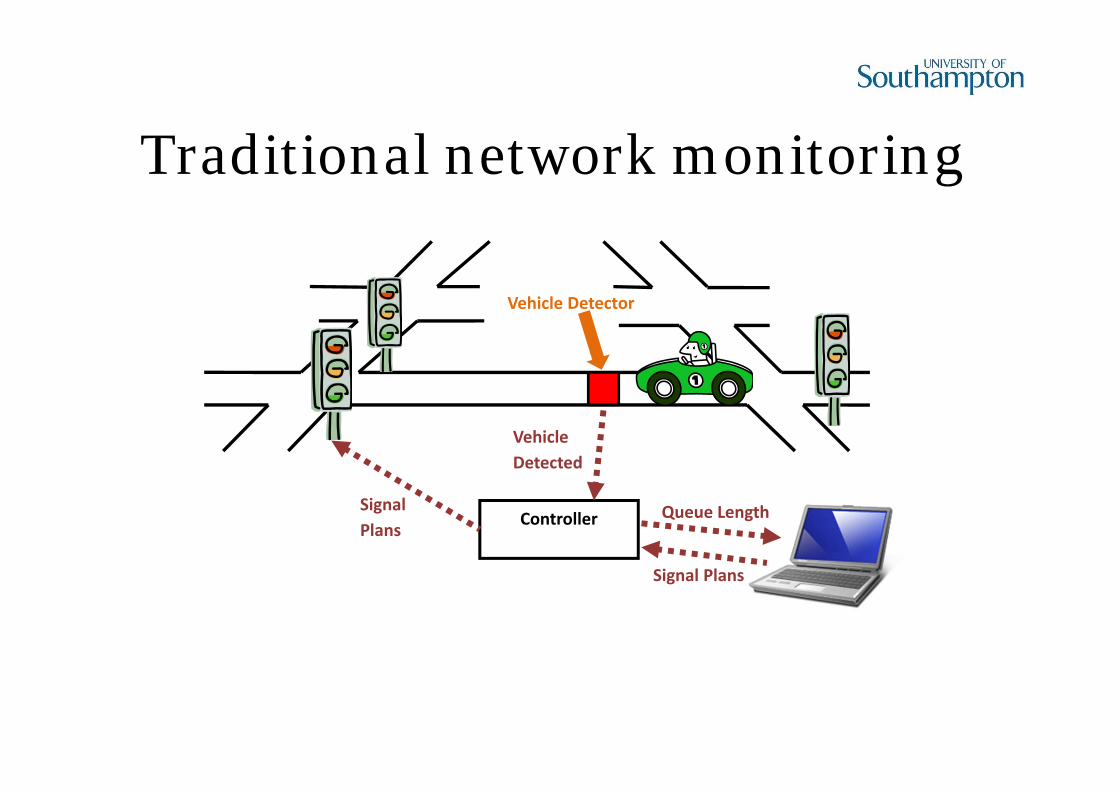
Traditional network monitoring
Vehicle Detector
Controller Queue LengthSignal Plans
Signal Plans
Vehicle Detected
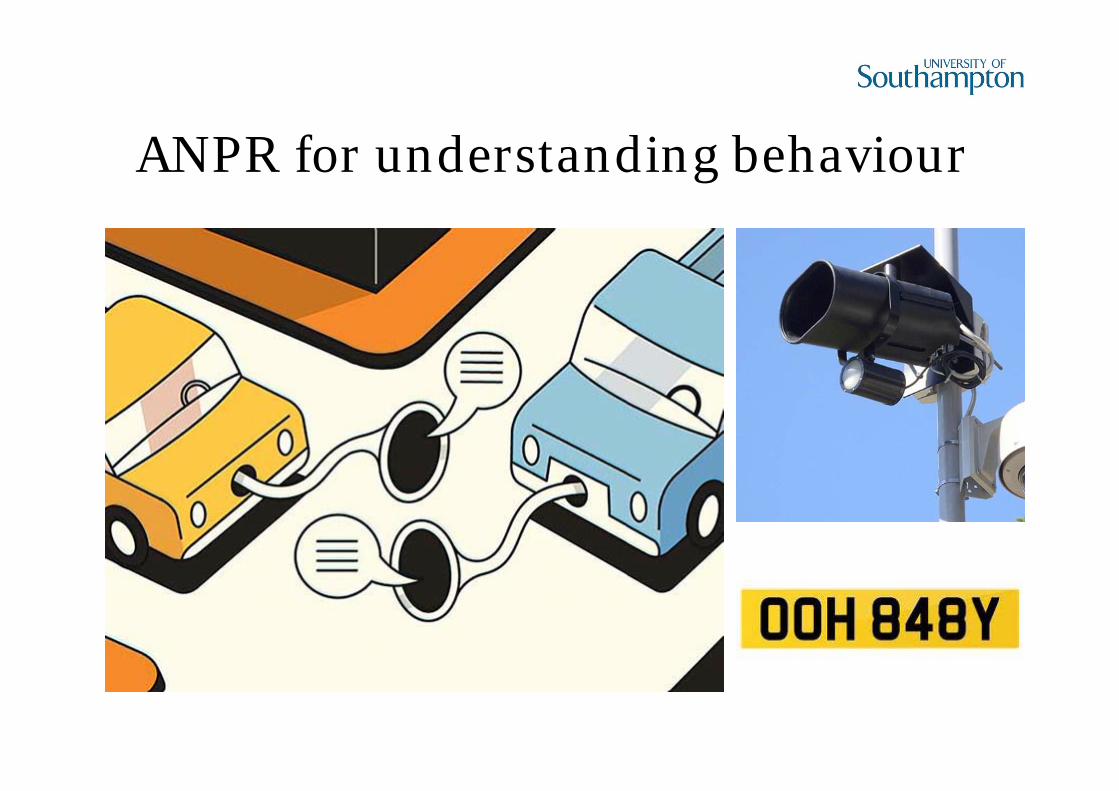
ANPR for understanding behaviour
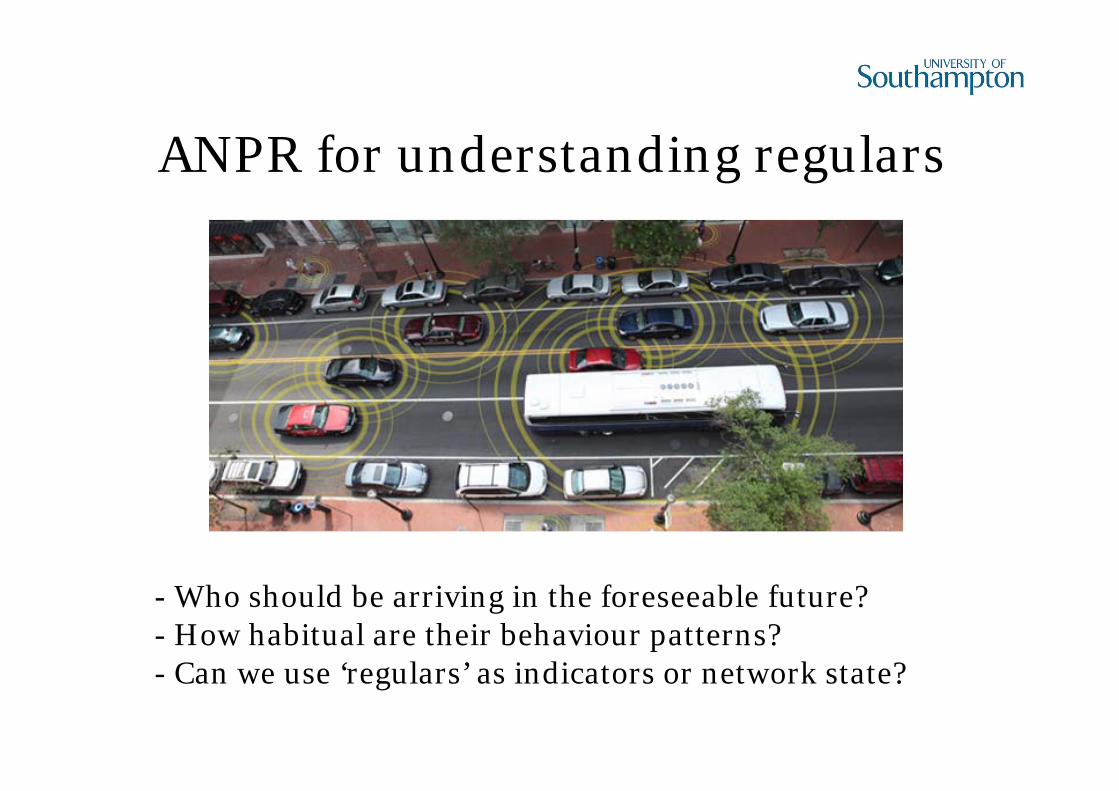
ANPR for understanding regulars
- Who should be arriving in the foreseeable future?- How habitual are their behaviour patterns?- Can we use ‘regulars’ as indicators or network state?
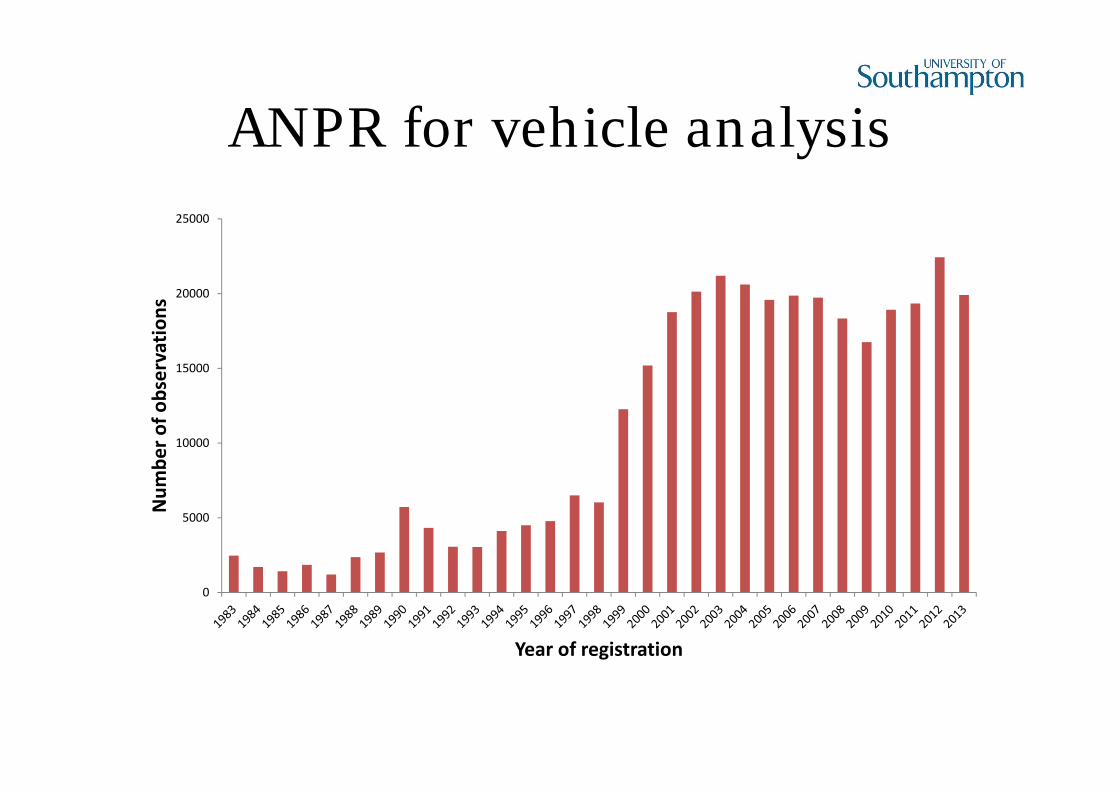
ANPR for vehicle analysis
0
5000
10000
15000
20000
25000
Num
ber o
f observatio
ns
Year of registration
Research Questions
Using ANPR data:
• How habitual are vehicle arrival patterns?• Can the arrival time variability of ‘regular ‘ vehicles be
used to gauge network performance?• How does ‘churn’ affect the supply of ‘regular’ vehicles?
Could one use ‘regular’ vehicles as information carriers in an ‘internet of cars’?
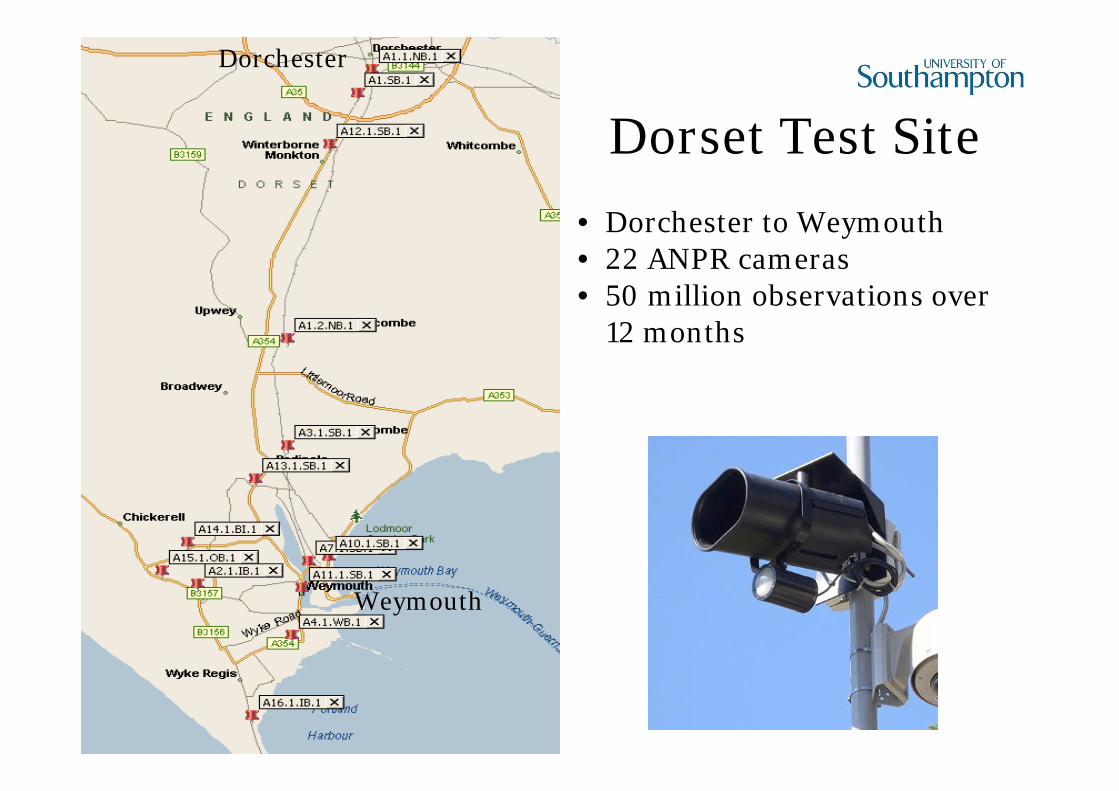
Dorset Test Site• Dorchester to Weymouth• 22 ANPR cameras• 50 million observations over
12 months
Dorchester
Weymouth
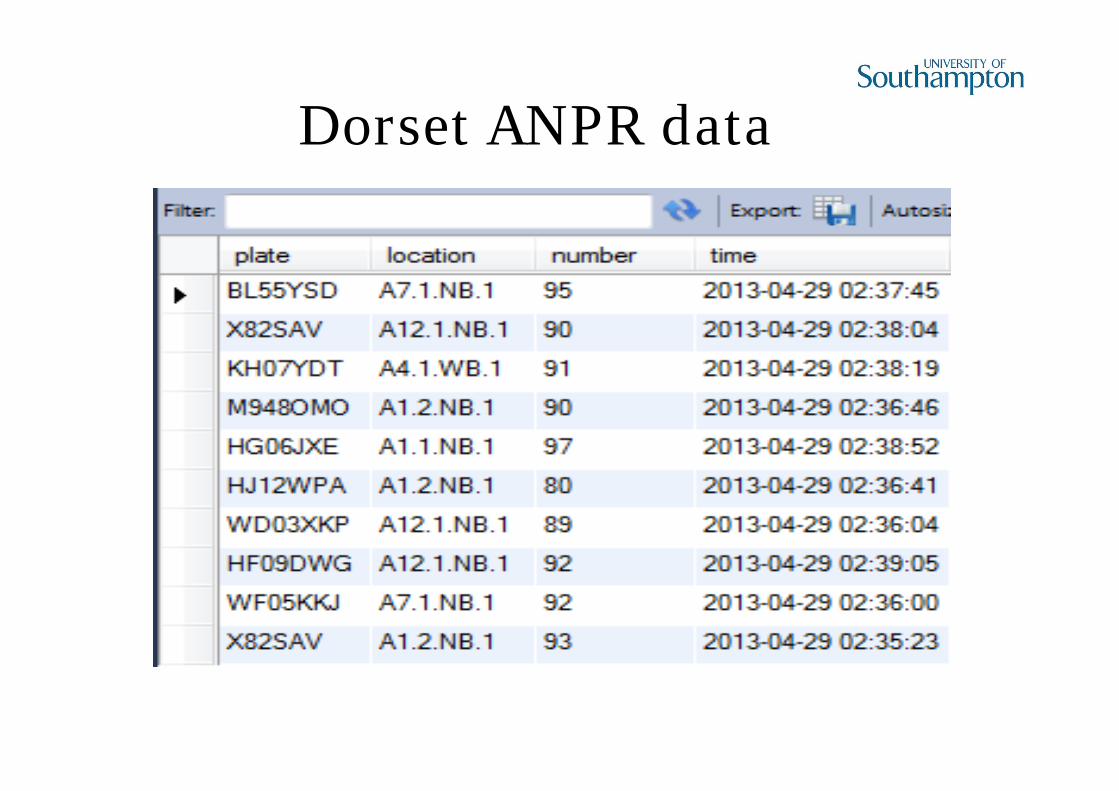
Dorset ANPR data
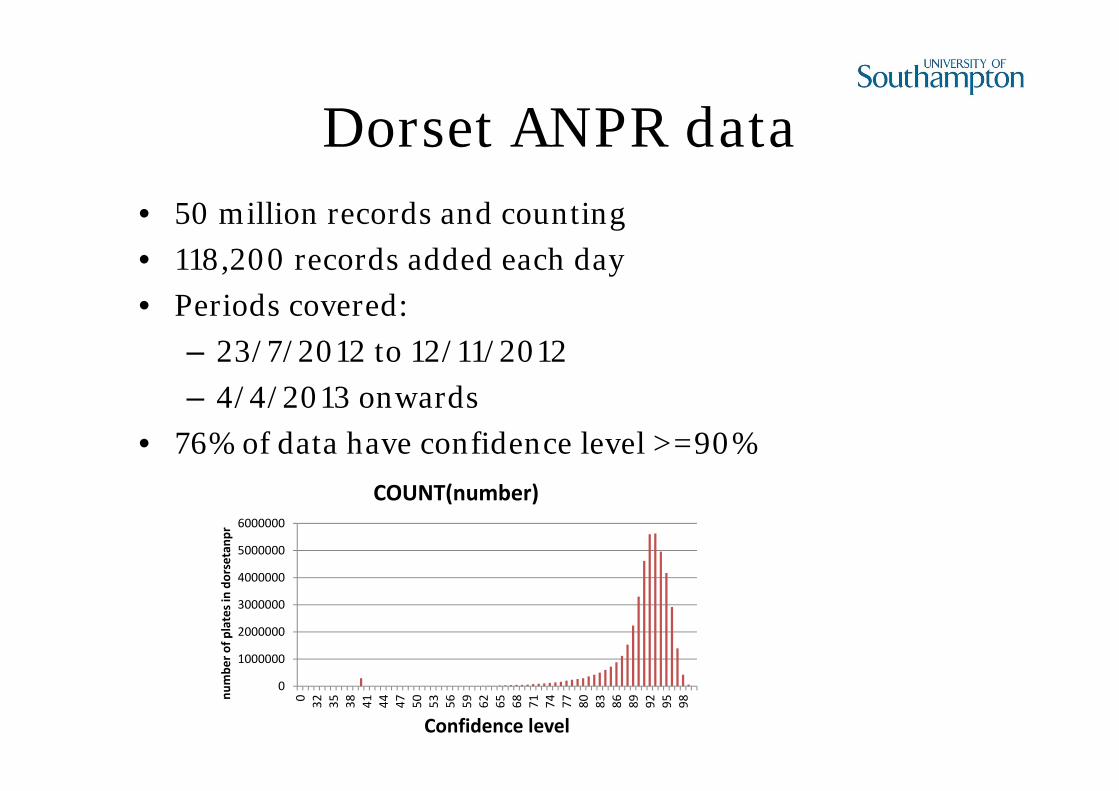
Dorset ANPR data• 50 million records and counting• 118,200 records added each day• Periods covered:
– 23/7/2012 to 12/11/2012– 4/4/2013 onwards
• 76% of data have confidence level >=90%
0
1000000
2000000
3000000
4000000
5000000
6000000
0 32 35 38 41 44 47 50 53 56 59 62 65 68 71 74 77 80 83 86 89 92 95 98
numbe
r of p
lates in do
rsetan
pr
Confidence level
COUNT(number)
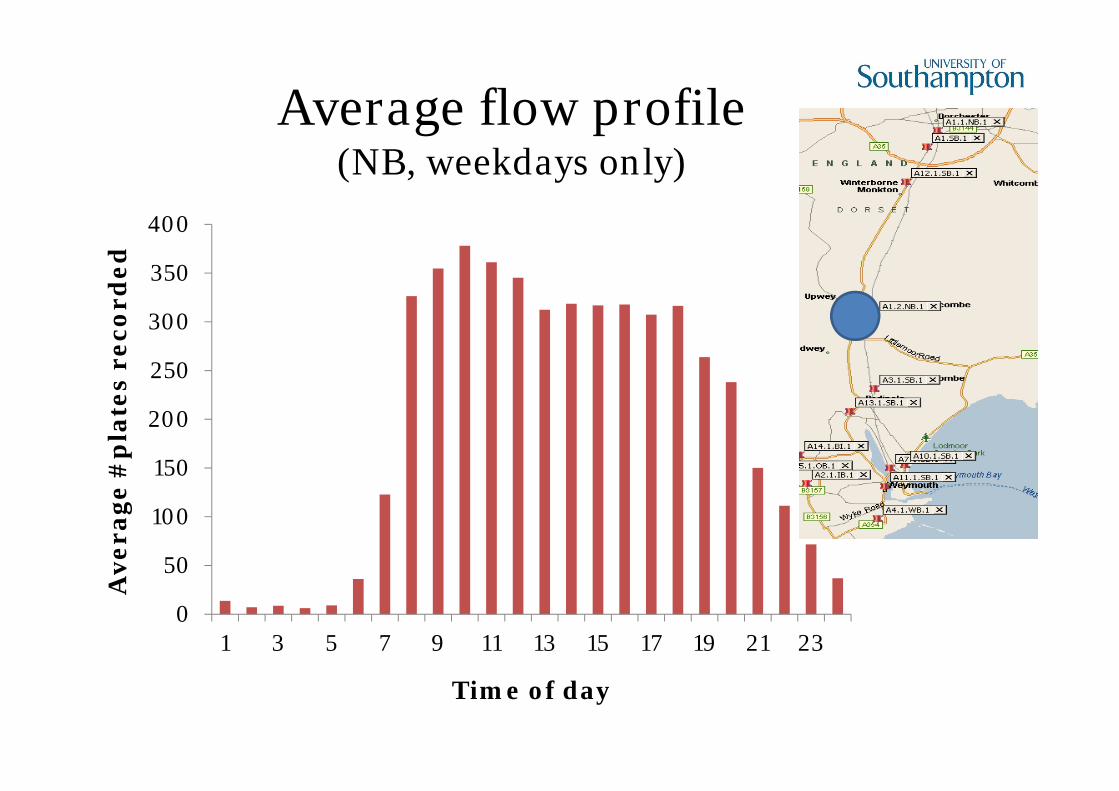
Average flow profile(NB, weekdays only)
0
50
100
150
200
250
300
350
400
1 3 5 7 9 11 13 15 17 19 21 23
Ave
rage
#p
late
s re
cord
ed
Time of day

Unique readings - One-off visitors?
0%
5%
10%
15%
20%
25%
A1.
1.N
B.1
A1.
2.N
B.1
A1.
SB.1
A10
.1.N
B.1
A10
.1.S
B.1
A11
.1.N
B.1
A11
.1.S
B.1
A12
.1.N
B.1
A12
.1.S
B.1
A13
.1.N
B.1
A13
.1.S
B.1
A14
.1.B
I.1
A15
.1.I
B.1
A15
.1.O
B.1
A16
.1.I
B.1
A16
.1.O
B.1
A3.
1.N
B.1
A3.
1.SB
.1A
4.1.
EB
.1A
4.1.
WB
.1A
7.1.
NB
.1A
7.1.
SB.1

Regular vehicles
Example regular vehicle at A1.2.NB.1 (standard deviation = 85s)
07:30
07:20

How many vehicles are regular?
Total of regular vehicles across 22 sites (0630-0930)
Minimum number (percentage) days observed (out of 227 days)
max (mins)
30(13.2%)
50(21.9%)
70(30.8%)
90(39.6%)
110(48.5%)
5 2386 1346 861 567 3577 4666 2740 1764 1137 72910 8662 5299 3484 2317 151612 11590 7202 4788 3188 207915 16246 10267 6831 4538 2919
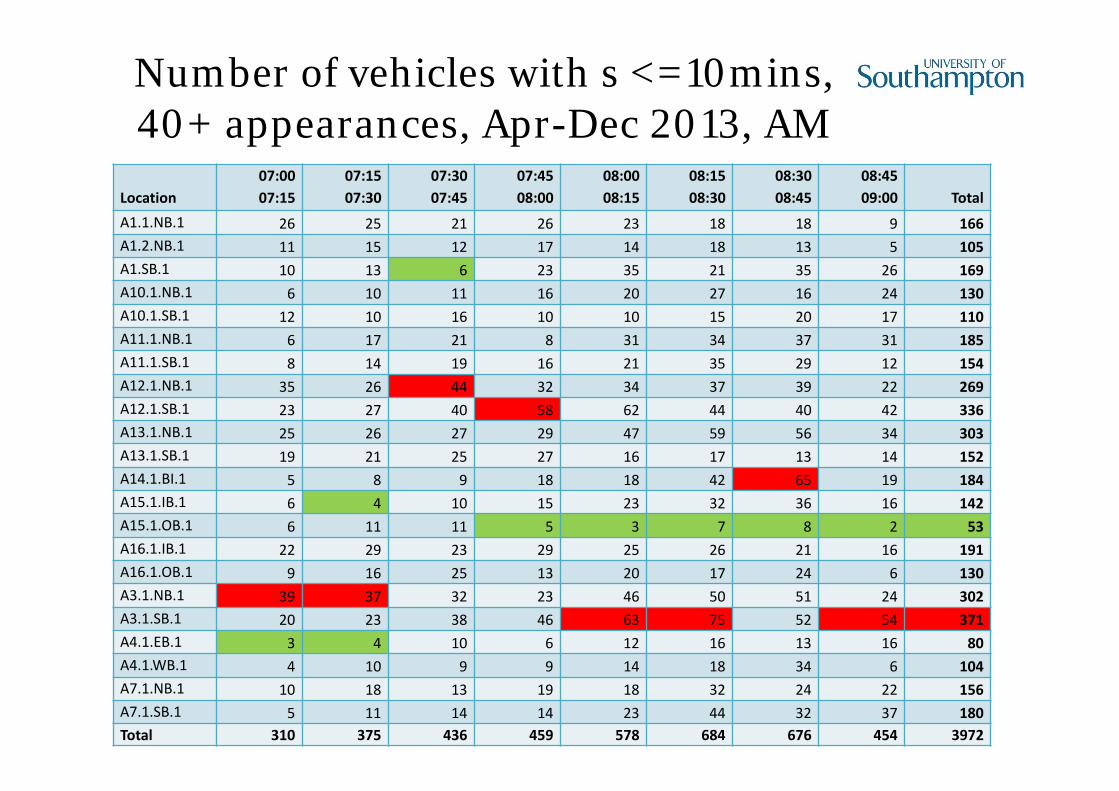
Number of vehicles with s <=10mins, 40+ appearances, Apr-Dec 2013, AM
Location07:0007:15
07:1507:30
07:3007:45
07:4508:00
08:0008:15
08:1508:30
08:3008:45
08:4509:00 Total
A1.1.NB.1 26 25 21 26 23 18 18 9 166A1.2.NB.1 11 15 12 17 14 18 13 5 105A1.SB.1 10 13 6 23 35 21 35 26 169A10.1.NB.1 6 10 11 16 20 27 16 24 130A10.1.SB.1 12 10 16 10 10 15 20 17 110A11.1.NB.1 6 17 21 8 31 34 37 31 185A11.1.SB.1 8 14 19 16 21 35 29 12 154A12.1.NB.1 35 26 44 32 34 37 39 22 269A12.1.SB.1 23 27 40 58 62 44 40 42 336A13.1.NB.1 25 26 27 29 47 59 56 34 303A13.1.SB.1 19 21 25 27 16 17 13 14 152A14.1.BI.1 5 8 9 18 18 42 65 19 184A15.1.IB.1 6 4 10 15 23 32 36 16 142A15.1.OB.1 6 11 11 5 3 7 8 2 53A16.1.IB.1 22 29 23 29 25 26 21 16 191A16.1.OB.1 9 16 25 13 20 17 24 6 130A3.1.NB.1 39 37 32 23 46 50 51 24 302A3.1.SB.1 20 23 38 46 63 75 52 54 371A4.1.EB.1 3 4 10 6 12 16 13 16 80A4.1.WB.1 4 10 9 9 14 18 34 6 104A7.1.NB.1 10 18 13 19 18 32 24 22 156A7.1.SB.1 5 11 14 14 23 44 32 37 180Total 310 375 436 459 578 684 676 454 3972
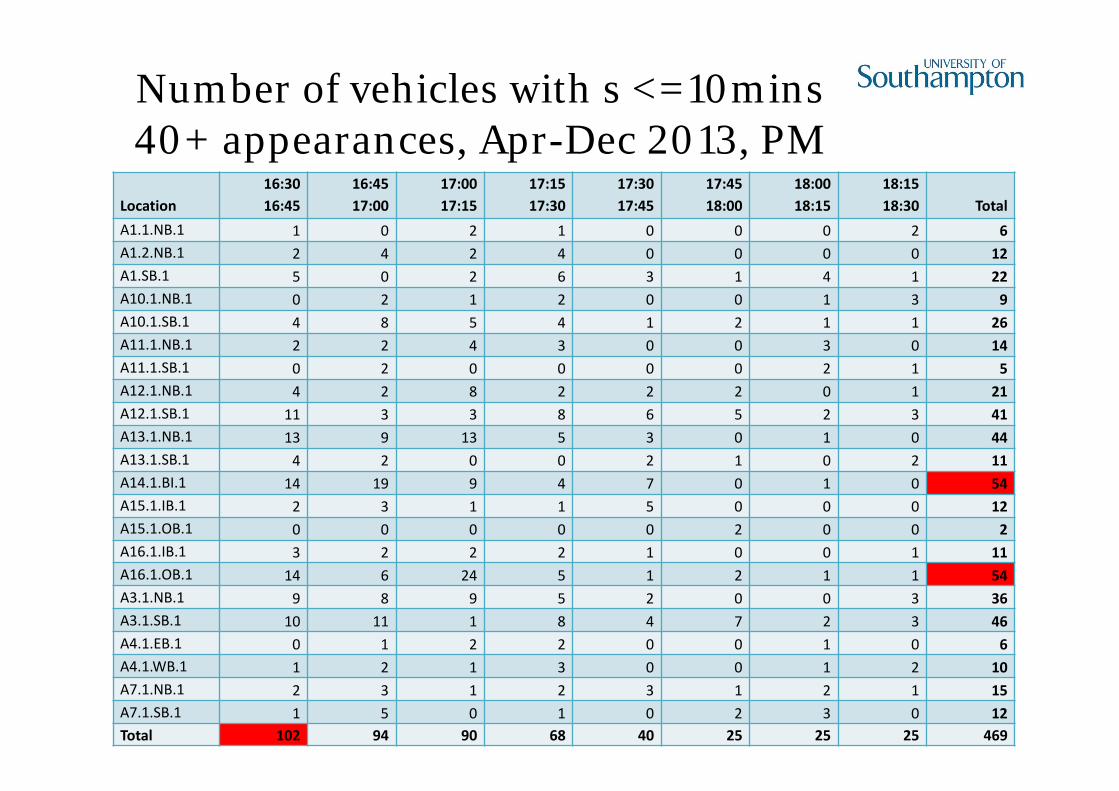
Number of vehicles with s <=10mins 40+ appearances, Apr-Dec 2013, PM
Location16:3016:45
16:4517:00
17:0017:15
17:1517:30
17:3017:45
17:4518:00
18:0018:15
18:1518:30 Total
A1.1.NB.1 1 0 2 1 0 0 0 2 6A1.2.NB.1 2 4 2 4 0 0 0 0 12A1.SB.1 5 0 2 6 3 1 4 1 22A10.1.NB.1 0 2 1 2 0 0 1 3 9A10.1.SB.1 4 8 5 4 1 2 1 1 26A11.1.NB.1 2 2 4 3 0 0 3 0 14A11.1.SB.1 0 2 0 0 0 0 2 1 5A12.1.NB.1 4 2 8 2 2 2 0 1 21A12.1.SB.1 11 3 3 8 6 5 2 3 41A13.1.NB.1 13 9 13 5 3 0 1 0 44A13.1.SB.1 4 2 0 0 2 1 0 2 11A14.1.BI.1 14 19 9 4 7 0 1 0 54A15.1.IB.1 2 3 1 1 5 0 0 0 12A15.1.OB.1 0 0 0 0 0 2 0 0 2A16.1.IB.1 3 2 2 2 1 0 0 1 11A16.1.OB.1 14 6 24 5 1 2 1 1 54A3.1.NB.1 9 8 9 5 2 0 0 3 36A3.1.SB.1 10 11 1 8 4 7 2 3 46A4.1.EB.1 0 1 2 2 0 0 1 0 6A4.1.WB.1 1 2 1 3 0 0 1 2 10A7.1.NB.1 2 3 1 2 3 1 2 1 15A7.1.SB.1 1 5 0 1 0 2 3 0 12Total 102 94 90 68 40 25 25 25 469
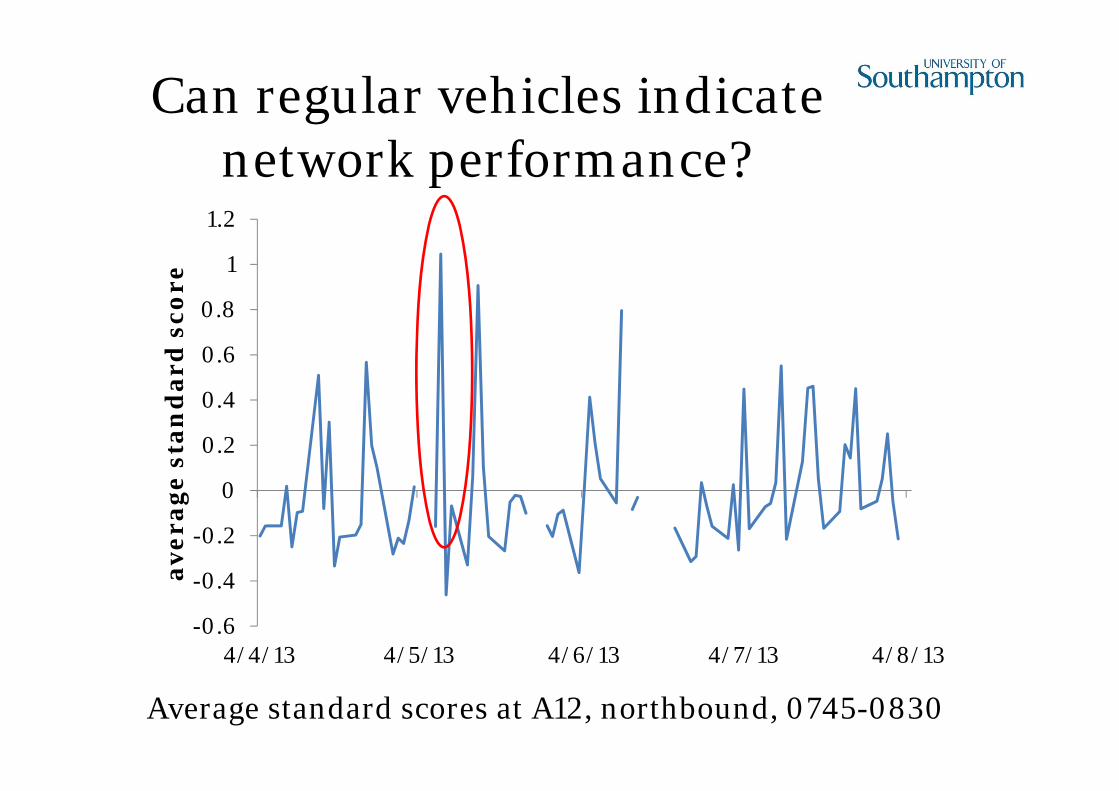
Can regular vehicles indicate network performance?
-0.6
-0.4
-0.2
0
0.2
0.4
0.6
0.8
1
1.2
4/4/13 4/5/13 4/6/13 4/7/13 4/8/13
aver
age
stan
dar
d s
core
Average standard scores at A12, northbound, 0745-0830

Vehicle lateness (A12, northbound, Wed. 8/5/13, 0745-0830)
The problem of ChurnTurnover (‘Churn’) of regular vehicles occurs due to:- Changes in vehicle ownership- Changes in job status/working conditions- Changes in home life
A traffic management system using the variability in arrival rates of regular vehicles would need a constant update of the ‘regular’ drivers
Churn was investigated by defining regular vehicles (standard deviation of arrival time less than 10 minutes based on more than 30 observations, 0630-0930)
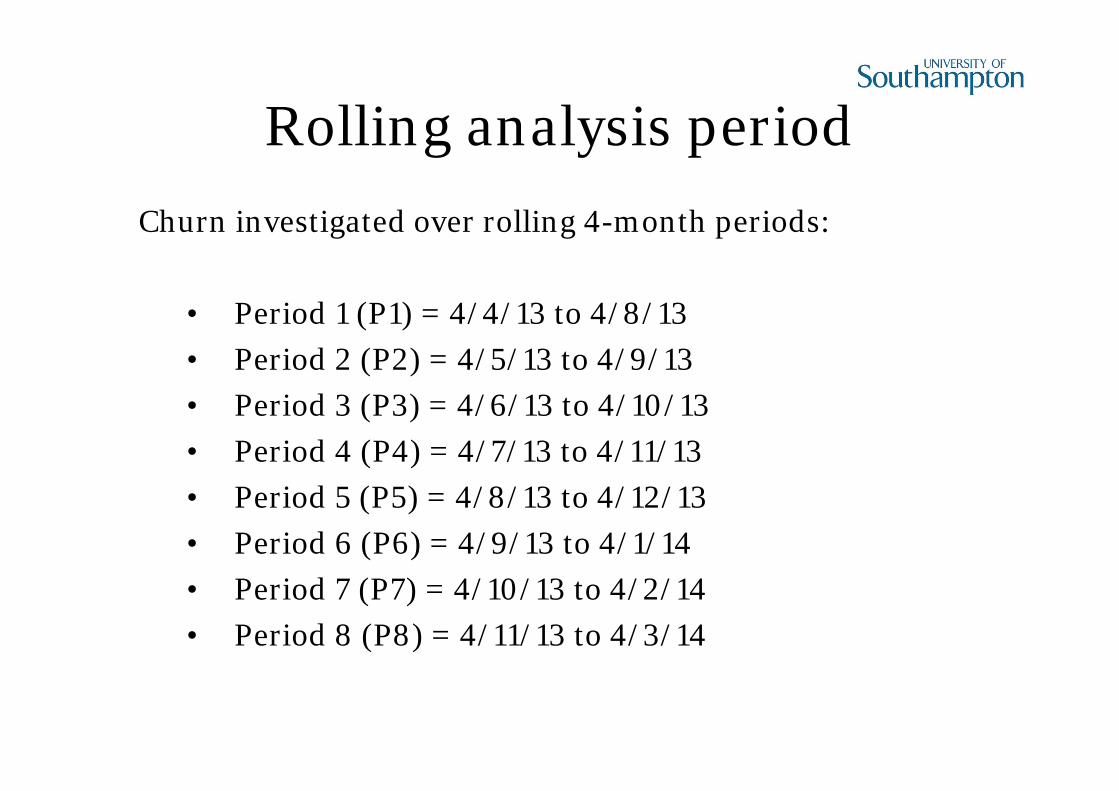
Rolling analysis periodChurn investigated over rolling 4-month periods:
• Period 1 (P1) = 4/4/13 to 4/8/13• Period 2 (P2) = 4/5/13 to 4/9/13• Period 3 (P3) = 4/6/13 to 4/10/13• Period 4 (P4) = 4/7/13 to 4/11/13• Period 5 (P5) = 4/8/13 to 4/12/13• Period 6 (P6) = 4/9/13 to 4/1/14• Period 7 (P7) = 4/10/13 to 4/2/14• Period 8 (P8) = 4/11/13 to 4/3/14
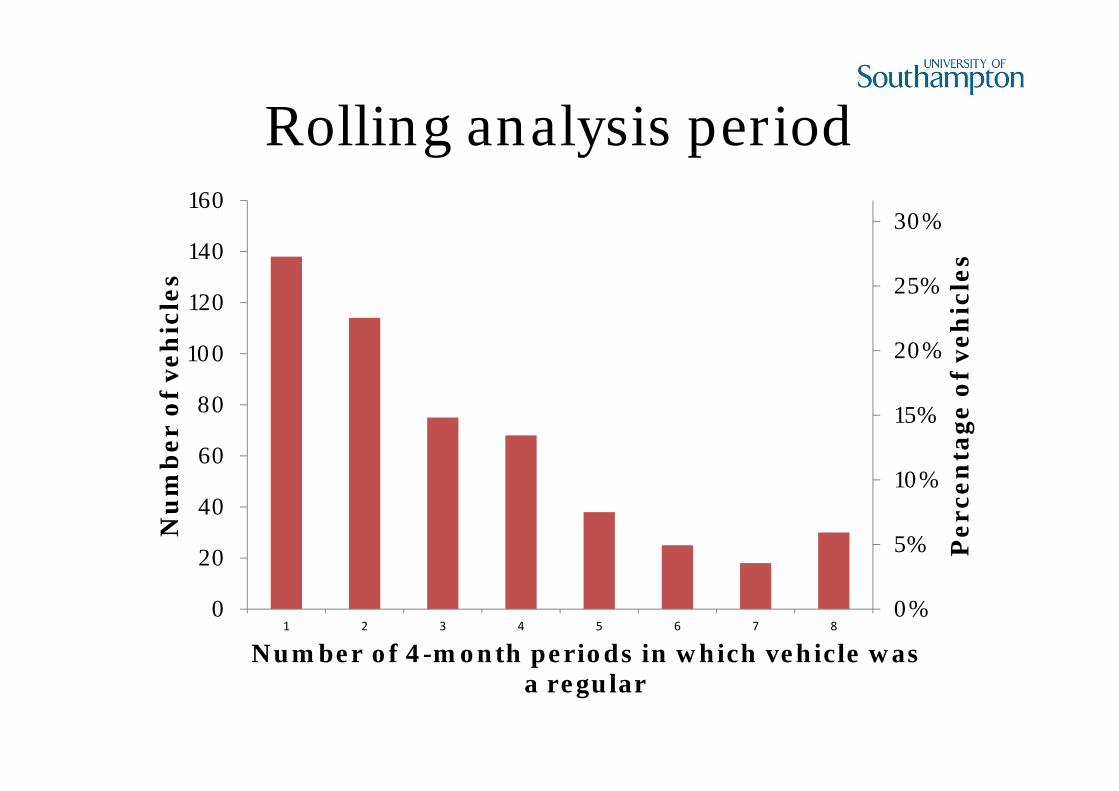
Rolling analysis period
0%
5%
10%
15%
20%
25%
30%
0
20
40
60
80
100
120
140
160
1 2 3 4 5 6 7 8
Per
cen
tage
of
veh
icle
s
Nu
mbe
r of
veh
icle
s
Number of 4-month periods in which vehicle was a regular
Implications for network management
- An additional method of monitoring issues on the network
- Churn has implications for the supply of ‘regular’ vehicles- How regular do vehicles need to be to identify potential
issues?- Results suggest major roads during the morning
commute could be monitored in this way- Interesting scope for live monitoring of different vehicle
types and CO2 footprints.