understanding trends and drivers of malnutrition at subnational level: a crosscountry analysis in 15...
TRANSCRIPT

Trends and drivers of malnutrition at subnational level
A cross-country analysis in 15 Sub-Saharan African countries
Brussels, 14 June 2016
Francois KAYITAKIRE, Ana PEREZ HOYOS, Estefania CUSTODIO, Tharcisse NKUNZIMANAEC-JRC, IES, MARS Unit
Going the Last Mile: Accelerating Progress in Food Security and Nutrition
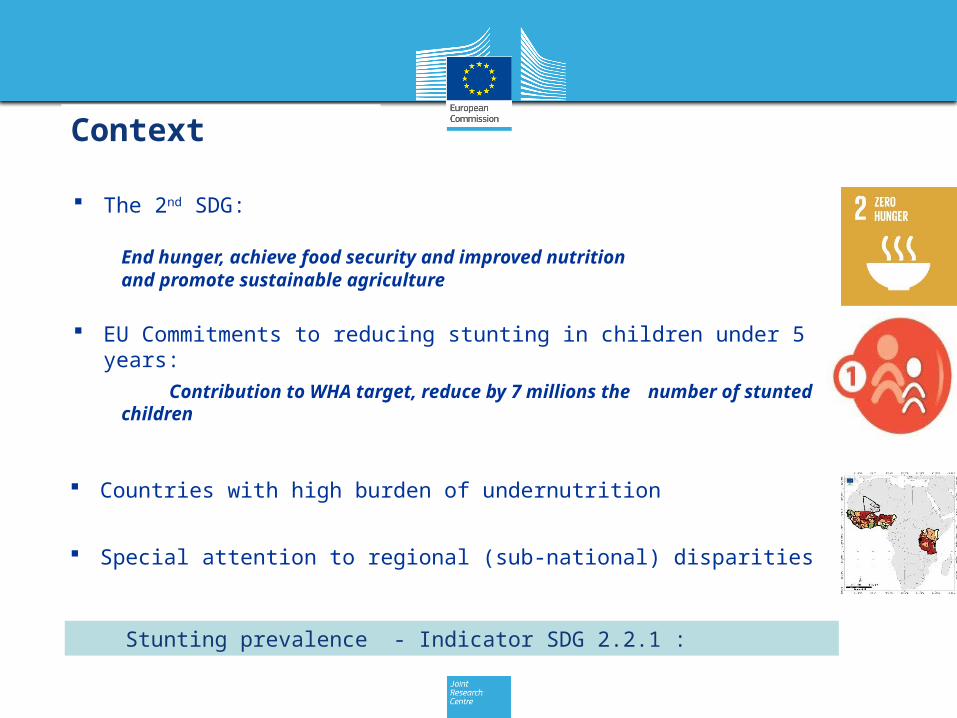
Context
The 2nd SDG:
End hunger, achieve food security and improved nutritionand promote sustainable agriculture
EU Commitments to reducing stunting in children under 5 years:Contribution to WHA target, reduce by 7 millions the
number of stunted children
Countries with high burden of undernutrition
Special attention to regional (sub-national) disparities
Stunting prevalence - Indicator SDG 2.2.1 :

Stunting prevalence in East and West Africain the 2000’s
“According to statistics, if a man has his head in an oven and his feet in a deep-freeze, he feels pretty good on average.”
DHS data; 15 countries; 338 000 households

Stunting prevalence in East and West Africain the 2010’s
“According to statistics, if a man has his head in an oven and his feet in a deep-freeze, he feels pretty good on average.”

5
Changes in stunting prevalence in East and West Africa (2000 - 2010)
Changes in stunting percentage points
Few areas with stunting reductions > 10 % points

Spatial distribution of the main stunting drivers
Poverty

Mother’s educationPercentage of mothers with no education
Spatial distribution of the main stunting drivers

Food consumption
Percentage of children meeting the minimum dietary diversity
Spatial distribution of the main stunting drivers
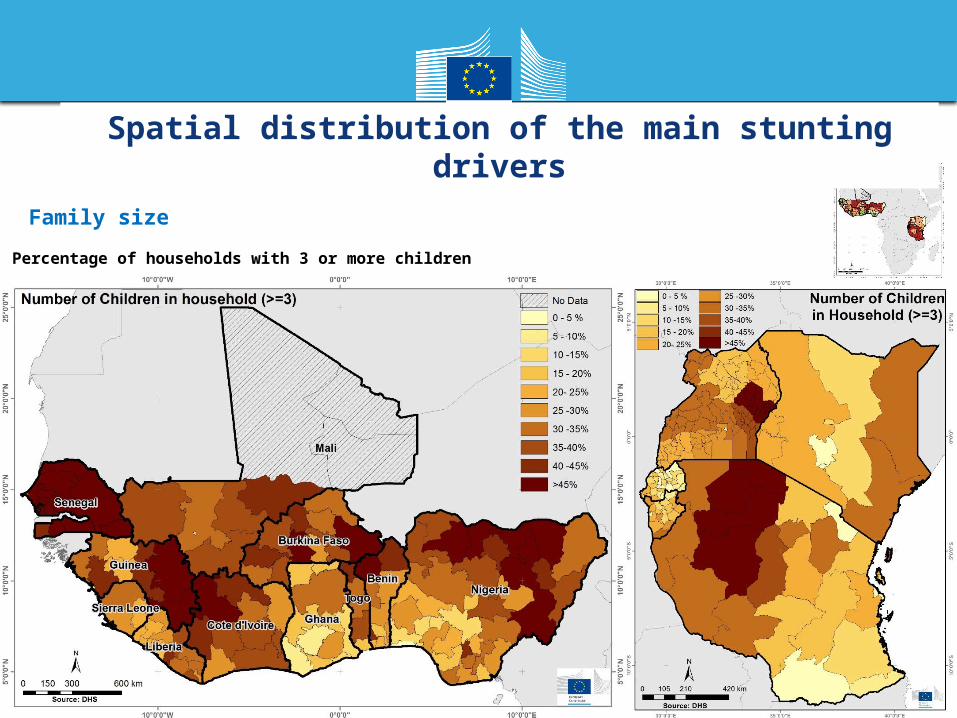
Percentage of households with 3 or more children
Family size
Spatial distribution of the main stunting drivers

If none is left behind, how long is the last mile?
2025
2030
0 – 1 1 - 20 20 - 50 > 50 years
Number of years to fall below a stunting prevalence of 20% fromthe 2010’s level if the same reduction rate is maintained

Thank you
for your
attention

Geography of the stunting drivers