understanding wbf march 2011
TRANSCRIPT

Understanding the concept of water
balance calculation
BY
ALMAZ DEMESSIE
SENIOR AGROMETEOROLOGICAL EXPERTM.Sc. In Tropical Agricultural Development (UK)
Government of Ethiopia and World Food Programme (WFP)
LEAP Training Material October 16 - 18, 2010

Understanding the concept of
water balance calculation
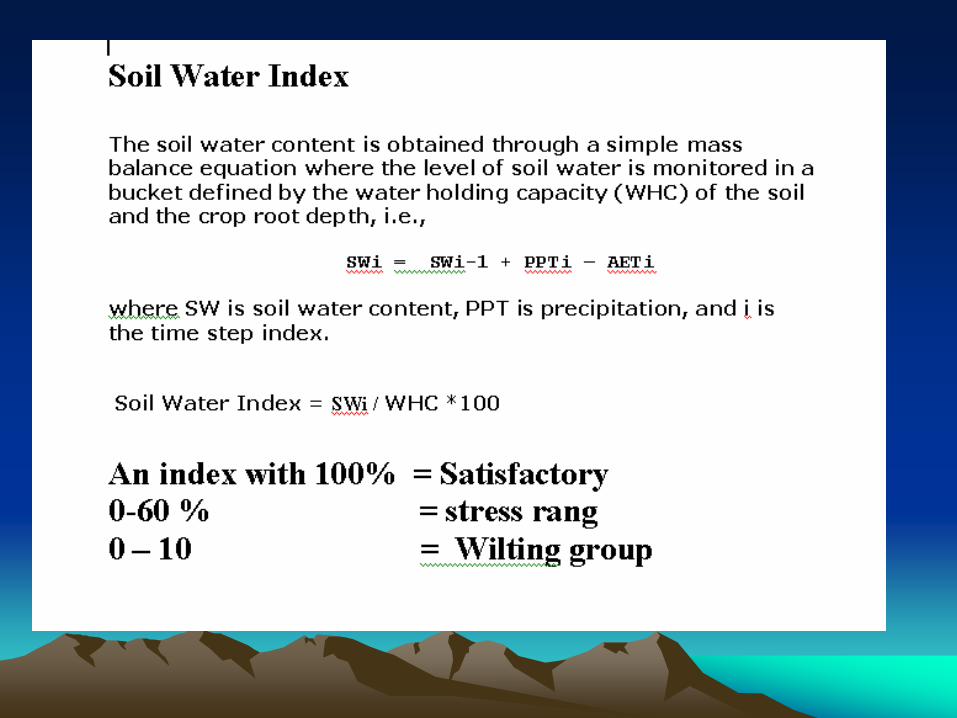
Basically, the water balance is the difference between the effective amounts of rainfall received by the crop and theamounts of water lost by the crop and the soil due to the evaporation, transpiration and to deep infiltration. The amounts ofwater, held by the soil and available to the crop, are also taken into account.The objective of the water balance model is to convert raw observations of the atmospheric environment into a set ofparameters which are of direct importance for crop production.

Evaporation and water-balance measurements
• Measurement of evaporation from free water surfaces and from the soil and of transpiration from vegetation is of great importance in agricultural meateorology. Potentialevapotranspiration is defined as the amount of water which evaporates from the soil-air interface and from plants, when the soil is at field capacity.Actual evapotranspiration is defined as the evaporation at the soil-air interface, plus the transpiration of plants, in the existing conditions of soil moisture.

Evaporation and water-balance
measurements contd….
• PET/AET can be measured with evaporimeters
or lysimeters directly.
• It can be also calculated by using different
empirical models like CropWat; statistical
models like Instat

• The calculation of reference evapotranspiration (ETo), i.e., the rate of evapotranspiration from a hypothetic reference crop with an assumed crop height of 12 cm, a fixed canopy resistance of 70ms-1 and an albedo of 0.23 (closely resembling the evapotranspiration from an extensive surface of green grass), is done according to the Penman-Monteith equation (Monteith, 1965, 1981; FAO, 1992b).

The calculation procedure uses a
standardized set of input parameters, as
follows:
• Tmax... maximum daily temperature (ºC)
• Tmin... minimum daily temperature (ºC)
• RH ... mean daily relative humidity (%)
• U2... wind speed measurement (ms-1)
• SD... bright sunshine hours per day (hours)
• A... elevation (m)
• L... latitude (deg)

Crop coefficients
• The relation between actual and reference
Evapotranspiration and actual evaporation in the
field is based on crop coefficients. ETa is
determined by the crop coefficient approach
whereby the effect of the various weather
conditions areincorporated into ET0 and the
crop characteristics into the Kc coefficient:
• ETa = Kc * ETo
• Exercise1. Examine

• The effect of both crop transpiration and soil
evaporation are integrated into a single crop
coefficient. In other words, the Kc coefficient
incorporates crop characteristics and averaged
effects of evaporation from the soil.
Crop coefficients (Kc) are dependent on:
• · Crop
• · Phenological stage of the crop (planting,
vegetative phase, yield formation, ripening etc...)
• · Soils, climate etc. Crop coefficients are known to
be slightly different for different Parts of the
world.

Exercise1. Examine the Crop
coefficients for maize


Calculating the Actual Water Balance

• The computation is done dekad-by-dekad
(DEK) and it starts before the planting to
take into account previous rainfall amounts
stored into the soil. From the planting
dekad, the crop water requirements
(WR) are calculated as the potential
Evapotranspiration (PET) times the crop
coefficient (KCR) values.
WR = ET * KCR

• IF actual rainfall data (ACT) are available
these are used, otherwise the calculation
uses normal rainfall data(NOR). The
rainfall used in the calculations is called
the working rainfall (WRK). So for a
dekad the following isvalid:
• If ACT is missing
....................................................................
...............then WRK = NOR
• If ACT is not missing then WRK = ACT


Agroclimatic classification
The most widely adopted climatic
classification:
The Koppen system and Thorthwait
system
• Koppen attempt to fit climatic data to
observed vegetation limits
• Thornwaite constructed climatic
classification from regular intervals of
his derived moisture indices.

Agroclimatic classification contd….
• He introduced a bookkeeping scheme of moisture gain and moisture losses, also called the water balance. As long as the moisture storage is above field capacity, the water surplus (S) is the difference between precipitation and reference potentional evapotranspiration, but when the soil storage falls below field capacity, the deficit (D) is the difference between potential and actual evapotranspiration. His moisture index is as follows.
Im = 100(S/PET- D/PET)


AgroMetShell
Station number:
Crop type Maize:
Cycle length Total water requirements: 12 dekads
Total Water requirement: 561mm
Planting deked: 34
Maximum soil water storage 100mm
Effective/Total rain: 100%
Irrigation applied: No
Pre-season Kcr: .19

WRSI
The spatially explicit water requirement satisfaction index (WRSI*) is an indicator of crop performance based on the availability of water to the crop during a growing season. FAO studies have shown that WRSI can be related to crop production using a linear yield-reduction function specific to a crop (FAO, 1977; FAO, 1979; FAO, 1986). More recently, Verdin and Klaver (2002) and Senay and Verdin (2001) demonstrated a regional implementation of WRSI in a grid cell based modeling environment.

WRSI


No WRSI (%) Drought Severity
class
1 80-100 No drought
2 70-79 Slight drought
3 60-69 Moderate drought
4 50-59 Severe drought
5 <50 Complete crop failure

• LGP is describing the period during which crop growth is not affected by climatic constraints, i.e. the period of the year when water availability allows crop growth and when the temperature is not limiting crop growth. As many studies have indicated, the duration of the period in which rainfall exceeds selected levels of evapotranspiration is the most useful index of agricultural potential. This period refers to the length of time during which water and temperature permit crop growth. As FAO (1991) stated, three specific values are identified for climatic classification, namely: arid, with LGP of less than 75 days; Seasonally dry, with LGP of between 75 and 270 days; and humid with LGP of more than 270 days. Annual or seasonal rainfall is traditionally used to describe the supply of water to crops, because it is the primary measurement particularly for rain fed agriculture.

Agroclimatic classification contd….
• LGP is expressing the period during which crop growth is not affected by climatic constraints or it characterizes the period of the year when water availability allows crop growth and when the temperature is not limiting crop growth. The method to calculate LGP is FAO methodology by Frere and Popov (1979). “The growing period (GP) is defined as the time (days) during a year when precipitation exceeds half the potential evapotranspiration (PET) plus the time (days) necessary to evapotranspire 100mm of water (or less if 100 mm is not available) from excess precipitation stored in the soil profile.

Additional obsservations for the
better understanding of soil
moisture
Field capacity• Field capacity is the maximum amount of water
which can be held in the soil after all gravitational
water has seeped out, evaporation from the soil
surface has been prevented, and there is no
direct contact between the soil moisture and the
ground water table.

• Soil moisture contd…
There are several methods of determining or of
estimation field capacity. The direct method
consists of selecting a small representative site in
the field, watering it to full capacity, waiting for the
gravitational water to seep down, and then
determining the moisture of the soil. The value
obtained will be the values of the field capacity for
that soil.

• Soil moisture contd…

• Soil moisture contd…
Wilting Point
• Wilting point is the amount of soil moisture at which permanent wilting of a plant occurs. Vegetation consumes soil moisture, and if it is not replenished by water from precipitation or irrigation, a time will come when the plants will start to wilt, despite the fact that there is still some moisture in the soil.

• Soil moisture contd…
• The moment of permanent wilting occurs when the soil water is attracted to the solid soil particles by forces which are greater than the forces by which the plant’s roots can extract it.
• Permanent wilting should not be confused with temporary wilting which often occurs in the early afternoon hours of hot, dry days. Permanent wilting means that the plants cannot regain their turgidity even if kept in a place with saturated air
Exercise 28 - 42

Crop yield forecasting with water balance calculations principles
Relation between crop water use and yield
• Doorenbos and Kassam outlined in their FAO publication “Yield response to water” that there is a clear relation between crop yield and water use. This relation is the basis of the use of a water balance calculation in crop forecasting. It is possible to establish a maximum yield (Ym) based on a season without water stress and water deficit. The total Evapotranspiration is then at his maximum (ETm). In semi-arid circumstances yield is usually reduced due to water stress leading to a lower actual yield (Ya) and lower actual Evapotranspiration(ETa) Yield Reduction is the percentage reduction compared to a yield obtained without water stress. It is therefore not measured against maximum yield!

Yield response to water
• The authors introduced the so-called yield response factor (ky) to explain the yield reduction due to water stress.
• They established the yield response factor for a large number of crops in a limited number of climates. Doorenbos and Kassam found this relation to be near-linear for most crops (see graph). The general formula is:
• (1- Ya/Ym) = ky * (1 - ETa/ETm)

The graph below establishes the relationship for
a number of crops
Horizontal axis: Yield from 0 (no water stress; high yield) to 1 (100% water deficit; no
yield)
Vertical axis: Evapotranspiration deficit from 0 (no deficit) to 100 (100% deficit)

In LEAP the Yield Reduction can be
calculated from Total Actual
Evapotranspiration (ETa) and Total Water
Requirement (TWR same value as ETm),
with the formula:-
100 – ((1- (1 – ETa/TWR) *Ky)* 100)

THANK YOU