understanding wildfire hazards in the eastern edwards plateau
TRANSCRIPT

The Thesis committee for Holly Muree Bonine
Certifies that this is the approved version of the following thesis:
Understanding Wildfire Hazards in the
Eastern Edwards Plateau
APPROVED BY
SUPERVISING COMMITTEE:
Supervisor: __________________________________________
Sarah Dooling
__________________________________________
Mark Simmons

Understanding Wildfire Hazards in the
Eastern Edwards Plateau
by
Holly Muree Bonine, B.S.
Thesis
Presented to the Faculty of the Graduate School
of the University of Texas at Austin
in Partial Fulfillment
of the Requirements
for the Degree of
Master of Science in Community and Regional Planning
The University of Texas at Austin
August 2013

iii
Understanding Wildfire Hazards in the
Eastern Edwards Plateau
by
Holly Muree Bonine, MSCRP
The University of Texas at Austin, 2013
Supervisor: Sarah Dooling
ABSTRACT
Trends indicate that wildfires have become larger and more intense over
the past few decades. Experts suggest this is due to multiple factors including
long-term shifts in land use that disrupt the balance of fuels and fire regimes.
Research predicts that climate change will exacerbate this trend but will do so in
spatially variable ways across the globe, causing increases in fire activity for

iv
some regions and decreases for others. In the United States, increased wildfire
activity combined with the rapid expansion of residential development in fire-
prone land necessitate billions of dollars in suppression efforts every year to
protect human lives and property. The confluence of these issues has catalyzed
momentum for communities to actively participate in mitigation at the local
level. Yet, the precursor to developing effective solutions is to understand the
unique environmental and social components of wildfire hazards at local and
regional scales and how these components influence the deleterious impact of
fire.
This thesis takes a case study approach to understanding and
communicating wildfire hazard potential in the Edwards Plateau ecoregion of
central Texas. Wildfire simulations were conducted at the regional scale to
quantify the magnitude of predicted fire behaviors under various spatial and
temporal conditions. Simulations were also conducted within two focal
communities to illuminate how patterns of wildfire susceptibility overlap with
residential development. Finally, an investigation was made into the emergency
response infrastructure and mitigation strategies adopted by each of the focal
communities.

v
As a result of simulations under drought conditions, forty-four percent of
the study area exhibited flame lengths over eleven feet and ninety-six percent of
the tree canopy exhibited crown fire activity. Simulations also revealed an
increased potential for crown fire activity and extreme flame lengths along the
heavily-populated Balcones Escarpment. Third, physical forms of communities
appeared to influence the spatial distribution of burn susceptibility. Finally, the
infrastructure and practices of the surrounding region impacted community
resilience to wildfire hazards. While these findings are specific to the eastern
Edwards Plateau, they showcase how mixed methods can be used to build a
comprehensive wildfire hazard assessment for a community.

vi
TABLE OF CONTENTS
ABSTRACT………………………………………………………………………. iii
TABLE OF CONTENTS…………………………………………………………. vi
LIST OF TABLES…………………………………………………………………. ix
LIST OF FIGURES………………………………………………………………... xi
LIST OF ACRONYMS…………………………………………………………… xiv
GLOSSARY OF TERMS……………………………………….………………… xv
CHAPTER 1 INTRODUCTION……..…………………………………………. 1
1.1 Statement of the Problem……………………………………….. 1
1.2 Research Objectives……………………………………………… 8
1.3 Roadmap to Following the Chapters….………………………. 9
CHAPTER 2 BACKGROUND………………………………………………….. 13
2.1 Introduction to Chapter 2……………………………………….. 13
2.2 A Framework for Hazards in Socio-Ecological Systems……... 14
vii
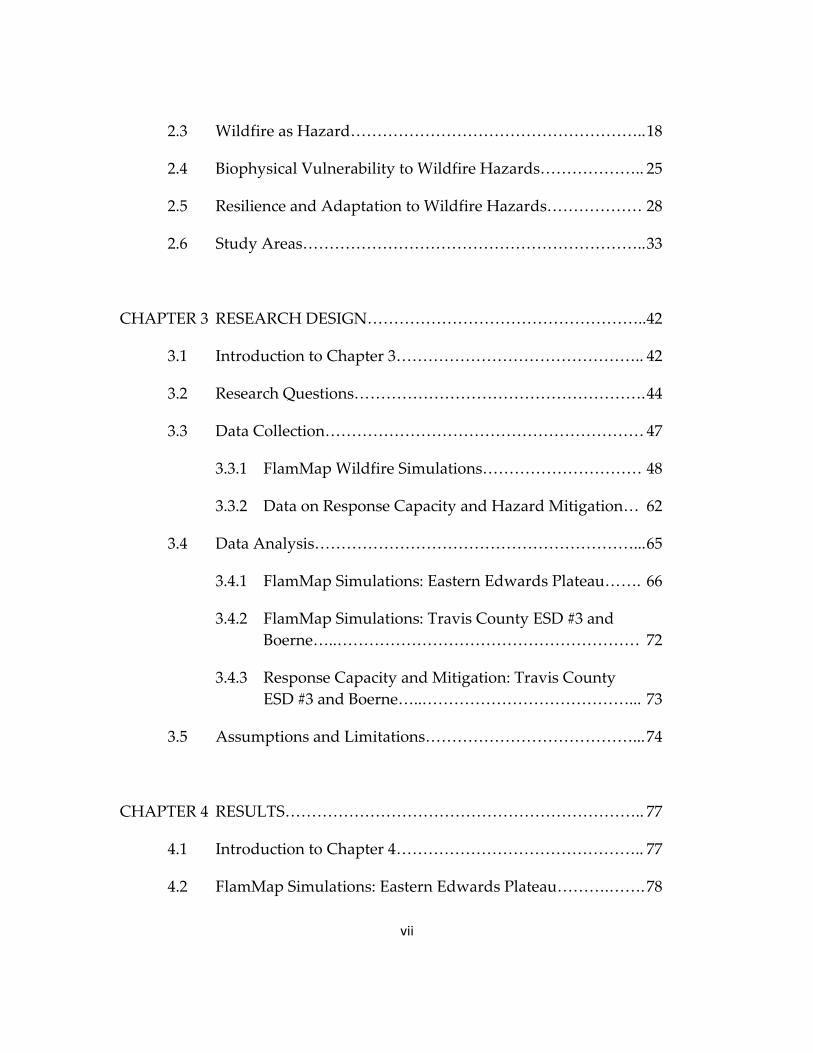
2.3 Wildfire as Hazard……………………………………………….. 18
2.4 Biophysical Vulnerability to Wildfire Hazards……………….. 25
2.5 Resilience and Adaptation to Wildfire Hazards……………… 28
2.6 Study Areas……………………………………………………….. 33
CHAPTER 3 RESEARCH DESIGN…………………………………………….. 42
3.1 Introduction to Chapter 3……………………………………….. 42
3.2 Research Questions………………………………………………. 44
3.3 Data Collection…………………………………………………… 47
3.3.1 FlamMap Wildfire Simulations………………………… 48
3.3.2 Data on Response Capacity and Hazard Mitigation… 62
3.4 Data Analysis……………………………………………………... 65
3.4.1 FlamMap Simulations: Eastern Edwards Plateau……. 66
3.4.2 FlamMap Simulations: Travis County ESD #3 and
Boerne…..………………………………………………… 72
3.4.3 Response Capacity and Mitigation: Travis County
ESD #3 and Boerne…..…………………………………... 73
3.5 Assumptions and Limitations…………………………………... 74
CHAPTER 4 RESULTS………………………………………………………….. 77
4.1 Introduction to Chapter 4……………………………………….. 77
4.2 FlamMap Simulations: Eastern Edwards Plateau……….……. 78

viii
4.2.1 Range of Fire Behaviors Predicted……………………... 78
4.2.2 Effect of Weather and Climate on Fire Behavior……… 91
4.2.3 Effect of Vegetation and Topography on Fire
Behavior…………………………………………………… 96
4.3 FlamMap Simulations: Travis County ESD #3 and
Boerne…...………………………………………………………… 109
4.3.1 Burn Susceptibility……………………………………….. 109
4.3.2 Fire Behavior……………………………………………… 113
4.4 Response Capacity and Mitigation: Travis County
ESD #3 and Boerne…...…………………………………………... 116
4.4.1 Emergency Response Capacity…………………………. 116
4.4.2 Plans and Programs to Mitigate Wildfire Hazards…… 122
CHAPTER 5 DISCUSSION ……………………….…………………………… 125
5.1 Introduction to Chapter 5……………………………………….. 125
5.2 Wildfire Hazards in the Eastern Edwards Plateau………….... 126
5.3 Wildfire Hazards in Travis County ESD #3 and Boerne…...… 127
5.4 Resilience and Adaptation in Travis County ESD #3 and
Boerne…...………………………………………………………… 130
5.5 Conclusion………………………………………………………... 131
WORKS CITED……………………………………………………………………134
ix
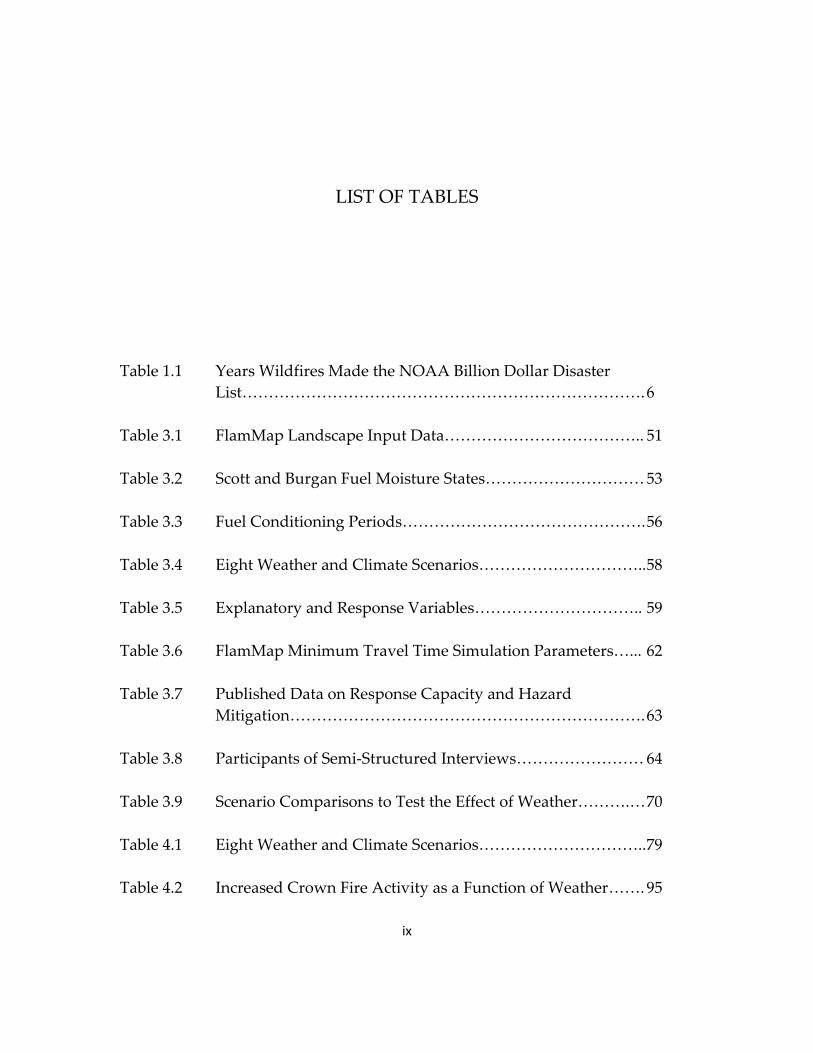
LIST OF TABLES
Table 1.1 Years Wildfires Made the NOAA Billion Dollar Disaster
List…………………………………………………………………. 6
Table 3.1 FlamMap Landscape Input Data……………………………….. 51
Table 3.2 Scott and Burgan Fuel Moisture States………………………… 53
Table 3.3 Fuel Conditioning Periods………………………………………. 56
Table 3.4 Eight Weather and Climate Scenarios………………………….. 58
Table 3.5 Explanatory and Response Variables………………………….. 59
Table 3.6 FlamMap Minimum Travel Time Simulation Parameters…... 62
Table 3.7 Published Data on Response Capacity and Hazard
Mitigation…………………………………………………………. 63
Table 3.8 Participants of Semi-Structured Interviews…………………… 64
Table 3.9 Scenario Comparisons to Test the Effect of Weather……….… 70
Table 4.1 Eight Weather and Climate Scenarios………………………….. 79
Table 4.2 Increased Crown Fire Activity as a Function of Weather……. 95

x
Table 4.3 Fuel Models Present in the Eastern Edwards Plateau……….. 97
Table 4.4 ANCOVA Results: Flame Length………………………………. 99
Table 4.5 ANCOVA Results: Rate of Spread……………………………... 103
Table 4.6 ANCOVA Results: Crown Fire Activity………………………. 106
Table 4.7 Percentage of Study Area Susceptible to Burning……………. 110
Table 4.8 Emergency Response Capacity Indicators…………………….. 116

xi
LIST OF FIGURES
Figure 1.1 Wildfire Acres Burned per Year……………………………….. 3
Figure 1.2 Federal Dollars Spent in Fire Suppression…………………….. 3
Figure 1.3 USDA Forest Service Map of Structures Lost during
Wildfires between 1999 and 2011………………………………. 7
Figure 2.1 USDA Forest Service Fire Regime Map……………………....... 21
Figure 2.2 USDA Forest Service Wildland Urban Interface Map………... 27
Figure 2.3 Eastern Edwards Plateau Study Region………………………. 35
Figure 2.4 Eastern Edwards Plateau Elevation and Canopy Cover……... 35
Figure 2.5 Eastern Edwards Plateau Wildland Urban Interface…………. 37
Figure 2.6 Travis County ESD #3 and Boerne Study Extents…………….. 41
Figure 4.1 Proportions of Flame Lengths per Scenario………………….... 80
Figure 4.2 Flame Length: Scenarios 1 through 4…………………………... 81
Figure 4.3 Flame Length: Scenarios 5 through 8…………………………... 82
Figure 4.4 Proportions of Rates of Spread per Scenario………………….. 84

xii
Figure 4.5 Rate of Spread: Scenarios 1 through 4………………………….. 85
Figure 4.6 Rate of Spread: Scenarios 5 through 8………………………….. 86
Figure 4.7 Proportions of Crown Fire Activity per Scenario……………... 88
Figure 4.8 Crown Fire Activity: Scenarios 1 through 4…………………… 89
Figure 4.9 Crown Fire Activity: Scenarios 5 through 8…………………… 90
Figure 4.10 Increased Flame Lengths as a Function of Weather………….. 92
Figure 4.11 Increased Rates of Spread as a Function of Weather…………. 94
Figure 4.12 Flame Length as a Function of Fuel Model……………………. 101
Figure 4.13 Flame Length as a Function of Canopy Cover………………... 101
Figure 4.14 Rate of Spread as a Function of Fuel Model……………………104
Figure 4.15 Rate of Spread as a Function of Canopy Cover……………….. 104
Figure 4.16 Crown Fire Activity as a Function of Fuel Model…………….. 108
Figure 4.17 Crown Fire Activity as a Function of Canopy Cover………… 108
Figure 4.18 Burn Susceptibility: Travis County ESD #3……………………. 111
Figure 4.19 Burn Susceptibility: Boerne, Texas…………………………….. 112
Figure 4.20 Fire Behavior: Travis County ESD #3………………………….. 114
Figure 4.21 Fire Behavior: Boerne, Texas……………………………………. 115
Figure 4.22 Fire Stations: Travis County ESD #3……………………………. 120

xiii
Figure 4.23 Fire Stations: Boerne……………………………………………... 121
Figure 4.24 FIREWISE Communities in the Eastern Edwards Plateau…... 124
Figure 5.1 Street Configurations: Boerne…………………………………... 129
Figure 5.2 Street Configurations: Travis County ESD #3…………………. 129
xiv
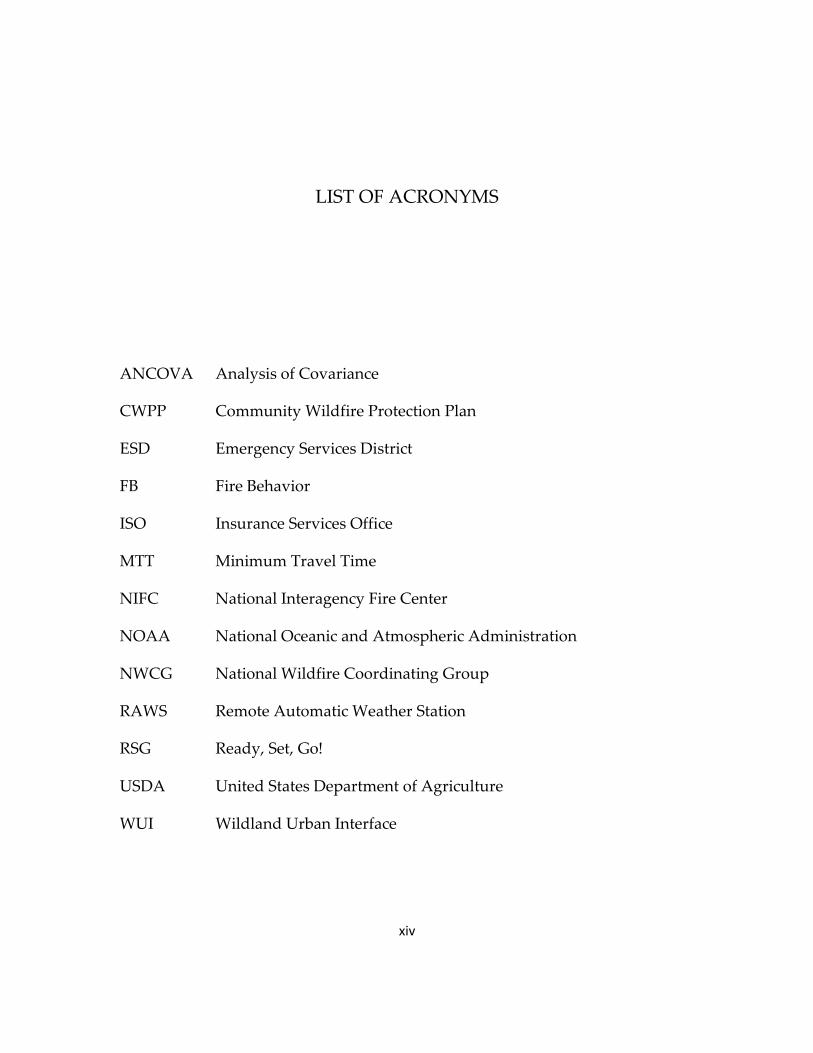
LIST OF ACRONYMS
ANCOVA Analysis of Covariance
CWPP Community Wildfire Protection Plan
ESD Emergency Services District
FB Fire Behavior
ISO Insurance Services Office
MTT Minimum Travel Time
NIFC National Interagency Fire Center
NOAA National Oceanic and Atmospheric Administration
NWCG National Wildfire Coordinating Group
RAWS Remote Automatic Weather Station
RSG Ready, Set, Go!
USDA United States Department of Agriculture
WUI Wildland Urban Interface

xv
GLOSSARY OF TERMS
ADAPTATION: The process or action undertaken by a
system in order to better cope with
future hazards resulting from global
change.
BIOPHYSICAL VULNERABILITY: A system that physically occupies a
hazard zone.
COMMUNITY: Groups of individuals that share some
jurisdictional boundary as well as a set
of resources and infrastructure.
HAZARD: A disturbance that has the potential to
cause harm or damage to a system.
RESILIENCE: The ability of a system to respond and
recover from a hazard.
SOCIAL VULNERABILITY: The sensitivity of a community to loss or
damage from a hazard, tempered by the
characteristics, infrastructure, and
practices within that community.

xvi
VULNERABILITY: The condition of a system that is
susceptible to loss or damage measured
at a static point in time or produced
through many mechanisms as material
conditions of being vulnerable are
translated through a recursive process.
WILDFIRE: Unplanned fires that burn in natural
areas such as forests, shrub lands,
grasslands, or prairies.

1
CHAPTER 1: INTRODUCTION
1.1: STATEMENT OF THE PROBLEM
Images of residential neighborhoods pinned behind a backdrop of
catastrophic wildfires have been all too common in the United States media since
the beginning of the twenty-first century. Many sources confirm that this
publicity is the result of a veritable trend toward larger, more intense wildfires
occurring in areas where residential development and fire-adapted landscapes
merge. Moreover, numerous federal, private, and academic institutions are
predicting that this trend will continue as a consequence of human-altered fire
regimes, climate change, and the continued expansion of communities into areas
prone to wildfire activity. Practical solutions are critical to saving lives and
property from future harm. Yet the complex interaction of ecological and social
factors that make communities susceptible to harm is not universal. Instead, the

2
heterogeneity of fire-adapted ecosystems and the diverse character and practices
of each community require the development of unique solutions to meet their
needs.
Reports from the National Interagency Fire Center (NIFC) indicate that the
area of land that burns every year during wildfire events has been increasing
since 1980 (Figure 1.1). Simultaneously, NIFC reports show that the number of
fires per year has not increased indicating that the increased burned area is a
result of larger fires rather than more frequent fires (NIFC 2009). Of equal
concern is that these larger fires are materializing despite increased federal, state,
and local funding to suppress them (Stephens and Ruth 2005, NIFC 2009). The
suppression cost in 2012 of federal agencies alone was just under two billion
dollars, over double the amount spent in 1994, and almost four times the cost in
1990 (Figure 1.2) (NIFC 2013a).

3
Figure 1.1: The annual
area burned during
wildfire events (NIFC
2013).
Figure 1.2:
Annual dollars
spent to suppress
wildfire events
(NIFC 2013).
Figure 1.1: The
annual area burned
during wildfire
events (NIFC 2013).

4
Considerable research conducted by government, academic, and private
institutions has been dedicated to investigating the larger fires of the twenty-first
century. The general consensus across disciplines is that the occurrence of larger
wildfires is due to an inextricable partnership between fire exclusion, climate
change, and fuel abundance, which results in drastically variable outcomes
across geographies (Stephens and Ruth 2005, Westerling et al. 2006, Headwaters
Economics 2009, NIFC 2009, Moritz et al. 2012, USDA Forest Service 2013).
Natural fire regimes, the cycle of fire to which plant and animal species have
evolved in concert and which have shaped and sustained ecosystems since the
origin of terrestrial plants on the earth, are being altered dramatically by humans
(Bowman et al. 2009). This is mostly through the suppression of fire and changes
in land use, but fire regimes are also altered through invasive species and shifts
in temperature and precipitation (USDA Forest Service 2013). The accumulation
and increased flammability of fuels create the dangerous conditions that we face
today, but the degree to which a region experiences increased wildfire activity is
geographically-specific. Studies on the relationship between fuel and climate are
required at regional or local scales in order to better predict how fire will behave
in the future for a given location (Moritz et al. 2012).

5
Although it is widely accepted that the suppression of fire leads to
increased fuel abundance, fire suppression continues to be the dominant practice
in order to protect human lives and property, which is the primary federal fire
policy agenda (Stephens and Ruth 2005). This necessity is linked to the increase
of local residential development in areas that are prone to wildfire activity. These
areas, coined the wildland urban interface (WUI) were calculated to contain
thirty-nine percent of the housing units in the United States in 2000 and are
continuing to grow (Radeloff et al. 2005, Stewart and Radeloff 2012). Increased
funding for suppression, a concern of federal agencies and taxpayers alike, has
been insufficient in reducing the size of wildfires and the damages that residents
in the WUI incur. The National Oceanic and Atmospheric Administration
(NOAA) publishes a list of weather and climate related disasters that result in
over one billion dollars in damages, a rough metric of extreme national disasters,
dating back to 1980. The first wildfire event to show up on that list was in 1991.
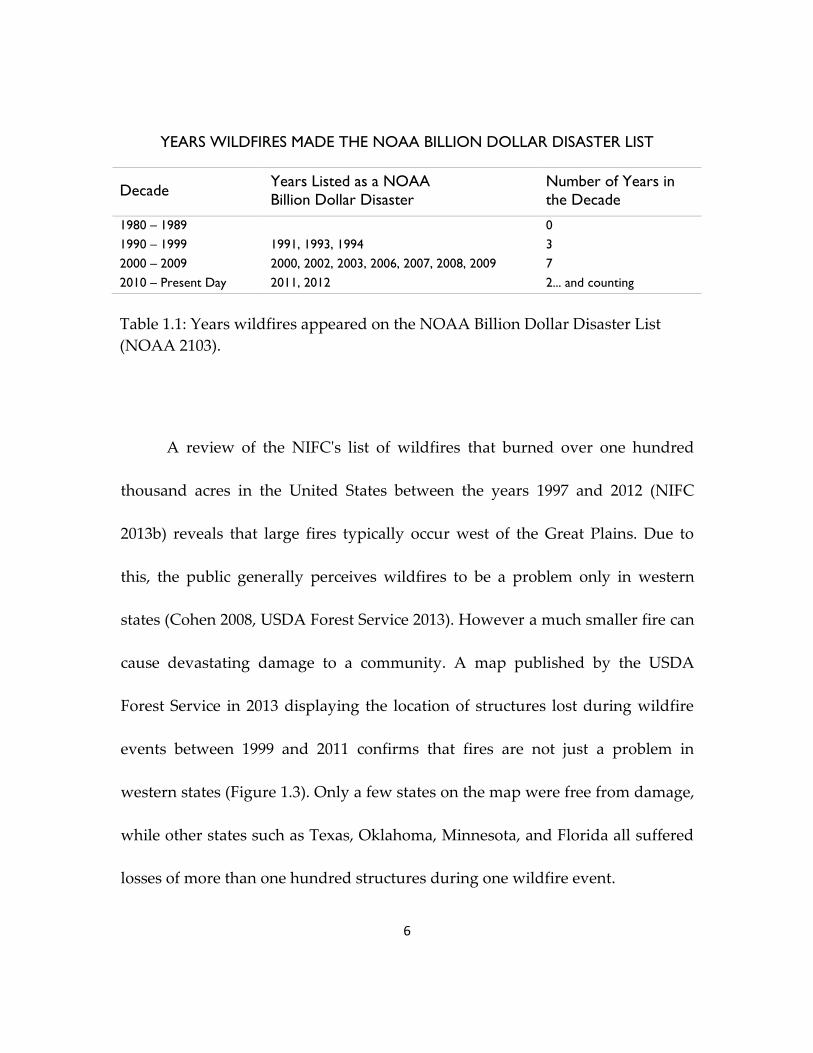
Since then wildfires have made an increasing appearance (Table 1.1), with six of
the past seven years making the list (NOAA 2013). The calculations made by
NOAA do not include federal, state, and local suppression costs.
6
YEARS WILDFIRES MADE THE NOAA BILLION DOLLAR DISASTER LIST
Decade Years Listed as a NOAA
Billion Dollar Disaster
Number of Years in
the Decade
1980 – 1989 0
1990 – 1999 1991, 1993, 1994 3
2000 – 2009 2000, 2002, 2003, 2006, 2007, 2008, 2009 7
2010 – Present Day 2011, 2012 2... and counting
Table 1.1: Years wildfires appeared on the NOAA Billion Dollar Disaster List
(NOAA 2103).
A review of the NIFC's list of wildfires that burned over one hundred
thousand acres in the United States between the years 1997 and 2012 (NIFC
2013b) reveals that large fires typically occur west of the Great Plains. Due to
this, the public generally perceives wildfires to be a problem only in western
states (Cohen 2008, USDA Forest Service 2013). However a much smaller fire can
cause devastating damage to a community. A map published by the USDA
Forest Service in 2013 displaying the location of structures lost during wildfire
events between 1999 and 2011 confirms that fires are not just a problem in
western states (Figure 1.3). Only a few states on the map were free from damage,
while other states such as Texas, Oklahoma, Minnesota, and Florida all suffered
losses of more than one hundred structures during one wildfire event.

7
Given these facts, that wildfires are bigger and more costly, causing more
damage in the expanding WUI and affecting much of the United States, there has
been a push by policy makers for local governments and citizens to participate in
Figure 1.3: Structures lost to wildfire between 1999 and 2011. Published by
the USDA Forest Service in 2013.

8
deriving solutions. Partially this is to address the strained federal budget by
making local governments shoulder more financial responsibility in suppressing
fires and thus incentivizing changes to local development that aim to protect
citizens (Stephens and Ruth 2005). However involving local governments and
citizens in decision making has additional merits. A nation-wide, or even state-
wide, approach to mitigating wildfire cannot realistically meet the needs of the
diverse communities it intends to serve. Finding a solution that will help protect
a community from damage caused by wildfire events relies foremost on
understanding a complex and dynamic interaction of ecological and social
elements specific to each locality then developing place-specific strategies to
meet the challenge (Cutter and Finch 2008).
1.2: RESEARCH OBJECTIVES
This thesis takes a case study approach to investigating both the ecological
and social elements of wildfire hazards in the fire-prone eastern Edwards Plateau
ecoregion of central Texas. For the purposes if this thesis, a hazard is defined as a
disturbance that has the potential to cause harm or damage to a system. Not all

9
wildfires, as will be discussed in Chapter 2, are considered hazards, for they
typically play an essential role in supporting healthy ecosystems.
The primary research objectives are to understand the potential for
wildfire hazards in the eastern Edwards Plateau as well as how communities, i.e.
groups of individuals within some jurisdictional boundary that share resources
and infrastructure, are responding to the potential. Specifically, the research
seeks to: i) quantify the expected magnitude of wildfire behavior under various
spatial and temporal conditions using simulation modeling, ii) map the
susceptibility to wildfire in areas where residential development co-occurs with
fire-prone land, and iii) investigate the ways in which communities adopt
strategies and develop infrastructure to mitigate potential wildfire hazards.
The results of these objectives are intended to communicate wildfire
hazard potential in a way that is meaningful at multiple scales. If solutions are to
be derived through the cooperation of local governments and residents, then
both entities need to understand how wildfire hazards affect the community as a
whole as well as how wildfire hazards affect single neighborhoods. While the
outcome of this thesis is specific to the eastern Edwards Plateau, the methods can
be easily applied to any community.

10
1.3: ROADMAP TO THE FOLLOWING CHAPTERS
Chapter 2 begins by outlining the socio-ecological framework for studying
environmental hazards that was used to structure this thesis. The framework
contains three main components: the hazard, systems occupying the hazard
zone, and the resilience and adaptive strategies of systems exposed to the
hazard. A background of the environmental controls of wildfire, the WUI, and
mitigation tactics are provided. The chapter then concludes with a description of
the study area, its landscape, population, and summary of wildfire events in
2011, which was an active fire season for the region.
Chapter 3, the research design chapter, details the three methods used to
meet the research objectives. First, the potential for wildfire hazards in the region
is explored through fire simulation modeling. Variation in fire behavior that
results from moderate and extreme summer weather conditions is tested and the
vegetation and topographic characteristics that correlate with more extreme fire
behavior are identified. Following this, the investigation continues at a smaller
scale by looking at two communities of approximately equal populations: one

11
unincorporated community bordering the Austin city limits; and one
incorporated community in the middle of rural Kendall County, the city of
Boerne, Texas. The boundaries of these communities are defined by the fire
department jurisdictions that serve them. Simulation modeling is used at this
scale to determine the spatial distribution of areas susceptible to burning as well
as the potential for extreme fire behavior within the jurisdictions. Finally data on
how these communities respond to wildfire hazards now as well as the actions
they are taking to respond to wildfire hazards in the future are compared.
The results of these three methods are supplied in Chapter 4 and
discussed in Chapter 5. Under moderate weather and climate conditions, the
predicted fire behavior for the region was mild. However, periods of drought, a
gust of twenty mile per hour winds, or a two week interval of dry, hot days all
led to substantial increases in the predicted surface and crown fire activity in the
simulations. Furthermore, the highest concentrations of crown fire activity and
most extreme flame lengths occurred closer to areas inhabited by people along
the IH 35 corridor linking the cities of Austin and San Antonio.
Mapping susceptibility to burning in the two focal communities
highlighted the importance of urban form in wildfire susceptibility patterns.

12
Boerne had a smaller, but denser, urban form than the unincorporated
community outside Austin. This form correlated with lower burn susceptibilities
and lower occurrences of extreme fire behavior. In direct contrast, the
community outside Austin had a greater response capacity and greater access to
external resources than those available to Boerne.
Overall, this project shows that simulation modeling can be an effective
tool in understanding wildfire hazard potential in WUI communities and
communicating that potential hazard in metrics that are easy to interpret. Further
research into the ignitibility and spread of fires among residential structures as
well as the efficacy of property-level fuel management are important future steps
in deriving successful mitigation strategies.
13
CHAPTER 2: BACKGROUND
2.1: INTRODUCTION TO CHAPTER 2
Wildfires, defined by the USDA Forest Service as unplanned fires that
burn in natural areas such as forests, shrub lands, grasslands, or prairies (2013),
are invaluable to the health of many ecosystems yet simultaneously constitute a
threat to the lives and property of people living in the wildland urban interface
(WUI). This is the consequence of a two part problem: i) wildfires are larger and
more severe due to dramatic human-induced changes in fire regimes, fuel
accumulation, and climate change (Bowman et al. 2009, Miller et al. 2009); and ii)
a large percentage of housing units are located in the WUI, which necessitates
immense budgets for suppression and drains potential funds for preventative
mitigation (Stephens and Ruth 2005). The two part problem is best described as a
socio-ecological system in which human actions and environmental processes are

14
inextricably linked. Solutions aimed at mitigating these threats require attention
to both the ecological and social aspects (Gallopin 2006).
2.2: A FRAMEWORK FOR HAZARDS IN SOCIO-ECOLOGICAL SYSTEMS
Investigations of environmental hazards are common in the research
fields of vulnerability, global change, and sustainability and provide useful
frameworks for illuminating complex relationships in socio-ecological systems.
While scholars from various disciplines tend to disagree on technical definitions
and the specific relationship of concepts within the socio-ecological framework,
there is general agreement on some basic principles (Brooks 2003, Adger 2006).
First there is a hazard to which a system is exposed, which could be a sudden
event or gradual environmental degradation. Second there are biophysical
elements (people, infrastructure, ecosystem functions, etc.) that are vulnerable to
damage or loss as a result of being exposed to the hazard. Third, there is a
societal response that tempers sensitivity to the hazard, which can be described
as either the ability to cope with hazards, i.e. resilience, or the ability to evolve in

15
the face of rapidly changing natural and human environment that brings about
hazards, i.e. adaptation (Adger 2006).
A hazard, defined broadly as a threat to a system (Turner et al. 2003), is
viewed as the onset of an event and measured in physical terms such as duration
or magnitude. Deeper focus into hazards, though, includes delineating the
conditions, both ecological and social, that lead to the hazard onset. These
conditions can develop gradually through time as a result of anthropogenic
activity or natural processes or come about quickly, such as in shifting weather
patterns (Brooks 2003). Deriving meaningful solutions to environmental hazards,
especially hazards aggravated by climate change such as wildfire, relies on
understanding the conditions that lead to hazards and predicting how those
conditions will change in the future.
Vulnerability has been defined in many ways, but the most harmonious
definition in terms of wildfire hazards separates vulnerability into two parts. The
first part of vulnerability is a measure of what physically occupies the hazard
zone (Cutter 1996), in other words, what is in the path of the hazard and will
likely result in damage. This can be seen as the biophysical vulnerability (Brooks
2003), and can include anything susceptible to damage such as humans,

16
structures, habitat, livestock, water bodies, bridges, communication networks,
etc.
However the proximity to the hazard is not the sole determinant of loss as
a result of the hazard (Cutter et al. 2000, Turner et al. 2003), which leads us to the
second type of vulnerability, social vulnerability. How sensitive a community is
to loss or damage from a hazard is tempered by the characteristics,
infrastructure, and practices within that community (Brooks 2003, Adger 2006).
This indicates that attributes such as the use of poor building materials, the lack
of emergency infrastructure, inadequate access to information and assistance
programs, etc. can dramatically alter how vulnerable a system is to hazards
(Brooks 2003).
A related but slight variant on social vulnerability is the concept of
resilience. Resilience is the ability to of a system to respond and recover from
hazards (Cutter et al. 2008). Simply stated, it is the erosion of resilience that leads
to greater vulnerability and the buildup of resilience that minimizes vulnerability
(Adger et al. 2005). Like vulnerability, resilience can be measured in terms of
infrastructure or access to services and support systems, to name only a few
factors. Others use demographic characteristics as broad proxies for vulnerability

17
and resilience, indicating that income, age, gender, or ethnicity may correlate
with the ability for a community to cope with hazards (Cutter et al. 2000, Cutter
et al. 2003). Metrics of vulnerability and resilience are not easily quantifiable or
standardized among fields. The appropriate method for measuring these
attributes depends on the context of the socio-ecological system of interest
(Adger 2006).
The final concept in this socio-ecological framework is the idea of
adaptation. Adaptation is the process or action undertaken by a system in order
to better cope with the constant metamorphosis of environmental hazards
resulting from global change (Smit and Wandel 2006). Like resilience, more
adaptation reduces vulnerability. Unlike resilience, it reflects the ability of a
system to evolve in conjunction with hazards (Adger 2006). While resilience can
be seen as ways of reducing vulnerability to hazards in the present, adaptation
reflects the capacity of a community to reduce vulnerability both in the present
as well as the future (Smit and Wandel 2006).
Unfortunately, many scholars have observed that strategies aimed at
reducing vulnerability to environmental hazards are often neglected until a
community is faced with an event. It is not until after a hazard occurs that

18
mitigation is attempted (Adger et al. 2005, Smit and Wandel 2006, Cutter et al.
2008). Yet protecting communities from the increase in wildfire activity as a
result of climate change require that adaptive strategies be put in place well
before a wildfire occurs. It is critical that communities understand the
environmental hazards they face and that mitigation strategies employed
address the specific needs of the people and the environment that is affected
(Cutter 1996, Cross 2001, Cutter and Finch 2008). The following sections of this
chapter discuss current research on wildfire hazards borrowing the three part
framework described above: the first section is a synthesis of the causes of
wildfire hazards; the second section delineates what is susceptible to damage
from wildfire; and the third section outlines mitigation strategies that are known
to bolster resilience and adaptation to wildfire hazards.
2.3: WILDFIRE AS HAZARD
Wildfire has existed on earth since the origin of terrestrial plants over four
hundred million years ago. Along with climate, fire has been a major force in
shaping the ecological communities that persist today (Bowman et al. 2009,

19
Pausas and Keeley 2009). These communities have evolved in conjunction with
fire and rely on the essential functions fire provides, such as nutrient cycling, soil
conservation, foraging opportunities, and new habitat (USDA Forest Service
2000a, USDA Forest Service 2005). Thus classifying wildfire as only a hazard
would be remiss of its merits. Within the boundaries of this thesis, wildfire is
only defined as a hazard when it threatens human lives and property or when
damage to a natural system outweighs the environmental benefits it receives.
Fire is a component of a dynamic system made up of its interactions with
climate and vegetation (USDA Forest Service 2000b, Parisien and Moritz 2009).
Climate is widely recognized as a dominant factor in the range and distribution
of vegetation that have gradually shifted through time in response to climatic
variation (Pearson and Dawson 2003). Weather patterns, interspecies
interactions, and the presence of fire have shaped the composition and
abundance of vegetation, which then affect how fire behaves. Climate also affects
fire behavior by controlling the moisture content of vegetation, influencing its
flammability, and contributing to the spread of fire through wind speed and
direction. In return, vegetation and fire impact climate through the detention or
release of carbon into the atmosphere (USDA Forest Service 2000b).

20
Fire behavior is typically characterized by metrics of an active fire. Basic
descriptions include spread rates, flame lengths, how much energy was released,
or whether the fire remained on the surface or spread to tree canopies, resulting
in crown fire activity. Crown fire activity is further characterized by passive
versus active fire behavior. According to the USDA Forest Service, an active
crown fire includes a wall of flames from surface to crown that seem to engulf an
entire fuel complex rather than individual trees or small clusters, which is
indicative of passive crown fires.
Fire severity, on the other hand, is a measure of how much organic matter
was consumed once a fire event is complete. While severity is a culmination of
fire behavior and vegetation, it reflects the results rather than the characteristics
of a fire (Keeley 2009). Fire regimes are commonly described in terms of return
frequency and severity. While it is understood that fire regimes vary as result of
fluctuations in climate, vegetation, fire system, broad fire regime classifications
have been made that help elucidate how fire is spatially distributed (Figure 2.1).
Once anthropogenic activity reached a level that greatly altered vegetation
communities and excluded fire from occurring naturally, humans became a
major force in modifying fire regimes (Pausas and Keeley 2009). Combined with

21
the prediction that climate change will rapidly bring about new temperature and
precipitation patterns as a result of human activity (IPCC 2007), the natural
variability of fire regimes will be replaced with even greater uncertainty about
global fire patterns (Krawchuk et al. 2009, Bowman et al. 2011).
Figure 2.1: Map of fire regimes in the United States. Map obtained from the
USDA Forest Service (2013).

22
How future climate change will impact fire regimes is a subject that has
received a lot of attention in the past ten years due to the uncertainty that it
brings to our understanding of global fire patterns. Marlon et al. (2009) looked at
evidence of fire regime changes in the paleorecord and found that periods of
rapid climate change correlated with rapid shifts in fire activity. Research on tree
mortality has shown that recent fluctuations in climate have caused increased
tree mortality and susceptibility to burning through physiologic stress (Van
Mantgem et al. 2009, Allen et al. 2010). Recent climate change, within the past
few decades, has also been linked to longer fire seasons (Brown et al. 2004,
Westerling et al. 2006), larger fires (Westerling et al. 2006, Flannigan et al. 2009),
and higher resulting fire severity (Miller et al. 2009).
These studies all agree that climate change has an impact on fire activity,
which promotes the idea that future fire activity as a result of the rapid changes
in climate predicted to occur in this century should be a major policy concern
(Schroter et al. 2007). What these studies also agree on is that climate-impacted
fire activity varies considerably across the globe. A study by Moritz et al. (2012)
that predicted future global fire activity using multiple climate change models

23
illustrates this spatial variability. In any given climate model, some areas are
predicted to see significant increases in fire activity while others are expected to
see decreases in fire activity. This is likely due to climate change impacts on
species ranges and distributions over time. However, there is little agreement
among the models regarding where these changes will occur. Thus we have
evidence that fire activity will change drastically, but no direct indication of
where. To ensure that each region understands the range of possible outcomes as
a result of climate change, regional studies are required (Moritz et al. 2012).
It is unrealistic to assume that we can ever return to the fire regimes that
existed a century ago given the massive amounts of land use change, fire
exclusion, and invading species that have occurred. However, we do have the
ability to influence fire behavior and severity through managing fuels. Restoring
landscapes to reduce fuel loads is widely accepted as a proactive strategy to
address future fire uncertainty (Agee and Skinner 2005, Stephens and Ruth 2005,
USDA Forest Service 2013). Practices such as mechanical, chemical, or biological
(grazing) reduction of vegetation, as well as prescribed burning have been
proven to mitigate hazards through reducing surface fuel, increasing the height
of live tree crowns, and weeding out highly flammable species while retaining

24
fire-resistant species (Agee and Skinner 2005). Studies have shown that these
methods reduce overall tree mortality during unplanned fires (Stephens et al.
2009). They also ameliorate fire behavior, including flame lengths and ignition
susceptibility near structures (Finney 2001, Ager et al. 2010).
It has also been shown that the pattern of fuel reduction carried out
influences its effectiveness. Optimized patterns of fuel reduction have been
proven to protect ecosystems and minimize overall fuel reduction needs (Finney
2008), yet direction for optimizing fuel patterns is highly dependent on place-
specific attributes and goals and practical guides for land managers are lacking.
Furthermore, fuel management that successfully protects residents in the WUI
relies on cooperation among multiple private property owners, which can create
barriers to fulfilling fuel management objectives (Fernandez and Botelho 2003).
In fact, a study in 2009 by Schoennagel et al. showed that, of the fuel treatments
conducted by federal agencies between the years of 2004 and 2008, only three
percent were carried out in the WUI. Considering that reducing fuels in the WUI
is one the major objectives in the National Fire Plan, three percent appears low.
The authors point out that this is due to much of the WUI being under private
ownership, which is beyond federal control.
25
2.4: BIOPHYSICAL VULNERABILITY TO WILDFIRE HAZARDS
Biophysical vulnerability to wildfire hazards is an account of systems
physically within the wildfire hazard zone that are susceptible to damage or loss
from a fire. In some instances highly severe wildfires can actually cause more
harm than help to an ecosystem, especially when the system is undergoing
another stress, such as drought or species endangerment. Severe fires can destroy
critical species habitat (Miller et al. 2009) or expose large areas of soil to erosion
(Benavides-Solorio and MacDonald 2001). Riparian areas typically provide
buffers against fire and refuge for animals waiting out the event, however when
riparian conditions are overly dry, they can instead act as conduits to spread fire
farther (Pettit and Naiman 2007). Ecosystem damage can also affect human
infrastructure. For example, the 1996 Buffalo Creek fire in Colorado resulted in
two million dollars in flood damage and twenty million dollars in damage to
Denver's water supply from large amounts of eroded sediment (USDA Forest
Service 2013).

26
The biophysical vulnerability of greatest policy concern, though, is that of
human life and property (Stephens and Ruth 2005). Much of the United States
population today is living within the WUI. In 2005, Radeloff et al. mapped the
WUI for the United States using US Census housing data from the year 2000 and
the definition of what constitutes the WUI as recorded in the Federal Register.
According to the Federal Register, WUI contains at least one housing unit per
forty acres with no maximum density and is either dominated by wildland
vegetation (intermix communities) or is within the vicinity of wildland
vegetation (interface communities). Radeloff et al. interpreted this definition to
include all census blocks with at least one housing unit per forty acres that are
more than fifty percent vegetated or within 2.4 km of a block that is more than
seventy-five percent vegetated. The 2.4 km length represents the distance that an
ember can travel from a wildfire (Radeloff et al. 2005). Given this definition, the
team found that thirty-nine percent of housing units in 2000 were in the WUI,
which was found to be a significant increase since 1970 (Figure 2.2) (Radeloff et
al. 2005, Theobald and Romme 2007).

27
Figure 2.2: Map of the WUI in the United States. Map obtained from the USDA
Forest Service (2013).
The reasons for the expansion of the WUI are not well documented, but
researchers have attributed it to an affinity that Americans have for rural
settings, particularly ones rich in natural amenities (Radeloff et al. 2005). Others

28
suggest that local codes and regulations fail to steer private development away
from highly hazardous areas of the WUI (Headwaters Economics 2013). An
econometric analysis from 1970 to 2000 conducted by Olmstead et al. in 2012
showed that increases in federal efforts to suppress wildfire in specific federally-
managed lands correlated with subsequent increases in development near those
lands, which indicates, according to the authors, that federal actions to mitigate
hazards inadvertently promoted growth in hazardous areas.
No matter how development patterns change, there will always be some
portion of the housing units in the United States that are situated in the WUI.
What is important is that each community understands how much of their
housing stock overlaps with areas susceptible to wildfire activity so that they can
derive solutions that work for them (Paveglio et al. 2009).
2.5: RESILIENCE AND ADAPTATION TO WILDFIRE HAZARDS
Research on how and to what extent communities prepare for potential
wildfire hazards shows substantial variation among the communities studied.
This variation is attributed to the diversity of residents based on experiences,

29
demographic characteristics, and access to information and resources (Jarrett et
al. 2009, Paveglio et al. 2009, Eriksen and Prior 2011). For instance, residents in
longer-established communities may have more experience with wildfires and
thus been inspired to adapt to future threats, whereas residents of newer
communities may not understand the threats they potentially face (Eriksen and
Prior 2011). Attitudes, beliefs, and experiences have also been shown to affect the
level of community cooperation in carrying out a fuel management plan (Fischer
and Charnley 2012). The degree to which a community is organized has been
shown to impact how they approach mitigation. Communities with well-defined
organization, or communities that organize for the sole purpose of addressing
potential wildfire hazards, have shown to be effective in implementing
mitigation. Understanding that there is not a one size fits all solution to wildfire
hazards is an important concept in designing adaptive strategies that will lead to
real benefits in a community (Paveglio et al. 2009).
Based on the growing expense of wildfire suppression, and the fact that
many communities are ill-prepared for wildfire hazards, several government
agencies have been promoting community awareness and community planning
as a way to mitigate future harm. Part of the federal Healthy Forests Restoration
30
Act of 2003 included the promotion of community wildfire protection plans
(CWPP), a planning process that incentivizes communities to assess their risk
and establish priorities for mitigation in return for possible grants and fuel
management assistance (USDA Forest Service 2013). Research has shown that the
process improves the ways that residents communicate within a network and
solve problems beyond wildfire protection (Jakes et al. 2007a, Jakes et al 2007b,
Paveglio et al. 2009). However, CWPP's have been criticized for not requiring
public participation. A CWPP that is conducted without public input fails to
encourage communication among residents or measures toward taking personal
responsibility (Brummel et al. 2010).
The Firewise program is another strategy that encourages communities to
engage in wildfire protection planning but with a focus on informing residents
on best practices for their property. Initiated by the National Fire Protection
Association in the 1990's, this program certifies communities as “Firewise” based
on a set of criteria the community must carry out including an official hazard
assessment, a plan that addresses the assessment, an annual public outreach
event, and a two dollar per capita annual investment to fund local Firewise
initiatives (www.firewise.org). Standards for creating fuel-free buffers around
31
structures, coined defensible space, and using fire-resistant building materials
are key tools promoted by the program (USDA Forest Service 2013). Yet,
researchers have argued that while property-level mitigation tactics, such as
defensible space and fire-resistant building materials, are recognized for their
benefit to hazard reduction, they are in great need of more in depth testing
(Cohen 2008, Gill and Stephens 2009, Mell et al. 2010).
In 2011, the International Association of Fire Chiefs released
recommendations for a wildfire hazard strategy that is intended to blend with
CWPP's, Firewise programs, as well as any other local strategies already in place.
The program is called Ready, Set, Go! (RSG) and comprises a more
comprehensive set of wildfire hazard strategies than the CWPP or Firewise
programs alone. It includes multi-level planning, from fire departments to
neighborhoods to families, and focuses on both preventative strategies like the
Firewise program as well as improved emergency management during a wildfire
event (www.wildlandfirersg.org). It is the only program of its kind that
emphasizes the need for emergency planning at both the household and
community-wide scales.

32
Resilience to wildfire hazards necessitates incorporating RSG principles.
First and foremost, strategies for protecting human life once a wildfire occurs are
critical. Notifying residents, having access to adequate emergency staff, and
having access to evacuation routes are all ways of building resilience to wildfire
hazards. Second, implementing strategies that minimize fire behavior around
structures greatly increases the chances that property can be saved. Both of these
principles require that the public understands the potential wildfire hazards in
their area and how wildfire hazards vary with climate.
Overall, this broad body of wildfire literature highlights an understanding
that wildfire hazards will increase as the climate changes and that each year
more people will be affected as the WUI expands. The literature also strongly
indicate that the degree to which wildfire hazards change will vary dramatically
among regions and that taking a regional or community-level perspective on
wildfire hazards is the best way to derive effective solutions.
This thesis takes a multi-scaled, case study approach to understanding
potential wildfire hazards for a region in central Texas. The eastern Edwards
Plateau is known to be prone to wildfire activity, is simultaneously experiencing
rapid population growth, and is predicted to experience increased average
33
temperatures and periods of drought as a result of climate change. Through the
use of simulation modeling, this thesis looks at the variation in wildfire hazards
under mild to extreme weather and climate conditions. This process helps
predict the magnitude and location of wildfire hazards for the region as climate
change proceeds. The thesis also examines two WUI communities within the
region that are each experiencing population growth and are indicative of two
types of development that take place in central Texas: regulated growth in
incorporated cities, and unregulated growth in unincorporated suburbs. In doing
so, the thesis highlights the wildfire hazard potential at the community and
neighborhood scales.
2.5: STUDY AREAS
The Edwards Plateau ecoregion is located in central Texas and contains
two of Texas’ largest cities linked by the IH 35 corridor, Austin and San Antonio
(Figure 2.3). Synonymous with the Texas Hill Country, the region is noted for its
distinctive hydrologic features created by a karst aquifer system and is
prominently delineated by the Balcones Escarpment on the eastern and southern

34
edges. Figure 2.4 shows two maps of the eastern portion of the ecoregion
containing the Balcones Escarpment. The shaded relief map, which spans in
elevation from three hundred feet above sea level to two thousand feet above sea
level, highlights the curved edge of the escarpment at approximately eight
hundred feet. Likewise, the tree canopy map shows a denser canopy of juniper-
oak woodlands that have established themselves along the highly eroded
canyons and separate the region from the Coastal Plains to the east. Moving
west, the ecoregion shifts into a savanna that has been experiencing woody
species encroachment as a result of overgrazing and fire exclusion. Unlike this
eastern portion, the northern and western delineation of the Edwards Plateau
ecoregion are not well-defined and have been interpreted differently by multiple
sources (Johnson 2013).

35
Figure 2.3: Edwards Plateau ecoregion and study extent.
Figure 2.4: Eastern Edwards Plateau elevation (ft) and canopy cover (percentage).
36
Just as the landscape shifts from east to west, so does the population
density west of the IH 35 corridor. The eastern portion of the Edwards Plateau
contains the majority of the population in the region due to the growth of Austin,
San Antonio, and the cities in between. According to the Texas County Profiles
website, the four counties along the IH 35 corridor grew between twenty-three
and sixty-one percent from the year 2000 to 2010 (http://www.txcip.org/tac/
census/CountyProfiles.php) and are predicted to continue growing between
twenty and sixty-four percent between 2010 and 2020 (http://txsdc.utsa.edu/).
According to WUI data made available by Radeloff through the Spatial Analysis
for Conservation and Sustainability lab at the University of Wisconsin,
approximately seventy-seven percent of this region's housing units in 2010 were
in the WUI (http://silvis.forest.wisc.edu/) (Figure 2.5).

37
Figure 2.5: WUI of the eastern Edwards Plateau. Data from 2010 US Census and
University of Wisconsin.

38
The year 2011 was an active fire season for Texas. The eastern Edwards
Plateau ecoregion experienced numerous fires, most notably the Pedernales fire
that burned sixty-five thousand acres (Lee 2012). On the same day as the
Pedernales fire, September 4, 2011, a fire in the Steiner Ranch neighborhood west
of Austin burned over one hundred and sixty acres and destroyed or damaged
over fifty homes (Travis County Fire Marshal’s Office 2011). Earlier in the year,
the Oak Hill neighborhood in southwest Austin experienced an urban wildfire
that burned approximately one hundred acres and destroyed ten homes while
damaging another eleven (Lee 2011).
The magnitude of fire behavior during the 2011 fire season is largely
attributed to the most severe one-year drought on record for Texas. This fact
raises concerns about the potential for wildfire hazards in the near future as
predictions indicate that average temperatures and the frequency of drought will
increase (Texas A&M Forest Service 2011). According to a Texas climate change
study in 2012, average summer temperatures could increase between 2.2 and 4.8
degrees Celsius in central Texas by 2100 and precipitation patterns will be
variable but likely lead to more arid conditions (Jiang and Yang 2012).

39
The recent occurrence of wildfire events, a growing population, and the
climate change predictions make the eastern Edwards Plateau an ideal case study
for assessing wildfire hazards through a socio-ecological framework. The first
objective of this thesis is to quantify the expected magnitude of wildfire behavior
under various spatial and temporal conditions using simulation modeling. The
spatial variation tested is the gradient of vegetation and topography that exists
across the eastern Edwards Plateau extent. The temporal variation tested is a set
of eight weather and climate scenarios that range from mild summer conditions
to the extreme conditions of September 4, 2011.
The second and third objectives of this thesis require focus on
communities within the eastern Edwards Plateau extent. In order to map wildfire
susceptibility in WUI areas and investigate mitigation strategies adopted by
communities, two smaller extents were selected (Figure 2.6). The first is an area
just beyond the Austin city boundary in Travis County, Texas. Outside the city
limits emergency protection is provided by emergency service districts, which
are authorized by the state to form and collect taxes from their district for the
purpose of protecting health and wellbeing of the community (Jarrett and
Anchondo 2012). The Travis County emergency service district number three

40
(ESD #3) forms the boundary of this extent. The Travis County ESD #3 is also
called the Oak Hill Fire Department because it used to serve the entire
unincorporated Oak Hill community before half of Oak Hill was annexed by
Austin in 2000. Now the Oak Hill Fire Department serves the remaining
unincorporated neighborhoods of West Oak Hill as well as the unincorporated
Barton Creek neighborhood directly north with a total population of almost
fifteen thousand individuals in 2010 and a land area of over twenty-six thousand
acres. In Texas, county governments have limited authority over growth and
development. Thus growth that occurs in unincorporated areas is largely
unregulated beyond protecting basic health and safety (Capital Area Council of
Governments 2009).
The second study extent is located fifteen miles northwest of the city limits
of San Antonio in the small city of Boerne, Texas. Boerne is the county seat of
rural Kendall County, Texas and had a population of almost fourteen thousand
people in 2010. The Boerne Fire Department provides fire protection services to
this population as well as a large land area outside the city limits. For the
purposes of this study, the municipal jurisdiction serves as the study area
boundary, which is roughly sixty-five hundred acres.

41
Figure 2.6: Location and population density of Travis County ESD #3 and Boerne
study extents.

42
CHAPTER 3: RESEARCH DESIGN
3.1: INTRODUCTION TO CHAPTER 3
Chapter 3 details the data collection and data analysis used in this thesis.
Three methods were employed to investigate wildfire hazards in the eastern
Edwards Plateau. Each method is tailored to answer one of three research
questions beginning with an examination of fire behavior at the regional scale
before narrowing the focus to wildfire hazard susceptibility and mitigation at the
scale of the communities served by two fire department jurisdictions, the Travis
County ESD #3 and the Boerne City Fire Department. This integrated approach
addresses both the ecological and social dimensions of wildfire hazards to not
only identify the magnitude and location of potential hazards but also how
communities in the eastern Edwards Plateau confront wildfire risk as the
regional population continues to expand.
43
The first research method employs fire simulation software developed by
the USDA Forest Service, FlamMap Fire Behavior (FB), to analyze the region's
expected wildfire behavior under eight weather scenarios ranging from a mild,
calm September day to an overly hot, dry, and windy September day. The
second method also uses simulation software developed by the USDA Forest
Service but instead focuses on recreating the September 4, 2011 weather
conditions at the community scale. The same FlamMap FB software is used with
the addition of FlamMap's Minimum Travel Time (MTT) application, which
explores the susceptibility to wildfire spread in areas that co-occur with
residential development. The third research method compiles and synthesizes
information obtained from public records and personal communications on the
wildfire response capacity in each of the focal communities as well as any
measures instituted by the communities to reduce wildfire hazard potential.
The succeeding sections state the research questions, describe the data
collection methods, describe the data analysis methods, and provide a discussion
of the assumptions and limitations of each approach.

44
3.2: RESEARCH QUESTIONS
QUESTION 1: What is the expected range of wildfire behavior in the
eastern Edwards Plateau during conditions that range from
an average September day to an overly hot, dry, and windy
September day and what are the influences of weather,
climate, topography, and vegetation in the observed
variation of wildfire behavior?
Sub-question 1a: What are the expected flame lengths, rates of spread, and
crown fire activity levels that result from simulated wildfires
in eight weather scenarios ranging from an average
September day to an overly hot, dry, and windy September
day in the eastern Edwards Plateau?
Sub-question 1b: How much do three fire-inducing conditions, increased
wind speed, decreased fuel moisture, and hotter, dryer days,
increase the magnitude of flame lengths, rates of spread, and
crown fire activity under simulated wildfire events in the
eastern Edwards Plateau?

45
Sub-question 1c: What is the correlation between landscape structure, i.e.
topography and vegetation characteristics, and the variation
of flame lengths, rates of spread, and crown fire activity
observed across eastern Edwards Plateau under simulated
fire events?
QUESTION 2: What are the expected spatial distributions of wildfire
susceptibility and wildfire behaviors and the in two WUI
communities in the eastern Edwards Plateau under
September 4, 2011 weather conditions?
Sub-question 2a: What is the spatial distribution of areas susceptible to
burning under September 4, 2011 wind speeds, fuel
moisture, and temperature and precipitation conditions for
the Travis County ESD #3 and Boerne study areas?
46
Sub-question 2b: What areas are predicted to experience flame heights over
eleven feet and active crown fire activity from simulated
wildfire events that mimic the September 4, 2011 wind
speeds, fuel moisture, and temperature and precipitation
conditions for the Travis County ESD #3 and Boerne study
areas?
QUESTION 3: What is the current capacity of the Travis County ESD #3
and Boerne City Fire Department to respond to wildfire
hazards in order to protect the lives and property of
residents and what plans, programs, or strategies have the
communities within each fire department jurisdiction
adopted for mitigating wildfire hazards now an in the
future?
Sub-question 3a: What is the emergency response capacity of the Travis
County ESD #3 and the Boerne City Fire Department in
terms of notifying and evacuating residents during wildfire

47
emergencies, responding to wildfire events, and
coordinating with surrounding fire departments?
Sub-question 3b: What plans, programs, or strategies, such as those promoted
by the CWPP or Firewise programs, have the communities
within each fire department jurisdiction adopted for the
purpose of building resilience to wildfire hazards and what,
if any, actions indicate that plans, programs, and strategies
may be adopted in the future?
3.3: DATA COLLECTION
Data collection for the thesis falls into three broad categories. Data was
either obtained from using wildfire simulation software, compiled from publicly
available documents or data warehouses, or collected from personal
communication with representatives of state, county, and local agencies. In order
to perform the wildfire simulations, input data from multiple sources is also
required. The following three subsections describe the FlamMap wildfire
simulations, mapping the FlamMap results within the two WUI communities,

48
and the collection of fire department response capacity and local mitigation
plans, programs, and strategies.
3.3.1: FLAMMAP WILDFIRE SIMULATIONS
FlamMap is a free fire behavior modeling program developed by the
USDA Forest Service, Rocky Mountain Research Station, and Systems for
Environmental Management. FlamMap simulates fire events over a digital
replication of a real landscape, made up of a grid of cells with values for
elevation, slope, canopy height, etc. The user defines weather and climatic
conditions to be tested, which remain constant through the duration of the
simulation. The program has two functions that are used in the present thesis,
the Fire Behavior (FB) function and the Minimum Travel Time (MTT) function.
FlamMap FB measures the expected fire behavior, such as flame lengths,
for each grid cell in the landscape under a given set of weather and climate
conditions. It assumes that each cell has been ignited and calculates how the cell
responds. To collect the necessary simulation data to answer Question 1, I input
data files that describe the study extent's landscape and designed eight weather
49
and climate scenarios to be tested. To collect the necessary simulation data to
answer Question 2, I input landscape data files corresponding to the smaller
extents and designed one weather scenario mimicking September 4, 2011
conditions. The completed simulations produce three output data files for each
simulation with measures of flame length, rate of spread, and crown fire activity.
The chances of a real fire behaving exactly how it has been predicted by
MTT are slim given the shifts in wind and temperature in a real fire event.
However the MTT simulations are capable of highlighting areas that are more
susceptible to wildfire events. The benefit of the MTT software is not to track
how one fire might move across the landscape, but instead to predict how
susceptible the landscape is to burning. This is a subtle but important difference
from fire behavior prediction. The predicted fire behavior in given cell assumes
that the cell is already ablaze, but it does not predict if the cell would ignite given
that its neighbor is ablaze, which is what MTT seeks to address.
50
3.3.1.1: FlamMap Landscape Inputs
Raster input data files required by FlamMap include: three topographic
layers, four canopy structure files, and one fuel model layer. Table 3.1 lists the
data files input into FlamMap and their descriptions. Each raster is made up of a
grid of thirty meter by thirty meter cells, simply called thirty meter resolution,
which each measure approximately one quarter of an acre. Each cell contains the
average value for that cell, for example, the average elevation or slope over nine
hundred square meters. For an example of the quantity of data contained in each
raster, the eastern Edwards Plateau study extent contains 19,071,324 grid cells.

51
FLAMMAP LANDSCAPE INPUT DATA
File Name Description Units Resolution Created
By Accessed From
Aspect Azimuth of sloped
surfaces
Azimuth
degrees 30 m USGS www.landfire.gov
Elevation Distance above sea
level Meters 30 m USGS www.landfire.gov
Slope Percent change in
elevation Percent 30 m USGS www.landfire.gov
Fuel Model
40 Scott and
Burgan Fire
Behavior Fuel
Models
Categorical 30 m LANDFIRE www.landfire.gov
Canopy Bulk
Density
Density of available
canopy fuel
Kg per
cubic meter
* 100
30 m LANDFIRE www.landfire.gov
Canopy Base
Height
Average height
from ground to
bottom of canopy
Meters * 10 30 m LANDFIRE www.landfire.gov
Canopy
Cover
Percent of cell
covered by canopy Percent 30 m LANDFIRE www.landfire.gov
Canopy
Height
Average height of
top of canopy Meters * 10 30 m LANDFIRE www.landfire.gov
Table 3.1: Input raster data files required for FlamMap modeling.
3.3.1.2: FlamMap Weather and Climate Settings
The following weather and climate conditions need to be set by the user
for all FlamMap simulations: wind direction, wind speed, fuel moisture, foliar
moisture, and the fuel conditioning period. Determining appropriate settings for
simulations is a lengthy process requiring multiple sources of climate and
52
weather data for the area. The weather data were obtained by using Remote
Automatic Weather Stations (RAWS) for stations within the extent. This
information is available through the website: www.raws.dri.edu. The data
obtained from the RAWS stations were then confirmed using local weather
station reports on WeatherSpark (weatherspark.com).
Based on historic average wind direction for the extent, all FlamMap FB
simulations used the south-southeast wind trajectory. The effect of wind
direction was not tested as a variable influencing fire behavior. Wind direction is,
however, a critical component to how fire spreads from a cell to its neighboring
cells and was varied in the MTT simulations. In order to increase the accuracy of
susceptibility for each cell, eight directions were tested in the simulations: north,
northeast, east, southeast, south, southwest, west, and northwest. For the set of
eight climate scenarios I tested a mild and extreme wind speed. Based on historic
average wind speeds across the extent, the scenarios tested five miles per hour as
the mild speed and twenty miles per hour as the extreme speed.
FlamMap defines fuel moisture, the moisture content of surface fuels, as a
set of five total measurements of percent moisture. Scott and Burgan (2005)
derived a set of four states (Table 3.2), from high to very low fuel moisture

53
content to be used in various fire behavior simulators including FlamMap. For
the set of eight climate scenarios I tested a mild and extreme fuel moisture state:
the moderate state, which represents a ninety percent fuel moisture content of
live herbaceous fuels; and the very low state, which represents a thirty percent
fuel moisture content of live herbaceous fuels.
SCOTT AND BURGAN FUEL MOISTURE STATES
Very Low Low Moderate High
Dead fuel 1-hour 3 6 9 12
Dead fuel 10-hour 4 7 10 13
Dead fuel 100-hour 5 8 11 14
Live Fuel Herbaceous 30 60 90 120
Live Fuel Woody 60 90 120 150
Table 3.2: Scott and Burgan's (2005) fuel moisture content (percent moisture)
recommendations. The very low and moderate states were tested in the
scenarios.
Scott and Burgan (2005) also recommend maintaining a foliar moisture
setting, the moisture content of tree canopies, of one hundred percent for all
simulations, which they claim to be a conservative calculation. However, the

54
USDA Forest Service's National Fuel Moisture Database (http://www.wfas .net/
index.php/national-fuel-moisture-database-moisture-drought-103) reports that
average foliar moisture for Ashe Juniper and Live Oak measured within this
extent ranges from fifty-nine percent to ninety-four percent moisture in August
and September. Thus, for the FlamMap simulations, when a scenario has
moderate fuel moisture content, the foliar moisture was set to one hundred
percent, and when the fuel moisture is very low, the foliar moisture is set to sixty
percent.
The fuel and foliar moisture settings describe the general state of fuels as a
result of long-term temperature and precipitation patterns. If an area is
undergoing a period of extended drought, it is presumed to resemble the very
low fuel moisture state described by Scott and Burgan (2005). If an area is
undergoing a rainy season, then the high fuel moisture state is presumed. Thus
fuel and foliar moisture are a reflection of long term trends. In contrast, the fuel
conditioning period setting in FlamMap effects fuel moisture in a shorter time
scale. By inputting local RAWS data for a given period of time, FlamMap will
“condition” fuels with precise daily temperature and precipitation
measurements as well as hourly wind speeds. This process recreates more

55
realistic fuel conditions than can be achieved by setting fuel moisture levels
alone. Like the fuel moisture, I tested one mild and one extreme state of fuel
conditioning.
As mentioned in Chapter 2, the year 2011 was an active fire year for Texas,
and specifically September 4, 2011 for this extent. The Balcones RAWS is located
within close proximity to the location of the Pedernales fire. Thus I used the
Balcones RAWS data for the two weeks leading up to September 4, 2011 (August
22 to September 4, 2011) as the more extreme fuel conditioning period. Average
daytime highs recorded at Balcones during this period were 103 degrees
Fahrenheit (ninetieth percentile temperature for August) and there was no
precipitation. For the less extreme case, I chose the same two week period for
2010. In contrast, the average daytime highs recorded at Balcones for this period
were 97 degrees Fahrenheit (approximately the median August temperature) and
there was over an inch of rainfall on September 3, 2010 (Table 3.3).

56
FUEL CONDITIONING PERIODS
RAWS Year Dates Average
Temperature Rain Events
Balcones 2010 August 11 –
September 4 97 degrees
Fahrenheit 1.2 inches on
September 3
Balcones 2011 August 11 –
September 4 103 degrees
Fahrenheit None
Table 3.3: Fuel conditioning periods tested in the scenarios.
3.3.1.3: MTT Ignitions and Simulation Duration
In order to determine the correct number of ignitions and appropriate
duration to use in the MTT simulations, a set of exploratory runs were
conducted. For each simulation, FlamMap MTT calculates the number of times a
cell has ignited and divides it by the total number of ignitions to give what they
define as the burn probability. This calculation can be easily misinterpreted. Take
an example where the user sets four ignitions that each burn for only one minute.
Under normal conditions, these fires will be very small in size and are unlikely to
spread to neighboring cells even of the neighboring cell is susceptible to burning.
Yet, FlamMap will calculate a value of 0.25 for each of the cells that had the
initial ignition and zero for all other cells. Thus the burn probability calculation is

57
relative to the number of ignitions and the area burned by each ignition. The
greater the number of ignitions and the longer the duration, the more accurate
the burn probability calculations will be.
I conducted multiple test simulations to set these parameters. Comparing
test simulations with one hundred, two hundred, three hundred, four hundred,
and five hundred ignitions running for two hours showed that results converge
above three hundred ignitions. Based on this I chose five hundred random
ignitions, at two hours, to be run for each of the eight wind speeds. The result
was a total of four thousand random ignitions.
3.3.1.4: Simulation Trials
For the FlamMap FB simulations, I designed eight scenarios combining
the two wind speeds, two fuel moisture states, and two conditioning periods
(Table 3.4). In order to assess the level of stochastic error between identical
simulations, each unique scenario was run three times. If FlamMap FB gets a
different measurement for a given cell between two identical runs, then that

58
amount of variation needs to be taken into account when measuring differences
between non-identical runs.
EIGHT WEATHER AND CLIMATE SCENARIOS
Scenario Number of
Repeats Wind Speed
Fuel Moisture /
Foliar Moisture
Fuel Conditioning
Period
1 3 5 Moderate / 100 8/22 to 9/4 2010
2 3 20 Moderate / 100 8/22 to 9/4 2010
3 3 5 Very Low / 60 8/22 to 9/4 2010
4 3 20 Very Low / 60 8/22 to 9/4 2010
5 3 5 Moderate / 100 8/22 to 9/4 2011
6 3 20 Moderate / 100 8/22 to 9/4 2011
7 3 5 Very Low / 60 8/22 to 9/4 2011
8 3 20 Very Low / 60 8/22 to 9/4 2011
Table 3.4: Eight scenarios tested in FlamMap Fire Behavior simulations.
The outputs for each run included: one raster with the predicted flame
lengths (in feet); one raster with the predicted rates of spread (in chains per hour,
one chain equals sixty-six feet); and one raster with the predicted crown fire
activity. Crown fire activity is given an integer score from zero to three, with zero

59
being no fire activity, one being surface fire activity only, two being passive
crown fire activity, and three being active crown fire activity. Table 3.5 lists the
final set of explanatory variables input into FlamMap FB and response variables
derived from FlamMap FB.
EXPLANATORY AND RESPONSE VARIABLES
Explanatory Variables Response Variables
Topography Vegetation Weather/Climate
Aspect Fuel Model Wind Speed Flame Length (feet)
Elevation Canopy Bulk
Density Fuel/Foliar Moisture Rate of Spread (chains per hour)
Slope Canopy Base Height Fuel Conditioning
Period Crown Fire Activity 0 = no fire activity 1 = surface fire activity 2 = passive crown fire activity 3 = active crown fire activity
Canopy Cover
Canopy Height
Table 3.5: FlamMap FB simulation explanatory and response variables.

60
Table 3.5 describes two main types of variables used in the FlamMap FB
modeling. The topography and vegetation, i.e. landscape, variables vary across
space but remain constant between runs (spatially dynamic but temporally
static). The opposite is true for the weather conditions. Weather remains constant
across space for each run but varies between runs (spatially static but temporally
dynamic). This distinction is important for Sub-questions 1b and 1c. While Sub-
question 1b questions the temporal effect of weather and climate between runs,
Sub-question 1c questions the spatial effect of landscape structure within runs.
The final resulting data collected from the FlamMap FB simulations is
over 152,000,000 measurements for each response variable for a total of over
457,000,000 data points.
For the MTT simulations, only one set of weather conditions were applied
with the exception of the eight wind directions. The simulation was deigned to
mimic the September 4, 2011 weather conditions. To do so, the fuel moisture
state was set to very low and the fuel conditioning period spanned from August
22, 2011 to September 4, 2011. The wind speeds on September 4, 2011 did reach
seventeen to twenty-four miles per hour according to the Travis County Fire
Marshal (Lee 2012). However it is unlikely that these wind speeds were

61
sustained for two hours straight. Balcones RAWS recorded a wind speed or
fourteen to sixteen miles per hour for several consecutive hours on September 4,
2011. Thus, for the sake of making conservative predictions, fourteen miles per
hour was chosen for the two hour simulations.
Table 3.6 summarizes the parameters of the MTT simulations. The results
include burn probability raster data files indicating the number of times each cell
burned and vector files of burn perimeters from the four thousand ignitions.
FlamMap FB simulations for these two study extents were simultaneously run
with the MTT simulations. The results of the FlamMap FB do not change with
wind direction. One flame length raster and one crown fire activity raster was
stored for each of the two WUI communities.

62
FLAMMAP MINIMUM TRAVEL TIME SIMULATION PARAMETERS
Fuel / Foliar Moisture Very Low / 60
Fuel Conditioning Period August 22 to September 4, 2011
Wind Speed 14 miles per hour
Wind Direction North, northeast, east, southeast, south,
southwest, west, northwest
Number of Simulations 8
Number of Ignitions/Simulation 500
Duration of Each Simulation 6 hours
Table 3.6: Parameters used in the FlamMap MTT simulations.
3.3.2 DATA ON RESPONSE CAPACITY AND HAZARD MITIGATION
Multiple sources were consulted to obtain data on the response capacity
and adopted mitigation measures of each focal community. When possible,
published data from public records and agency websites were used. For
unpublished information, semi-structured interviews were conducted. Table 3.7
lists the published data compiled and Table 3.8 lists the organizations and
interviewees that participated in the semi-structured interviews.

63
PUBLISHED DATA ON RESPONSE CAPACITY AND MITIGATION
Data Source Date
Accessed Web Address
Fire Department
Budgets, Staff,
Ratings and
Response Statistics
Travis County ESD
#3 July 2013 http://www.oakhillfire.org/
Boerne Fire
Department July 2013 http://www.ci.boerne.tx.us/index.aspx?nid=85
STARFlight Rescue
Service
Travis County
STARFlight July 2013 https://starflight.traviscountytx.gov/
Emergency
Notification
Systems
Capital Area
Council of
Governments
July 2013 http://www.capcog.org/
Alamo Area Council
of Governments July 2013 http://www.aacog.com/
Emergency
Management Plans
and Assessments
Travis County
Emergency
Management
July 2013 http://www.co.travis.tx.us/emergency_servic
es/emergency_management.asp
Kendall County
Office of Emergency
Management
July 2013 http://www.co.kendall.tx.us/default.aspx?Ken
dall_County/Emergency%20Management
Participation in
Firewise Programs
Firewise
Communities July 2013 http://www.firewise.org/
Table 3.7: Data types and sources on response capacity and hazard mitigation in
the two WUI study regions.

64
PARTICIPANTS OF SEMI-STRUCTURED INTERVIEWS
Level of
Organization Organization Name, Title Date(s) of Contact
Fire Department Travis County ESD
#3 Kurstin Bluemel, Office
Administrator July 12, 2013
Fire Department Boerne Fire
Department
April Bueno, Administrative
Assistant
Ray Hacker, Assistant Fire
Chief
July 12, 2013
August 2, 2013
County Travis County
Emergency
Management
Stacy Moore, Assistant
Emergency Management
Coordinator
July 15, 2013
July 22, 2013
County
Kendall County
Office of
Emergency
Management
Jeffery Fincke, Kendall
County Fire Marshal July 15, 2013
State Texas Forest
Service William Boettner, WUI
Specialist July 12, 2013
Table 3.8: Organizations and individuals that participated in the semi-structured
interviews.
The questions asked of interviewees depended upon the level of
organization they represented. The two fire departments, upon which the study

65
areas were defined, were consulted on three broad categories. First they were
asked about the protocol for cooperating with surrounding fire departments.
Second they were asked about methods employed to notify and evacuate
residents, if necessary. Third they were asked about the existence of any fuel
management practices in the jurisdiction.
Interviewees from county organizations were asked questions based on
two broad categories: whether they have in the past or plan to in the future
develop a CWPP; and the types of fuel management programs that exist at the
county level, if any. The final interviewee, a WUI specialist from the Texas Forest
Service, the organization that facilitates the Firewise process in Texas, was asked
about the participation of Texas communities in the Firewise program, the
protocol for doing so, and how communities are informed about it.
3.4: DATA ANALYSIS
The data analyses used in this thesis are explained in the three sections
below. Each section specifically addresses one of the three research questions
posed at the beginning of the chapter. The first section describes the suite of

66
analytical methods used to predict wildfire behavior in the full eastern Edwards
Plateau extent. The second section describes the analysis of predicted fire
behavior and susceptibility in the two focal WUI communities. The third section
describes how the response capacity and mitigation data were synthesized.
3.4.1: FLAMMAP SIMULATIONS: EASTERN EDWARDS PLATEAU
One of the benefits of studying simulated data that were obtained in a
fixed, user-controlled environment is that analytical methods can be
straightforward. All variables used by FlamMap FB to measure fire behavior are
known to the user and explanatory variables can be easily isolated to test their
individual effect.
3.4.1.1: Data Preparation
Before data could be analyzed, the output data files from FlamMap FB
were assigned the spatial reference North American Datum 1983 Albers equal-
area conic projection, using ArcGIS 10.0. Statistical modeling, which was

67
performed using R statistical software, was not possible on such a large dataset.
Thus a subset of one thousand cells was randomly selected using ArcGIS and the
data within the one thousand cells were transferred to a spreadsheet in order to
perform analysis of covariance (ANCOVA) in R. Of these one thousand data
points, 118 represented cells that were defined as non-burnable (roads, water,
bare ground, etc.) by the fuel models and were ignored by FlamMap FB. These
118 points were omitted from analysis. The remainder was a subset of 882 data
points.
For analysis of changes in crown fire activity, the dataset was reduced
again. Crown fire activity is only possible on data points with tree canopies. Of
the 882 data point subset, 421 data points had zero percent canopy cover and
were omitted from analysis on changes in crown fire activity. The remainder was
a 461 data point subset that is used for ANCOVA on crown fire activity only.
3.4.1.2: Measuring Stochastic Error
ArcGIS 10.0 was used to calculate the change between repeated runs. Each
original raster was subtracted from its repeat to calculate differences between

68
runs. Any stochastic error detected would alter the interpretation of further
simulations. In other words, if there is an increase in flame length for a given cell
between Scenario 1 and Scenario 2, is it due to the increase in wind speed or just
stochastic error made by the instrument? It is important to state now (to
legitimize the methods used below) that there was no stochastic error in any of
the repeated runs. Every cell in every repeat had identical measurements. This
indicates that any change measured in a cell between scenarios must be
attributed to the change in scenario, not due to variation between measurements.
3.4.1.3: Expected Fire Behavior of the Eight Scenarios
To determine the range of expected flame lengths, rates of spread, and
crown fire activity resulting from the eight scenarios, the results of each scenario
were displayed in a series of maps and charts for each of the three response
variables. Flame lengths were symbolized based on the divisions described in the
NWCG Incident Response Pocket Guide for tactical interpretations of flame
lengths. Rate of spread was symbolized based on divisions that easily translate to
miles per hour: eighty chains per hour is one mile per hour, forty is one half,

69
twenty is one quarter, and ten chains per hour is one eighth of one mile per hour.
Crown fire activity was symbolized based on no fire activity, surface activity
only, passive crown fire activity, and active crown fire activity.
3.4.1.4: Effect of Weather and Climate Variables
To measure the impact of each weather and climate condition, the
scenarios were paired in ways that held two variables constant while the variable
of interest changed. For example, Scenarios 1 and 2 only differ in wind speed, all
other settings are fixed. Thus any differences detected between the two scenarios
would be due to the change in wind speed alone. The weather and climate
conditions were tested using two combinations each, one combination represents
mild fixed conditions and the other combination represents extreme fixed
conditions. Table 3.9 lists the comparisons.

70
SCENARIO COMPARISONS TO TEST THE EFFECT OF WEATHER
To Test the Effect of Wind
Wind = 5 Wind = 20 Fixed Conditions
Scenario 1 Scenario 2 Moderate Fuel Moisture
2010 Fuel Conditioning Period
Scenario 7 Scenario 8 Very Low Fuel Moisture
2011 Fuel Conditioning Period
To Test the Effect of Fuel Moisture
Fuel Moisture =
Moderate
Fuel Moisture = Very
Low Fixed Conditions
Scenario 1 Scenario 3 5 mph Wind Speed
2010 Fuel Conditioning Period
Scenario 6 Scenario 8 20 mph Wind Speed
2011 Fuel Conditioning Period
To Test the Effect of Fuel Conditioning
Fuel Conditioning Year
= 2010
Fuel Conditioning
Year = 2011 Fixed Conditions
Scenario 1 Scenario 5 5 mph Wind Speed
Moderate Fuel Moisture
Scenario 4 Scenario 8 20 mph Wind Speed
Very Low Fuel Moisture
Table 3.9: Scenario comparisons testing the effect of weather and climate.
Differences between scenarios were calculated using ArcGIS 10.0. As
mentioned above, since i) simulations are conducted in a controlled

71
environment, ii) the weather conditions are static across space for each run, and
iii) there is no stochastic error made by the instrument, any difference between
runs based on a single variable is due to that variable alone. In return, no
additional measures are necessary to measure statistical significance of the
impact of weather conditions on flame length, rate of spread, or crown fire
activity.
3.4.1.5: Effect of Landscape Variables
ANCOVA multiple linear regression modeling was used to evaluate the
correlation between landscape structure and flame length, rate of spread, and
crown fire activity across the spatial extent. Explanatory variables included the
same set of eight landscape variables used in FlamMap FB. The response
variables included flame length, rates of spread, and crown fire activity observed
in Scenario 8. A separate ANCOVA regression model was built for each response
variable. Models including interaction terms between all explanatory variables
were built and fitted manually through stepwise model selection using F-tests to
measure goodness of fit and compare nested models. The fitted models were

72
then interpreted to identify the landscape variables, or their interactions, that
correlate with high flame lengths, high rates of spread, and active crown fire
activity.
3.4.2: FLAMMAP SIMULATIONS: TRAVIS COUNTY ESD #3 AND BOERNE
Analysis of the FlamMap FB and MTT simulations within the two WUI
community extents was performed entirely in ArcGIS 10.0. Output data files
from FlamMap were assigned with the North American Datum 1983 Albers
equal-area conic projection. The vector files containing the burn perimeters were
combined to show the total area that burned at least once during all of the
simulations. The number of times each cell burned for each of the eight
simulations were summed and divided by four thousand to derive the total
number of times each cell burned per ignition. The resulting data range was then
divided into quintiles, giving five categories from lowest to highest number of
burns per ignition. New rasters symbolized by quintile were then produced to
show the spatial distribution of the ranked data.

73
Raster data files containing flame lengths were symbolized by showing
only flame lengths over eleven feet to show the areas exhibiting the most extreme
category of flame lengths. Similarly, raster data files of crown fire activity were
symbolized to show only the areas with exhibiting active crown fires.
3.4.3: RESPONSE CAPACITY AND MITGATION: TRAVIS COUNTY ESD #3
AND BOERNE
The data on community wildfire response capacity and measures to
reduce wildfire hazards compiled for the two focal WUI study areas were
synthesized into two categories and then compared and interpreted. The first
category contains indicators of how well-equipped each jurisdiction is to
responding to a wildfire hazards that materialize. These indicators include: how
residents are informed about the hazard; fire department statistics including the
number of paid and volunteer firefighters on staff, annual budgets, Insurance
Services Office (ISO) ratings, and average response times; the cooperation of each
fire department with outside suppression resources; and the distance of those
resources from the jurisdiction.
74
The second category contains indicators that local governments and
residents have adopted, or are considering adopting, plans, programs, or
strategies aimed at reducing wildfire hazards before they materialize. These
indicators include: participation in the CWPP program; participation in Firewise
programs; and the organization of fuel management programs.
3.5: ASSUMPTION AND LIMITATIONS
While there are many benefits to using FlamMap simulation software,
there are also many assumptions and limitations that need to be understood
before interpreting simulation results. First, the landscape input data acquired
from the LANDFIRE database may incorrectly describe some of the data cells.
LANDFIRE is an interagency mapping program sponsored by the Department of
the Interior to create digital files of fuel and vegetation characteristics for the
United States (www.landfire.gov). Data products created by LANDFIRE utilize
spatial prediction models along with expert knowledge to create data layers on
vegetation and fuels, yet there is no guarantee that the landscape measurements
are correct for every cell. Due to the unavailability of superior data sets for this

75
region that are compatible with FlamMap, LANDFIRE data sets are the only
option for this study.
Second, the resolution of any raster calculates an average of actual values
within one grid cell. The resolution used for this study, thirty meters, means that
all the existing spatial variation within a thirty by thirty meter grid cell is
deduced to a single value. This leads to potential problems with predicting fire
behavior at very small extents, such a one acre.
Fire behavior predictions are specific measurements of how a fire would
behave for a static moment in time, when the actual conditions exactly match the
simulated settings. A wildfire in real time is constantly fluctuating due to
changes in wind speed, wind direction, and temperature, as well as how fire is
behaving around it. Furthermore, the burn probabilities calculations are difficult
to interpret as discussed above. The process of MTT simulations highlights
common pathways that hypothetical fires would take under given conditions.
More common pathways receive higher scores. This does not mean that areas
with low scores are not going to burn; it means that they are less likely to burn in
relation to the surrounding conditions.

76
Finally, the results of the MTT simulations cannot predict structure
ignitability. How close a structure is to the WUI is only a broad indication of how
likely it is to burn in the event of a fire. In actuality, the ignitability of a structure
is influenced by building materials and combustible material around the
structure (Cohen 2000).

77
CHAPTER 4: RESULTS
4.1: INTRODUCTION TO CHAPTER 4
Chapter 4 provides results from the methods described in Chapter 3. The
three succeeding sections directly refer to each of the main research questions.
The first section presents the results of the FlamMap simulations under eight
scenarios for the eastern Edwards Plateau extent. This includes: simulation
outputs, assessments of how weather and climate variables influenced the
response variables, and the ANCOVA results highlighting the relationship
between response and landscape variables.
The second section presents the results of the FlamMap simulations for
the two WUI communities within the eastern Edwards Plateau extent delineated
by the Travis County ESD #3 and Boerne City Fire Department jurisdictions.
Simulation modeling took place under one set of conditions designed to mimic
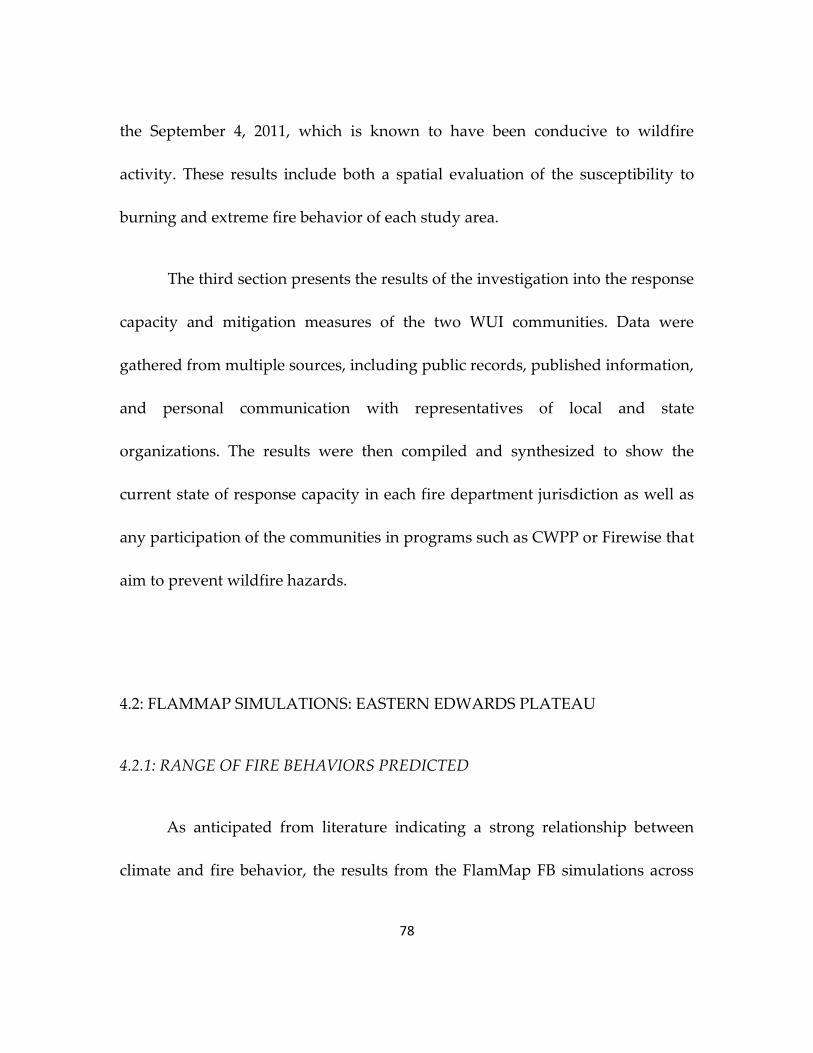
78
the September 4, 2011, which is known to have been conducive to wildfire
activity. These results include both a spatial evaluation of the susceptibility to
burning and extreme fire behavior of each study area.
The third section presents the results of the investigation into the response
capacity and mitigation measures of the two WUI communities. Data were
gathered from multiple sources, including public records, published information,
and personal communication with representatives of local and state
organizations. The results were then compiled and synthesized to show the
current state of response capacity in each fire department jurisdiction as well as
any participation of the communities in programs such as CWPP or Firewise that
aim to prevent wildfire hazards.
4.2: FLAMMAP SIMULATIONS: EASTERN EDWARDS PLATEAU
4.2.1: RANGE OF FIRE BEHAVIORS PREDICTED
As anticipated from literature indicating a strong relationship between
climate and fire behavior, the results from the FlamMap FB simulations across

79
the eastern Edwards Plateau varied significantly between conditions mimicking
an average September day to an overly hot, dry, and windy September day. As a
refresher, Table 4.1 lists the specific conditions that were tested in the eight
scenarios.
EIGHT WEATHER AND CLIMATE SCENARIOS
Scenario Wind Speed (mph) Fuel Moisture /
Foliar Moisture
Fuel Conditioning
Period
1 5 Moderate / 100 8/22 to 9/4 2010
2 20 Moderate / 100 8/22 to 9/4 2010
3 5 Very Low / 60 8/22 to 9/4 2010
4 20 Very Low / 60 8/22 to 9/4 2010
5 5 Moderate / 100 8/22 to 9/4 2011
6 20 Moderate / 100 8/22 to 9/4 2011
7 5 Very Low / 60 8/22 to 9/4 2011
8 20 Very Low / 60 8/22 to 9/4 2011
Table 4.1: Eight scenarios tested in FlamMap Fire Behavior simulations for the
eastern Edwards Plateau extent.
Figures 4.1, 4.2, and 4.3 display the simulation outputs of flame lengths
across the extent in the eight scenarios. Ninety-three percent of the extent

80
exhibited flame lengths under one foot in height in Scenario 1. In contrast, forty-
four percent of the extent exhibited flame lengths over eleven feet tall and
another forty-four percent were between four and eight feet tall in Scenario 8
(Figure 4.1). The maps provided in Figures 4.2 and 4.3 show that as weather and
climate conditions became more conducive to extreme fire behavior, the areas
along the Balcones Escarpment exhibited the highest concentration of flame
lengths over eleven feet.
Figure 4.1: Proportion of data in each flame length category per scenario.
0%
10%
20%
30%
40%
50%
60%
70%
80%
90%
100%
1 2 3 4 5 6 7 8
PROPORTION OF FLAME LENGTHS PER SCENARIO
11+ feet
8 to 11 feet
4 to 8 feet
1 to 4 feet
0 to 1 feet

81
Figure 4.2: FlamMap results for flame length, Scenario 1 through Scenario 4.

82
Figure 4.3: FlamMap results for flame length, Scenario 5 through Scenario 8.

83
Figures 4.4, 4.5, and 4.6 display the simulation outputs of rates of spread
across the extent in the eight scenarios. The unit for describing rates of fire
spread is chains per hour, which is sixty-six feet per hour. The symbology used
in the maps is conveniently translated into miles per hour: ten chains equals one
eighth of one mile, twenty chains is one quarter, forty is one half, and eighty
chains equals one mile. One hundred percent of the extent in Scenario 1 exhibited
rates of spread under ten chains per hour. In contrast thirty-eight percent of the
extent exhibited rates of spread over eighty chains per hour and another fifty
percent exhibited rates between forty and eighty chain per hour in Scenario 8. As
weather and climate conditions became more conducive to increased fire
behavior, the northwest portion of the extent, farther from the dense canopies
along the escarpment, exhibited the highest rates of spread.

84
Figure 4.4: Proportion of data in rate of spread category per scenario.
0%
10%
20%
30%
40%
50%
60%
70%
80%
90%
100%
1 2 3 4 5 6 7 8
PROPORTION OF RATES OF SPREAD PER SCENARIO
80+ ch/hr
40 to 80 ch/hr
20 to 40 ch/hr
10 to 20 ch/hr
0 to 10 ch/hr

85
Figure 4.5: FlamMap results for rate of spread, Scenario 1 through Scenario 4.

86
Figure 4.6: FlamMap results for rate of spread, Scenario 5 through Scenario 8.

87
Figures 4.7, 4.8, and 4.9 display the simulation outputs of crown fire
activity across the extent in the eight scenarios. Crown fire activity is categorized
in three levels: level one is surface fire only, level two is passive crown fire, and
level three is active crown fire. In Scenario 1, sixty-three percent of the extent
with canopy cover exhibited surface fires only and the remaining extent with
canopy cover exhibited passive crown fires. In contrast, fifty-six percent of the
extent with canopy cover exhibited active crown fires and an additional forty
percent exhibited passive crown fires, for a total of ninety-six percent of the
extent with canopy experiencing some form of crown fire activity in Scenario 8.
Similar to the results for flame length, a concentration of active crown fires took
place along the Balcones Escarpment as the weather and climate conditions
became more conducive to fire.

88
Figure 4.7: Proportion of data in crown fire activity category per scenario.
0%
10%
20%
30%
40%
50%
60%
70%
80%
90%
100%
1 2 3 4 5 6 7 8
PROPORTION OF CROWN FIRE ACTIVITY PER SCENARIO
Level = 3
Level = 2
Level = 1
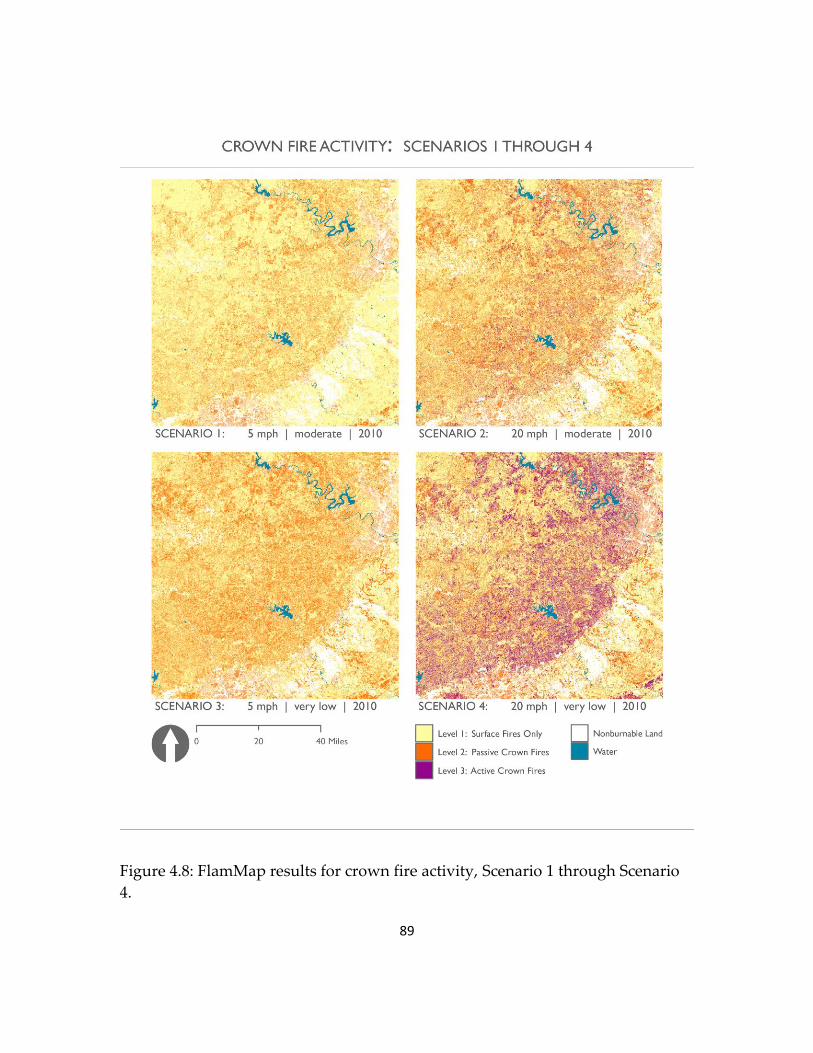
89
Figure 4.8: FlamMap results for crown fire activity, Scenario 1 through Scenario
4.

90
Figure 4.9: FlamMap results for crown fire activity, Scenario 5 through Scenario
8.

91
4.2.2 EFFECT OF WEATHER AND CLIMATE ON FIRE BEHAVIOR
The three explanatory variables, fuel moisture, wind speed, and fuel
conditioning were evaluated for their independent contribution to increasing
flame lengths, rates of spread, and crown fire activity. The effect of each
explanatory variable was measured by comparing scenarios where the variable
of interest changed while all other variables remained constant.
Figure 4.10 displays how a change in each explanatory variable increased
flame lengths. When fuel moisture was decreased from the moderate state to the
very low state and wind speed and fuel conditioning were held at mild constants
(five miles per hour, 2010 fuel conditioning), flame lengths increased 1.2 feet on
average. When the fuel moisture decreased and wind speed and fuel
conditioning were held at extreme constants the increase in flame height was 14.3
feet on average. When wind speed was increased from five to twenty miles per
hour the average increase was 4.1 feet under mild conditions and 19.6 feet under
extreme constants. When fuel conditioning was changed from 2010 conditions to
2011 conditions, the average increase was 0.6 feet under mild constants and 10.1
feet under extreme constants.

92
Figure 4.10: Frequency distribution of increased flame lengths in feet.

93
These six results for the increase in flame lengths as a result of a change in
weather conditions shows that while each variable has the ability to increase
flame heights alone, it also has an interactive effect with the other two
conditions. The same was true for rates of spread. Figure 4.11 displays the
frequency distributions of increases in rates of spread that resulted from
changing the three explanatory variables. A decrease in fuel moisture when wind
speed and fuel conditioning were at mild states resulted in an average increase of
4.4 chains per hour, while an average increase of 42.9 chains per hour occurred
under extreme constants. When wind speed was increased, the average rate of
spread increased 7.2 chain per hour under mild constants and 56.4 chains per
hour under extreme constants. When fuel conditioning period was changed from
2010 to 2011, the average increase in rate of spread was 1.5 chains per hour under
mild constants and 21.4 chains per hour under extreme constants.
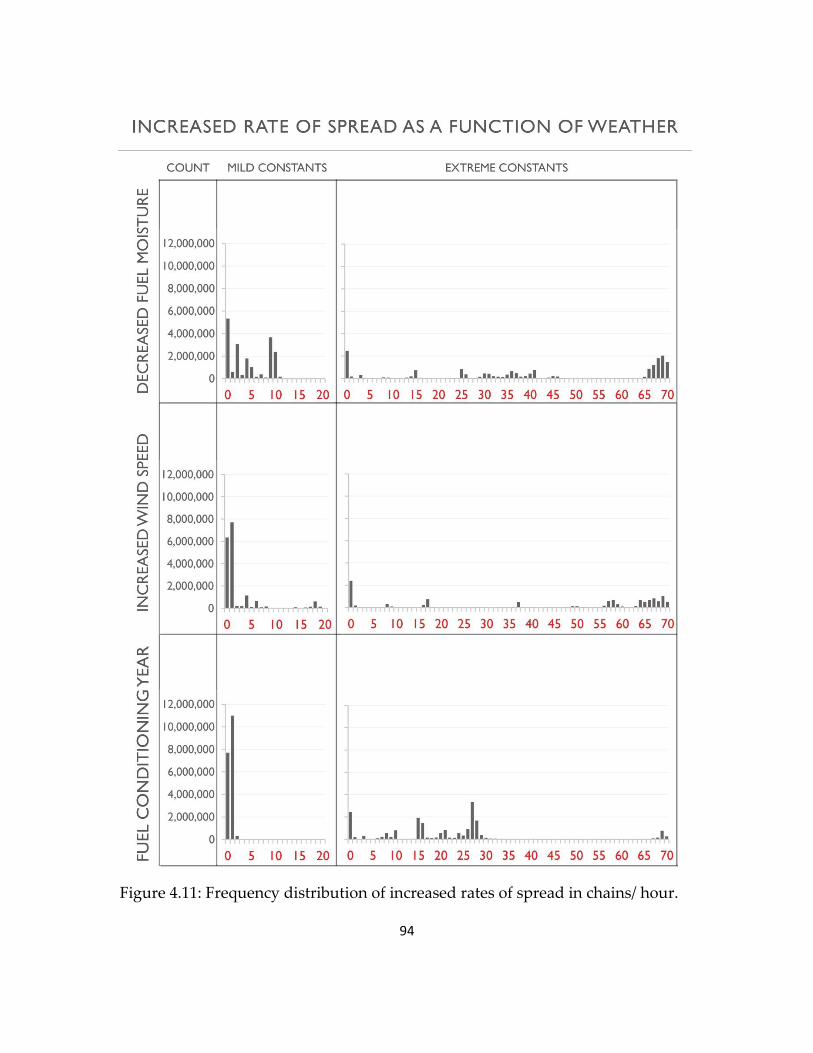
94
Figure 4.11: Frequency distribution of increased rates of spread in chains/ hour.

95
Level three crown fire activity showed similar trends as flame lengths and
rates of spread when evaluated for the impact of weather. Because crown fire
activity is not a continuous variable, the increase in activity can only be
expressed in terms of percentage change between scenarios. Table 4.2 shows the
change in level two, level three, and total crown fire activity as a result of
decreased fuel moisture, increased wind speed and a change in fuel
conditioning.
INCREASED CROWN FIRE ACTIVITY AS A FUNCTION OF WEATHER
Explanatory
Variable Constants Level 2 Level 3
Total Increase in Crown
Fire Activity
Fuel Moisture Mild 31% 0% 31%
Extreme -13% 42% 29%
Wind Speed Mild 20% 10% 30%
Extreme -33% 56% 23%
Fuel Conditioning Mild 31% 0% 31%
Extreme -3% 20% 17%
Table 4.2: The change in level two, level three, and total crown fire activity.
96
Crown fire activity increased in each test with total crown fire activity
increasing between seventeen and thirty-one percent. When constants are held
at their extreme values, the passive crown fires decrease and active crown fires
increase forty-two percent, fifty-six percent, and twenty percent when fuel
moisture is decreased, wind speed is increased, and fuel conditioning is changed
from 2010 to 2011, respectively.
4.2.3 EFFECT OF VEGETATION AND TOPOGRAPHY ON FIRE BEHAVIOR
In addition to the variation in fire behavior across weather and climate
scenarios, the FlamMap FB outputs displayed variation in fire behavior across
the landscape within each scenario. Analysis of Covariance was used to identify
the landscape variables that correlated with the observed variation in Scenario 8.
Explanatory variables in the linear models included four continuous variables
measuring canopy characteristics, one categorical variable of fuel models, and
three continuous variables measuring topography (Refer to Table 3.1 in the
Research Design chapter for more detail). Results of the ANCOVA linear models
indicated that fuel model and percent canopy cover explained the most variation

97
in response variables across the eastern Edwards Plateau extent. Table 4.3 lists
the nine fuel model categories and their descriptions as defined by Scott and
Burgan (2005).
FUEL MODELS PRESENT IN THE EASTERN EDWARDS PLATEAU
Model Fuel Type Fuel Description
GR1 Grass Grass is short, patchy, and possibly heavily grazed. Spread rate
moderate; flame length low.
GR2 Grass Moderately coarse continuous grass, average depth about 1 foot.
Spread rate high; flame length moderate.
GS1 Grass-Shrub Shrubs are about 1 foot high, low grass load. Spread rate
moderate; flame length low.
GS2 Grass-Shrub Shrubs are 1 to 3 feet high, moderate grass load. Spread rate
high; flame length moderate.
TU1 Timber-Understory Fuel bed is low load of grass and/or shrub with litter. Spread rate
low; flame length low.
TL2 Timber Litter Low load, compact. Spread rate very low; flame length very low.
TL3 Timber Litter Moderate load, less compact. Spread rate moderate; flame length
low.
TL5 Timber Litter Moderate load conifer litter. Spread rate very low; flame length
low.
TL6 Timber Litter High load conifer litter; light slash or mortality fuel. Spread rate
low; flame length low.
Table 4.3: Scott and Burgan (2005) fuel model descriptions. Only fuel models
present in the eastern Edwards Plateau study extent are listed.

98
Table 4.4 lists the fitted ANCOVA model results for the effect of landscape
variables on flame lengths. The variables that explained the most variation in
flame lengths were fuel model, canopy cover, slope, and the interaction between
fuel model and canopy cover (adjusted R-squared = 0.97). The coefficients
indicate the following: grass and grass-shrub fuel models resulted in higher
surface flame lengths, while the timber and timber-understory variables had
lower surface flame lengths; increased slopes corresponded to increased fuel
lengths; and the impact of canopy cover increased or decreased flame lengths
depending on the fuel model with which it was interacting. For instance, the fuel
model GS1 had a predicted flame length of approximately six feet minus 0.064
feet for every percentage point of canopy cover present (e.g. subtract 2.24 feet for
thirty-five percent canopy cover). In contrast the fuel model TL6 had a predicted
flame length of approximately two feet plus 0.0013 feet for every percentage
point of canopy cover present (e.g. add 0.1 feet for seventy-five percent canopy
cover).

99
ANCOVA RESULTS: FLAME LENGTH
Variable Coefficient Significance
(Intercept) 2.5273 0.01 ***
GR2 5.6041 0.01 ***
GS1 3.5069 0.01 ***
GS2 6.8441 0.01 ***
TL3 -7.9222 0.01 ***
TL5 -9.1346 0.01 ***
TL6 -0.7138 0.10 *
TU1 -1.2520 0.05 **
Canopy Cover 0.1189 0.05 **
Slope 0.1034 0.01 ***
Aspect 0.0008 0.05 **
GS1 * Canopy Cover -0.1828 0.01 ***
GS2 * Canopy Cover -0.1009 0.05 **
TL6 * Canopy Cover -0.1176 0.05 **
TU1 * Canopy Cover -0.1232 0.05 **
Canopy Cover * Slope -0.0005 0.05 **
Elevation * Slope -0.0002 0.01 ***
Slope * Aspect -0.0001 0.05 **
Table 4.4: ANCOVA results predicting Scenario 8 flame lengths.

100
Given these results, simple univariate plots of flame lengths as a function
of fuel model (Figure 4.12) and flame lengths as a function of canopy cover
(Figure 4.13) were produced to better illustrate these relationships. Figure 4.12
shows that the GS2 fuel model resulted in the highest median flame heights
(approximately nine feet) but that GR1 had the highest 1.5 interquartile range,
reaching over sixteen feet. Of the timber fuel models, TL6 had the highest
predicted flame heights of two to three feet.
Figure 4.13 shows that canopy covers of fifteen percent to forty-five
percent corresponded with higher flame lengths, up to fourteen feet. Areas with
no canopy cover corresponded to higher flame lengths than those with fifty-five
to eighty-five percent canopy cover, which did not surpass three feet. Two of the
four data points with fifteen percent cover revealed the highest recorded flame
lengths for this data set.

101
Figure 4.12: ANCOVA
results of flame lengths
as a function of fuel
model for Scenario 8
data.
Figure 4.13:
ANCOVA results
of flame lengths
as a function of
percent canopy
cover for Scenario
8 data.

102
Similar to the ANCOVA results for flame lengths, the variables that
explained the most variation in rates of spread were fuel model, canopy cover,
and the interaction between fuel model and canopy cover (adjusted R-squared =
0.99). The grass and grass-shrub fuel models corresponded with higher rates of
spread while timber fuel models did not. Slope and canopy cover are both
individually influential in the model, and the interaction between fuel models
and canopy cover could either increase or decrease the rate of spread depending
on the interacting fuel model. Table 4.5 lists the ANCOVA coefficients that
resulted from the fitted model.
Figures 4.14 and 4.15 illustrate the univariate relationships between rate of
spread and fuel model and rate of spread and canopy cover, respectively. Fuel
Model GR2 corresponded to the highest rates of spread (> 120 chains/hour), with
all grass and grass-shrub fuel models resulting in higher rates of spread than the
timber fuel models, which stayed below ten chains per hour. In contrast to the
relationship between canopy cover and flame heights, the highest rates of spread
correlate with a zero percent canopy cover. As canopy cover increased, rate of
spread decreased. Canopy cover over fifty-five stayed below ten chains per hour.

103
ANCOVA RESULTS: RATE OF SPREAD
Variable Coefficient Significance
(Intercept) 30.0559 0.01 ***
GR2 85.1464 0.01 ***
GS1 17.1471 0.01 ***
GS2 44.3127 0.01 ***
TL2 -29.2534 0.01 ***
TL6 -24.3811 0.01 ***
TU1 -28.3001 0.01 ***
Canopy Cover -0.4158
Slope 0.3395 0.05 **
Aspect 0.0129 0.01 ***
GR2 * Canopy Cover -1.7608 0.01 ***
GS1 * Canopy Cover -0.5189 0.10 *
GS2 * Canopy Cover -1.0613 0.01 ***
TL2 * Canopy Cover 0.3823
TL6 * Canopy Cover 0.3317
TU1 * Canopy Cover 0.3927
Canopy Cover * Elevation 0.0001 0.10 *
Canopy Cover * Aspect -0.0001 0.01 ***
Elevation * Slope -0.0007 0.05 **
Slope * Aspect -0.0007 0.10 *
Table 4.5: ANCOVA results predicting Scenario 8 rates of spread.

104
Figure 4.14: ANCOVA
results of rates of spread
as a function of fuel
model for Scenario 8
data.
Figure 4.15: ANCOVA
results of rates of spread
as a function of percent
canopy cover for
Scenario 8 data.

105
Table 4.6 displays the results of the ANCOVA model for the effect of
landscape variables on crown fire behavior. As stated in Chapter 3, since crown
fire activity cannot occur within cells with zero percent canopy cover, cells
without canopy cover were omitted from the analysis. The fitted model included
multiple explanatory variables with poor significance values. However the
model performed significantly better by retaining them.
In Scenario 8, sixty-two percent of the grid cells with canopy cover
exhibited active crown fire activity and thirty-five percent exhibited passive
crown fire activity. Only three percent of the grid cells with canopy cover
resulted in surface fire only. With that in mind, this ANCOVA detected the
landscape variables that led to active versus passive crown fires. Fuel model,
slope, and canopy cover were influential in crown fire activity. Unlike the
previous models, elevation and aspect were also influential in crown fire activity
(adjusted R-squared = 0.77). The large number of interactions complicates the
model's interpretation. However the coefficients indicate that fuel model, slope,
fuel model-canopy cover interactions, and the fuel model-slope interactions had
the greatest correlation with active crown fire activity.

106
ANCOVA RESULTS: CROWN FIRE ACTIVITY
Variable Coefficient Significance
(Intercept) 0.5528
GR2 -0.8653 0.10 *
GS1 0.8082 0.05 **
GS2 -2.8166
TL2 0.6139
TL5 1.5324 0.01 ***
TL6 -0.2682
TU1 0.8003 0.05 **
Canopy Cover -0.0082 0.05 **
Elevation 0.0028 0.01 ***
Slope 0.2545 0.01 ***
Aspect -0.0021 0.05 **
GR2 * Canopy Cover 0.0745 0.01 ***
GS2 * Canopy Cover 0.1231 0.01 ***
TL2 * Canopy Cover 0.0279 0.01 ***
TL6 * Canopy Cover 0.0477 0.01 ***
GR2 * Elevation -0.0023 0.01 ***
GS2 * Elevation -0.0023 0.10 *
TL2 * Elevation -0.0025 0.01 ***
TL6 * Elevation -0.0019 0.01 ***
GR2 * Slope -0.1662 0.01 ***
GS2 * Slope -0.1109 0.05 **
TL6 * Slope -0.0926 0.01 ***
GR2 * Aspect 0.0023 0.01 ***
TL2 * Aspect 0.0026 0.01 ***
TL6 * Aspect 0.0024 0.01 ***
Canopy Cover * Slope -0.0028 0.01 ***
Slope * Aspect 0.0001 0.05 **
Table 4.6: ANCOVA results predicting Scenario 8 crown fire activity.

107
Figures 4.16 and 4.17 provide a closer look at the univariate relationship
between crown fire activity and fuel model as well as between crown fire activity
and canopy cover, respectively. Since crown fire activity is one of only three
ordered, categorical variables, the box plots tended to collapse into one value.
Nonetheless, the plots illustrate trends. The grass and grass-shrub fuel models in
Figure 4.17 predominantly resulted in passive crown fire activity (with the
exception of GR2) while the timber fuel models TL2, TL5, and TL6 corresponded
with active crown fire activity. Figure 4.18 illustrates a correlation between
canopy cover of fifteen percent to thirty-five percent and passive crown fires.
Canopy cover of forty-five percent to eighty-five percent correlated with active
crown fires.
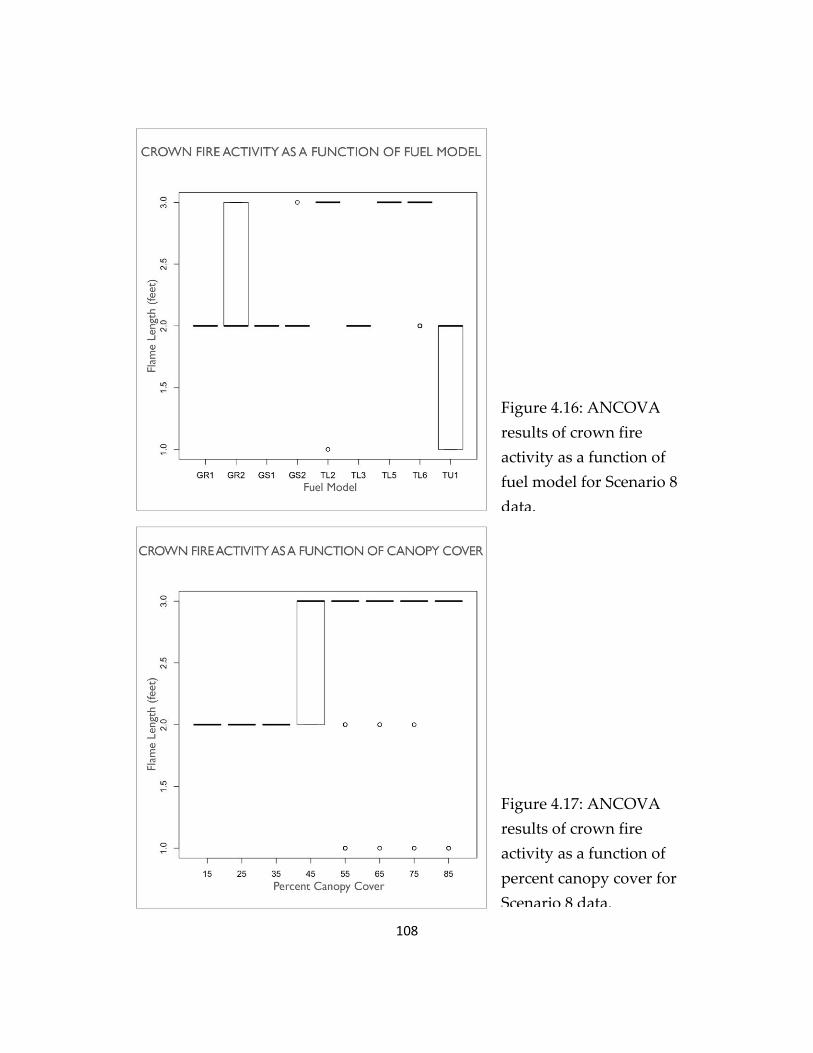
108
Figure 4.16: ANCOVA
results of crown fire
activity as a function of
fuel model for Scenario 8
data.
Figure 4.17: ANCOVA
results of crown fire
activity as a function of
percent canopy cover for
Scenario 8 data.

109
4.3: FLAMMAP SIMULATIONS: TRAVIS COUNTY ESD #3 AND BOERNE
4.3.1: BURN SUSCEPTIBILITY
FlamMap MTT simulations mimicking September 4, 2011 weather
conditions revealed patterns within the landscape of low to high susceptibility to
fire as a result of four thousand ignitions that ran for two hours each. Ninety-
nine percent of area within the Travis County ESD #3 study extent burned at
least once during the MTT simulations. Twenty-two percent of the study area
burned in the highest quintile (the top twenty percent of the data), while seven
percent burned in the lowest quintile (the bottom twenty percent of the data).
Overall, sixty-nine percent of the Travis County ESD #3 study area burned in the
top three quintiles.
Within the Boerne City Fire Department study area, eighty-eight percent
burned at least once during the simulations. Seven percent burned in the highest
quintile, and forty-nine percent burned in the lowest quintile. In contrast to the
Travis County ESD #3 study area, only twenty-eight percent of the Boerne study
extent burned in the top three quintiles. Table 4.7 provides a comparison of these
data. Figures 4.18 and 4.19 provide maps of the spatial distribution of burn

110
susceptibility in the Travis County ESD #3 extent and the Boerne extent,
respectively.
PERCENTAGE OF STUDY AREA SUSCEPTIBLE TO BURNING
Travis County ESD #3 Boerne
Percentage of
Area that Burned
At Least Once
99% 88%
Percentage of
Study Area Cumulative Percentage
Percentage of
Study Area Cumulative Percentage
Fifth Quintile 22% 22% 7% 7%
Fourth Quintile 21% 43% 8% 15%
Third Quintile 26% 69% 13% 28%
Second Quintile 24% 93% 23% 51%
First Quintile 7% 100% 49% 100%
Table 4.7: Percentage of area in the two focal WUI communities susceptible to
burning in the MTT simulations.

111
Figure 4.18: Spatial Distribution of Burn Susceptibility in Travis County ESD #3.

112
Figure 4.19: Spatial Distribution of Burn Susceptibility in Boerne.

113
4.3.2: FIRE BEHAVIOR
Flame lengths and crown fire activity were also measured during the
FlamMap MTT simulations. Sixty percent of the Travis County ESD #3 study
area exhibited the potential for flame lengths surpassing eleven feet in height
under weather conditions mimicking September 4, 2011 (Figure 4.20). Forty-one
percent of the study area also exhibited the potential for active crown fires. In
contrast thirty-four percent of the Boerne study area exhibited the potential for
flames lengths over eleven feet, while fifteen percent exhibited the potential for
active crown fires (Figure 4.21).

114
Figure 4.20: Spatial distribution of fire behavior in Travis County ESD #3.

115
Figure 4.21: Spatial distribution of fire behavior in Boerne.

116
4.4 RESPONSE CAPACITY AND MITIGATION: TRAVIS COUNTY ESD #3
AND BOERNE
4.4.1: EMERGENCY RESPONSE CAPACITY
A summary of the emergency response capacity indicators obtained for
each study area is provided in Table 4.8.
EMERGENCY RESPONSE CAPACITY INDICATORS
Travis County ESD #3 Boerne Fire Department
Emergency Notification Reverse 911 Reverse 911
Fire Department Paid Firefighters 27 14
Fire Department Volunteer
Firefighters 21 19
Current Fire Department Budget $3,961,537.00 $1,291,178.00
Average Response Time 5.4 to 6.4 minutes Less than 6 minutes
ISO Rating 2/8b 4/8b
Distance to Closest Assisting
Department 1.4 miles 12 miles
Cooperation with Surrounding
Departments
Mutual assistance between all
Travis County and City of Austin
fire departments
Mutual assistance between all
County fire departments
STARFlight Firefighting
Helicopter Response Time Less than 10 minutes 40 minutes or more
Table 4.8: Summary of emergency response capacity indicators.

117
Based on information gathered from the Capital Area Council of
Governments, the Alamo Area Council of Governments, the Travis County
Emergency Management Department and the Boerne Fire Department, both
study areas participate in reverse 911 systems for notifying the public in case of
an emergency. In the case of an emergency, response teams inform the reverse
911 system of the neighborhoods that need to be notified. The reverse 911
system then contacts residents that are registered to live in those neighborhoods
by telephone. Residents are not automatically signed up for the service; reverse
911 calling is a voluntary service that requires initiation from households or
individuals.
Travis County ESD #3 reported to have twenty-seven paid firefighters and
twenty-one volunteer firefighters on staff with an annual budget of 3.96 million
dollars. The Boerne Fire Department reported a team of fourteen paid firefighters
and nineteen volunteer firefighters with an annual budget of 1.29 million dollars.
The response times are similar between fire departments. Based on
monthly averages, the Travis County ESD #3 reported an average of 5.4 to 6.4

118
minutes in response times. The Boerne Fire Department reported a response time
of less than six minutes for calls within city limits.
According to the Texas Department of Insurance, the ISO rating is a
widely used public protection classification system derived by the Insurance
Services Office for the purposes of rating the capacity of fire departments based
on comprehensive attributes of the department (http://www.tdi.texas.gov/fire/
fmppcfaq.html). The rates range from ten to one. A score of ten corresponds to the
lowest capacity and a score of one corresponds to the highest. The Travis County
ESD #3 was upgraded to a split 2/8b classification in 2009. This split classification
means that any housing unit that is within one thousand feet of a fire hydrant
and within five road miles of a fire department receives services at level two and
any housing unit that is more than one thousand feet of a fire hydrant but within
five road miles of a fire department receives services at level eight. Any housing
unit beyond five road miles of a fire department receives services at level ten.
The Boerne Fire Department reported a split 4/8b classification. According to the
Texas Department of Insurance, fire departments of large Texas cities typically
score three or four and small towns typically score between four and seven.
Only a few Texas cities have been rated with an ISO of two.

119
Figures 4.22 and 4.23 show the location of the fire departments within the
Travis County ESD #3 and Boerne study extents, respectively, and buffers to
represent portions that lie within the five road mile distance. Figures 4.22 and
4.23 also show the locations of neighboring fire stations. Both the Travis County
ESD #3 and the Boerne Fire Department have assistance agreements with other
fire departments within their respective counties as well as neighboring county
fire departments. The Travis County ESD #3 also has an assistance agreement
with the City of Austin. The closest coordinating fire department is 1.4 miles
from the Travis County ESD #3 fire department headquarters, while the closest
coordinating fire department for the City of Boerne is located twelve miles away.
Central Texas also has a new firefighting helicopter, as of 2013, under the
STARFlight system. This helicopter holds 325 gallons of water and refills quickly
from open water bodies. STARFlight is operated by Travis County, and is based
out of Austin, but it is tailored to serve the five county Austin MSA, of which
Kendall County is not a member. However, counties outside of the Austin MSA
can also request STARFlight services. The estimated time it takes STARFlight to
respond to the Travis County ESD #3 jurisdiction is under 10 minutes and over
40 minutes for Kendall County (https://starflight.traviscountytx.gov/).
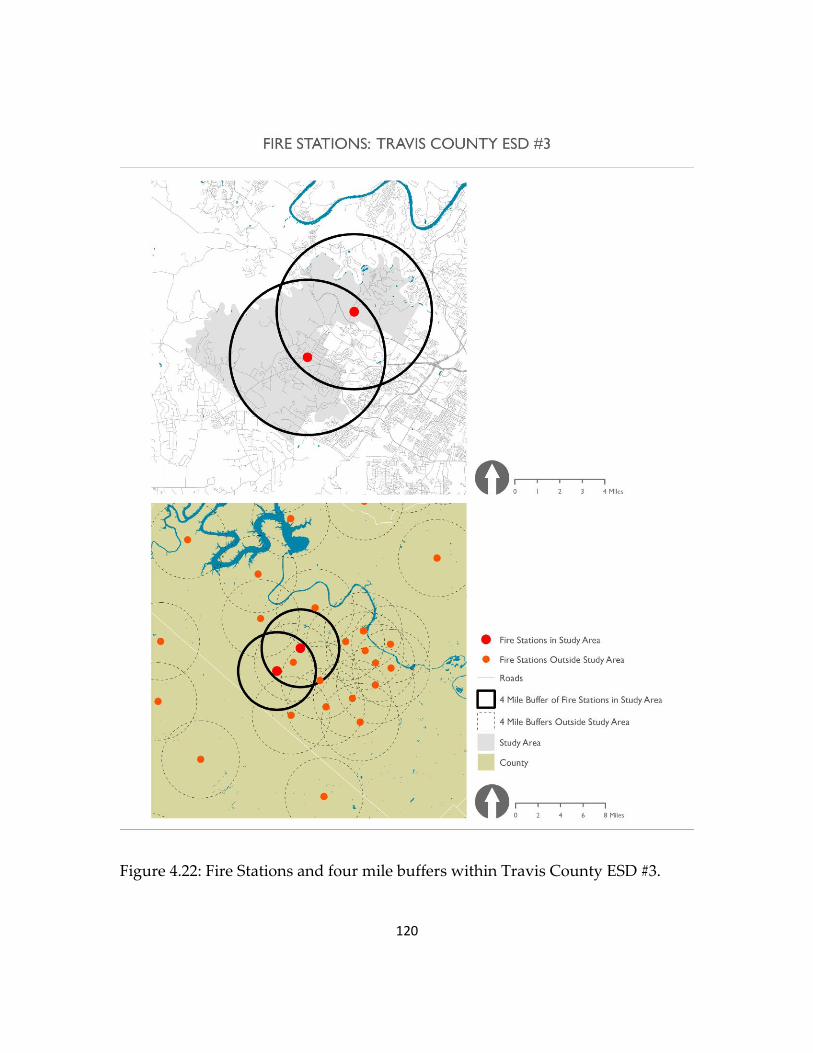
120
Figure 4.22: Fire Stations and four mile buffers within Travis County ESD #3.

121
Figure 4.23: Fire Stations and four mile buffers within the Boerne study extent.

122
4.4.2: PLANS AND PROGRAMS TO MITIGATE WILDFIRE HAZARDS
Each study areas was surveyed for participation in CWPP, Firewise, or
any other program aimed at increasing community awareness and encouraging
property-level mitigation such as defensible space or fire-resistant building
materials. No CWPP process has yet taken place within Travis County, Kendall
County, or the city of Boerne. However, according to the Travis County
Emergency Management Department, Travis County and the City of Austin,
have recently (2013) hired a planning consulting firm to complete a CWPP for the
county. A public information session was held in May of 2013 to begin recording
public comments.
The Firewise process in Texas can be done at any scale but is commonly
performed at the neighborhood or subdivision scale, according to a WUI
specialist with the Texas Forest Service. No neighborhoods in either the Travis
County ESD #3 jurisdiction or the Boerne Fire Department jurisdiction have been
certified as Firewise communities. However, of the communities that have
already obtained Firewise certification in Texas, many are neighborhoods in
western Travis County. Figure 4.24 shows the location of certified Firewise
communities within the eastern Edwards Plateau extent. Eleven of the

123
communities are in Travis County west of Austin. In fact, according to a WUI
specialist with the Texas Forest Service, Travis County emergency service
districts have been actively promoting the Firewise program to small cities and
unincorporated neighborhoods in the county, which has led to their greater
participation in the program than other counties in Texas.
Upon searching for other mitigation plans, programs, and strategies
outside of the CWPP and Firewise programs that also aim to mitigate wildfire
hazards at the property-level, it was determined that neither study area is
participating in any such program.

124
Figure 4.24: FIREWISE communities currently registered in the eastern Edwards
Plateau study extent.
125
CHAPTER 5: DISCUSSION
5.1: INTRODUCTION TO CHAPTER 5
The results provided in Chapter 4 address several questions about
wildfire hazards in the eastern Edwards Plateau, first at the regional scale of over
six thousand square miles, then down to the community scale of roughly fifteen
thousand individuals. Chapter 5 partitions the interpretations of the findings into
sections referring directly to the three research questions detailed in Chapter 3.
The first section contains a summary of the results from simulation modeling at
the regional extent. The second section contains a summary of the simulation
modeling performed for the two focal communities within the extent. The third
section discusses the findings on response capacity and mitigation for the two
focal communities within the extent. Finally the fourth section synthesizes these

126
results and provides a discussion on future work that could improve
comprehensive community and regional wildfire hazard assessments.
5.2: WILDFIRE HAZARDS IN THE EASTERN EDWARDS PLATEAU
Dramatic variation in surface and crown fire behavior was witnessed
among the eight weather scenarios simulated in FlamMap. Under the mildest
scenario only seven percent of the study extent exhibited flame lengths over one
foot, one hundred percent of the study extent had rates of spread under ten
chains per hour, and no active crown fires occurred. In contrast, the most
extreme scenario caused flame lengths in forty-four percent of the study extent to
surpass eleven feet in height. Thirty-eight percent of the extent experienced rates
of spread over eighty chains per hour. Similarly, fifty-six percent of the study
area with canopy cover experienced active crown fires.
The weather and climate parameters that led to these results are all
conditions that are known to occur in the region. However, the extreme summer
conditions of 2011 are indicative of how climate conditions may change as
average daily temperatures increase and long periods of time pass between rain
events. In non-drought periods, a burst of wind during a two-week stint of dry,

127
hot days can also cause substantial increases in wildfire behavior. Overall, these
results indicate that extreme wildfire behavior is not limited to the summer of
2011. Fire conditions leading to extreme fire behavior are predicted to present
themselves more frequently in the future.
The area of greatest concern is the Balcones Escarpment. Not only is this
area undergoing the most population growth, it is also the portion of the extent
that is the most susceptible to active crown fires. The areas with fifteen to forty-
five percent canopy cover that were concentrated within and directly to the west
of the Balcones Escarpment were susceptible to the highest surface flame lengths.
This should be a concern as woody species encroachment continues in the
Edwards Plateau.
5.3: WILDFIRE HAZARDS IN TRAVIS COUNTY ESD #3 AND BOERNE
The wildfire simulations of the two focal communities showed how the
extreme fire behavior under September 4, 2011 weather conditions impacted
neighborhoods in the WUI. The communities had similar population totals in the
year 2010, yet the Travis County ESD #3 spans a much larger area than does the

128
city of Boerne. Likewise, the city of Boerne has a compact urban form when
compared to Travis County ESD #3, which is largely made up of properties with
greater than one acre of land. The burn susceptibility results showed that more of
the Travis County ESD #3 is susceptible to burning while the highest burn
susceptibilities of Boerne remained outside its borders. This still puts the edges
of Boerne at risk for wildfire activity, yet a smaller proportion of the total
population is threatened. The fire behavior results also showed that more of the
area within the Travis County ESD #3 jurisdiction has the potential for extreme
fire behavior than Boerne. For example, forty-one percent of the Travis County
ESD #3 jurisdiction exhibited active crown fires versus only fifteen percent of
Boerne under the same test parameters.
The compact urban form of Boerne is also beneficial for providing
superior evacuation routes. Boerne contains mostly gridded streets that provide
multiple exits from subdivisions (Figure 5.1). According to the Assistant Fire
Chief for the Boerne Fire Department, city ordinances require adequate egress for
subdivisions developed within the city limits (personal communication). In
contrast, the Travis County ESD #3 has many long and winding streets, often
with only one distant exit from the subdivision (Figure 5.2).

129
Figure 5.1: Compact street configuration in Boerne, Texas.
Figure 5.2: Long, winding street configuration on Travis County ESD #3.
130
5.4: RESILIENCE AND ADAPTATION IN TRAVIS COUNTY ESD #3 AND
BOERNE
Based on fire department capacity and coordination with outside
agencies, the communities in the Travis County ESD #3 jurisdiction have access
to more response capacity. The Travis County ESD #3 not only has over twice the
budget (to serve the same number of people), more firefighters, and a higher ISO
rating, it also has the benefit of several nearby coordinating fire stations as well
as the STARFlight firefighting helicopter only a few miles away. Some research
suggests that hazards can impact smaller communities more substantially than
larger communities due to their reduced access to infrastructure, emergency
services, etc. (Cross 2001). The difference between these two study areas supports
this theory.
The Travis County ESD #3 has also shown more potential to adopt
strategies that aim to prevent or minimize wildfire hazards. No programs are
currently completed for either study area, yet Travis County is making progress
toward adopting a CWPP and has inspired eleven neighborhoods in western
Travis County to participate in the Firewise program. The difference between
these communities’ receptiveness to carrying out wildfire mitigation through

131
programs such as CWPP and Firewise is not clear. It could be due to the 2011
fires that occurred within Travis County, which have awakened a sense of
urgency in the Travis County population, or it could be based on differences in
attitudes or demographics between the populations.
5.5: CONCLUSION
Taken together, these three methods have shown that wildfire hazards
exhibiting extreme fire behavior are a real possibility for the eastern Edwards
Plateau. The study does not predict how vegetation communities will adapt to
shifts in climate, but while the vegetation resembles what we see today, hot, dry
summers will pose significant threats to communities. Certain areas are
exhibiting signs of adaptation by bolstering response capacity and promoting
prevention measures. Yet, other areas are not exhibiting this trend.
Through the process of discovering how the two study areas approached
wildfire mitigation, it became evident that even though fuel mitigation is widely
understood to be the most effective tool for minimizing wildfire hazards,
programs devoted to fuel mitigation around the WUI are not common in the

132
eastern Edwards Plateau. The CWPP and Firewise programs do incorporate
some degree of fuel mitigation recommendations, yet it is up to private property
owners to coordinate actions that will make meaningful differences at the
neighborhood scale. Future analysis into effective fuel management strategies,
including cooperation among private property owners would be a valuable
contribution to wildfire hazard and mitigation assessments for the region.
Simulation modeling proved to be a beneficial tool for assessing as well as
communicating potential wildfire hazards at the regional and community scale.
Most of the land area within the eastern Edwards Plateau is susceptible to
extreme surface or crown fire behavior under the right conditions, and those
conditions are expected to become more frequent. The region is showing some
signs of adapting wildfire hazards through the development of a CWPP in Travis
County and the voluntary participation of many neighborhoods in the Firewise
Program. Yet, mitigating through fuel management was not evident in the study
areas. Furthermore, the efficacy of participating in wildfire prevention planning
will not be clear until another wildfire incident occurs. More research into the
pattern of fuel management that optimize hazard reduction as well as research

133
into structure ignitibility in relation to property-level fuel reductions would
greatly enhance this wildfire hazard assessment.

134
WORKS CITED
Adger, W. Neil. 2006. “Vulnerability.” Global Environmental Change 16 (3): 268–
281.
Adger, W. Neil, Terry P. Hughes, Carl Folke, Stephen R. Carpenter, and Johan
Rockström. 2005. “Social-ecological Resilience to Coastal Disasters.” Science
309 (5737): 1036–1039.
Agee, J. K., and C. N. Skinner. 2005. “Basic Principles of Forest Fuel Reduction
Treatments.” Forest Ecology and Management 211 (1): 83–96.
Ager, Alan A., Nicole M. Vaillant, and Mark A. Finney. 2010. “A Comparison of
Landscape Fuel Treatment Strategies to Mitigate Wildland Fire Risk in the
Urban Interface and Preserve Old Forest Structure.” Forest Ecology and
Management 259 (8): 1556–1570.
Allen, Craig D., Alison K. Macalady, Haroun Chenchouni, Dominique Bachelet,
Nate McDowell, Michel Vennetier, Thomas Kitzberger, Andreas Rigling,
David D. Breshears, and E. H. Hogg. 2010. “A Global Overview of Drought
and Heat-induced Tree Mortality Reveals Emerging Climate Change Risks
for Forests.” Forest Ecology and Management 259 (4): 660–684.

135
Benavides-Solorio, J., and L. H. MacDonald. 2001. “Post-fire Runoff and Erosion
from Simulated Rainfall on Small Plots, Colorado Front Range.” Hydrological
Processes 15 (15): 2931–2952.
Bowman, David MJS, Jennifer K. Balch, Paulo Artaxo, William J. Bond, Jean M.
Carlson, Mark A. Cochrane, Carla M. D’Antonio, Ruth S. DeFries, John C.
Doyle, and Sandy P. Harrison. 2009. “Fire in the Earth System.” Science 324
(5926): 481–484.
Bowman, David MJS, Jennifer Balch, Paulo Artaxo, William J. Bond, Mark A.
Cochrane, Carla M. D’Antonio, Ruth DeFries, Fay H. Johnston, Jon E. Keeley,
and Meg A. Krawchuk. 2011. “The Human Dimension of Fire Regimes on
Earth.” Journal of Biogeography 38 (12): 2223–2236.
Brooks, Nick. 2003. “Vulnerability, Risk and Adaptation: A Conceptual
Framework.” Tyndall Centre for Climate Change Research Working Paper 38: 1–
16.
Brown, Timothy J., Beth L. Hall, and Anthony L. Westerling. 2004. “The Impact
of Twenty-first Century Climate Change on Wildland Fire Danger in the
Western United States: An Applications Perspective.” Climatic Change 62 (1-
3): 365–388.
Brummel, Rachel F., Kristen C. Nelson, Stephanie Grayzeck Souter, Pamela J.
Jakes, and Daniel R. Williams. 2010. “Social Learning in a Policy-mandated
Collaboration: Community Wildfire Protection Planning in the Eastern
United States.” Journal of Environmental Planning and Management 53 (6): 681–
699.
Capital Area Council of Governments. 2009. “County Land Use Authority in
Texas.” Accessed June 20, 2013.
http://data.capcog.org/Information_Clearinghouse/presentations/2009-11-
03%20County%20Land%20Use%20Report%20-
%20final%20for%20Publication.pdf.

136
Cohen, J. D. 2000. “Preventing Disaster: Home Ignitability in the Wildland-urban
Interface.” Journal of Forestry 98 (3): 15–21.
Cohen, J. 2008. “The Wildland-urban Interface Fire Problem.” FOREST: 21.
Cross, John A. 2001. “Megacities and Small Towns: Different Perspectives on
Hazard Vulnerability.” Global Environmental Change Part B: Environmental
Hazards 3 (2): 63–80.
Cutter, S. L. 1996. “Vulnerability to Environmental Hazards.” Progress in Human
Geography 20: 529–539.
Cutter, S. L., B. J. Boruff, and W. L. Shirley. 2003. “Social Vulnerability to
Environmental Hazards*.” Social Science Quarterly 84 (2): 242–261.
Cutter, S. L., J. T. Mitchell, and M. S. Scott. 2000. “Revealing the Vulnerability of
People and Places: A Case Study of Georgetown County, South Carolina.”
Annals of the Association of American Geographers 90 (4): 713–737.
Cutter, Susan L., Lindsey Barnes, Melissa Berry, Christopher Burton, Elijah
Evans, Eric Tate, and Jennifer Webb. 2008. “A Place-based Model for
Understanding Community Resilience to Natural Disasters.” Global
Environmental Change 18 (4): 598–606.
Cutter, Susan L., and Christina Finch. 2008. “Temporal and Spatial Changes in
Social Vulnerability to Natural Hazards.” Proceedings of the National Academy
of Sciences 105 (7): 2301–2306.
Eriksen, Christine, and Timothy Prior. 2011. “The Art of Learning: Wildfire,
Amenity Migration and Local Environmental Knowledge.” International
Journal of Wildland Fire 20 (4): 612–624.

137
Fernandes, P. M., and H. S. Botelho. 2003. “A Review of Prescribed Burning
Effectiveness in Fire Hazard Reduction.” International Journal of Wildland Fire
12 (2): 117–128.
Finney, M. A. 2001. “Design of Regular Landscape Fuel Treatment Patterns for
Modifying Fire Growth and Behavior.” Forest Science 47 (2): 219–228.
Finney, Mark A., Rob C. Seli, Charles W. McHugh, Alan A. Ager, Bernhard
Bahro, and James K. Agee. 2008. “Simulation of Long-term Landscape-level
Fuel Treatment Effects on Large Wildfires.” International Journal of Wildland
Fire 16 (6): 712–727.
Fischer, A. Paige, and Susan Charnley. 2012. “Risk and Cooperation: Managing
Hazardous Fuel in Mixed Ownership Landscapes.” Environmental
Management 49 (6): 1192–1207.
Flannigan, Mike D., Meg A. Krawchuk, William J. de Groot, B. Mike Wotton, and
Lynn M. Gowman. 2009. “Implications of Changing Climate for Global
Wildland Fire.” International Journal of Wildland Fire 18 (5): 483–507.
Gallopín, Gilberto C. 2006. “Linkages Between Vulnerability, Resilience, and
Adaptive Capacity.” Global Environmental Change 16 (3): 293–303.
Gill, A. M., and S. L. Stephens. 2009. “Scientific and Social Challenges for the
Management of Fire-prone Wildland–urban Interfaces.” Environmental
Research Letters 4 (3): 034014.
Headwaters Economics. 2009. Solutions to the Rising Cost of Fighting Fires in the
Wildland-Urban Interface. Bozeman, Montana.
www.headwaterseconomics.org/wildfire.php.
Headwaters Economics. 2013. The Rising Cost of Wildfire Protection. Bozeman,
Montana. http://headwaterseconomics.org/wildfire/fire-costs-background.

138
International Panel on Climate Change (IPCC). 2007. Climate Change 2007:
Impacts, Adaptation and Vulnerability: Working Group II Contribution to the
Fourth Assessment Report of the IPCC Intergovernmental Panel on Climate Change.
Vol. 4. Cambridge University Press.
Jakes, Pamela, Sam Burns, Antony Cheng, Emily Saeli, Kristen Nelson, Rachel
Brummel, Stephanie Grayzeck, Victoria Sturtevant, and Daniel Williams.
2007a. “Critical Elements in the Development and Implementation of
Community Wildfire Protection Plans (CWPPs).” In The Fire Environment—
innovations, Management, and Policy, Destin, FL, 2007. Conference Proceedings
RMRS-P-46CD. US Department of Agriculture, Forest Service, Rocky Mountain
Research Station, Fort Collins, 26–30.
Jakes, P., L. Kruger, M. Monroe, K. Nelson, and V. Sturtevant. 2007b. “Improving
Wildfire Preparedness: Lessons from Communities Across the US.” Human
Ecology Review 14 (2): 188–197.
Jarrett, Adam, Jianbang Gan, Cassandra Johnson, and Ian A. Munn. 2009.
“Landowner Awareness and Adoption of Wildfire Programs in the Southern
United States.” Journal of Forestry 107 (3): 113–118.
Jarrett, James E., and J. Jorge Anchondo. 2012. “Texas Emergency Services
Districts in High Growth Areas.” Bureau of Business Research, the University
of Texas at Austin.
Jiang, Xiaoyan, and Zong-Liang Yang. 2012. “Projected Changes of Temperature
and Precipitation in Texas from Downscaled Global Climate Models.” Clim
Res 53: 229-244.
Johnson, E. H. "Edwards Plateau," Handbook of Texas Online. Accessed June 20,
2013. http://www.tshaonline.org/handbook/online/articles/rxe01.
Keeley, J. E. 2009. “Fire Intensity, Fire Severity and Burn Severity: a Brief Review
and Suggested Usage.” International Journal of Wildland Fire 18 (1): 116–126.

139
Krawchuk, Meg A., Max A. Moritz, Marc-André Parisien, Jeff Van Dorn, and
Katharine Hayhoe. 2009. “Global Pyrogeography: The Current and Future
Distribution of Wildfire.” Edited by Jerome Chave. PLoS ONE 4 (4) (April 8):
e5102.
Lee, H. 2011. “Travis County Commissioners Court Declares Local Disaster.”
Travis County Fire Marshal's Office. Accessed June 20, 2013.
http://www.co.travis.tx.us/documents/press_release_disaster_declaration_201
1.pdf.
Lee, H. 2012. “Pedernales Wildland Fire Ruled as Accidental.” Travis County
Fire Marshal's Office. Accessed June 20, 2013.
http://www.co.travis.tx.us/fire_marshal/press_release/Pedernales_Spicewood
_Fire_investigation_pressrelease.pdf.
Marlon, J. R., P. J. Bartlein, M. K. Walsh, S. P. Harrison, K. J. Brown, M. E.
Edwards, P. E. Higuera, et al. 2009. “Wildfire Responses to Abrupt Climate
Change in North America.” Proceedings of the National Academy of Sciences 106
(8) (February 24): 2519–2524.
Mell, W. E., S. L. Manzello, A. Maranghides, D. Butry, and R. G. Rehm. 2010.
“The Wildland–urban Interface Fire Problem–current Approaches and
Research Needs.” International Journal of Wildland Fire 19 (2): 238–251.
Miller, J. D., H. D. Safford, M. Crimmins, and A. E. Thode. 2009. “Quantitative
Evidence for Increasing Forest Fire Severity in the Sierra Nevada and
Southern Cascade Mountains, California and Nevada, USA.” Ecosystems 12
(1): 16–32.
Moritz, M. A., M. A. Parisien, E. Batllori, M. A. Krawchuk, J. Van Dorn, D. J.
Ganz, and K. Hayhoe. 2012. “Climate Change and Disruptions to Global Fire
Activity.” Ecosphere 3 (6).

140
National Interagency Fire Center (NIFC). 2009. “Quadrennial Fire Review.”
Accessed May 20, 2013. Accessed May 20, 2013.
http://www.nifc.gov/PUBLICATIONS/QFR/QFR2009Final.pdf.
National Interagency Fire Center (NIFC). 2013a. “Federal Firefighting Costs
(Suppression Only).” Accessed May 20, 2013.
http://www.nifc.gov/fireInfo/fireInfo_documents/SuppCosts.pdf.
National Interagency Fire Center (NIFC). 2013b. “1997-2012 large fires (100,000+
acres).” Accessed May 20, 2013.
http://www.nifc.gov/fireInfo/fireInfo_stats_lgFires.html.
National Oceanic and Atmospheric Administration (NOAA). 2013. “Billion-
Dollar Weather/Climate Disasters.” Accessed May 20, 2013.
http://www.ncdc.noaa.gov/billions.
National Wildfire Coordinting Group. 2010. “Incident Response Pocket Guide.”
Accessed May20, 2013. http://www.nwcg.gov/var/products/incident-
response-pocket-guide.
Olmstead, Sheila, Carolyn Kousky, and Roger Sedjo. 2012. “Wildland Fire
Suppression and Land Development in the Wildland/Urban Interface.”
USDA Forest Service. http://www.firescience.gov/projects/10-3-01-
33/project/10-3-01-33_final_report.pdf.
Parisien, M. A., and M. A. Moritz. 2009. “Environmental Controls on the
Distribution of Wildfire at Multiple Spatial Scales.” Ecological Monographs 79
(1): 127–154.
Pausas, Juli G., and Jon E. Keeley. 2009. “A Burning Story: The Role of Fire in the
History of Life.” BioScience 59 (7): 593–601.
Paveglio, Travis B., Pamela J. Jakes, Matthew S. Carroll, and Daniel R. Williams.
2009. “Understanding Social Complexity Within the Wildland–urban

141
Interface: a New Species of Human Habitation?” Environmental Management
43 (6): 1085–1095.
Pearson, Richard G., and Terence P. Dawson. 2003. “Predicting the Impacts of
Climate Change on the Distribution of Species: Are Bioclimate Envelope
Models Useful?” Global Ecology and Biogeography 12 (5): 361–371.
Pettit, N. E., and R. J. Naiman. 2007. “Fire in the Riparian Zone: Characteristics
and Ecological Consequences.” Ecosystems 10 (5): 673–687.
Radeloff, V. C., R. B. Hammer, S. I. Stewart, J. S. Fried, S. S. Holcomb, and J. F.
McKeefry. 2005. “The Wildland-urban Interface in the United States.”
Ecological Applications 15 (3): 799–805.
Schoennagel, T., C. R. Nelson, D. M. Theobald, G. C. Carnwath, and T. B.
Chapman. 2009. “Implementation of National Fire Plan Treatments Near the
Wildland–urban Interface in the Western United States.” Proceedings of the
National Academy of Sciences 106 (26): 10706–10711.
Schröter, Dagmar, Wolfgang Cramer, Rik Leemans, I. Colin Prentice, Miguel B.
Araújo, Nigel W. Arnell, Alberte Bondeau, Harald Bugmann, Timothy R.
Carter, and Carlos A. Gracia. 2005. “Ecosystem Service Supply and
Vulnerability to Global Change in Europe.” Science 310 (5752): 1333–1337.
Scott, Joe H., and Robert E. Burgan. 2005. “Standard Fire Behavior Fuel Models: a
Comprehensive Set for Use with Rothermel’s Surface Fire Spread Model.” The
Bark Beetles, Fuels, and Fire Bibliography: 66.
Smit, Barry, and Johanna Wandel. 2006. “Adaptation, Adaptive Capacity and
Vulnerability.” Global Environmental Change 16 (3) (August): 282–292.
Stephens, S. L., J. J. Moghaddas, C. Edminster, C. E. Fiedler, S. Haase, M.
Harrington, J. E. Keeley, et al. 2009. “Fire Treatment Effects on Vegetation

142
Structure, Fuels, and Potential Fire Severity in Western US Forests.” Ecological
Applications 19 (2): 305–320.
Stephens, Scott L., and Lawrence W. Ruth. 2005. “Federal Forest-fire Policy in the
United States.” Ecological Applications 15 (2): 532–542.
Stewart, S.I. and V.C. Radeloff. 2012. “2010 Wildland Urban Interface – Public
Land Adjusted.” Accessed May 23, 2013.
http://silvis.forest.wisc.edu/maps/wui/2010/download.
Texas A&M Forest Service. 2011. “2011 Texas Wildfires: Common Denominators
of Home Destruction.” Accessed July 23, 2013.
http://tfsweb.tamu.edu/uploadedFiles/FRP/New_-
_Mitigation/Safety_Tips/2011%20Texas%20Wildfires.pdf.
Theobald, D. M., and W. H. Romme. 2007. “Expansion of the US Wildland-urban
Interface.” Landscape and Urban Planning 83 (4): 340–354.
Travis County Fire Marshal's Office. 2011. “Case #11-22090 Steiner Ranch
Wildland Fire 9/4/2011.” Accessed June 2, 2013.
http://www.co.travis.tx.us/fire_marshal/pdf_files/Steiner_Ranch_Fire_Report.
pdf.
Turner, B. L., R. E. Kasperson, P. A. Matson, J. J. McCarthy, R. W. Corell, L.
Christensen, N. Eckley, et al. 2003. “A Framework for Vulnerability Analysis
in Sustainability Science.” Proceedings of the National Academy of Sciences 100
(14): 8074.
USDA Forest Service. 2000a. Wildland Fire in Ecosystems. Effects of Fire on Fauna.
US Department of Agriculture, Forest Service, Rocky Mountain Research
Station Ogden, UT.

143
USDA Forest Service. 2000b. Wildland Fire in Ecosystems: Effects of Fire on Flora. US
Department of Agriculture, Forest Service, Rocky Mountain Research Station
Ogden, UT.
USDA Forest Service. 2005. Wildland Fire in Ecosystems: Effects of Fire on Soils and
Water. US Department of Agriculture, Forest Service, Rocky Mountain
Research Station Ogden, UT.
USDA Forest Service. 2013. Wildland, Wildlands, and People: Understanding and
Preparing for Wildfire in the Wildland-Urban Interface. US Department of
Agriculture, Forest Service, Rocky Mountain Research Station Ogden, UT.
Van Mantgem, Phillip J., Nathan L. Stephenson, John C. Byrne, Lori D. Daniels,
Jerry F. Franklin, Peter Z. Fulé, Mark E. Harmon, Andrew J. Larson, Jeremy
M. Smith, and Alan H. Taylor. 2009. “Widespread Increase of Tree Mortality
Rates in the Western United States.” Science 323 (5913): 521–524.
Westerling, Anthony L., Hugo G. Hidalgo, Daniel R. Cayan, and Thomas W.
Swetnam. 2006. “Warming and Earlier Spring Increase Western US Forest
Wildfire Activity.” Science 313 (5789): 940–943.