understanding your tripod survey results: school report
TRANSCRIPT

© 2014 The Tripod Project Page 1
Understanding Your Tripod Survey Results: School Report
The Tripod™ student survey collects, organizes, and reports on student perspectives at the classroom level to support and improve teaching and learning. Research shows that Tripod’s 7Cs™ teaching practices help predict both student engagement and achievement. This report is a snapshot of student perspectives at one point in time. Along with other measures of teaching and learning, Tripod results help create a more complete picture of classroom learning conditions in your school. Your teachers’ survey results can help inform school-wide conversations as well as individual goal-setting, self-reflection, and other aspects of professional development.
As you reflect upon this student feedback, look for patterns in the data to identify both strengths and areas for growth. The information in this report can inspire and help you and your teachers to reach students in new ways.
Introduction

© 2014 The Tripod Project Page 2
Tripod survey results center on the 7Cs of effective teaching—Care, Confer, Captivate, Clarify, Consolidate, Challenge, and Control—but also measure student engagement, peer support, and executive function learning. More details about these constructs appear in the appendix of this document.
The data in the report are presented in two main ways:
1. Scaled scores identify areas of strength and opportunities for growth by allowing you to compare scores in your school to the scores of other schools in your comparison cohort. Scaled scores also allow you to compare the scores of teachers in your school. Scaled scores for the Tripod 7Cs combine responses from all of the students in a class across all of the Tripod 7Cs survey items. Classroom scores are averaged by teacher and school and weighted class size to produce teacher- and school-level scores. Scores range from 202 to 398. A score of 300 represents the midpoint for all teachers in your comparison cohort. See the shaded box below for more details about scaled scores and your comparison cohort.
2. Item Response Details provide a closer look at the range of students’ responses for each survey item.
Reading Your Survey Results
Scaled Scores To compute scaled scores, all student responses are aggregated to calculate a raw score, which then converted to a scaled score with a range of 202 to 398. A score of 300 represents the midpoint of all scores. The middle part of the scale—approximately 270-330—iswhere the majority of classrooms score. A teacher in this range knows that s/he has a score similar to that of most other teachers. Scaled scores provide the unique benefit of results that have the same meaning across different settings (e.g., Elementary vs. High School) and across different components (e.g., Care vs. Challenge).

© 2014 The Tripod Project Page 3
The pages that follow describe in greater detail how information is displayed in the report.
Comparison Cohort The comparison cohort for your school is the group against which your scores are being compared. Typically, your comparison cohort will be one of three groups: 1) schools surveyed by Tripod from 2011-2014 where the average classroom composition/characteristics are similar to your own, 2) all schools surveyed by Tripod from 2011-2014, or 3) all school in your district/state who administered Tripod surveys when you did. You can find your comparison cohort on page two of your school report. The comparison cohort for your teachers is similar to the school’s comparison cohort. Typically, a teacher’s comparison cohort will be one of three groups: 1) teachers working in similar classrooms surveyed by Tripod from 2011-2014, 2) all teachers surveyed by Tripod from 2011-2014, or 3) all teachers in your district/state who administered Tripod surveys when you did. A teacher can find his/her comparison cohort on page three of his/her teacher report.

© 2014 The Tripod Project Page 4
School Summary The School Summary shows the full range of your teachers’ results on each of the 7Cs. As shown in Figure 1, the shade of green indicates lower (light green) to higher (darker green) scaled scores. Note that the chart is organized from highest to lowest based on teachers’ composite scores. Above each of the 7Cs is the average scaled score for your school.
These numbers are key to understanding areas of success and challenge across your school. Whereas the average scaled score for your school tells you where you school score in relation to other schools in your comparison cohort, the scores for each teacher tells you where that teacher scores in relation to other teachers in the same comparison cohort. Figure 1: School Summary Example

© 2014 The Tripod Project Page 5
Item Response Detail For each item on the survey, students mark one of five response options. In the Item Response Detail section of your report, bar charts are used to display the percentage of students in your school who selected each response option. As shown in Figure 2, green bars represent the percentages of favorable responses, while purple bars indicate unfavorable responses. Figure 2: Five Levels for Upper Elementary and Secondary
Unfavorable Unfavorable Neutral Favorable Favorable
For some statements on the survey, disagreement is the desired response. Figure 3 shows an example. Students are presented with this statement: “When s/he is teaching us, my teacher thinks we understand even when we don't.” Because this item is worded negatively, disagreement is the favorable response.
Figure 3: Example of Negatively Worded Item
The text “[Disagree With]” is not on the surveys that students complete, but it is added to the report to remind readers of the report that disagreement is the desired response. More green indicates that more students disagreed with the statement. Whether the survey item is worded positively or negatively, more green is always better. Other Tripod Measures The final section of the report presents survey results related to student engagement, peer support, and executive function learning. While these data are not used to measure teaching practice, they can provide you with further insight into your students’ experiences. Again, more details about these constructs appear in the appendix of this document (on the next page).
© 2014 The Tripod Project Page 6
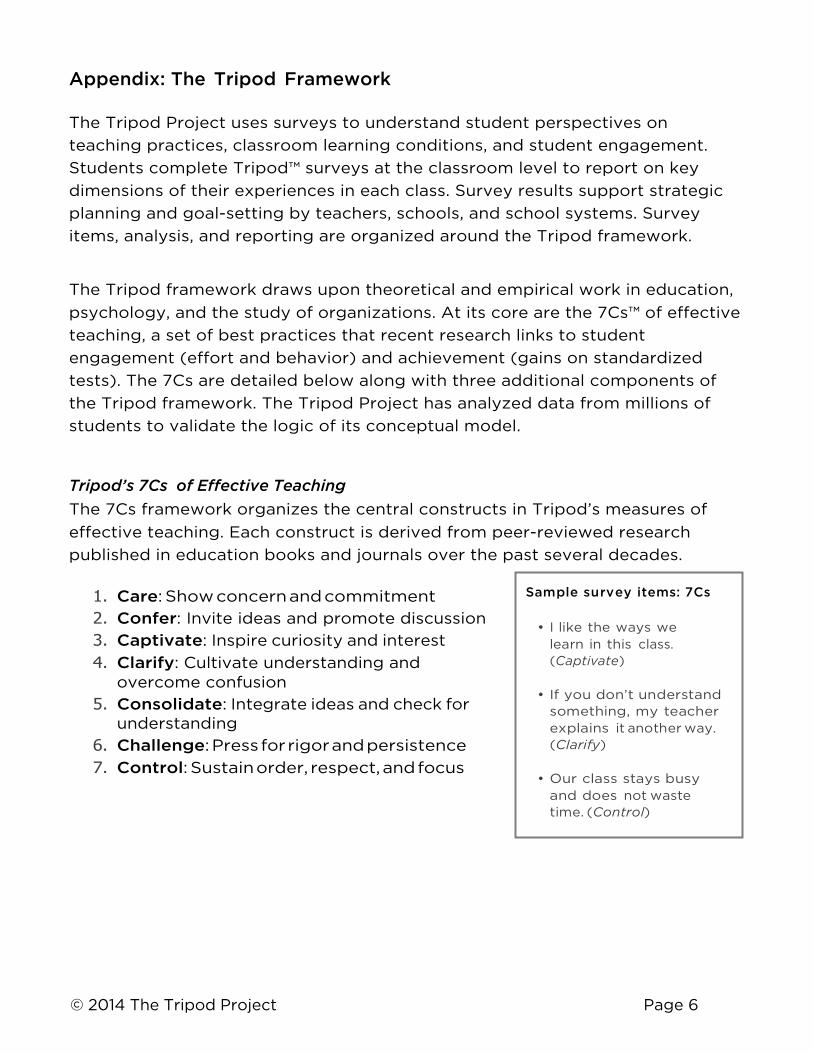
Appendix: The Tripod Framework The Tripod Project uses surveys to understand student perspectives on teaching practices, classroom learning conditions, and student engagement. Students complete Tripod™ surveys at the classroom level to report on key dimensions of their experiences in each class. Survey results support strategic planning and goal-setting by teachers, schools, and school systems. Survey items, analysis, and reporting are organized around the Tripod framework.
The Tripod framework draws upon theoretical and empirical work in education, psychology, and the study of organizations. At its core are the 7Cs™ of effective teaching, a set of best practices that recent research links to student engagement (effort and behavior) and achievement (gains on standardized tests). The 7Cs are detailed below along with three additional components of the Tripod framework. The Tripod Project has analyzed data from millions of students to validate the logic of its conceptual model. Tripod’s 7Cs of Effective Teaching The 7Cs framework organizes the central constructs in Tripod’s measures of effective teaching. Each construct is derived from peer-reviewed research published in education books and journals over the past several decades.
1. Care: Show concern and commitment 2. Confer: Invite ideas and promote discussion 3. Captivate: Inspire curiosity and interest 4. Clarify: Cultivate understanding and
overcome confusion 5. Consolidate: Integrate ideas and check for
understanding 6. Challenge: Press for rigor and persistence 7. Control: Sustain order, respect, and focus
Sample survey items: 7Cs
class. (Captivate)

© 2014 The Tripod Project Page 7
Tripod Engagement**∗
In addition to gathering data on teaching practices, Tripod surveys capture students’ perceptions of their own involvement in classes. Each classroom is a distinct environment and elicits a different level of engagement. Inspired by Erik Erikson’s first five stages of human identity development, Tripod engagement indices reflect educators’ most common concerns about student engagement.
1. Trust: feeling safe and welcome in class 2. Cooperation: working with others and
abiding by class rules 3. Ambition: aiming to learn as much as
possible 4. Diligence: working hard and facing
setbacks with resilience 5. Satisfaction: achieving a sense of
efficacy based on effort and progress
Research has shown that Tripod’s 7Cs help predict student engagement. Taken together, the 7Cs and Tripod’s measures of student engagement provide crucial information to educators designing professional development and school improvement initiatives.
** While student engagement is not used as a measure of teaching practice, this information can provide further insight about classroom learning conditions and student experiences.
Sample survey items: Engagement

© 2014 The Tripod Project Page 8
Tripod Peer Support**∗
Peer support means the degree to which students support one another instead of teasing or trying to discourage their classmates. Levels of peer support help determine whether students feel safe asking questions and seeking help from teachers. Because negative peer interactions such as teasing tend to be purposefully hidden from educators, student surveys can provide unique insight into issues of peer support in school.
Tripod Executive Function Learning**∗
Survey items devoted to executive function learning ask students whether they feel supported in efforts to be organized, persist in the face of difficulty, use time wisely, focus on the quality of their work, and believe that sustained effort makes them smarter.
** While peer support and executive function are not used as measures of teaching practice, they can provide further insight about classroom learning conditions and student experiences.
Sample survey items: Peer Support
Sample survey items: Executive Function Learning