understanding youth landscape perceptions and …
TRANSCRIPT
UNDERSTANDING YOUTH LANDSCAPE PERCEPTIONS AND MAPPING
LANDSCAPE VALUES VIA SOCIAL MEDIA
by
Yan Chen
Submitted in partial fulfilment of the requirements
for the degree of Master of Environmental Studies
at
Dalhousie University
Halifax, Nova Scotia
October 2016
© Copyright by Yan Chen, 2016
ii
TABLE OF CONTENTS
LIST OF TABLES......................................................................................................... v
LIST OF FIGURES ..................................................................................................... vi
ABSTRACT .............................................................................................................. viii
LIST OF ABBREVIATIONS USED ............................................................................... ix
ACKNOWLEDGMENTS ............................................................................................... x
Chapter 1 Introduction ................................................................................................. 1
1.1 Context.............................................................................................................. 2
1.2 Research Goals ................................................................................................. 6
1.3 Methods ............................................................................................................ 8
1.3.1 Sites Rationale ............................................................................................ 8
1.3.2 Approaches ................................................................................................11
1.4 Limitations ........................................................................................................13
1.5 Project Background...........................................................................................13
1.6 Organization of Thesis ......................................................................................14
Chapter 2 Understanding youth perception and use of hydroelectric energy landscapes via social media .......................................................................................16
2.1 Statement of Student Contribution .....................................................................16
2.2 Acknowledgements ...........................................................................................16
2.3 Abstract ............................................................................................................17
2.4 Keywords .........................................................................................................17
2.5 Introduction ......................................................................................................18
2.6 Theoretical Background ....................................................................................20
2.6.1 Landscape and Landscape Perception ........................................................20
2.6.2 Landscape Perception Model ......................................................................22
iii
2.6.3 Hydroelectricity Landscapes and Youth Engagement ...................................25
2.7 Methods ...........................................................................................................27
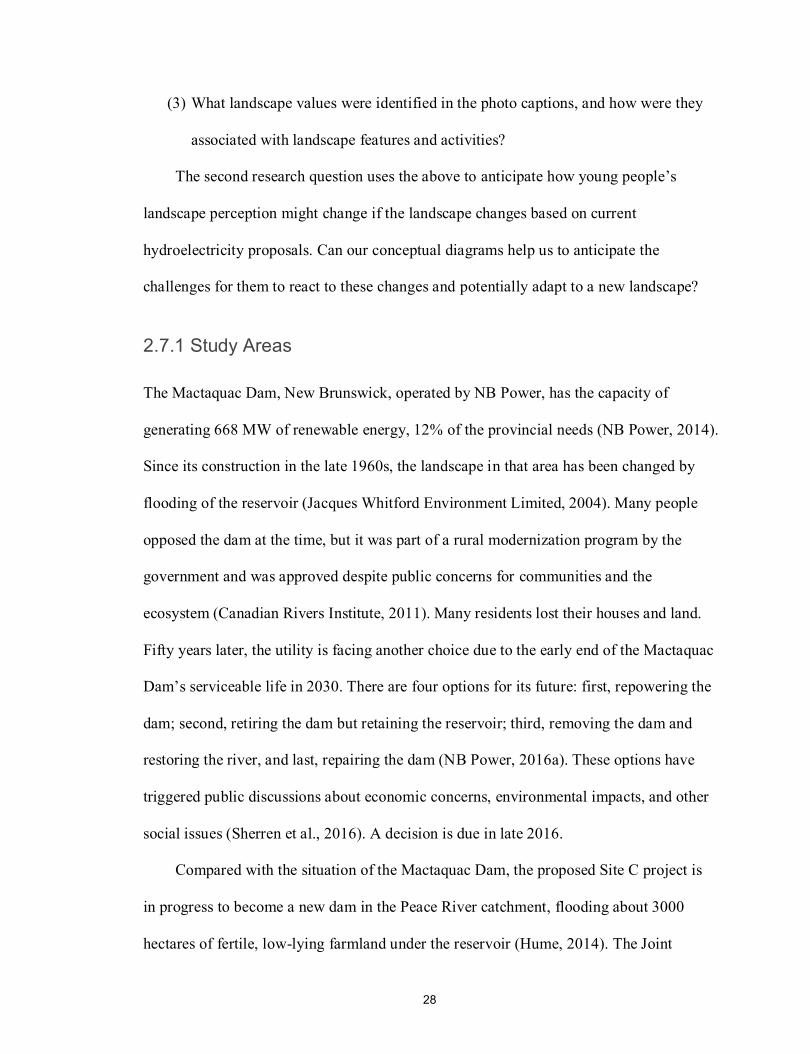
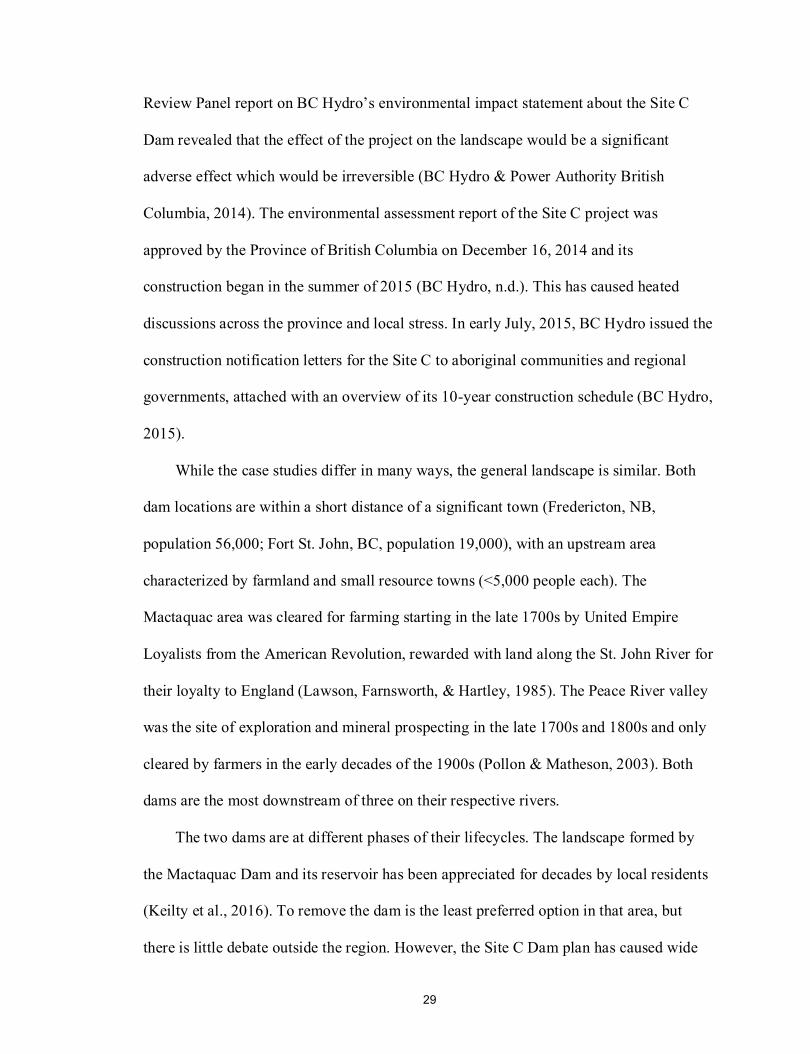
2.7.1 Study Areas................................................................................................28
2.7.2 Data Collection ...........................................................................................30
2.7.3 Category Development and Data Coding .....................................................33
2.7.4 Measures ...................................................................................................34
2.8 Results .............................................................................................................35
2.8.1 Landscape Features ...................................................................................37
2.8.2 Landscape Features and Activities ..............................................................39
2.8.3 Landscape Values ......................................................................................42
2.9 Discussion ........................................................................................................45
2.9.1 Changing Landscape Features ....................................................................45
2.9.2 Changing Activities .....................................................................................48
2.9.3 Changing Values ........................................................................................50
2.9.4 Implications for Case Studies ......................................................................52
2.9.5 Implications for Social Impact Assessment via Social Media .........................54
2.10 Conclusion......................................................................................................56
References.............................................................................................................57
Chapter 3 Using geo-tagged social media data to map landscape values .....................65
3.1 Statement of Student Contribution .....................................................................65
3.2 Acknowledgements ...........................................................................................65
3.3 Abstract ............................................................................................................66
3.4 Keywords .........................................................................................................66
3.5 Introduction ......................................................................................................67
3.6 Background ......................................................................................................71
3.6.1 The Evolution of Landscape Value Assessment ...........................................71
iv
3.6.2 Mapping Landscape Values and the Use of Social Media Data .....................74
3.7 Methods ...........................................................................................................77
3.7.1 Study Areas................................................................................................77
3.7.2 Data Collection ...........................................................................................79
3.7.3 Filtering Model ............................................................................................80
3.7.4 Landscape Value Coding and Mapping........................................................85
3.8 Results .............................................................................................................87
3.8.1 Landscape Value Coding ............................................................................87
3.8.2 Landscape Value Maps...............................................................................89
3.8.3 Landscape Values vs. Population density ....................................................94
3.9 Discussion ........................................................................................................96
3.9.1 The Patterns and Drivers of Landscape Values ............................................96
3.9.2 Implications for Case Study Hydroelectricity Proposals............................... 101
3.9.3 Using and Filtering Social Media Data for Values Mapping ......................... 102
3.10 Conclusion.................................................................................................... 105
References........................................................................................................... 107
Chapter 4 Conclusion ............................................................................................... 117
APPENDIX A ........................................................................................................... 121
APPENDIX B ........................................................................................................... 122
APPENDIX C ........................................................................................................... 123
BIBLIOGRAPHY ...................................................................................................... 126
v
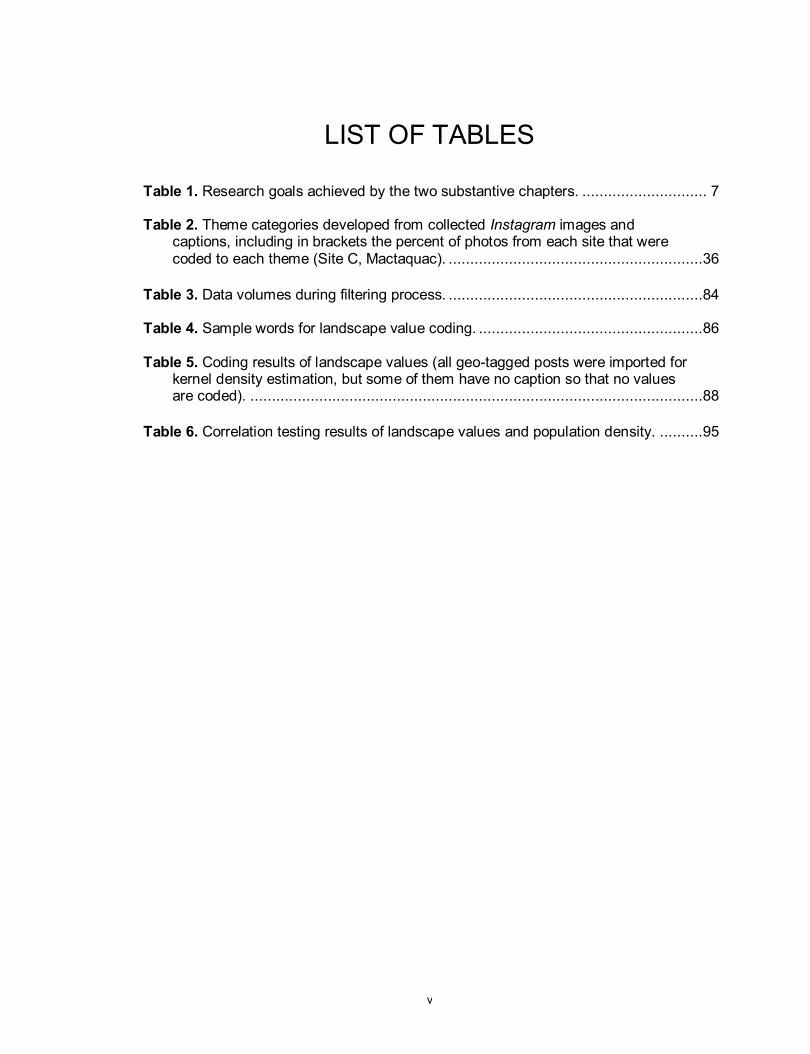
LIST OF TABLES
Table 1. Research goals achieved by the two substantive chapters. ............................. 7
Table 2. Theme categories developed from collected Instagram images and captions, including in brackets the percent of photos from each site that were coded to each theme (Site C, Mactaquac). ...........................................................36
Table 3. Data volumes during filtering process. ...........................................................84
Table 4. Sample words for landscape value coding. ....................................................86
Table 5. Coding results of landscape values (all geo-tagged posts were imported for kernel density estimation, but some of them have no caption so that no values are coded). .........................................................................................................88
Table 6. Correlation testing results of landscape values and population density. ..........95
vi
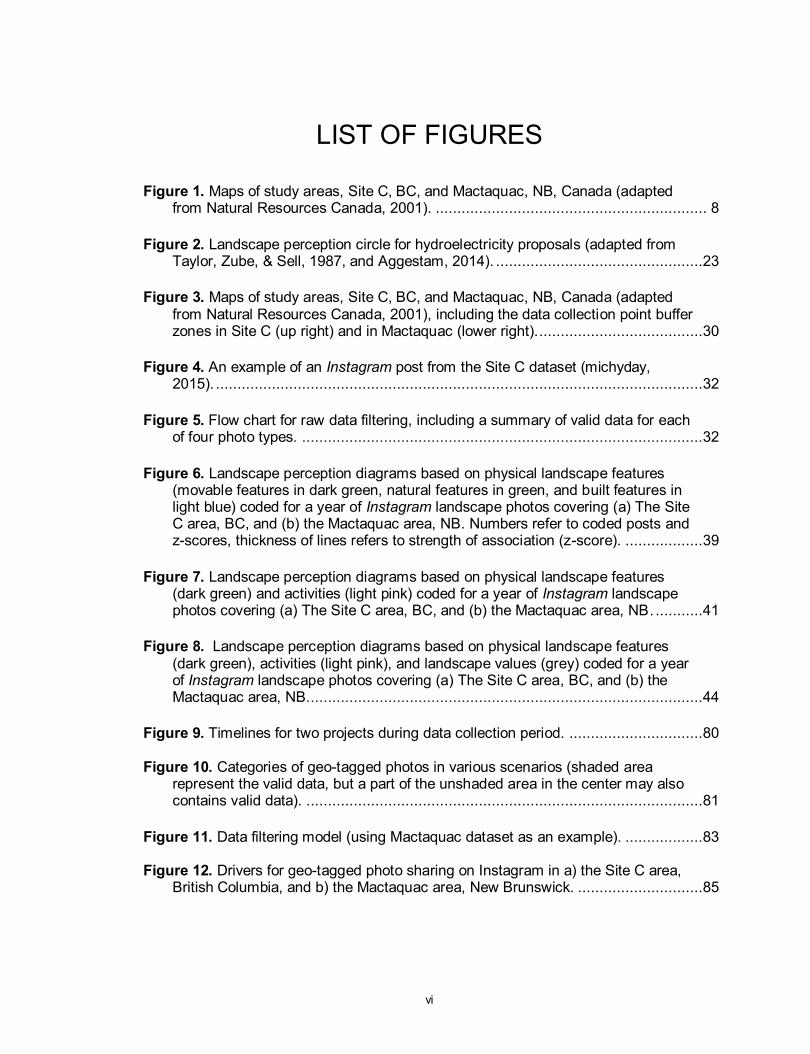
LIST OF FIGURES
Figure 1. Maps of study areas, Site C, BC, and Mactaquac, NB, Canada (adapted from Natural Resources Canada, 2001). ............................................................... 8
Figure 2. Landscape perception circle for hydroelectricity proposals (adapted from Taylor, Zube, & Sell, 1987, and Aggestam, 2014). ................................................23
Figure 3. Maps of study areas, Site C, BC, and Mactaquac, NB, Canada (adapted from Natural Resources Canada, 2001), including the data collection point buffer zones in Site C (up right) and in Mactaquac (lower right). ......................................30
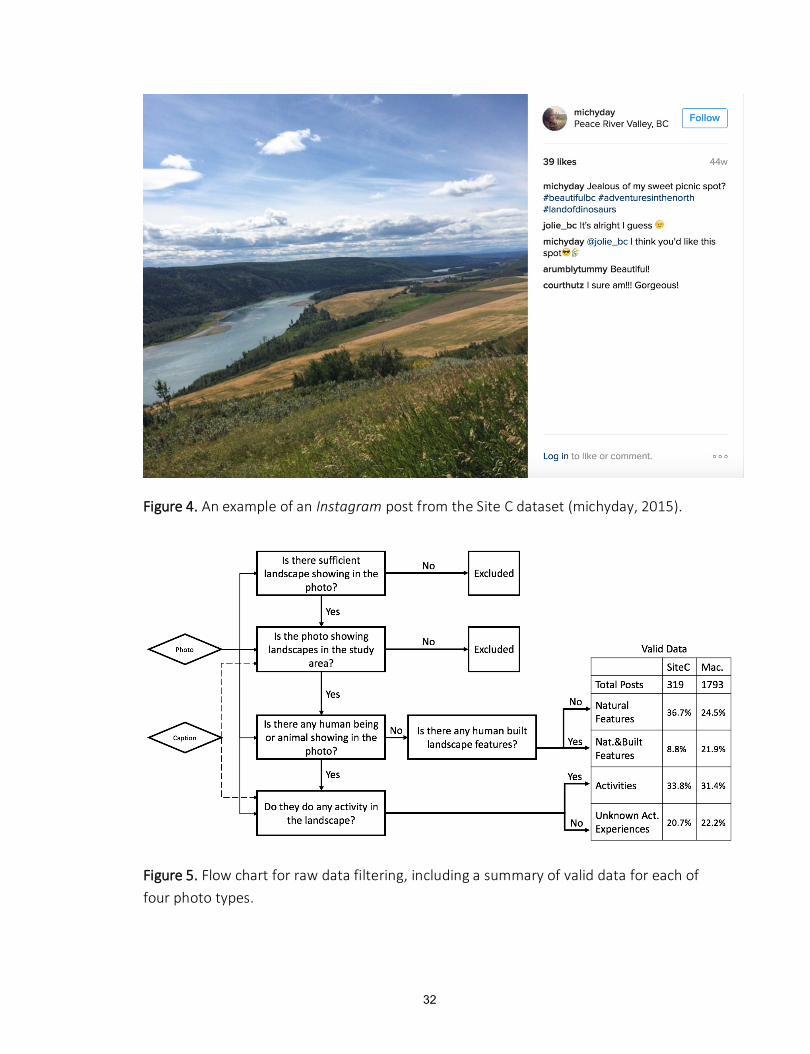
Figure 4. An example of an Instagram post from the Site C dataset (michyday, 2015). .................................................................................................................32
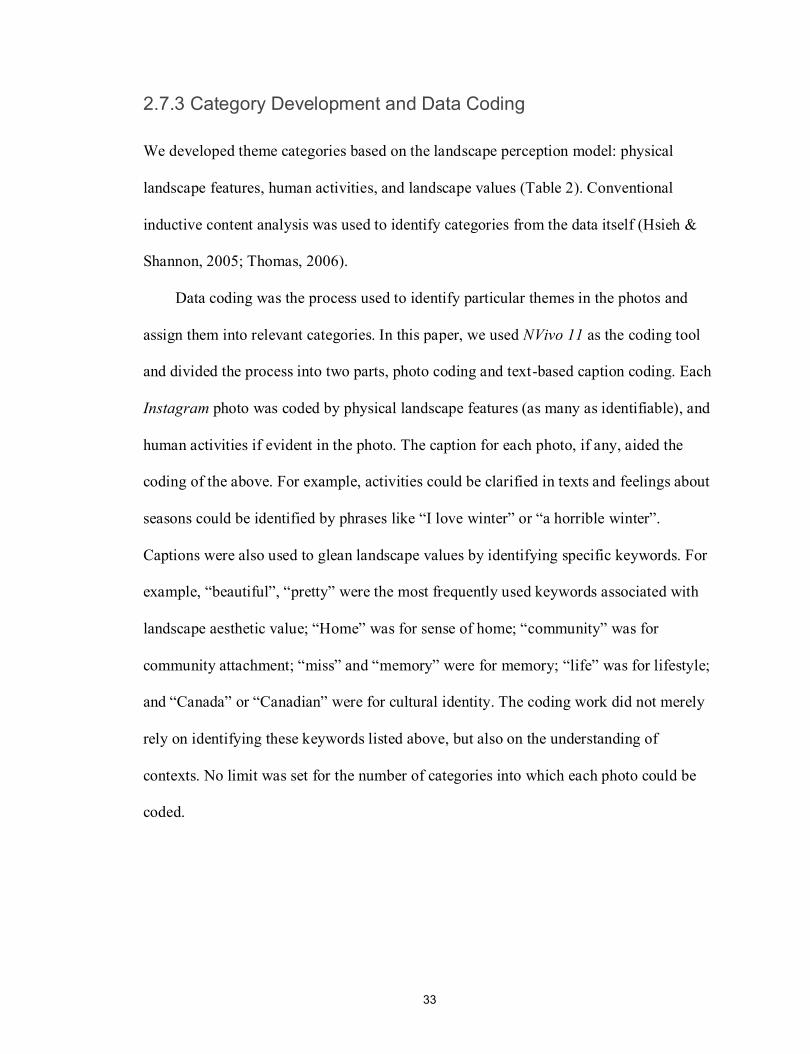
Figure 5. Flow chart for raw data filtering, including a summary of valid data for each of four photo types. .............................................................................................32
Figure 6. Landscape perception diagrams based on physical landscape features (movable features in dark green, natural features in green, and built features in light blue) coded for a year of Instagram landscape photos covering (a) The Site C area, BC, and (b) the Mactaquac area, NB. Numbers refer to coded posts and z-scores, thickness of lines refers to strength of association (z-score). ..................39
Figure 7. Landscape perception diagrams based on physical landscape features (dark green) and activities (light pink) coded for a year of Instagram landscape photos covering (a) The Site C area, BC, and (b) the Mactaquac area, NB. ...........41
Figure 8. Landscape perception diagrams based on physical landscape features (dark green), activities (light pink), and landscape values (grey) coded for a year of Instagram landscape photos covering (a) The Site C area, BC, and (b) the Mactaquac area, NB. ...........................................................................................44
Figure 9. Timelines for two projects during data collection period. ...............................80
Figure 10. Categories of geo-tagged photos in various scenarios (shaded area represent the valid data, but a part of the unshaded area in the center may also contains valid data). ............................................................................................81
Figure 11. Data filtering model (using Mactaquac dataset as an example). ..................83
Figure 12. Drivers for geo-tagged photo sharing on Instagram in a) the Site C area, British Columbia, and b) the Mactaquac area, New Brunswick. .............................85
vii
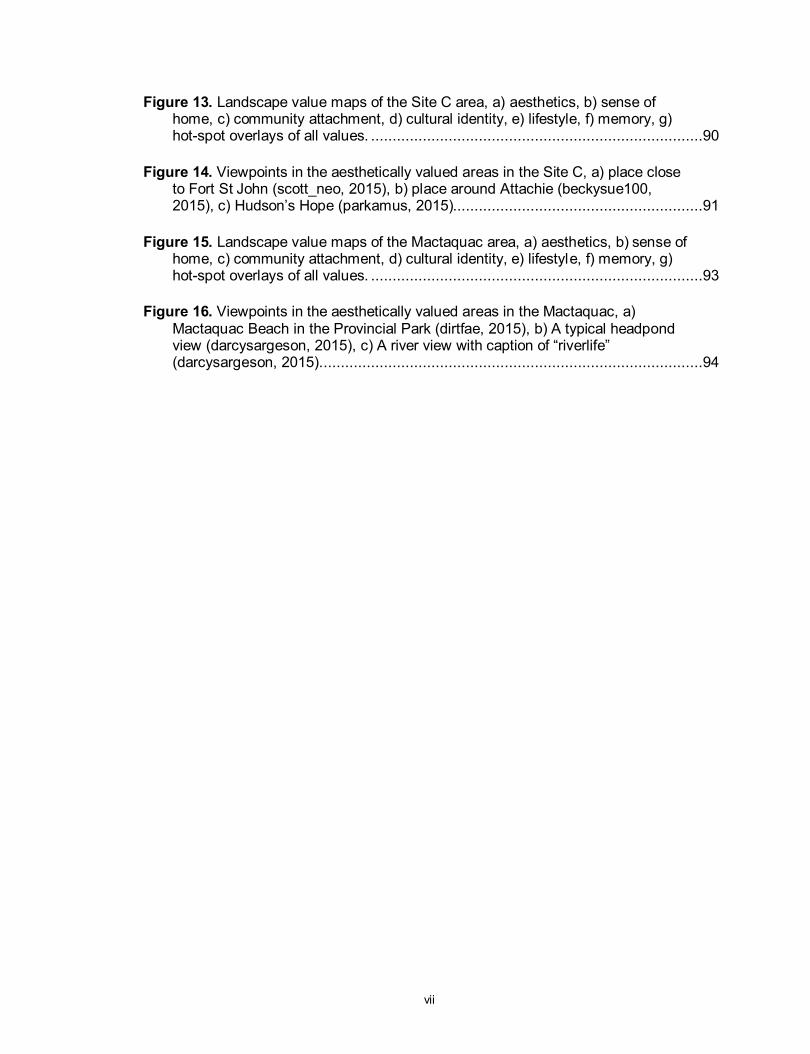
Figure 13. Landscape value maps of the Site C area, a) aesthetics, b) sense of home, c) community attachment, d) cultural identity, e) lifestyle, f) memory, g) hot-spot overlays of all values. .............................................................................90
Figure 14. Viewpoints in the aesthetically valued areas in the Site C, a) place close to Fort St John (scott_neo, 2015), b) place around Attachie (beckysue100, 2015), c) Hudson’s Hope (parkamus, 2015)..........................................................91
Figure 15. Landscape value maps of the Mactaquac area, a) aesthetics, b) sense of home, c) community attachment, d) cultural identity, e) lifestyle, f) memory, g) hot-spot overlays of all values. .............................................................................93
Figure 16. Viewpoints in the aesthetically valued areas in the Mactaquac, a) Mactaquac Beach in the Provincial Park (dirtfae, 2015), b) A typical headpond view (darcysargeson, 2015), c) A river view with caption of “riverlife” (darcysargeson, 2015). ........................................................................................94
viii
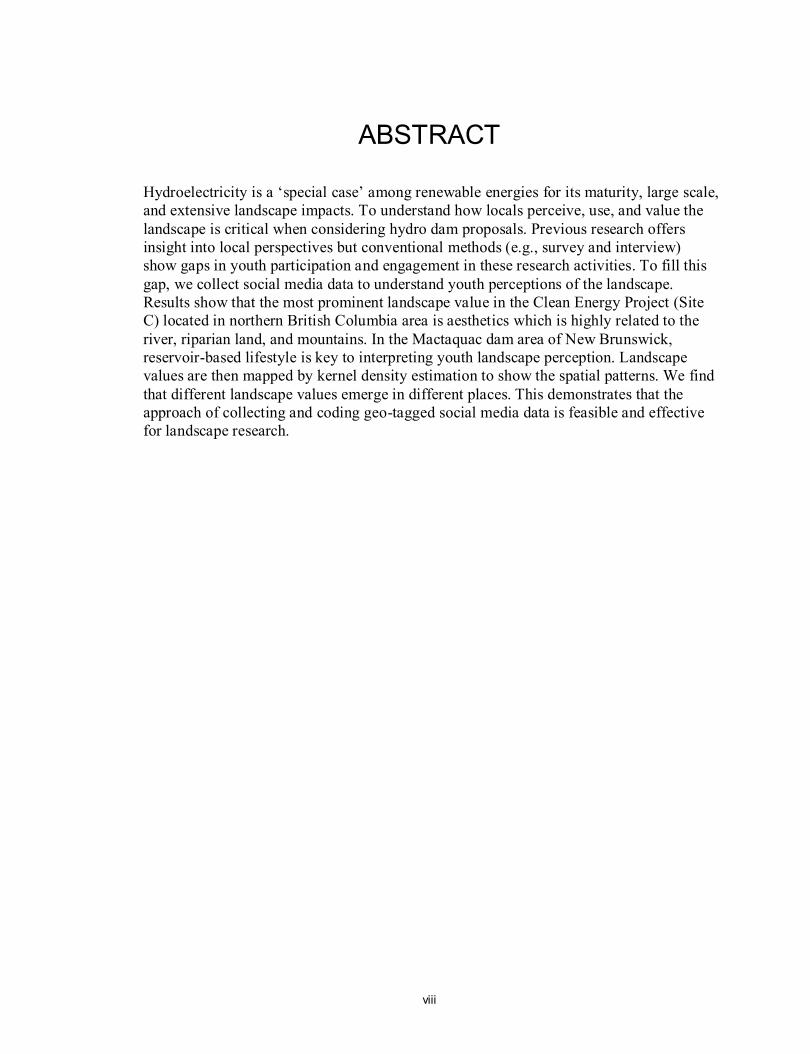
ABSTRACT
Hydroelectricity is a ‘special case’ among renewable energies for its maturity, large scale,
and extensive landscape impacts. To understand how locals perceive, use, and value the
landscape is critical when considering hydro dam proposals. Previous research offers
insight into local perspectives but conventional methods (e.g., survey and interview)
show gaps in youth participation and engagement in these research activities. To fill this
gap, we collect social media data to understand youth perceptions of the landscape.
Results show that the most prominent landscape value in the Clean Energy Project (Site
C) located in northern British Columbia area is aesthetics which is highly related to the
river, riparian land, and mountains. In the Mactaquac dam area of New Brunswick,
reservoir-based lifestyle is key to interpreting youth landscape perception. Landscape
values are then mapped by kernel density estimation to show the spatial patterns. We find
that different landscape values emerge in different places. This demonstrates that the
approach of collecting and coding geo-tagged social media data is feasible and effective
for landscape research.

ix
LIST OF ABBREVIATIONS USED
GIS – Geographic Information System
Mactaquac - Mactaquac Generating Station
PPGIS – Public Participation Geographic Information System
Site C - Site C Clean Energy Project
x
ACKNOWLEDGMENTS
I would like to express my sincere gratitude to my supervisor Dr. Kate Sherren for her
support of my master study in the past two years, with immense patience and
encouragement. She welcomed me to the broad research project where I started my
research to contribute to the big topic. She trained me to be a professional scholar and
guided my work including choosing the topic, identifying appropriate methods,
analyzing analysis, leading discussion, and writing papers. Her enthusiasm of doing
research to make the world better encourages me to pursue PhD in the future. Kate is not
only a mentor in my study, but also like a family to me and a dear friend in my life. I also
want to thank Dr. John Parkins who is my committee member, as well as the leader of
our energy landscape research project, for his support and motivation. He gave many
insightful comments for my thesis. I must also acknowledge Dr. Anatoliy Gruzd here for
his help in data collecting.
I also want to thank all SRES fellows and professors. A very special thanks goes
out to Ms. Mary MacGillivray. She helps all the time, specially in my most difficult time
in the first year.
Finally, I would like to thank my parents who are in China but support me all the
time. They wish me have a free and happy life no matter where I am or what I do. I
believe my graduate study life here is not only about learning things from school, but
also having a better life attitude and a better understanding of the outside world.
1
Chapter 1 Introduction
The development of renewable energy is intended to meet increasing energy demands
with arguably less impact on the environment than conventional resources. Renewable
energy has been criticized, however, as bringing social disruption in terms of landscape
changes, displacement, health issues, and so on. Hydro energy proposals are more
controversial than other renewable energies because by storing the water resource in a
state of potential energy it holds back the flow, significantly changing and domesticating
(sensu Lee, 1998) water bodies and the landscape around them. Thus, it is critical for
decision makers to understand how people perceive and value affected landscapes, to
adapt or discard hydropower-related proposals and/or design their associated stakeholder
engagement. In recent decades, social scientists have attempted to understand social and
cultural landscapes and to integrate these factors into landscape evaluation (Taylor, Zube,
& Sell, 1987; Brown & Reed, 2000; Beverly et al., 2008; Zhu et al., 2010; Butler, 2016),
where early research mostly focused on the economic and biophysical aspects (Litton,
1968).
To capture a more integrated concept of landscape perception, many research
approaches (e.g., survey, interview, focus group, etc.) are used with several drawbacks
such as high costs and demographic biases. Demographic bias is the most critical one:
young people are less active in research activities (Luckman, Lagemann, & Menzel,
2013; Keilty, Beckley, & Sherren, 2016) and stakeholder or civic engagement processes
2
(Delli Carpini, 2000; Pasek, Kenski, Romer, & Jamieson, 2006; Sloam, 2012), instead
often expressing opinions and attitudes, and documenting their lives, on social media
(Quintelier & Vissers, 2008; Park, Kee, & Valenzuela, 2009). Using social media data as
secondary data can overcome drawbacks such as high cost, low response rates, and
inevitable influences from researchers in conventional approaches. Previous studies
showed that data from image-sharing sites can contribute to landscape research but are
far underutilized (Barry, 2014). The situation calls for improvements or alternative ways
to conduct landscape research.
This thesis explores a photo-sharing social media site, Instagram, to see if it is
effective to use such photos to reveal young people’s landscape perceptions in places
facing hydro-related disruption. Given the photo data are collected based on the geo-tag
of each Instagram post, this thesis also demonstrates the capacity to map the landscape
values in the study areas to show place-specific perceptions. The results will be discussed
to inform decision makers about the potential conflicts and impacts that landscape
changes under different proposal scenarios represent for youth. Most importantly,
perhaps, this thesis looks at a new approach of using social media data, discussing the
advantages and limitations compared to conventional methods.
1.1 Context
Due to climate change, energy security, and increasing energy demand, renewable
energy is reported as generally acceptable and socially favored for future energy
development (Wang, Nistor, Murty, & Wei, 2014; Corscadden et al., 2016), but also
causes problems as well, such as landscape changes and health issues. Among various
3
types of renewable energy, hydropower has played a dominant role in meeting Canada’s
electricity needs (Canadian Hydropower Association, 2008, cited in Wang et al., 2014).
By 2012, hydroelectricity had become the primary energy source in Canada, comprising
over 60% of its total energy generation (Canadian Electricity Association, 2013, citied in
Wang et al., 2014). In some provinces, such as Ontario, Quebec, British Columbia, and
Manitoba, the hydropower system has been expanding for decades, with developments
that were also critiqued as overbuilding infrastructure and which caused many problems,
for example, social disruptions among aboriginal people who vigorously opposed the
hydro development (Karl, 2014).
Compared to other renewable facilities, such as wind turbines or solar panels that
are mostly considered as localized visual interruptions on the landscape, hydro dam is a
‘special case’ in terms of its maturity, scale, and landscape impacts (Keilty et al., 2016).
Hydropower has the longest history among renewable energies, and dams are reported as
diverting rivers and displacing millions of people around the world (The World
Commission on Dams, 2000). The size of individual dams is often bigger than other
types of renewable energy infrastructure such as solar and wind. The consequent impacts
on the landscape are not limited at the construction site and its viewshed only which is
usually the case for renewable energies. Instead, dams cause extensive disruptions in
relation to water impoundment or eventually river restoration. These significant changes
can domesticate landscapes, bringing new visual resources, ecosystem, patterns of human
settlements, as well as their altered lifestyles (Hough, 1990). In New Brunswick, for
instance, the construction of the Mactaquac Generating Station (Mactaquac) forced local
residents to relocate and to change the way they led their lives before the dam, and
4
dramatically changed the nature of the communities and lifestyles the landscape fostered
(Keilty et al., 2016).
Conflicts around hydropower proposals arouse researchers’ interest in
understanding how local residents perceive – whether accepting or opposing – such
energy infrastructure. In Canada, decision making processes for hydro dam projects
mostly focus on the economic, environmental, and energy security aspects (Corscadden
et al., 2016). Gaps often exist, however, in terms of social impacts, particularly in the
consideration of landscape. Questions such as how local people perceive, use, and feel
about their landscape account less for the final decision than the economic benefits or
ecological disruptions (Corscadden et al., 2016). In practice, social factors are criticized
as difficult to quantify, assess, and incorporate because of their intangible and subjective
nature (Tenerelli, Demšar, & Luque, 2016). Also, since individuals see landscapes
through personal lenses of experience, individual values can differ widely on landscape
issues. This fragmentation of perspectives can challenge collective decision-making, and
even weaken the perceived importance of incorporating social issues in the related
processes.
Despite the difficulties, in the area of landscape research, various approaches have
been used in past decades to better understand people’s landscape perceptions to inform
scholars and decision makers. Surveys, interviews, and focus groups are widely used in
conventional landscape research (Hunziker, 1995; Brown & Reed, 2000; Keating, 2012;
Keilty et al., 2016). Photo elicitation has also become popular, which asks participants to
take photos of landscape features (Sherren, Fischer, & Price, 2010), as well as Q-sort
methodology that provides participants a set of landscape photos to rank (Kaymaz, 2012;
Navratil et al., 2013). Most recently, Brown and his colleagues have advanced public
5
participation GIS (PPGIS) which asks people from different places to locate and
sometimes rank landscape values on maps (Brown & Brabyn, 2012; Brown & Reed,
2012; Brown & Donovan, 2014; Brown, Weber, & de Bie, 2014). This method helps
identify the perceived values of the landscape in specific places to analyze how the
physical landscape changes, the cultural history, and other drivers can affect the values
within a small geographic scale.
Although some of the approaches mentioned above are effective for understanding
landscape perceptions and mapping values place-specifically, drawbacks also exist. First,
the cost of data collection is high in terms of time and money, even for quite low sample
sizes. Second, inevitable influences from researchers in face-to-face approaches like
photo-elicitation can affect objectivity. Third, and most importantly, there is
demographic bias in that younger generations are generally less active in public
engagement (Checkoway, Allison, & Montoya, 2005; Luckman et al., 2013). In our
research areas in particular, recent research shows the difficulty of reaching younger
generations to understand their opinions toward decisions facing the landscape (Keilty et
al., 2016; Sherren et al., 2016). This gap arises despite the fact that it is critical to fully
understand young people’s perceptions of current landscape, including how they view
the physical features, how they use and value the landscape, because they will inherit the
landscape in the future.
To collect data from social media sites as secondary data seems like a logical way to
fill the gaps in youth voices and underestimation of social/cultural landscape values, as
well as to overcome other drawbacks in conventional approaches. In general, social
media has become the main platform for young people to express their opinions and
feelings, and document their lives (Delli Carpini, 2000; Quintelier & Vissers, 2008; Park,
6
Kee, & Valenzuela, 2009). Research that leverages social media data is growing, but
there is less development in using data from photo-sharing sites. In landscapes studies, a
few productive attempts have been made. For example, Barry (2014) collected photos
from Flickr to understand public values about cattle grazing on park lands; and Martínez
Pastur et al. (2015) used geo-tagged images posted on Panoramio to identity hot-spots of
cultural ecosystem services. Instagram, however, is currently one of the most popular
photo-sharing platforms among young people, yet has not been exploited for landscape
research.
A new approach based on collecting photographic and textual data from Instagram
may help to understand how landscapes are perceived, used and valued before and/or
after installations, particularly by those young people who are less likely to willingly
share.
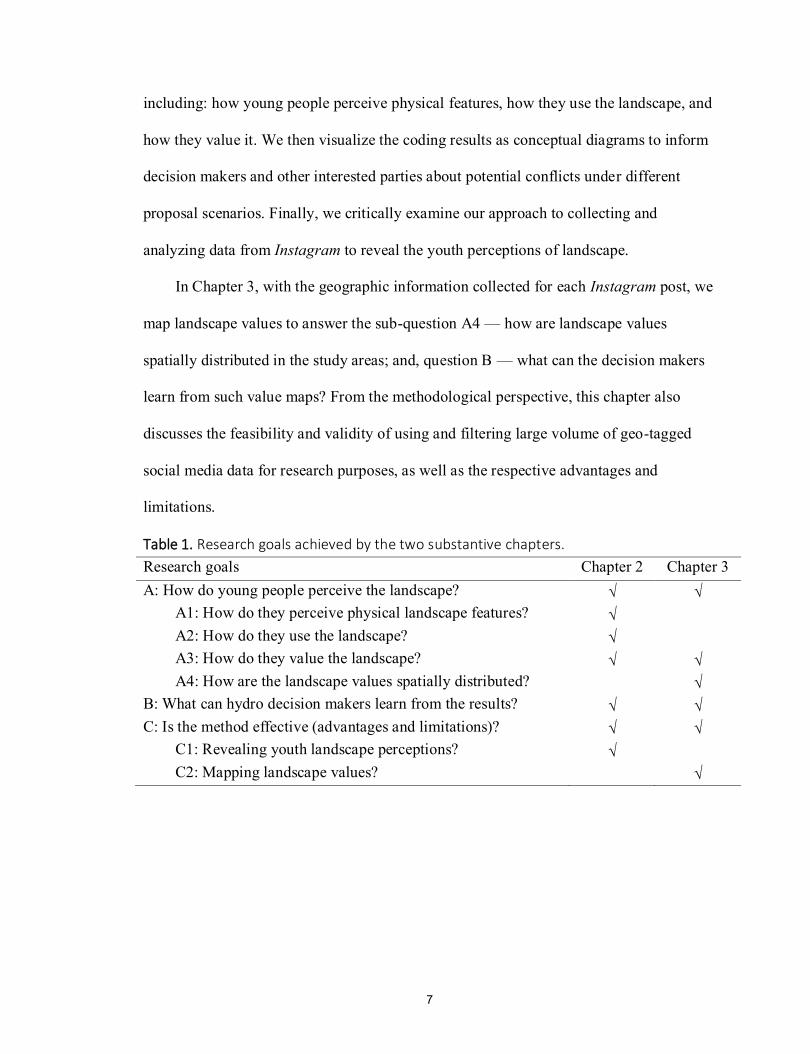
1.2 Research Goals
This thesis is composed of two papers prepared for publication. It aims to address three
main research goals: A) how do young people perceive the landscape in the study areas;
B) what do results mean for decision makers considering hydropower proposals for the
two cases; and C) is the demonstrated approach of using social media data effective in
revealing young people’s landscape perceptions or mapping landscape values? These
goals will be achieved by two papers as two substantive chapters in this thesis, covering
a handful of research sub-questions (Table 1).
In Chapter 2, we code photos and text-based captions for a year’s worth of
Instagram posts around hydroelectricity proposals to answer sub-questions A1-A3,
7
including: how young people perceive physical features, how they use the landscape, and
how they value it. We then visualize the coding results as conceptual diagrams to inform
decision makers and other interested parties about potential conflicts under different
proposal scenarios. Finally, we critically examine our approach to collecting and
analyzing data from Instagram to reveal the youth perceptions of landscape.
In Chapter 3, with the geographic information collected for each Instagram post, we
map landscape values to answer the sub-question A4 — how are landscape values
spatially distributed in the study areas; and, question B — what can the decision makers
learn from such value maps? From the methodological perspective, this chapter also
discusses the feasibility and validity of using and filtering large volume of geo-tagged
social media data for research purposes, as well as the respective advantages and
limitations.
Table 1. Research goals achieved by the two substantive chapters.
Research goals Chapter 2 Chapter 3
A: How do young people perceive the landscape? √ √
A1: How do they perceive physical landscape features? √
A2: How do they use the landscape? √
A3: How do they value the landscape? √ √
A4: How are the landscape values spatially distributed? √
B: What can hydro decision makers learn from the results? √ √
C: Is the method effective (advantages and limitations)? √ √
C1: Revealing youth landscape perceptions? √
C2: Mapping landscape values? √
8
1.3 Methods
1.3.1 Sites Rationale
We use two hydroelectric dam projects as our study cases, the prematurely aging
Mactaquac Generating Station (Mactaquac), New Brunswick, and the in-progress Site C
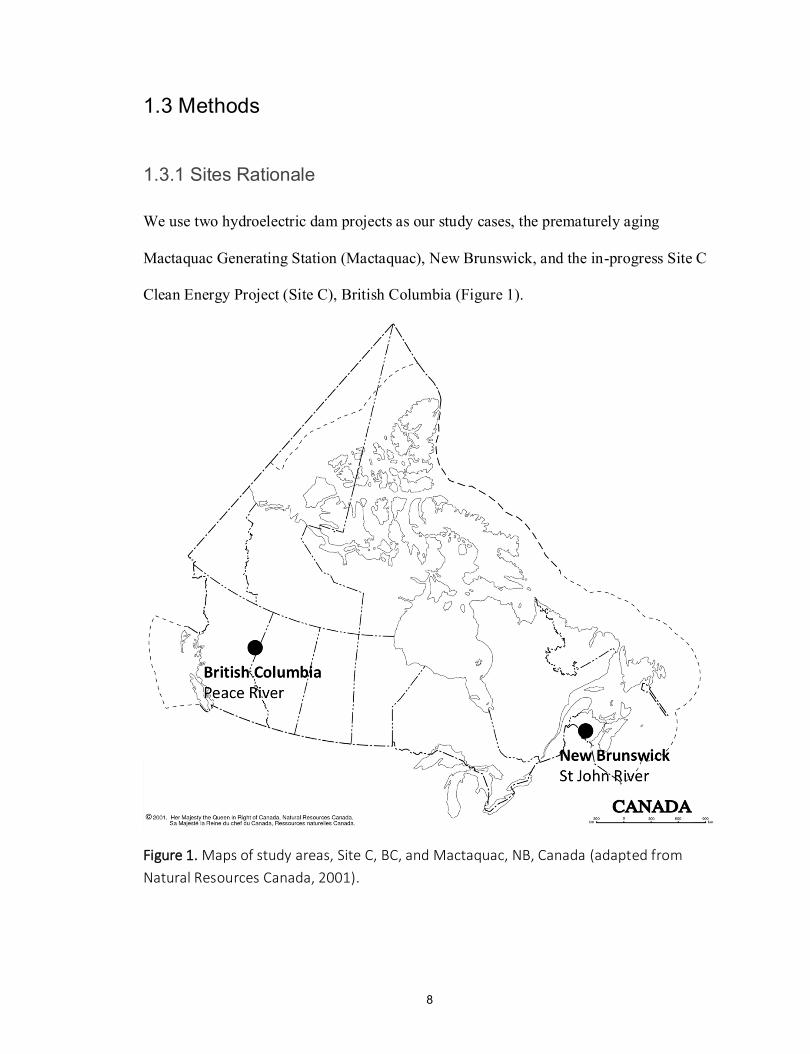
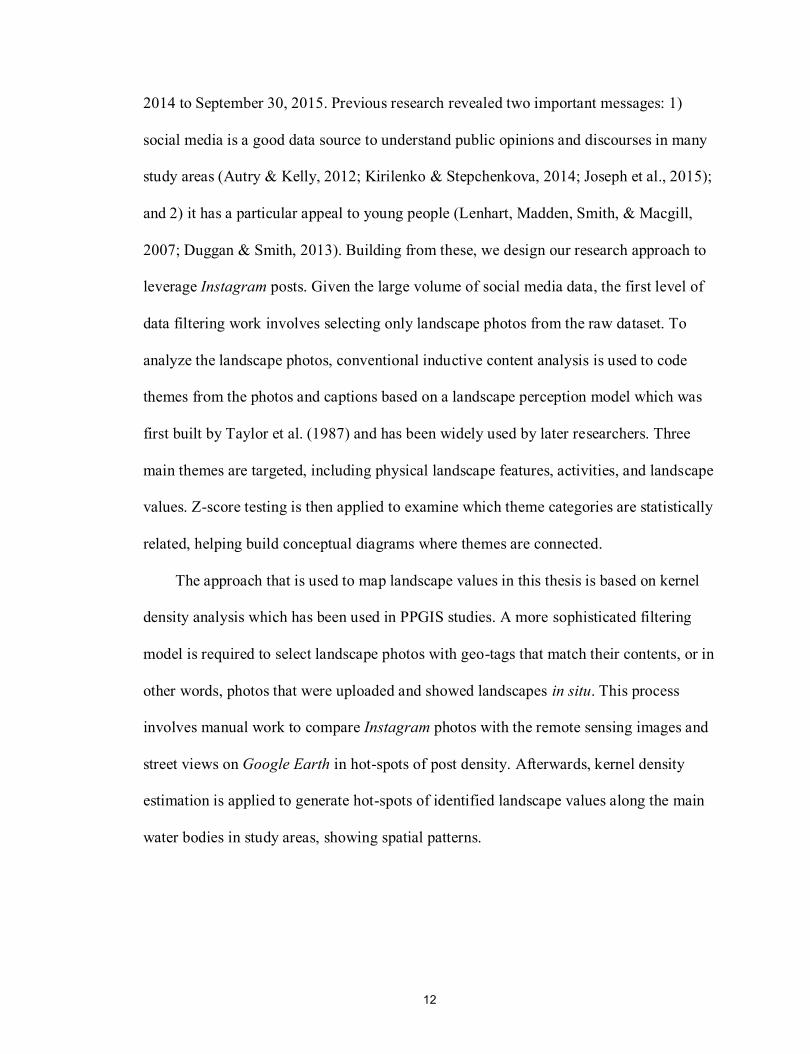
Clean Energy Project (Site C), British Columbia (Figure 1).
Figure 1. Maps of study areas, Site C, BC, and Mactaquac, NB, Canada (adapted from
Natural Resources Canada, 2001).
9
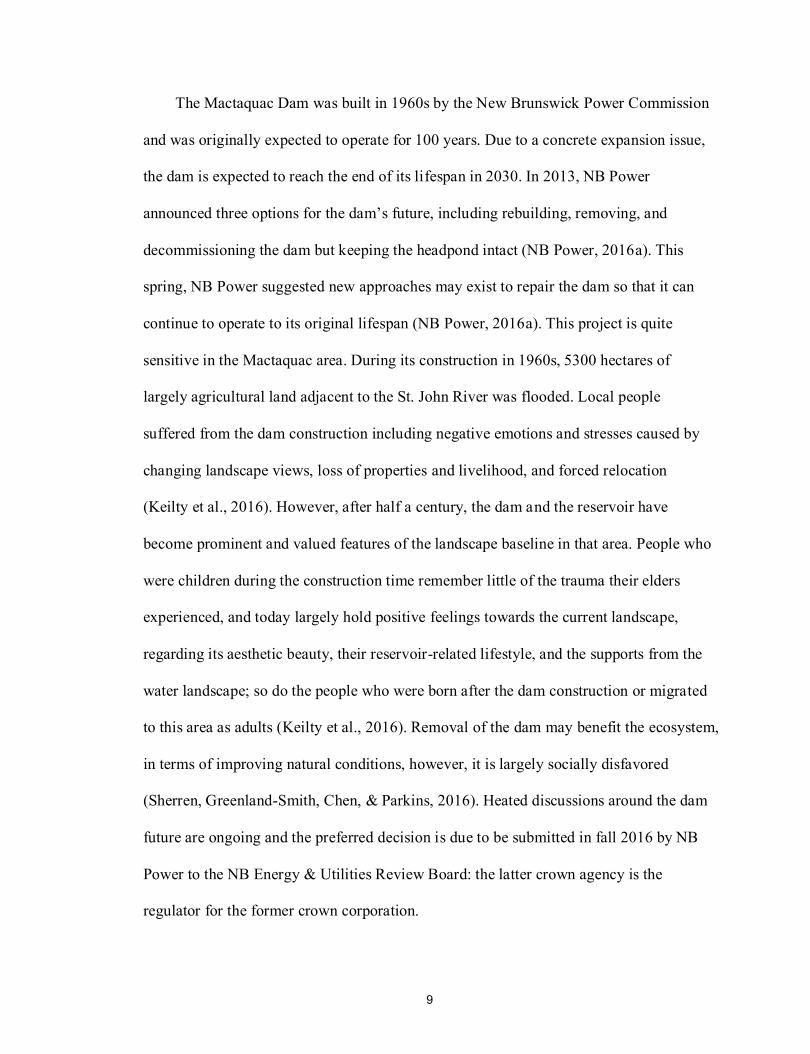
The Mactaquac Dam was built in 1960s by the New Brunswick Power Commission
and was originally expected to operate for 100 years. Due to a concrete expansion issue,
the dam is expected to reach the end of its lifespan in 2030. In 2013, NB Power
announced three options for the dam’s future, including rebuilding, removing, and
decommissioning the dam but keeping the headpond intact (NB Power, 2016a). This
spring, NB Power suggested new approaches may exist to repair the dam so that it can
continue to operate to its original lifespan (NB Power, 2016a). This project is quite
sensitive in the Mactaquac area. During its construction in 1960s, 5300 hectares of
largely agricultural land adjacent to the St. John River was flooded. Local people
suffered from the dam construction including negative emotions and stresses caused by
changing landscape views, loss of properties and livelihood, and forced relocation
(Keilty et al., 2016). However, after half a century, the dam and the reservoir have
become prominent and valued features of the landscape baseline in that area. People who
were children during the construction time remember little of the trauma their elders
experienced, and today largely hold positive feelings towards the current landscape,
regarding its aesthetic beauty, their reservoir-related lifestyle, and the supports from the
water landscape; so do the people who were born after the dam construction or migrated
to this area as adults (Keilty et al., 2016). Removal of the dam may benefit the ecosystem,
in terms of improving natural conditions, however, it is largely socially disfavored
(Sherren, Greenland-Smith, Chen, & Parkins, 2016). Heated discussions around the dam
future are ongoing and the preferred decision is due to be submitted in fall 2016 by NB
Power to the NB Energy & Utilities Review Board: the latter crown agency is the
regulator for the former crown corporation.
10
The Site C Dam is an in-process new project on the Peace River, British Columbia,
in western Canada. The proposal was announced in 2010, followed by a series of actions,
including project approval by the provincial government in 2014, and the beginning of
construction in the summer of 2015. Firm opposition appeared and is ongoing despite the
advanced stage of construction. The proponent, BC Hydro, justified the proposal by
claiming economic benefits and increased employment, but the joint review panel report
on the environmental impact statement stated that the negative effects on the ecosystem
and the landscape in this area would be significant and irreversible (BC Hydro & Power
Authority British Columbia, 2014). Most recently, a year after its construction began, the
protests are still going (Amnesty International, 2016). Unless they are successful, the
new dam will cause flooding over 3000 hectares of fertile farmland to create the storage
reservoir (Hume, 2014). The local concerns focus on the loss of current natural landscape,
the Peace Valley ecosystem, fishing populations after dam construction, agricultural
traditions, and First Nations (Chen, 2015).
Site C is a demographically older and less densely populated location compared to
Mactaquac, although both are similar in their proportion of young people. The
Mactaquac area reported 97238 people in 2011 (census division of York county,
including the provincial capital of Fredericton,), over 50% more than the Site C area at at
60082 (census division of Peace River region, including regional centre Fort St. John)
(Statistics Canada, 2011). The population density in Mactquac was 12 people per square
kilometer in that same year, compared with only 0.5 in Site C. There were similar
average numbers of people per private dwelling across the sites, at 2.2 for Mactaquac and
2.3 for Site C, suggesting similar family sizes. The median age of the population in Site
C at 40.2 was older than Mactaquac at 34.3. Yet, residents who were within the age
11
range of 15 to 34 accounted for similar proportions: 26.9% in Mactaquac, and 30% in
Site C (Statistics Canada, 2011).
The general landscape in the two areas are similar, though differences also exist.
The Mactaquac area is generally flatter than Site C. Site C is located further north
compared to Mactaquac, so that the winter in the former is usually longer and colder. The
yearly average temperature in Site C was 2.3 °C from 1981 to 2010, and 5.2 °C in
Mactquac. While the latter area had more yearly snowfall (189.6 cm in Site C and 237.1
in Mactaquac), snow stays on the ground longer at Site C due to the colder temperatures
(147 compared with 109 days) (Environment and Natural Resources Canada, 2016a&b).
Both areas have strong First Nations cultures (Mi’kmak and Maliseet in the East and
Saulteau, Beaver (Dunne-za), and Cree in the West) and a long farming tradition traced
back to 1700s for Mactaquac and 1900s for Site C (Lawson, Farnsworth, & Hartley,
1985; Pollon & Matheson, 2003; Treaty 8 Tribal Association, 2015). The dam locations
are each within a short distance of a significant town (Fredericton, NB, and Fort St. John,
BC), with an upstream area of farmland and small resource towns.
The different local attitudes and opinions toward the two dams, given their
respective histories, provide an interesting opportunity to compare youth perceptions in
the face of hydro-related landscape change. This work seems necessary and insightful for
the decision-makers in the specific cases and in similar situations, as well as scholars of
renewable energy and landscape perceptions and change.
1.3.2 Approaches
This thesis will use photos and text-based captions that were geo-tagged to the two study
areas from a photo-sharing social media site, Instagram, via Netlytic from October 1,
12
2014 to September 30, 2015. Previous research revealed two important messages: 1)
social media is a good data source to understand public opinions and discourses in many
study areas (Autry & Kelly, 2012; Kirilenko & Stepchenkova, 2014; Joseph et al., 2015);
and 2) it has a particular appeal to young people (Lenhart, Madden, Smith, & Macgill,
2007; Duggan & Smith, 2013). Building from these, we design our research approach to
leverage Instagram posts. Given the large volume of social media data, the first level of
data filtering work involves selecting only landscape photos from the raw dataset. To
analyze the landscape photos, conventional inductive content analysis is used to code
themes from the photos and captions based on a landscape perception model which was
first built by Taylor et al. (1987) and has been widely used by later researchers. Three
main themes are targeted, including physical landscape features, activities, and landscape
values. Z-score testing is then applied to examine which theme categories are statistically
related, helping build conceptual diagrams where themes are connected.
The approach that is used to map landscape values in this thesis is based on kernel
density analysis which has been used in PPGIS studies. A more sophisticated filtering
model is required to select landscape photos with geo-tags that match their contents, or in
other words, photos that were uploaded and showed landscapes in situ. This process
involves manual work to compare Instagram photos with the remote sensing images and
street views on Google Earth in hot-spots of post density. Afterwards, kernel density
estimation is applied to generate hot-spots of identified landscape values along the main
water bodies in study areas, showing spatial patterns.
13
1.4 Limitations
Using social media data in this thesis overcomes some of the drawbacks in conventional
methods mentioned above, though, limitations are revealed in other aspects. First, the
dataset is only derived from young people who were using Instagram and geo-tagging
their posts, which is not a comprehensive sample even of young people, given social
media preferences, rural internet access and other barriers to participation. Second, the
area of data collection is limited by the settings of Netlytic: the tool can only collect geo-
tagged posts within a 5km radius around each given geographic point. Third, the filtering
process cannot ensure that all invalid data are filtered out of the dataset. The large data
size does not allow manual processing for each photo, so we only do so for those posted
within potential hotspots, where the likelihood and risk of a systematic error or bias are
higher. When using social media data, there is always this dilemma between the large
volume of data and its precision. Additionally, errors can be introduced by the analyst
due to a lack of personal familiarity with either area. In future, new semantic classifiers
may be needed to establish automatic analysis models to solve these problems. These are
the main limitations of this thesis, other concerns will be respectively discussed in
Chapter 2 and Chapter 3.
1.5 Project Background
This thesis is a part of the research project titled “Energy Transitions in Canada:
Exploring the social, cultural and ethical dimensions of a changing energy landscape”,
funded by the Social Sciences and Humanities Research Council of Canada. The grant is
held by Dr. John Parkins (University of Alberta), with Dr. Thomas Beckley (University
14
of New Brunswick) and Dr. Kate Sherren (Dalhousie University). This project aims to
reveal social understanding of energy landscape changes across Canada to draw insights
for future energy development: what is needed, desirable, and possible. Our team
members have conducted research in British Columbia, Alberta, Ontario, and New
Brunswick with multiple methods such as surveys, interviews, citizen jury, focus group,
and Q-method. This thesis applies a new approach, using social media data to code and
map landscape values, to contribute to one of the project’s goals to understand
individually held landscape values and how this can influence responses to energy
proposals.
1.6 Organization of Thesis
This thesis is organized around two publishable papers. Each paper includes its own
comprehensive literature review and detailed methods sections. Chapter 2 contains the
first paper which aims to understand youth perceptions and use of the hydroelectric
energy landscape. This part of the work codes Instagram photos and captions into three
main themes, landscape features, activities, and values. Chapter 3 then furthers the work
from conceptual to spatial mapping in which landscape values are located in the study
regions. This directs the research to a geographic reality where we can foresee the
potential changes of perceived landscape values and challenges for locals along the
affected water bodies. The two papers both attempt to discuss the feasibility and
effectiveness of digging data from social media and applying it in landscape research.
Because my committee members are co-authors on both substantive chapters, the term
“we” and “our” is used throughout the thesis for consistency with those chapters.
15
The term ‘social media’ is used as singular in this thesis, given common usage,
rather than plural. Also, we need to explain the ethics and copyright issues that are raised
by using social media data for research here. All the posts we collected from Instagram
are public data, namely the user’s account and content are set as public for all visitors.
Thus, by using public data, ethical review was not required in this thesis. However, to
use the photos as examples, we have to respect the copyright owned by users (Instagram,
2016). We thus decided not to anonymize the photographers, instead citing usernames
and the post links appropriately in American Psychological Association style (see figure
14 and 16). In addition, using these photos in this thesis may be justified under “Fair
Dealing” (see Dalhousie University Fair Dealing Policy, 2013).
16
Chapter 2 Understanding youth perception and
use of hydroelectric energy landscapes via
social media
Yan Chena, John R Parkinsb, Kate Sherrena
a School for Resource and Environmental Studies, Dalhousie University, Halifax, NS,
Canada
b Department of Resource Economics and Environmental Sociology, University of
Alberta, Edmonton, AB, Canada
2.1 Statement of Student Contribution
This paper is prepared for submission to the journal Landscape Research. Chen collected
the data, conducted analysis, and wrote all sections of this manuscript. Dr. Sherren
contributed to the research topic, methods for content coding, and writing process by
editing this paper. Dr. Parkins contributed to editing as well. Both of them provided
supervisory comments all through the process.
2.2 Acknowledgements
This research was supported by Energy Transitions in Canada Project, funded by the
Social Sciences and Humanities Research Council of Canada, and Nova Scotia Graduate
Scholarship. The authors wish to thank Dr. Anatoliy Gruzd, who is the developer of
Netlytic, for assistance with data collecting.
17
2.3 Abstract
Hydroelectric energy landscape change, in terms of the visual resources that shift and the
resulting ecosystem conversion, has impacts on local settlement patterns, residents’
perceptions, and their lifestyles. The younger generation that inherits these shifting
energy landscapes is underrepresented in conventional public engagement processes. To
fill this gap, we collected data from Instagram, where this demographic cohort dominates
the medium. Photos showing landscapes were coded into theme categories, and
conceptually linked based on co-occurrence. Focusing on two hydroelectricity project
locations in Canada, the proposed Site C Dam, British Columbia, and the Mactaquac
Dam built in 1960s, New Brunswick, main findings were discovered in both study cases:
(1) river, riparian land, and mountains were commonly seen together; (2) specific
features enabled different activities and shaped lifestyles; (3) aesthetics and place
attachment were the most critical landscape values. Predictable changes to landscape
features, such as river and farm properties, will directly affect young people in the Site C
area with construction; whereas the Mactaquac will be impacted by lifestyle changes
around the reservoir under the dam removal scenario.
2.4 Keywords
Content-sharing Social Media; Generation Y; Hydroelectric Dam; Instagram; Landscape
perception; Social Impact Assessment
18
2.5 Introduction
Energy proposals that lead to water impoundment, such as hydroelectric dams, are
different from many others in that a new visual landscape, ecosystem, and sometimes
amenity emerges, which can in turn change local settlement patterns, residents’
perceptions, and their lifestyles (Hough, 1990). Water landscapes are important in part
for their relationship to various landscape features (Menarguez & Holgado, 2014). The
appearance of energy facilities in a water setting thus causes an interruption to a
continuous landscape (Parkhill, Butler, & Pidgeon, 2014; Filova, Vojar, Svobodova, &
Sklenicka, 2015) such as flooded lands, new headpond features and surrounding parks
and recreation areas. Such construction initiates a process of reforming visual resources
and reestablishing ecosystems, which interacts with landscape and cultural changes,
resettlements of local communities, and shifting economics and livelihoods. Human
perceptions of landscape and human behaviors will change accordingly with the
alterations of the physical landscape, and their experiences in it.
Younger generations will inherit the large-scale landscape changes caused by
hydroelectric energy projects and likely will live longer with the consequences of those
landscape changes. But this demographic is often underrepresented in conventional
stakeholder engagement processes (Checkoway, Allison, & Montoya, 2005; Luckman,
Lagemann, & Menzel, 2013; Keilty, Beckley, & Sherren, 2016). Though apathy has
generally increased over the past 30 years, people under the age of 25 show the highest
decrease of interest in politics and public affairs (Delli Carpini, 2000; Pasek, Kenski,
Romer, & Jamieson, 2006; Sloam, 2012). Much of the engagement (e.g. discussion,
activism) around public issues that do occur within this demographic cohort - Generation
19
Y or so-called Millennials who were born from early 1980s to early 2000s - happens on
social media (Delli Carpini, 2000; Quintelier & Vissers, 2008; Park, Kee, & Valenzuela,
2009) where this generation also documents their lifestyles and other attitudes.
Such online documentation makes social media a valuable source of secondary data
to help proponents and decision-makers anticipate the impacts of energy proposals on
this important but largely invisible demographic. Text-based social media, such as
Twitter, has been leveraged by decision-makers to share information, listen to opinions,
and facilitate public discourse (Vieweg, Hughes, Starbird, & Palen, 2010; Autry & Kelly,
2012; Smith, 2014; Kirilenko & Stepchenkova, 2014; Joseph et al., 2015). Image-sharing
social media sites, such as Instagram and Flickr, are thus far underutilized, yet provide
rich insight for landscape research (Barry, 2014). Unlike Twitter, which is more
explicitly political, messages carried by landscape images on social media often imply
landscape perceptions, preferences, and lifestyles, which are all of importance for energy
proposals (Chen, 2015).
In this paper, we capitalize upon the above characteristics of social media use with
attention to Instagram photos and accompanied captions from two study areas facing
hydroelectricity-related landscape change: the degrading Mactaquac Generating Station
(Mactaquac), New Brunswick, and the in-progress Site C Clean Energy Project (Site C),
British Columbia. We use a landscape perception model by Taylor et al. (1987)
integrated by psychophysical, experiential, and cognitive paradigms, which are
respectively related to physical features, activities, and landscape values. We apply
conventional inductive content analysis to code Instagram data and z-score testing to
measure the relationships among the coding themes. Based on these, we build perception
diagrams to understand how the current landscapes were perceived by young people in
20
terms of physical features, human activities, and landscape values. Further discussion is
focused on how their perceptions may change in the context of energy proposals at each
site based on our findings, and what challenges they may face with these changes.
2.6 Theoretical Background
2.6.1 Landscape and Landscape Perception
The term landscape has no universal definition. Early research started with a division
between objective and subjective landscape. The English word landscape is an old
Germanic term covering two distinct components: “(1) landscape as a tract of land
regarding its physical shape, and (2) as a space with the presence of human beings’ daily
lives and points of view alongside the actual land” (von Maltzahn, 1994, p. 109). Early
geographer Sauer (1974) also defined landscape as an association of forms, both physical
and cultural. Ambrose (1969) pointed out that geographers at that time had been aware of
the division between objective and subjective environment. The objective or physical
aspect of landscape refers to the actual land, a mix of natural features (e.g., ocean, rock,
soil) and built human features (e.g., bridge, building, road). The subjective or cultural
landscape is perceived in the human mind, which can vary with each individual. Even the
subjective elements, however, have to rely in part on the objective, in other words, has to
be stimulated by what the actual land inspires for eye or experience (von Maltzahn, 1994;
Stedman, 2003).
Based on this palpable division between objective and subjective landscape,
previous landscape research was conducted with a main focus on one or the other. Litton
(1968) discussed different landscape compositional types, which implied that landscape
21
might be better described and inventoried as a visual and physical entity other than a
state of mind. However, other researchers considered landscape as more subjective in the
context of culture, society, and history so that the same landscape could embody different
meanings for different people. Ambrose (1969) talked about the importance of human
thoughts and behaviors in place research, in the cultural and historical contexts. Meinig
(1976) identified ten different ways to see a landscape, most of which were based on the
subjectivity of landscape. Greider and Garkovich (1994) also emphasized that physical
landscape was imposed meanings by human culture which sought reflections of itself.
More recently, the line between objective and subjective landscape has faded with
researchers viewing landscape as an integrated concept. A precursor in this integrated
study area, Tuan (1979) explained his thoughts on landscape with a balanced and
systematic description that landscape is a physical world necessary for human livelihood
as well as a space for humans to act and contemplate. His definition of landscape
encouraged those following to explore landscape in relationships and interactions
between nature and culture, physical and psychological, and external and internal. A
currently accepted definition of landscape given by the European Landscape Convention
furthers the emphasis on relationships between physical place and human perception:
“landscape as area, as perceived by people, whose character is the result of the action and
interaction of natural and/or human factors” (Council of Europe, 2000, p. 2).
Many studies in the last decade have focused on identifying and interpreting such
relationships between the natural elements and the cultural memes deeply rooted in the
integrity of landscape (Soini, Vaarala, & Pouta, 2012; Kyle, Jun, & Absher, 2014;
Menarguez & Holgado, 2014). Landscape perception research has also moved to a more
holistic stage where physical landscape and values, human senses, and their experiences
22
are systematically examined and discussed. Butler and Berglund (2014) defined
landscape perception as “involving direct physical contact and experience with the
simultaneous use of all senses” (p. 221). Dupont, Antrop, and Eetvelde (2014) similarly
indicated this new transition in their observation that human beings and their senses are
the bridge to connect the physical landscape when observing and experiencing it.
2.6.2 Landscape Perception Model
Understanding local and non-local landscape perception of landscape is critical for
decision-making around a hydroelectric energy project. The landscape perception circle
(Figure 2) explains that human perceptions of the current landscape can affect
hydroelectric energy development proposals in terms of the social acceptability of such
projects as sought through public consultation. Implementations of the projects can later
reshape the landscape, and the new landscape will impact human perceptions in another
project (this conceptual framework was adapted from Aggestam, 2014).
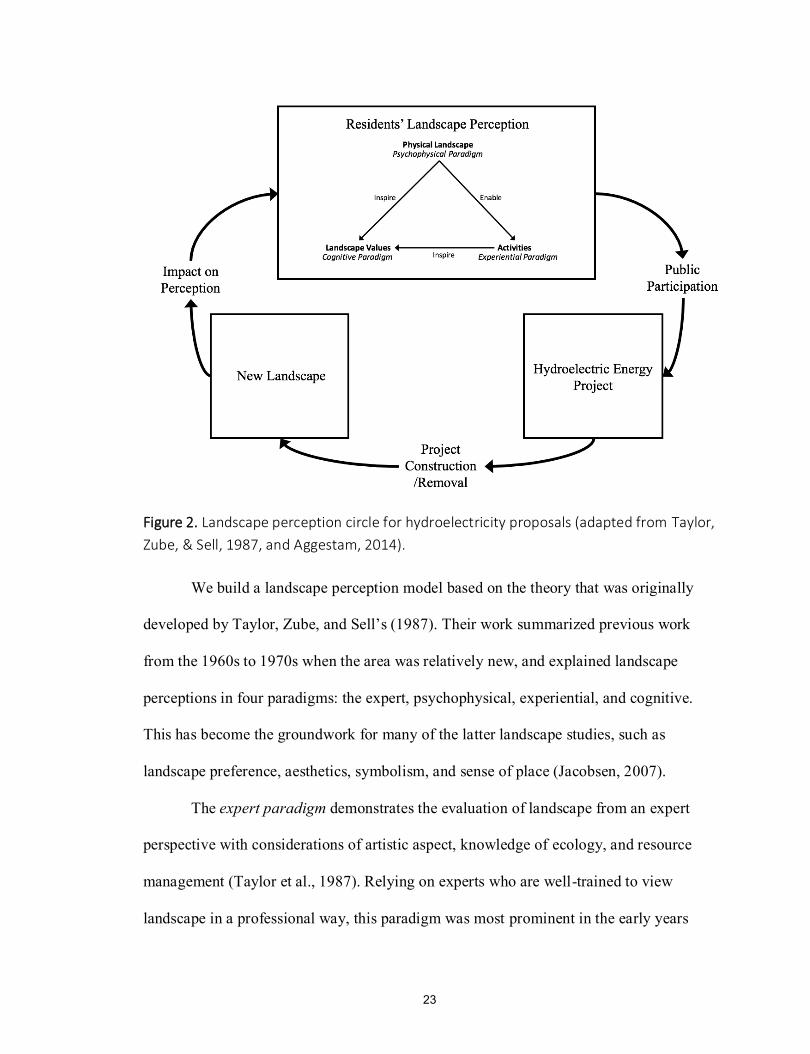
23
Figure 2. Landscape perception circle for hydroelectricity proposals (adapted from Taylor,
Zube, & Sell, 1987, and Aggestam, 2014).
We build a landscape perception model based on the theory that was originally
developed by Taylor, Zube, and Sell’s (1987). Their work summarized previous work
from the 1960s to 1970s when the area was relatively new, and explained landscape
perceptions in four paradigms: the expert, psychophysical, experiential, and cognitive.
This has become the groundwork for many of the latter landscape studies, such as
landscape preference, aesthetics, symbolism, and sense of place (Jacobsen, 2007).
The expert paradigm demonstrates the evaluation of landscape from an expert
perspective with considerations of artistic aspect, knowledge of ecology, and resource
management (Taylor et al., 1987). Relying on experts who are well-trained to view
landscape in a professional way, this paradigm was most prominent in the early years
24
(Litton, 1968), but less applied recently when the landscape evaluation is more linked to
ordinary people’s judgments (Jacobsen, 2007).
The psychophysical paradigm is widely accepted and the basis of many ranking and
sorting techniques in landscape research, such as the Q-sort questionnaire (Kaymaz,
2012; Navratil et al., 2013). It emphasizes a stimulus-response relation between physical
landscape features and people’s perceptions without conscious thought (Taylor et al.,
1987). It aims to identify what aspects of physical landscape is valued. Such inherent
value may be associated with the fact that a certain landscape feature enables people to
do particular activities or offers specific meanings. Under this paradigm the focus is on
landscape features, understanding which are preferred by people to view and show, and
how commonly perceived features will enable activities and inspire values.
The experiential paradigm captures human perceptions of landscape from
experiences in the landscape and the outcomes of such interactions (Taylor et al., 1987).
In this sense, the focus is not the individual human or landscape feature, but the entire
sensory immersion of human beings in the landscape, which can eliminate the dichotomy
between human and environment (Carlson, 2012). Research methods based on this
paradigm have been widely used in landscape perception research, such as field tours and
on site interviews (Hunziker, 1995; Keating, 2012; Sherren et al., 2016). Analyzing
human activities in the landscape under this paradigm considers how people use the
landscape and identifies relationships between features and human experiences.
The cognitive paradigm derives from a more subjective perspective, where people
perceive landscape by selecting features that have value to them (Taylor et al., 1987).
This is a construct comprised of the visual aspects of a physical landscape and the
specific activities enabled there. The cognitive paradigm explores why specific
25
landscapes are valued. Research conducted on landscape values by implementing this
paradigm not only identify the valuable landscape features, but also facilitate participants
to think and explain why these are valued (Scolozzi, Schirpke, Detassis, Abdullah, &
Gretter, 2015). Other landscape research related to landscape preference and symbolism
was also developed on this paradigm (Jacobsen, 2007).
The model we built covers three of the paradigms (Figure 2). The psychophysical
paradigm was used to interpret the physical landscapes perceived by the young people.
These physical landscape features might enable human beings to do particular activities,
represented by the experiential paradigm. Both physical landscape features and activities
in the landscape can inspire landscape values, the rationales and stimulants that the
cognitive paradigm represents. In brief, local landscape perceptions are an outcome of
physical landscape, human interactions with it, and subsequent landscape values. The
expert paradigm is an outsider perspective, which does not fit into our research to
understand young residents’ perceptions via coding their photos.
2.6.3 Hydroelectricity Landscapes and Youth Engagement
Hydroelectric dams are unlike other energy installations for the scale and nature of their
landscape impacts – giving them more in common with impoundments for agricultural
irrigation or flood control – and are thus subject to numerous concerns about the
presence of utilitarian infrastructure in water landscapes. Rivers were the birthplaces of
most ancient civilizations, providing appropriate conditions for livelihoods and
transportation (Menarguez & Holgado, 2014). Studies show that the presence of water is
always seen as positive by people (i.e. ‘hydrophilia’ as coined by Bernaldez, 1985; see
also Luckmann et al., 2013; Filova et al., 2015). Changes in water landscapes, however,
26
can cause local stress whereby hydroelectric energy facilities may often be initially
stigmatized with causing the deterioration of nature, the environment, and the visual
landscape (Parkhill et al., 2014).
Hydroelectric energy projects cause remarkable landscape and lifestyle changes
(Atkins, Simmons, & Roberts, 1998), and thus require a full understanding of public
perspectives on these changes, particularly among those who interact with the landscape.
A more accurate identification of local interests will allow proponents to adapt proposals
and decisions in relation to a fuller understanding of stakeholder values and needs
(Aggestam, 2014; Butler & Berglund, 2014). Culturally, researchers note that shared
values are diminished in contemporary society, replaced by greater cultural and values
diversity, perpetuated by the information age where an understanding of such diversity
may help to mitigate potential conflicts and tensions (Butler & Berglund, 2014).
Conventional public engagement (e.g., public hearings, consultations, surveys), however,
may not always be effective or efficient in this digital society due to the systematic
demographic biases introduced by voluntary participation. Recent landscape research
conducted in the Mactaquac area, New Brunswick, has shown the difficulty of reaching
the younger generations to understand their opinions toward decisions facing the
landscape (Keilty et al., 2016; Sherren et al., 2016; NB Power, 2016b).
Social media, as one of the main communication tools among young people, can
provide rich insight on their thoughts and opinions. Today’s young people prefer to use
social media for information acquisition, exchange, and dissemination. This is not only
limited to their private lives, but also public lives. One study indicated that Generation Y,
born from 1977 to 1990, is more likely than older generations to use social networking
sites (Cabral, 2011). They spend more time using online communication tools and are
27
more comfortable doing so than older adults (Raacke & Bonds-Raacke, 2008). Social
media sites such as Twitter and Instagram have a particular appeal to younger adults
(Lenhart, Madden, Smith, & Macgill, 2007; Duggan & Smith, 2013). The activity of
young people on such sites suggests that the gap in understanding about their landscape
perceptions can be filled in part by analyzing social media data.
2.7 Methods
We leverage the age bias in Instagram users to consider online information close to two
current hydroelectricity proposals as indicative of perceptions and lifestyles of young
residents. We use thematic coding and statistics to generate perception diagrams that
reveal young people’s use and perceptions of the current landscape, and anticipate
potential impacts under different hydroelectric energy proposal scenarios. That
anticipation is based on the fact that specific landscape features will be changed by
constructing or removing a dam and the associated reservoir. The new landscape formed
by these changes will affect people’s landscape perceptions in various ways. The
alterations of the physical landscape, as well as perceived landscape, will bring various
challenges and opportunities to young people in terms of lifestyle, cultural identity, and
place attachment.
The first research question focuses on understanding the common landscape
perception among young people in two study areas. Specifically:
(1) What were the physical landscape features commonly photographed?
(2) What activities were associated with those physical landscape features?
28
(3) What landscape values were identified in the photo captions, and how were they
associated with landscape features and activities?
The second research question uses the above to anticipate how young people’s
landscape perception might change if the landscape changes based on current
hydroelectricity proposals. Can our conceptual diagrams help us to anticipate the
challenges for them to react to these changes and potentially adapt to a new landscape?
2.7.1 Study Areas
The Mactaquac Dam, New Brunswick, operated by NB Power, has the capacity of
generating 668 MW of renewable energy, 12% of the provincial needs (NB Power, 2014).
Since its construction in the late 1960s, the landscape in that area has been changed by
flooding of the reservoir (Jacques Whitford Environment Limited, 2004). Many people
opposed the dam at the time, but it was part of a rural modernization program by the
government and was approved despite public concerns for communities and the
ecosystem (Canadian Rivers Institute, 2011). Many residents lost their houses and land.
Fifty years later, the utility is facing another choice due to the early end of the Mactaquac
Dam’s serviceable life in 2030. There are four options for its future: first, repowering the
dam; second, retiring the dam but retaining the reservoir; third, removing the dam and
restoring the river, and last, repairing the dam (NB Power, 2016a). These options have
triggered public discussions about economic concerns, environmental impacts, and other
social issues (Sherren et al., 2016). A decision is due in late 2016.
Compared with the situation of the Mactaquac Dam, the proposed Site C project is
in progress to become a new dam in the Peace River catchment, flooding about 3000
hectares of fertile, low-lying farmland under the reservoir (Hume, 2014). The Joint
29
Review Panel report on BC Hydro’s environmental impact statement about the Site C
Dam revealed that the effect of the project on the landscape would be a significant
adverse effect which would be irreversible (BC Hydro & Power Authority British
Columbia, 2014). The environmental assessment report of the Site C project was
approved by the Province of British Columbia on December 16, 2014 and its
construction began in the summer of 2015 (BC Hydro, n.d.). This has caused heated
discussions across the province and local stress. In early July, 2015, BC Hydro issued the
construction notification letters for the Site C to aboriginal communities and regional
governments, attached with an overview of its 10-year construction schedule (BC Hydro,
2015).
While the case studies differ in many ways, the general landscape is similar. Both
dam locations are within a short distance of a significant town (Fredericton, NB,
population 56,000; Fort St. John, BC, population 19,000), with an upstream area
characterized by farmland and small resource towns (<5,000 people each). The
Mactaquac area was cleared for farming starting in the late 1700s by United Empire
Loyalists from the American Revolution, rewarded with land along the St. John River for
their loyalty to England (Lawson, Farnsworth, & Hartley, 1985). The Peace River valley
was the site of exploration and mineral prospecting in the late 1700s and 1800s and only
cleared by farmers in the early decades of the 1900s (Pollon & Matheson, 2003). Both
dams are the most downstream of three on their respective rivers.
The two dams are at different phases of their lifecycles. The landscape formed by
the Mactaquac Dam and its reservoir has been appreciated for decades by local residents
(Keilty et al., 2016). To remove the dam is the least preferred option in that area, but
there is little debate outside the region. However, the Site C Dam plan has caused wide
30
rejection within local communities, as well as negative mobilization in far-flung
population centers such as the provincial capital of Victoria (Chen, 2015; Amnesty
International, 2016). The opposite opinions toward hydroelectric energy facilities in New
Brunswick and British Columbia represent the fact: residents largely want to keep the
current landscape. Our research analyzed photographic and text-based data from both
study areas to explain people’s landscape perceptions at different phases of a
hydroelectric dam project, and in different areas.
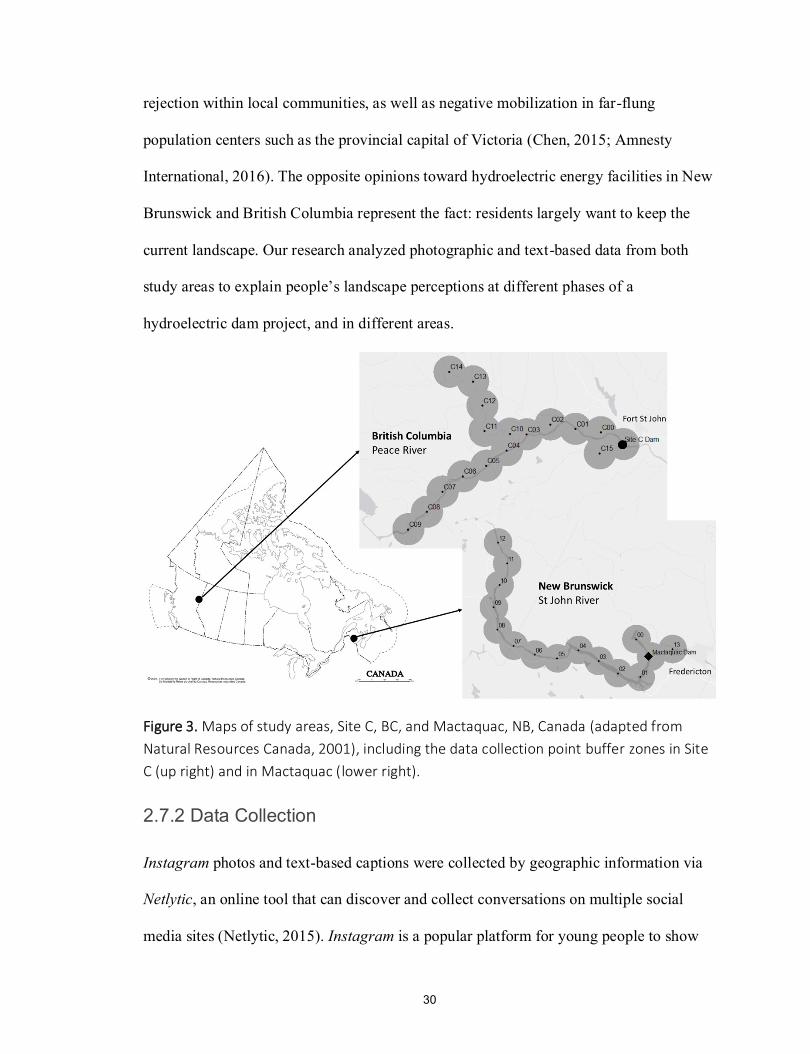
Figure 3. Maps of study areas, Site C, BC, and Mactaquac, NB, Canada (adapted from
Natural Resources Canada, 2001), including the data collection point buffer zones in Site
C (up right) and in Mactaquac (lower right).
2.7.2 Data Collection
Instagram photos and text-based captions were collected by geographic information via
Netlytic, an online tool that can discover and collect conversations on multiple social
media sites (Netlytic, 2015). Instagram is a popular platform for young people to show
31
their personal lives and engage in public life. In September 2015, it had 400 million
monthly active users (Statista, 2015). According to a survey conducted by the Pew
Research Center, over 90% of the 150 million Instagram users are under the age of 35
(Smith, 2014). In April 2015, 55% of Instagram users were under age of 29 and 83%
under 49, and the proportion of younger users on Instagram had grown (Duggan, 2015).
We chose 17 data collection points in the Site C area, British Columbia, and 15
points in the Mactaquac Dam area, New Brunswick, representing the planned and actual
reservoir extent, respectively (Figure 3). Netlytic retrieved the links of Instagram posts
which contain geographic information and were uploaded within a 5km radius around
each point in two study areas, over the year from October 1, 2014 to September 30, 2015.
We selected Instagram posts in which the photos showed sufficient landscape of the
study areas to interpret (see an example in Figure 4). The text-based captions for each
photo were also retrieved for analysis. After data filtering (Figure 5), the Site C Dam had
a final data sample of 319 posts and the Mactaquac had 1793 posts. We categorized posts
(photos and captions) into four groups among which the photos showing natural
landscapes or human activities were more frequent than that of built features or
unknown-activity experiences in the landscape. Besides the young bias of Instagram use
as discussed above which supports our research need, we confirmed that all of the users
who contributed to valid data were young by looking at the faces showing in the photos
or other ‘selfies’ from the same Instagram account.
32
Figure 4. An example of an Instagram post from the Site C dataset (michyday, 2015).
Figure 5. Flow chart for raw data filtering, including a summary of valid data for each of
four photo types.
33
2.7.3 Category Development and Data Coding
We developed theme categories based on the landscape perception model: physical
landscape features, human activities, and landscape values (Table 2). Conventional
inductive content analysis was used to identify categories from the data itself (Hsieh &
Shannon, 2005; Thomas, 2006).
Data coding was the process used to identify particular themes in the photos and
assign them into relevant categories. In this paper, we used NVivo 11 as the coding tool
and divided the process into two parts, photo coding and text-based caption coding. Each
Instagram photo was coded by physical landscape features (as many as identifiable), and
human activities if evident in the photo. The caption for each photo, if any, aided the
coding of the above. For example, activities could be clarified in texts and feelings about
seasons could be identified by phrases like “I love winter” or “a horrible winter”.
Captions were also used to glean landscape values by identifying specific keywords. For
example, “beautiful”, “pretty” were the most frequently used keywords associated with
landscape aesthetic value; “Home” was for sense of home; “community” was for
community attachment; “miss” and “memory” were for memory; “life” was for lifestyle;
and “Canada” or “Canadian” were for cultural identity. The coding work did not merely
rely on identifying these keywords listed above, but also on the understanding of
contexts. No limit was set for the number of categories into which each photo could be
coded.
34
2.7.4 Measures
Coding results showed some of the themes co-occurred more frequently than others. Z-
score testing (Li & Stepchenkova, 2012) was applied to examine the relationships among
theme categories to discover the codes that co-occurred significantly more often than if
randomly associated given the prevalence of each code. This helped to understand how
they were perceived by young people and in what way the change of one feature can
affect activities and values.
The z-score testing method followed the process explained in Li and Stechenkova’s
(2012) work:
N= total number of photos
fK = the number of photos in which object K occurs
fL = the number of photos in which object L occurs
K and L are independently of one another, so
fKL = the number of photos in which object K and L co-occur
pKL = the possibility of co-occurrence of K and L= pKpL
EKL = expectation of the number of photos in which K and L co-occur =
NpKpL
Var = variance = NpKpL(1- NpKpL)
Z-score=
Z-score shows the difference between observation and expectation. A z-score higher than
1.96 indicates the co-occurrence of K and L in the same photo is at a significant level,
which means the theme categories K and L are more likely to be simultaneously coded to
the same photo. Z-score testing results helped to identify the significantly positive
relationships among landscape theme categories. These relationships were diagrammed
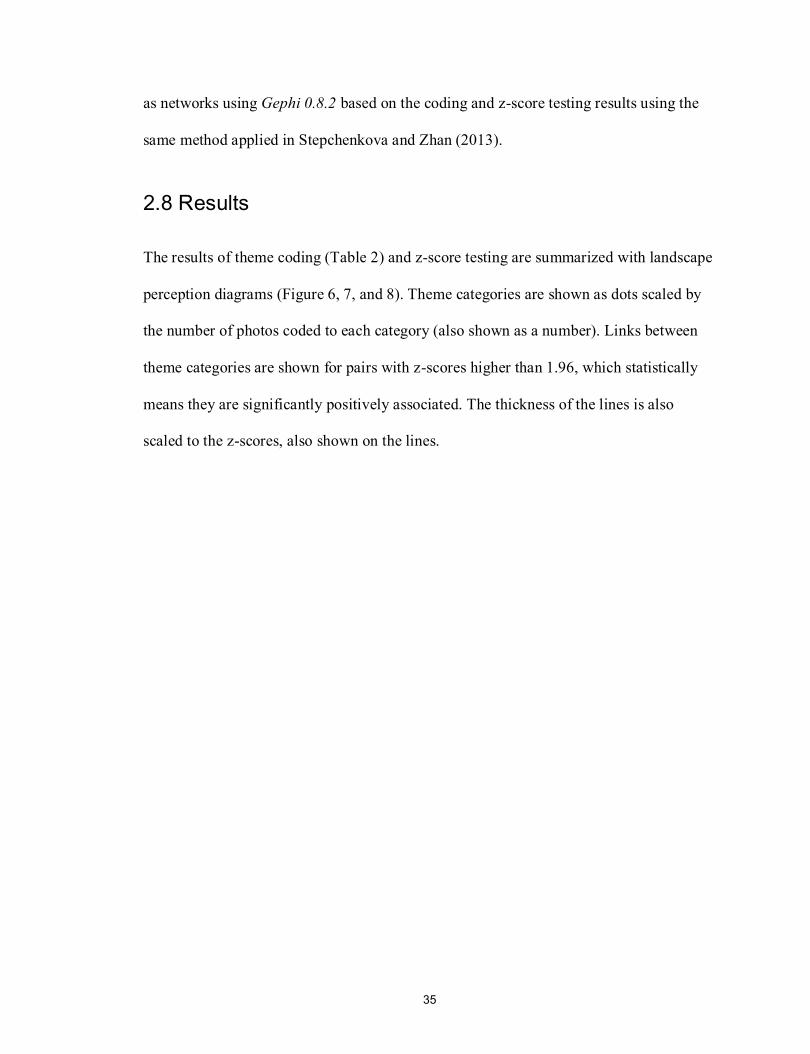
35
as networks using Gephi 0.8.2 based on the coding and z-score testing results using the
same method applied in Stepchenkova and Zhan (2013).
2.8 Results
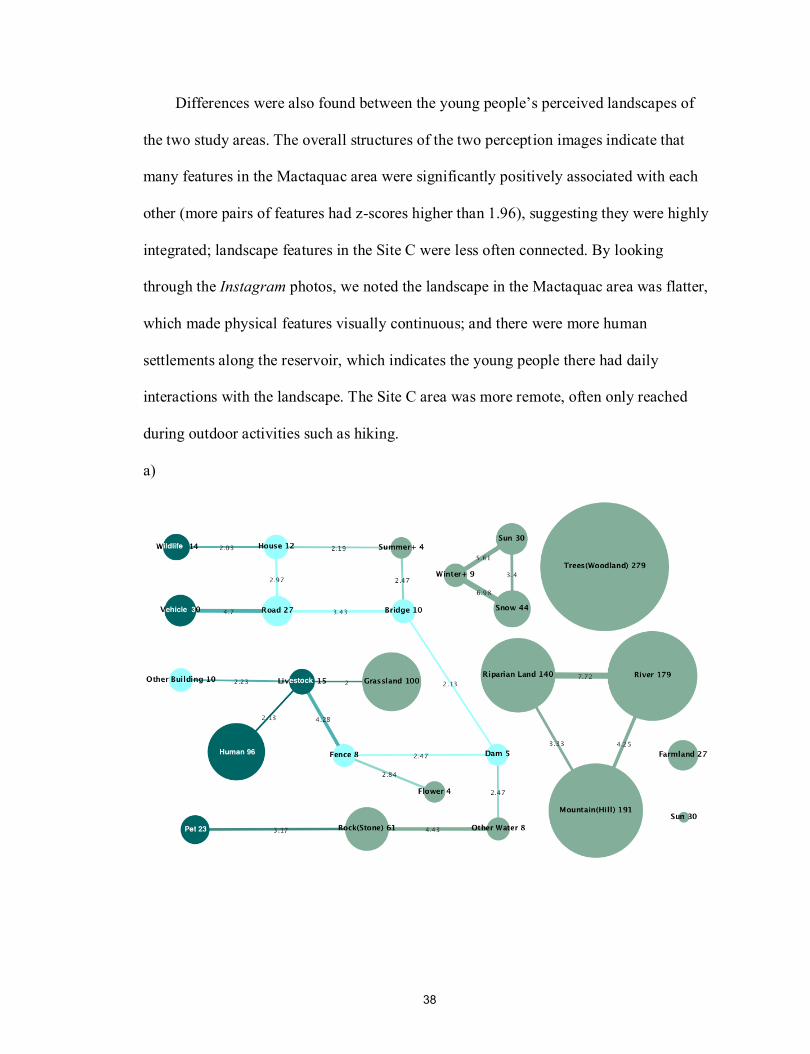
The results of theme coding (Table 2) and z-score testing are summarized with landscape
perception diagrams (Figure 6, 7, and 8). Theme categories are shown as dots scaled by
the number of photos coded to each category (also shown as a number). Links between
theme categories are shown for pairs with z-scores higher than 1.96, which statistically
means they are significantly positively associated. The thickness of the lines is also
scaled to the z-scores, also shown on the lines.
36
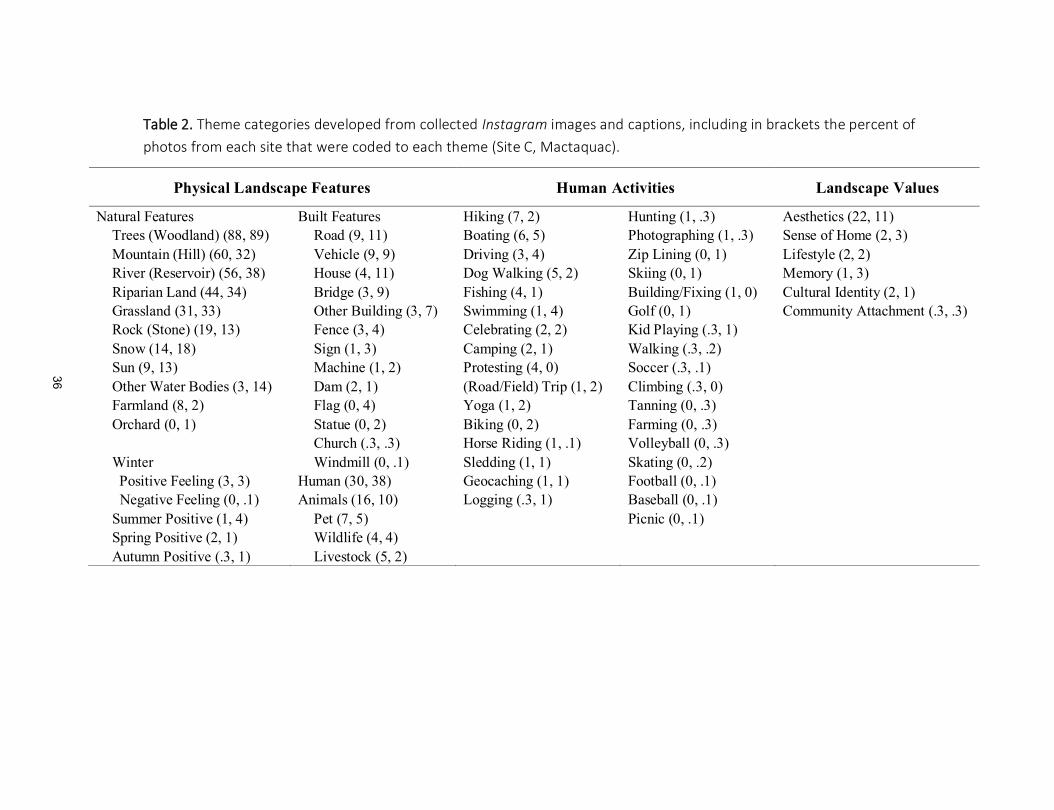
Table 2. Theme categories developed from collected Instagram images and captions, including in brackets the percent of
photos from each site that were coded to each theme (Site C, Mactaquac).
Physical Landscape Features Human Activities Landscape Values
Natural Features Built Features Hiking (7, 2) Hunting (1, .3) Aesthetics (22, 11)
Trees (Woodland) (88, 89) Road (9, 11) Boating (6, 5) Photographing (1, .3) Sense of Home (2, 3)
Mountain (Hill) (60, 32) Vehicle (9, 9) Driving (3, 4) Zip Lining (0, 1) Lifestyle (2, 2)
River (Reservoir) (56, 38) House (4, 11) Dog Walking (5, 2) Skiing (0, 1) Memory (1, 3)
Riparian Land (44, 34) Bridge (3, 9) Fishing (4, 1) Building/Fixing (1, 0) Cultural Identity (2, 1)
Grassland (31, 33) Other Building (3, 7) Swimming (1, 4) Golf (0, 1) Community Attachment (.3, .3)
Rock (Stone) (19, 13) Fence (3, 4) Celebrating (2, 2) Kid Playing (.3, 1)
Snow (14, 18) Sign (1, 3) Camping (2, 1) Walking (.3, .2)
Sun (9, 13) Machine (1, 2) Protesting (4, 0) Soccer (.3, .1)
Other Water Bodies (3, 14) Dam (2, 1) (Road/Field) Trip (1, 2) Climbing (.3, 0)
Farmland (8, 2) Flag (0, 4) Yoga (1, 2) Tanning (0, .3)
Orchard (0, 1) Statue (0, 2) Biking (0, 2) Farming (0, .3)
Church (.3, .3) Horse Riding (1, .1) Volleyball (0, .3)
Winter Windmill (0, .1) Sledding (1, 1) Skating (0, .2)
Positive Feeling (3, 3) Human (30, 38) Geocaching (1, 1) Football (0, .1)
Negative Feeling (0, .1) Animals (16, 10) Logging (.3, 1) Baseball (0, .1)
Summer Positive (1, 4) Pet (7, 5) Picnic (0, .1)
Spring Positive (2, 1) Wildlife (4, 4)
Autumn Positive (.3, 1) Livestock (5, 2)
36
37
2.8.1 Landscape Features
Young people’s perceptions of landscape feature in the two study areas (Figure 6a and
6b), The Site C area, British Columbia, and the Mactaquac area, New Brunswick, implies
the physical landscapes perceived by the young people were quite similar. Trees were the
most frequent feature showing in the photos (trees appeared in 87% of photos in the Site
C dataset, and 89% in the Mactaquac dataset). In these photos, trees varied from an
individual tree on the street, middle-sized woodlands, to large tracts of forest. However,
trees had no preference of association with any other landscape feature, indicating that
trees were ubiquitous. At both sites, riparian land, river/reservoir (i.e. the main channel
of the river in yet-undammed Site C, or the reservoir in Mactaquac), and mountain/hill
(again depending on topographic variation in the two sites) frequently appeared: for the
Site C dataset, 44%, 56%, and 60% photos were respectively coded with riparian land,
river and mountain; for the Mactaquac, 34%, 38%, and 32%. Unlike trees, which were
isolated features due to ubiquity, these three features appeared together at both sites (for
the Site C, z-scores between these features were higher than 3.33; for the Mactaquac,
higher than 8.25). Among the Instagram photos collected, typical views showed the main
river or reservoir with riparian lands and high-slope land nearby or mountains far away
in the background, suggesting these three features were preferentially combined in
photos. This was sometimes but not always because the features were physically adjacent.
Other recognizable feature pairs that were preferentially linked in both cases make
intuitive sense: road|vehicle, positive attitude towards winter|snow, livestock|grassland,
rock|other water (generally small brooks).
38
Differences were also found between the young people’s perceived landscapes of
the two study areas. The overall structures of the two perception images indicate that
many features in the Mactaquac area were significantly positively associated with each
other (more pairs of features had z-scores higher than 1.96), suggesting they were highly
integrated; landscape features in the Site C were less often connected. By looking
through the Instagram photos, we noted the landscape in the Mactaquac area was flatter,
which made physical features visually continuous; and there were more human
settlements along the reservoir, which indicates the young people there had daily
interactions with the landscape. The Site C area was more remote, often only reached
during outdoor activities such as hiking.
a)
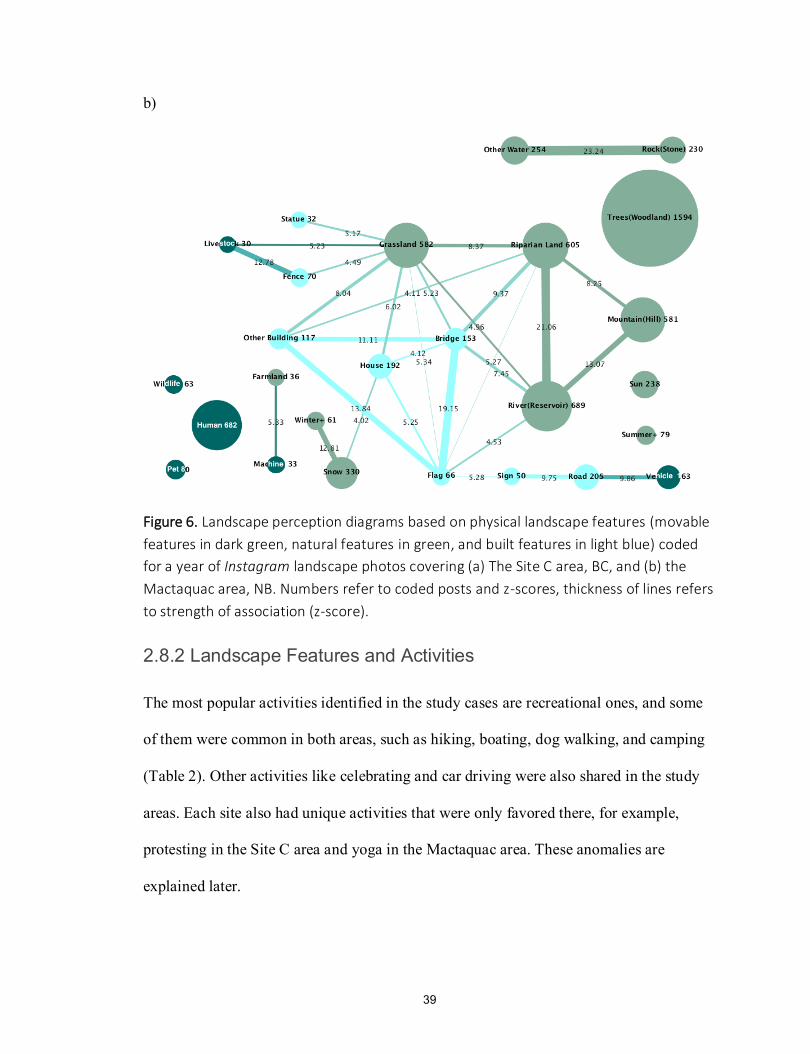
39
b)
Figure 6. Landscape perception diagrams based on physical landscape features (movable
features in dark green, natural features in green, and built features in light blue) coded
for a year of Instagram landscape photos covering (a) The Site C area, BC, and (b) the
Mactaquac area, NB. Numbers refer to coded posts and z-scores, thickness of lines refers
to strength of association (z-score).
2.8.2 Landscape Features and Activities
The most popular activities identified in the study cases are recreational ones, and some
of them were common in both areas, such as hiking, boating, dog walking, and camping
(Table 2). Other activities like celebrating and car driving were also shared in the study
areas. Each site also had unique activities that were only favored there, for example,
protesting in the Site C area and yoga in the Mactaquac area. These anomalies are
explained later.
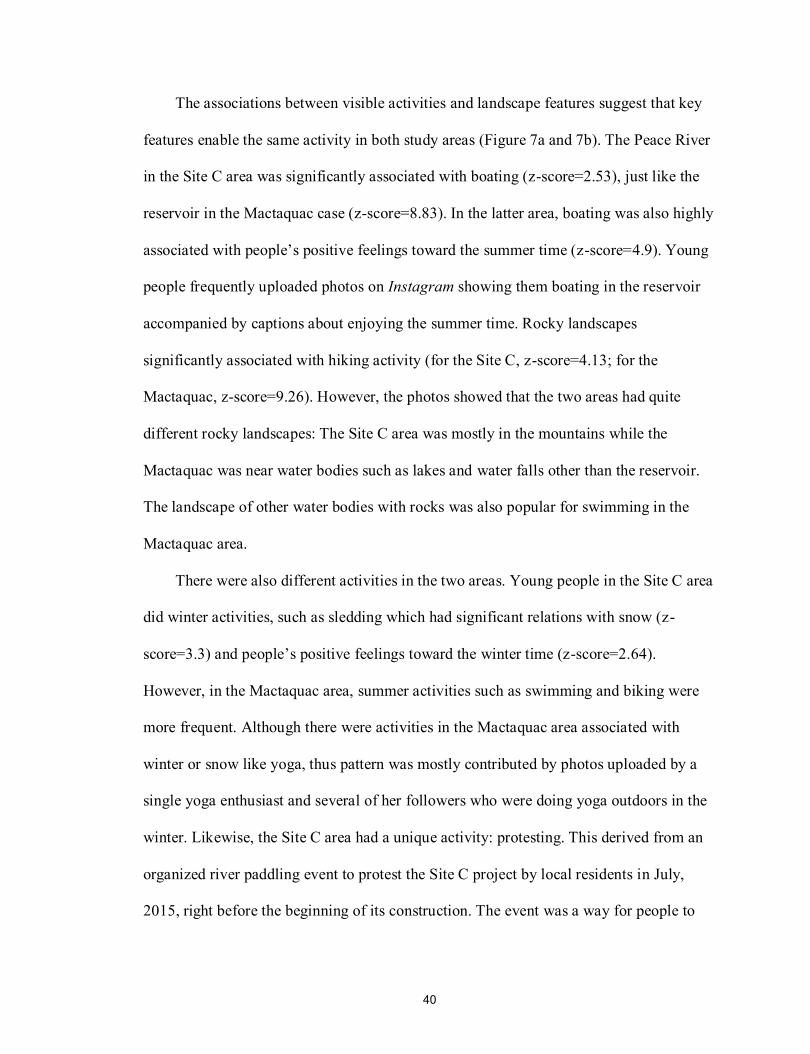
40
The associations between visible activities and landscape features suggest that key
features enable the same activity in both study areas (Figure 7a and 7b). The Peace River
in the Site C area was significantly associated with boating (z-score=2.53), just like the
reservoir in the Mactaquac case (z-score=8.83). In the latter area, boating was also highly
associated with people’s positive feelings toward the summer time (z-score=4.9). Young
people frequently uploaded photos on Instagram showing them boating in the reservoir
accompanied by captions about enjoying the summer time. Rocky landscapes
significantly associated with hiking activity (for the Site C, z-score=4.13; for the
Mactaquac, z-score=9.26). However, the photos showed that the two areas had quite
different rocky landscapes: The Site C area was mostly in the mountains while the
Mactaquac was near water bodies such as lakes and water falls other than the reservoir.
The landscape of other water bodies with rocks was also popular for swimming in the
Mactaquac area.
There were also different activities in the two areas. Young people in the Site C area
did winter activities, such as sledding which had significant relations with snow (z-
score=3.3) and people’s positive feelings toward the winter time (z-score=2.64).
However, in the Mactaquac area, summer activities such as swimming and biking were
more frequent. Although there were activities in the Mactaquac area associated with
winter or snow like yoga, thus pattern was mostly contributed by photos uploaded by a
single yoga enthusiast and several of her followers who were doing yoga outdoors in the
winter. Likewise, the Site C area had a unique activity: protesting. This derived from an
organized river paddling event to protest the Site C project by local residents in July,
2015, right before the beginning of its construction. The event was a way for people to
41
express concerns with the potential environmental problems and landscape changes the
new dam would bring to this region.
a)
b)
Figure 7. Landscape perception diagrams based on physical landscape features (dark
green) and activities (light pink) coded for a year of Instagram landscape photos covering
(a) The Site C area, BC, and (b) the Mactaquac area, NB.
42
2.8.3 Landscape Values
The six most important values discovered within Instagram captions were aesthetics,
sense of home, community attachment, memory, lifestyle, and cultural identity in both
study areas (Table 2). In the Site C area, the most important landscape value identified
was aesthetic value, which positively associated with river, riparian land, mountain/hill,
and people’s positive feelings toward the wintertime (Figure 8a). Most of the photos
coded with aesthetic value did not show significant association with any activity,
implying that people might just stop by and take a picture, but without doing any
particular activity in that location. The aesthetic value was also most frequently identified
in the Mactaquac area, but had close relationships with sun (including sunsets and
sunrises), and positive perceptions of the winter and autumn seasons (Figure 8b). Unlike
in the Site C area, aesthetic value was not tied with the reservoir in Mactaquac. Instead,
there was a significant correlation between aesthetics and hiking, which people in
Mactaquac did more often near other water bodies, such as lakes and streams, rather than
the reservoir.
Sense of home was another landscape value expressed by young people. In the Site
C area, this sense was associated with people’s positive feelings toward the winter time,
farmland, and fences. Community attachment, as a similar concept, was linked to houses.
Hence, farmland, houses, and fences combined at the core of people’s attachment to the
place. Several Instagram users wrote captions that their farm properties would be flooded
by the new dam, and this could negatively affect their sense of belonging to the land. In
the Mactaquac case, sense of home and community attachment were both associated with
houses near the water.
43
More messages can be dug from significant associations with activities like car
driving and celebrating. Many photos from the dataset showed a view of the
photographers’ familiar landscape on the road when they drove back home; and the
captions usually emphasized their excited feelings of being home (e.g., “it’s home!”).
Celebrating events, such as festivals, birthdays, weddings, and so on, greatly evoked the
landscape value of place attachment when the young people were with their family in
their hometown or at home.
Landscape as lifestyle told different stories in the two study areas. Young people in
the Site C area had more positive feelings about the spring time, perhaps not surprising
given the length of winter so far north. Many photos showed they started to boat in the
river when the winter ended, and appreciated the better weather and more opportunities
to be outdoors. In the Mactaquac area, lifestyle was more associated with summer time
and associated activities. Many of the photo captions implied that the young people
viewed “summer”, “lifestyle”, and “headpond lake” as an integrated idea of their place
value. In the long winter time, some people even uploaded summertime photos to express
that they missed the “summer lake life” so much.
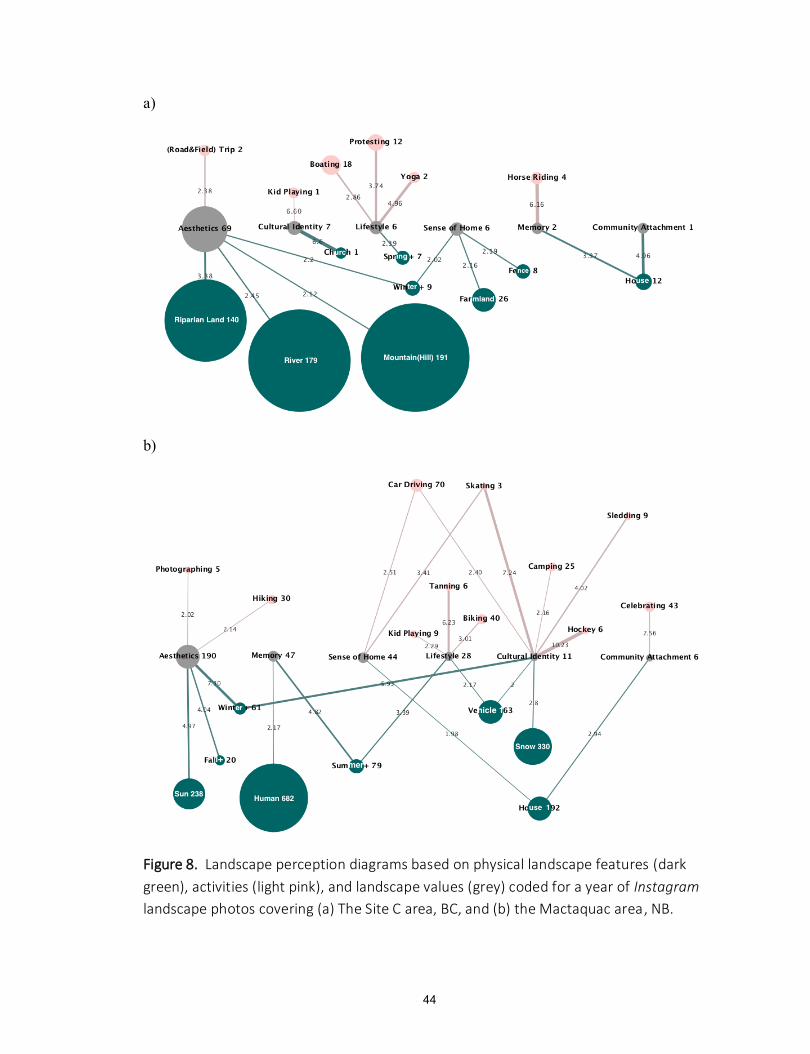
44
a)
b)
Figure 8. Landscape perception diagrams based on physical landscape features (dark
green), activities (light pink), and landscape values (grey) coded for a year of Instagram
landscape photos covering (a) The Site C area, BC, and (b) the Mactaquac area, NB.
45
2.9 Discussion
We collected data by geographic coordinates from a photo-sharing social media site,
Instagram, to understand landscape perceptions of young people in new and old
hydroelectricity landscapes. Specifically, we sought to understand: (1) young people’s
landscape perceptions in the study areas, regarding physical landscape features, human
activities, and values; and (2) what would be the challenges for them in the future based
on how their landscape and thus landscape perception would change under different
hydroelectric energy proposals. In this section we summarize the key patterns identified,
and focus on the implications of landscape change by looking at the features, activities
and values that were significantly associated with features that will be affected by
various hydroelectricity scenarios.
2.9.1 Changing Landscape Features
Humans’ landscape perceptions, in part, can be depicted by their preference for particular
landscape features which are often viewed as the basis of natural-social landscape (Tuan,
1979; Stedman, 2003). The frequency of Instagram users showing a certain landscape
feature is a strong signal of such preferences. The psychophysical paradigm creates a
lens through which key features – trees, and river with lands nearby – were seen and
interpreted.
Trees (woodland) were the most commonly perceived physical landscape feature in
both study areas in terms of appearance in photos, however, trees had no association with
any other feature. Trees were the most ubiquitous feature in both areas so that it could be
easily captured by people, which contributed to their unconscious perceptions of the
46
wood-rich landscape (Taylor et al., 1987). The majority of photos collected from
Instagram showed trees but few users mentioned their feelings about them in captions.
Without articulation, though, the perception of trees is often positive since trees enable
beliefs, such as nature being worth preserving and an indispensable part of daily life
(Kaplan & Kaplan, 1989). Landscape views with trees may also have positive
implications for sensual appreciation associated with health and well-being (Bernáldez,
1985; Kaplan, Kaplan, & Ryan, 1998). These sentiments are consistent with one of the
most prominent motives for sharing photos online: people post and send photos on social
media for gratification, including self-expression, showing positive feelings, and
constructing identity (Charney & Greenberg, 2002; Hunt, Lin, & Atkin, 2014).
The loss of trees, as the most commonly and often positively perceived feature,
would be anticipated to negatively affect young people’s attitudes toward the landscape
in both study areas, although both have logging histories. Certainly, tree removal
commonly comes before the inundation of land by water for hydroelectricity (Panwar et
al., 2010). Intermediate stages, where trees are removed but the landscape is not yet
flooded, or conversely, a dam is removed but the exposed land not yet revegetated, can
be confronting for locals. However, the deforestation rate may accelerate with more
human settlements and road expansion near the dam, which can further enhance intensive
logging in such forestry-based areas (Chen, Powers, Carvalho, & Mora, 2015).
Especially in Site C, no assurance could be given that the tree loss could be compensated
or restricted afterwards since more anthropogenic disturbances are foreseeable.
River, riparian land, and mountains/hills were identified together as a main cluster
from the perception image of the Site C area, suggesting that these three features were
often perceived as a whole. Their physical adjacency may partially contribute to the
47
combination, but the psychophysical paradigm also suggests that river, riparian land, and
mountain were perceived together because they enabled a similar aesthetic appreciation
for viewers (Taylor et al., 1987). Water in landscape is usually preferred by people, and a
natural and vegetation-covered edge in the waterscape will enhance appreciation (Kaplan
et al., 1998). Our findings of landscape values, which will be discussed later, also
revealed aesthetics that were inspired by the combination of the three features. Changes
of any feature of the three will undermine this triangular construct in human perceptions.
The Mactaquac case showed similar results, however, the three features were not
independently grouped as one cluster, but were at the center of a larger cloud with
another 14 features. This implies a more integrated and perhaps more vulnerable
landscape view in Mactaquac: the topography is flatter which increases the accessibility
of the water body and the visual connection of various landscape features (Hough, 1990).
Farmland is also prominent in both settings, including grassland and associated
livestock, and will be subject to change in Site C following inundation. This is one of the
key reasons for opposition to dam construction in terms of the potential loss of high
quality land, agricultural economy, food security, etc. Numerous participants in public
hearings expressed their central concerns for “losses to agriculture and the farming way
of life” (BC Hydro & Power Authority British Columbia, 2014, p. 147). According to
our parallel research on public information available through Twitter around the Site C
project, some of the key opinion leaders identified were farmland owners, an agricultural
union founder, and agricultural economists (Chen, 2015). They had made efforts to
organize other farmers and to evoke public awareness of the negative effects the dam
would bring, such as fertile farmland loss, self-identity loss, and degradation in
agricultural industry (Chen, 2015).
48
2.9.2 Changing Activities
The experimental paradigm relies on the human-landscape relationship: that specific
activities can be facilitated in particular landscapes (Taylor et al., 1987; Thwaites &
Smikins, 2007). Stedman (2003) also pointed out how the physical environment can
inspire and constrain human experiences in the landscape, which usually shapes
meanings of the place. Mactaquac is a more inhabited landscape than Site C, too, due to
good landscape accessibility and developed towns along the St. John River. Mactaquac
photos not only showed recreational scenes (e.g., swimming in the reservoir) but also
living (e.g., dog walking in neighborhoods) and working (e.g., farming, logging in
forests). Potential landscape changes in this area were predicted to bring larger impact
than the Site C on young people’s feelings and usage of the landscape had permeated
almost every facet of their daily life.
The river and reservoir were identified as key features facilitating boating in both
study areas, but different kinds of boating were typical based on the running or still water
that characterize each place. In Site C, river boating was a lifestyle but also a political
choice. During the paddling event to protest the Site C project, the residents chose to boat
the Peace River as a silent way to show the strong tie between them and their beloved
river. Similarly, river and boating were also associated with young people’s identity in
Mactaquac, where the way they lived in the landscape was formed by the water. None of
the photos in Mactaquac mentioned the dam decision itself, instead, they commented on
how important the reservoir was for their “#riverlife” by posting photos showing
recreational activities in the water. While water will remain in both landscapes under all
49
scenarios, it is clear that the type of boating may have to change, significantly affecting
summer lifestyles.
In Site C, fishing was one of the most common activities, and dam construction is
likely to affect fish species and populations (Fearnside, 2014). This process has already
occurred in Mactaquac, where salmon populations collapsed after dam construction,
replaced by stocking with bass (Sherren et al., 2016). The environmental impact
assessment of the Site C project revealed it would likely have loss of indigenous species.
For the aboriginal people, especially, the changes to the water landscape will impact their
fishing practices and cultural attachment to specific fishing sites along the river (BC
Hydro & Power Authority British Columbia, 2014). Demonstrated in the same report,
unfortunately, there was no evidence showing such lost habitat could be reestablished
somewhere nearby, thus fishing as a popular activity in this area may experience
permanent and irreversible impacts.
Also notable is the prevalence of a ‘car culture’ in both places, evidenced by driving
as a significant activity, linked to features such as roads, vehicles, signs and bridges.
Rooted in the western car culture, the vast majority of Canadians in a survey implied that
cars were more important than televisions and telephones in their daily life (Canada
NewsWire, 2003). Not only because of a lack in public transportation, young people also
associate car access or ownership as a symbol of social status, thus it is critical for their
self-actualization (O’Connor & Kelly, 2006). BC Hydro claimed that there would be
benefits from highway improvements, though local residents are concerned that road
construction and increased traffic volume will significantly affect their car-based lives
(BC Hydro & Power Authority British Columbia, 2014). Such construction-related
disruption is long over in Mactaquac, but any of the options it faces involves significant
50
disruption to transportation, given that the dam serves as the only Saint John River
crossing in the 70 km between Fredericton and Nackawic.
2.9.3 Changing Values
Landscape value was interpreted based on the cognitive paradigm which aimed to
understand the reason why the place was valued (Taylor et al., 1987). By looking at the
overall structure of young people’s perceptions of landscape values, we found the values
had more direct associations with physical features than with activities in the Site C area,
suggesting that the landscape itself and its direct changes will most affect the values
there, specifically (river- and farmland-related) aesthetics and place attachment. However,
the Mactaquac case showed that the young people valued the landscape not only based
on the physical features, but more because their lifestyles are shaped by features and
activities, all of which were less vulnerable to change based on associated features.
Aesthetic value of the landscape was common in both study areas (a general bias of
most photography), which might be driven by a preference for ‘nature’ (even in highly
modified landscapes like Mactaquac) (Fox, Magilligan, & Sneddon, 2016). Parsons
(2012) discussed that people perceive natural things as aesthetically valued. The stimuli
identified for aesthetic value in both study areas were different, though all of them were
natural features of the landscape. Site C case had its aesthetic value associated with river,
riparian land, and mountains, suggesting the combination of these features directly
facilitated the value. However, the Mactaquac did not show any evidence that values
were evoked by the reservoir (instead, seasons and sun). Aesthetic values are thus more
threatened at Site C as a result of dam construction, than at Mactaquac as a result of
potential dam removal.
51
On the other hand, experience including being and doing activities in the landscape,
can stimulate aesthetic appreciation as well (Bourassa, 1990; Hunziker; 1995; Keating,
2012; Nielson, Heyman, & Richnau, 2012). We can consider all the Instagram
photographers as experiencing the landscape by being there for photo taking. Aesthetic
value in the case studies seemed associated by time spent away from home: in Site C the
only activity significantly linked to aesthetics was ‘road trips’, and even that not often,
and for Mactaquac it was hiking.
Unlike the Site C, landscape values in the Mactaquac were more associated with
lifestyle. Dakin (2003) demonstrated landscape as way of life because it is where people
inhabit, embrace livelihoods, recreational activities, and attach to home. Young people’s
lifestyles were greatly stimulated by positive feelings in the summer time and activities
like tanning, biking, and children playing, all pointing to a happy scene in summer. Much
of this likely occurred near the reservoir, although it was not always visible: a large
number of photos had captions commenting about people’s “#lakelife” and “summer
land”. Landscape as memory in Mactaquac showed the same message, such as one
commented on a landscape photo as “I miss the summer here”.
Community attachment and sense of home were connected values, expressing a
similar meaning of place attachment. Instagram users in both areas used keywords such
as home, hometown, community, and family to express their feelings on properties, land,
and the places. These values were mostly stimulated by houses, as a symbol of settlement.
Previous research has indicated that community and home are two important contributors
of a sense of place (Spirn, 1998; Duncan, & Lambert, 2004; Beckley, Stedman, Wallace,
& Ambard, 2007) and property owners have a stronger attachment to a place (Meinig,
1976; Hough, 1990; Stedman et al., 2007). Tuan (1979) discussed that the fondness and
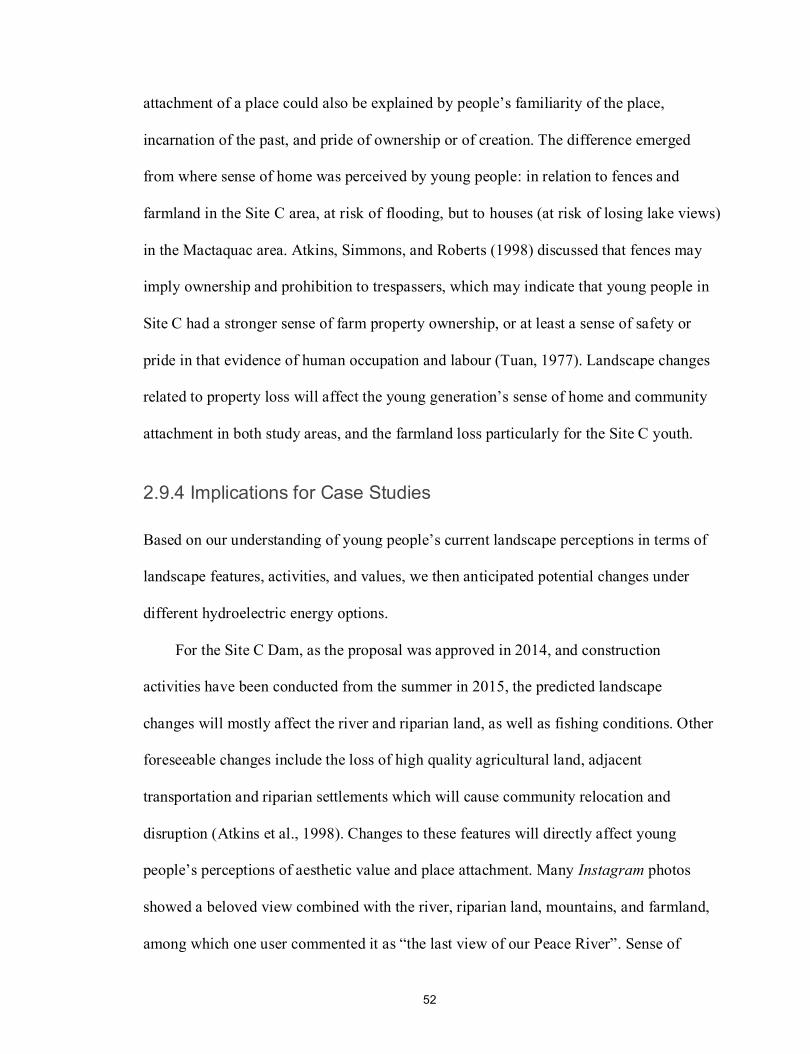
52
attachment of a place could also be explained by people’s familiarity of the place,
incarnation of the past, and pride of ownership or of creation. The difference emerged
from where sense of home was perceived by young people: in relation to fences and
farmland in the Site C area, at risk of flooding, but to houses (at risk of losing lake views)
in the Mactaquac area. Atkins, Simmons, and Roberts (1998) discussed that fences may
imply ownership and prohibition to trespassers, which may indicate that young people in
Site C had a stronger sense of farm property ownership, or at least a sense of safety or
pride in that evidence of human occupation and labour (Tuan, 1977). Landscape changes
related to property loss will affect the young generation’s sense of home and community
attachment in both study areas, and the farmland loss particularly for the Site C youth.
2.9.4 Implications for Case Studies
Based on our understanding of young people’s current landscape perceptions in terms of
landscape features, activities, and values, we then anticipated potential changes under
different hydroelectric energy options.
For the Site C Dam, as the proposal was approved in 2014, and construction
activities have been conducted from the summer in 2015, the predicted landscape
changes will mostly affect the river and riparian land, as well as fishing conditions. Other
foreseeable changes include the loss of high quality agricultural land, adjacent
transportation and riparian settlements which will cause community relocation and
disruption (Atkins et al., 1998). Changes to these features will directly affect young
people’s perceptions of aesthetic value and place attachment. Many Instagram photos
showed a beloved view combined with the river, riparian land, mountains, and farmland,
among which one user commented it as “the last view of our Peace River”. Sense of
53
home and community attachment will be negatively affected by loss of familiarity and
properties. Tuan (1977) indicated that the loss of people’s settlement would cause
demoralization since it implies the ruin of the world they understand.
The Mactaquac Dam is approaching the end of lifespan early and facing four
options. The first three, to repair, reconstruct and to decommission the dam, would
mostly keep the current landscape. This may minimize the impact on young people in
that area in the long term. The option of removing the dam would cause huge landscape
changes due to the river restoration and ecosystem remediation. River and riparian land,
identified as commonly perceived elements in this area by young people, would be
visually unpleasant during much of that period. The reservoir which has been the carrier
of the cherished “#lakelife” would disappear. Such changes would negatively affect
young people’s perceptions of the landscape at various levels, living, working, and
recreational. The aesthetic and lifestyle value would be greatly undermined.
Notwithstanding acknowledged ecological benefits of river restoration, antagonism is
often seen in areas facing dam removal projects (Fox et al., 2016). Likewise, recent
research in the Mactaquac area showed that collective discussions supported keeping the
reservoir intact (Sherren et al., 2016). Though young people have so far been under-
consulted in that decision process, saving the reservoir seems likely to be the key to
saving their lifestyle, as well as associated meanings and values of the landscape, and the
place.
Challenges for the young generation exist in both areas. They may live in the new
landscape for the longest time in the future. Atkins, Simmons, and Roberts (1998)
discussed that long-lived landscapes can be accepted unquestioningly by people, but
uncertainty and unfamiliarity of landscape will cause uncomfortable and threatening
54
feelings (Atkins et al., 1998; Kaplan, Kaplan, & Ryan, 1998). The process of interacting
with a new physical landscape, getting familiar with it, relating it to cultural memes,
finding new meanings, and forming connections may last for a long time. Some people
may choose to move to another place to escape the changes to cherished landscapes.
Moving to a new home under duress will undermine people’s identity, even with
adaptations (Million, 1992; Collignon, 2001). Such migration at young or middle ages
may cause moving-back actions later, something seen among participants in recent
research in the area (Sherren et al., 2016). A further challenge in Peace River will be the
inevitable difficulty of facing future options given limited infrastructure lifespans, though
they are unlikely to be faced as soon as in the Mactaquac area.
2.9.5 Implications for Social Impact Assessment via Social Media
Social media has contributed much to forming new patterns of social life, especially for
young people who have been used to sharing their private life and engaging in public
discussion online. This social trend brings plenty of opportunities to use social media
data to assess social impacts, research about which typically uses methods such as
interviews and surveys (e.g. Barry, 2014). Our research, using Instagram posts, suggests
several strengths: (1) a large amount of available data at low to no cost; (2) capturing
young people’s voices, who are often absent from conventional public engagements; (3)
doing so without interventions that can introduce bias in any research; and (4) often with
geo-tagged information to provide the chance to identify popular viewpoints in the
landscape and understand landscape values in a spatial context.
Each of these benefits has a converse challenge that also suggests cautions in the
use of social media data. First, while many conventional studies relying on participatory
55
photography or mapping are challenged by the effort to collect willing participants and
quality data (Matteucci, 2013), social media methods can produce an overwhelming
amount of data, and require substantial filtering processes to identify ‘valid’ data, which
must be done manually. Data noise from the potential heterogeneity of social media use
requires careful examination (see Appendix C). Individuals also participate variously on
social media, which may require sampling to manage. The participants in social media
and content sharing sites also self-censor in the image they present, which introduces
additional biases that may not suit all settings. Biases are also introduced by socio-
economic and communications biases associated with the use of such technology,
although the smartphones that drive most of it are now near-ubiquitous. While we based
our data collection on the geographic tag of each Instagram post, however, the tag might
not indicate where the landscape in the photo was; instead, it could be where the user
posted this photo (e.g. where cell coverage or internet was available) or simply situated
based on the assigned coordinate of a place name input by the user. Thus, we did
additional manual filtering work to determine whether the landscape was in the research
areas. For example, we identified palm trees which were supposed not to grow in the
Mactaquac area, but with manual examining, they turned out to be plastic trees installed
near the reservoir. Mapping hotspots from such data would be subject to similar
problems. As aforementioned, another limitation was using our datasets to imply impacts
for young people. Finally, although not all Instagram users are young people, the fact
that the vast majority are justifies our research assumption (supported by additional
checks). This weakness is the nature of social media data: it is impossible to know their
ages, jobs, incomes, real names, and whether they are local when using massive volume
of social media data.
56
2.10 Conclusion
To better anticipate impacts and adapt or abandon hydroelectric energy proposals to suit
local communities, a full understanding of the young generation’s landscape perceptions
is critical. Conventional public engagements are ineffective and inefficient in catching
young voices. We collected photographic data and text-based captions from a social
media platform (Instagram) where predominantly young people document personal and
public lives. We were interested in interpreting the commonly perceived landscape,
including physical features, human activities, and landscape values. A landscape
perception model with three paradigms that were separately applied in previous research
was adapted to interpret landscape perceptions. We anticipated that significant landscape
changes, specifically of the river and riparian land (including houses and low-land farms),
will directly affect landscape values of aesthetics and place attachment in Site C, while
mostly affecting lifestyles in Mactaquac. These potential changes will bring particular
challenges to the young generation in terms of losing familiar landscape, adapting to the
new one, potentially migrating to other places, and facing more change at the end of the
lifespan of energy facilities. This paper showed a new and insightful way to analyze
social media data in landscape perception research. This work is also limited by the
general challenges of using secondary ‘big data’: the paradox between a larger amount of
data and the precision of each piece. We believe this is a feasible way to fill in the gap
caused by changes in civic engagement among young people towards the online realm.
Research in the future can seek more opportunities to capture and automate the analysis
of valid data.
57
References
Aggestam, F. (2014). Wetland restoration and the involvement of stakeholders: An
analysis based on value-perspectives. Landscape Research, 39(6), 680-697.
Ambrose, P. (1969). Analytical human geography: A collection and interpretation of
some recent work. New York, NY: American Elsevier Publishing Company, INC.
Amnesty International. (2016). The point of no return: The human rights of indigenous
people in Canada threatened by the Site C Dam. Retrieved from
http://www.amnesty.ca/sites/amnesty/files/Canada%20Site%20C%20Report.pdf
Atkins, P., Simmons, I., & Roberts, B. (1998). People, land & time: An historical
introduction to the relations between landscape, cultural and environment. New
York, NY: Oxford University Press Inc.
Autry, M. K., & Kelly, A. R. (2012). Merging Duke Energy and Progress Energy: Online
public discourse, post-Fukushima reactions, and the absence of environmental
communication. Environmental Communication: A Journal of Nature and Culture,
6(2), 278–284.
Bourassa, S.C. (1990). A paradigm for landscape aesthetics. Environment and Behavior,
22(6), 787-812.
Barry, S. J. (2014). Using social media to discover public values, interests, and
perceptions about cattle grazing on park lands. Environmental Management, 53(2),
454–464.
BC Hydro, & Power Authority British Columbia. (2014, May 1). Report of the Joint
Review Panel: Site C clean energy project. Retrieved from http://www.ceaa-
acee.gc.ca/050/documents/p63919/99173E.pdf
BC Hydro. (n.d.). Site C clean energy project. The official website of BC Hydro.
Retrieved from https://www.bchydro.com/energy-in-bc/projects/site_c.html
BC Hydro. (2015, July 22). Construction notification letter. The official website of BC
Hydro. Retrieved from https://www.sitecproject.com/construction-notification-letter
Beckley, T. M., Stedman, R. C., Wallace, S. M., & Ambard, M. (2007). Snapshots of
what matters most: Using resident-employed photography to articulate attachment
to place. Society & Natural Resources, 20(10), 913-929.
Bernáldez, F., 1985. Invitación a la ecología humana. La adaptación afectiva al entorno.
Tecnos S. A, Madrid.
58
Butler, A., & Berglund, U. (2014). Landscape character assessment as an approach to
understanding public interests within the European Landscape Convention.
Landscape Research, 39(3), 219-236.
Cabral, J. (2011). Is Generation Y addicted to social media? The Elon Journal of
Undergraduate Research in Communications, 2(1), 5–14.
Canada NewsWire. (2003, November 17). Canada’s car confessions – singing, flirting
and even loving [web news]. Retrieved from
https://global.factiva.com/ha/default.aspx#./!?&_suid=14586732973210481223954
8034769
Canadian Rivers Institute. (2011). The Saint John River: A state of the environment
report. Retrieved from
http://www.unb.ca/research/institutes/cri/_resources/pdfs/criday2011/cri_sjr_soe_fi
nal.pd f
Carlson, A. (2012). Aesthetic appreciation of nature and environmentalism. In B.
Williston (Ed.), Environmental Ethics for Canadians (pp. 189-196). Canada: Oxford
University Press.
Charney, T., & Greenberg, B. S. (2002). Uses and gratifications of the Internet. In C. A.
Lin & D. J. Atkin (Eds.), Communication technology and society: Audience
adoption and uses (pp. 379–407). Cresskill, NJ: Hampton Press Inc.
Checkoway, B., Allison, T., & Montoya, C. (2005). Youth participation in public policy
at the municipal level. Children and Youth Services Review, 27(10), 1149–1162.
Chen, G., Powers, R. P., de Carvalho, L. M. T., & Mora, B. (2015). Spatiotemporal
patterns of tropical deforestation and forest degradation in response to the operation
of the Tucuruí hydroelectric dam in the Amazon basin. Applied Geography, 63, 1-8.
Chen, Y. (2015, August). Public Discourse on Twitter and Instagram: The Mactaquac
Dam, New Brunswick, and the Site C Dam Proposal, British Columbia.
Unpublished report, Dalhousie University, Halifax, NS. URL:
http://energytransitions.ca/wp-content/uploads/2015/08/Twitter-Instagram-
Mactaquac-Site-C-Report.pdf
Collignon, B. (2001). Esprit des lieux et modèles culturels. La mutation des espaces
domestiques en arctique inuit. Annales de Géographie, 110(620), 383-404.
Council of Europe (CoE). (2000). European Landscape Convention. CETS No. 176.
(Florence and Strasbourg: Council of Europe).
59
Dakin, S. (2003). There’s more to landscape than meets the eye: Towards inclusive
landscape assessment in resource and environmental management. The Canadian
Geographer, 47(2), 185-200.
Daniel, T. C. (2001). Whither scenic beauty? Visual landscape quality assessment in the
21st century. Landscape and Urban Planning, 54, 267-281.
Delli Carpini, M. X. (2000). Gen.com: Youth, civic engagement, and the new
information environment. Political Communication, 17(4), 341–349.
Duggan, M., & Smith, A. (2013, December 30). Social Media Update 2013. Pew
Research Center. Retrieved from http://www.pewinternet.org/2013/12/30/social-
media-update-2013/
Duggan, M. (2015, August 19). Mobile messaging and social media 2015. Pew Research
Center. Retrieved from http://www.pewinternet.org/2015/08/19/mobile-messaging-
and-social-media-2015/
Duncan, J. S., & Lambert, D. (2004). Landscapes of home. In J. S. Duncan, N. C.
Johnson, & R. H. Schein (Eds.), A companion to cultural geography (pp. 382-403).
Malden, MA: Blackwell Publishing.
Dupont, L., Antrop, M., & Van Eetvelde, V. (2014). Eye-tracking analysis in landscape
perception research: Influence of photograph properties and landscape
characteristics. Landscape Research, 39(4), 417-432.
Fearnside, P. M. (2014). Impacts of Brazil’s Madeira River Dams: Unlearned lessons for
hydroelectric development in Amazonia. Environmental Science & Policy, 38, 164-
172.
Filova, L., Vojar, J., Svobodova, L., & Sklenicka, P. (2015): The effect of landscape type
and landscape elements on public visual preferences: Ways to use knowledge in the
context of landscape planning. Journal of Environmental Planning and
Management, 58(11), 2037-2055.
Fox, C. A., Magilligan, F. J., & Sneddon, C. S. (2016). “You kill the dam, you are killing
a part of me”: Dam removal and the environmental politics of river restoration.
Geoforum, 70, 93-104.
Greider, T., & Garkovich, L. (1994). Landscape: The social construction of nature and
the environment. Rural Sociology, 59(1), 1-24.
Hough, M. (1990). Out of place: Restoring identity to the regional landscape. New
Haven and London, CO: Yale University Press.
Hsieh, H., & Shannon, S. E. (2005). Three approaches to qualitative content analysis.
Qualitative Health Research, 15(9), 1277-1288.
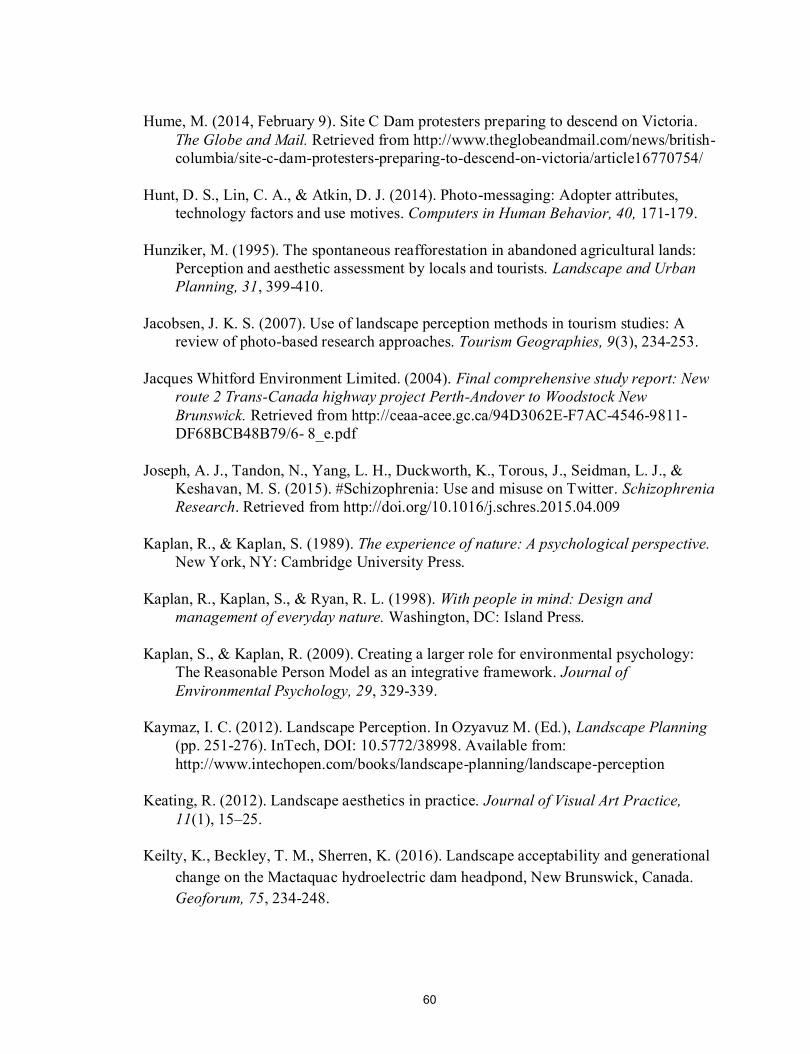
60
Hume, M. (2014, February 9). Site C Dam protesters preparing to descend on Victoria.
The Globe and Mail. Retrieved from http://www.theglobeandmail.com/news/british-
columbia/site-c-dam-protesters-preparing-to-descend-on-victoria/article16770754/
Hunt, D. S., Lin, C. A., & Atkin, D. J. (2014). Photo-messaging: Adopter attributes,
technology factors and use motives. Computers in Human Behavior, 40, 171-179.
Hunziker, M. (1995). The spontaneous reafforestation in abandoned agricultural lands:
Perception and aesthetic assessment by locals and tourists. Landscape and Urban
Planning, 31, 399-410.
Jacobsen, J. K. S. (2007). Use of landscape perception methods in tourism studies: A
review of photo-based research approaches. Tourism Geographies, 9(3), 234-253.
Jacques Whitford Environment Limited. (2004). Final comprehensive study report: New
route 2 Trans-Canada highway project Perth-Andover to Woodstock New
Brunswick. Retrieved from http://ceaa-acee.gc.ca/94D3062E-F7AC-4546-9811-
DF68BCB48B79/6- 8_e.pdf
Joseph, A. J., Tandon, N., Yang, L. H., Duckworth, K., Torous, J., Seidman, L. J., &
Keshavan, M. S. (2015). #Schizophrenia: Use and misuse on Twitter. Schizophrenia
Research. Retrieved from http://doi.org/10.1016/j.schres.2015.04.009
Kaplan, R., & Kaplan, S. (1989). The experience of nature: A psychological perspective.
New York, NY: Cambridge University Press.
Kaplan, R., Kaplan, S., & Ryan, R. L. (1998). With people in mind: Design and
management of everyday nature. Washington, DC: Island Press.
Kaplan, S., & Kaplan, R. (2009). Creating a larger role for environmental psychology:
The Reasonable Person Model as an integrative framework. Journal of
Environmental Psychology, 29, 329-339.
Kaymaz, I. C. (2012). Landscape Perception. In Ozyavuz M. (Ed.), Landscape Planning
(pp. 251-276). InTech, DOI: 10.5772/38998. Available from:
http://www.intechopen.com/books/landscape-planning/landscape-perception
Keating, R. (2012). Landscape aesthetics in practice. Journal of Visual Art Practice,
11(1), 15–25.
Keilty, K., Beckley, T. M., Sherren, K. (2016). Landscape acceptability and generational
change on the Mactaquac hydroelectric dam headpond, New Brunswick, Canada.
Geoforum, 75, 234-248.
61
Kirilenko, A. P., & Stepchenkova, S. O. (2014). Public microblogging on climate change:
One year of Twitter worldwide. Global Environmental Change, 26, 171–182.
Kyle, G. T., Jun, J., & Absher, J. D. (2014). Repositioning identity in conceptualizations
of human-place bonding. Environment and Behavior, 46(8), 1018-1043.
Lenhart, A., Madden, M., Smith, A., & Macgill, A. (2007, December 19). Teens and
social media. Pew Research Center. Retrieved from
http://www.pewinternet.org/2007/12/19/teens-and-social-media/
Lawson, P. M., Farnsworth, G., & Hartley, M. A. (1985). The Nackawic Bend, 200 years
of history. Canada: Nackawic Town of Nackawic.
Li, X., & Stepchenkova, S. (2012). Chinese outbound tourists’ destination image of
America: Part I. Journal of Travel Research, 51(3), 250–266.
Litton, R.B, Jr. (1968). Forest landscape description and inventories - a basis for land
planning and design. Berkeley, Calif., Pacific SW. Forest and Range Exp. Sta. 64
pp., illus. (U. S. D. A. Forest Serv. Res. Paper PSW-49).
Lothian, A. (1999). Landscape and the philosophy of aesthetics: Is landscape quality
inherent in the landscape or in the eye of the beholder? Landscape and Urban
Planning, 44, 177-198.
Luckman, K., Lagemann, V., & Menzel, S. (2013). Landscape assessment and evaluation
of young people: Comparing nature-orientated habitat and engineered habitat
preferences. Environment and Behavior, 45(1), 86-112.
Matteucci, X. (2013). Photo elicitation: Exploring tourist experiences with researcher-
found images. Tourism Management, 35, 190-197.
Menarguez, A. B., & Holgado, P. M. (2014). Assessing the landscape value of public
works: Validation of the methods in the lowlands of the middle section of Tajo
River, Spain. Landscape Research, 39(3), 305-323.
Meinig, D. W. (1976). The beholding eye. In D. W. Meinig (Ed.), The interpretation of
ordinary landscapes (pp. 33-48). New York, NY: Oxford University Press.
michyday. (2015, July 31). [Jealous of my sweet picnic spot? #beautifulbc
#adventuresinthenorth #landofdinosaurs] [Instagram photography]. Retrieved from
https://instagram.com/p/50E1wPKdFr/
Million, M. L. (1992). “It was home”: A phenomenology of place and involuntary
displacement as illustrated by the forced dislocation of five Southern Alberta
families in the Oldman River Dam flood area [doctoral dissertation]. Saybrook
Graduate School and Research Centre, San Francisco.
62
Natural Resources Canada. (2001). [An outline map without names which shows only
Canada’s coastline and boundaries]. Retrieved August 27, 2016, from
http://www.nrcan.gc.ca/earth-sciences/geography/atlas-canada/reference-
maps/16846
Navratil, J., Picha, K., Knotek, J., Kucera, T., Navratilova, J., & Rajchard, J. (2013).
Tourismos: An International Multidisciplinary Journal of Tourism, 8(1), 35-51.
NB Power. (2014). Project Description- Mactaquac Project. Retrieved March 30, 2015,
from http://www.mactaquac.ca/project-description/
NB Power. (2016a, May 6). Update on studies exploring Mactaquac operations beyond
2030. Retrieved from http://www.mactaquac.ca/update-on-studies-exploring-
mactaquac-operations-beyond-2030/
NB Power. (2016b). What was said final report. Retrieved September 9, 2016 from
http://www.mactaquac.ca/wp-
content/uploads/2016/08/What_was_said_Report_Mactaquac.pdf
Nielsen, A. B., Heyman, E., & Richnau, G. (2012). Liked, disliked and unseen forest
attributes: Relation to modes of viewing and cognitive constructs. Journal of
Environmental Management, 113, 456–66.
Netlytic. (2015). The introduction of Netlytic. Netlytic. Retrieved from
https://netlytic.org/home/
O’Connor, C., & Kelly, K. (2006). Auto theft and youth culture: A nexus of
masculinities, femininities and car culture. Journal of Youth Studies, 9(3), 247-267.
Panwar, S., Agrawal, D. K., Negi, G. C. S., Kanwal, K. S., Sharma, V., Lodhi, M. S.,
Singh, J., & Bhatt, V. (2010). Impact assessment of a hydroelectric project on the
flora in the Western Himalayan region based on vegetation analysis and socio-
economic studies. Journal of Environmental Planning and Management, 53(7),
907-923.
Park, N., Kee, K. F., & Valenzuela, S. (2009). Being immersed in social networking
environment: Facebook groups, uses and gratifications, and social outcomes. Cyber
Psychology & Behavior, 12(6), 729-733.
Parkhill, K. A., Butler, C., & Pidgeon, N. F. (2014) Landscapes of threat? Exploring
discourses of stigma around large energy developments. Landscape Research, 39(5),
566-582.
Parsons, G. (2012). Aesthetic Preservation. In B. Williston (Ed.), Environmental Ethics
for Canadians (pp. 205-211). Canada: Oxford University Press.
63
Pasek, J., Kenski, K., Romer, D., & Jamieson, K. H. (2006). America’s youth and
community engagement: How use of mass media is related to civic activity and
political awareness in 14- to 22-year-olds. Communication Research, 33(3), 115–
135.
Pollon, E. K., & Matheson, S. S. (2003). This was our valley. Canada: Deselig
Enterprises.
Quintelier, E., & Vissers, S. (2008). The effect of Internet use on political participation:
An analysis of survey results for 16-year-olds in Belgium. Social Science Computer
Review, 26(4), 411–427.
Raacke, J., & Bonds-Raacke, J. (2008). MySpace and Facebook: Applying the uses and
gratifications theory to exploring friend-networking sites. Cyberpsychology &
Behavior: The Impact of the Internet, Multimedia and Virtual Reality on Behavior
and Society, 11(2), 169–174.
Sauer, C. R. (1974). The morphology of landscape. In J. Leighly (Ed.), Land and Life: A
selection from the writings of Carl Ortwin Sauer (pp. 315-350). Berkeley and Los
Angeles, CA: University of California Press.
Scolozzi, R., Schirpke, U., Detassis, C., Abdullah, S., & Gretter, A. (2015). Mapping
alpine landscape values and related threats as perceived by tourists. Landscape
Research, 40(4), 451-465.
Sherren, K., Beckley, T. M., Parkins, J. R., Stedman, R. C., Keilty, K., Morin, I. (2016).
Learning (or living) to love the landscapes of hydroelectricity in Canada: Eliciting
local perspectives on the Mactaquac Dam via headpond boat tours. Energy
Research & Social Science, 14, 102-110.
Sloam, J. (2012). “Rejuvenating democracy?” Young people and the “Big Society”
Project. Parliamentary Affairs, 65, 90–114.
Smith, A. (2014, November 3). Cell phones, social media and campaign 2014. Pew
Research Center. Retrieved from http://www.pewinternet.org/2014/11/03/cell-
phones-social-media-and-campaign-2014/
Soini, K., Vaarala, H., & Pouta, E. (2012). Residents’ sense of place and landscape
perceptions at the rural–urban interface. Landscape and Urban Planning, 104(1),
124–134.
Spirn, A. W. (1998). The language of landscape. New Haven and London, CO: Yale
University Press.
Statista. (2015). Number of monthly active Instagram users from January 2013 to
September 2015 (in millions) [Data]. Retrieved from
64
http://www.statista.com/statistics/253577/number-of-monthly-active-instagram-
users/
Stedman, R. C. (2003). Is it really just a social construction? The contribution of the
physical environment to sense of place. Society & Natural Resources, 16(8), 671–
685.
Stedman, R. C., Lathrop, R. C., Clark, B., Ejsmont-Karabin, J., Kasprzak, P., Nielsen, K.,
Osgood, D., Powell, M., Ventelä, A., Webster, A. E., & Zhukova, A. (2007).
Perceived environmental quality and place attachment in North American and
European temperate lake districts. Lake and Reservoir Management, 23(4), 330-344.
Stepchenkova, S., & Zhan, F. (2013). Visual destination images of Peru: Comparative
content analysis of DMO and user-generated photography. Tourism Management,
36, 590–601.
Taylor, J. G., Zube, E. H., & Sell, J. L. (1987). Landscape assessment and perception
research methods. In R. Bechtel, R. Marans, & W. Michaelson (Eds.), Methods in
environment and behavioral research (pp. 361-393). New York, NY: Van Nostrans
Reinhold.
Thomas, D. R. (2006). A general inductive approach for analyzing qualitative evaluation
data. American Journal of Evaluation, 27(2), 237-246.
Thwaites, K., & Simkins, I. (2007). Experiential landscape: An approach to people,
place and space. London, UK: Routledge.
Tuan, Y. (1979). Thought and landscape: The eye and the mind’s eye. In D. W. Meinig
(Ed.), The interpretation of ordinary landscapes (pp. 89-102). New York, NY:
Oxford University Press.
Tuan, Y. (1977). Space and place: The perspective of experience. Minneapolis, MI:
University of Minnesota Press.
Tveit, M. S. (2009). Indicators of visual scale as predictors of landscape preference; a
comparison between groups. Journal of Environmental Management, 90, 2882-2888.
Vieweg, S., Hughes, A. L., Starbird, K., & Palen, L. (2010). Microblogging during two
natural hazards events: What Twitter may contribute to situational awareness. In
Proceedings of the SIGCHI Conference on Human Factors in Computing Systems
(pp. 1079-1088). ACM.
von Maltzahn, K.E. (1994). Nature as landscape: Dwelling and understanding. Montreal
& Kingston, Canada: McGill-Queen’s University Press.
65
Chapter 3 Using geo-tagged social media data
to map landscape values
Yan Chena, John R Parkinsb, Kate Sherrena
a School for Resource and Environmental Studies, Dalhousie University, Halifax, NS,
Canada
b Department of Resource Economics and Environmental Sociology, University of
Alberta, Edmonton, AB, Canada
3.1 Statement of Student Contribution
This paper is prepared for submission to the journal of Landscape and Urban Planning.
Chen collected the data, conducted analysis, and wrote all sections of this manuscript. Dr.
Sherren contributed to the research topic, methods for spatial analysis, and writing
process by editing this paper. Dr. Parkins contributed to editing as well. Both of them
provided supervisory comments all through the process.
3.2 Acknowledgements
This research was supported by Energy Transitions in Canada Project, funded by the
Social Sciences and Humanities Research Council of Canada, and Nova Scotia Graduate
Scholarship. The authors wish to thank Dr. Anatoliy Gruzd, who is the developer of
Netlytic, for assistance with data collecting.
66
3.3 Abstract
Landscape values indicate how humans perceive and evaluate the landscape. In our study
areas where two hydroelectric proposals have the potential to dramatically alter the
landscapes, particularly the river (reservoir) and riparian land, an understanding of the
spatial patterns of landscape values, especially the social and cultural values which are
intangible and underestimated in energy planning processes, can inform decision makers
to anticipate public concerns and adjust or abandon project proposals accordingly.
Leveraging social media, intangible landscape values can be revealed. Such data also has
the advantages of reaching young people and collecting large volume of data with low
cost. We collected photos and captions that were geo-tagged to the study areas on social
media site Instagram, and built a filtering model to extract valid data for kernel density
estimation. The density maps reveal that: (1) different values occurred in different places;
(2) aesthetic value was most widespread; (3) town areas, especially the old ones, and
popular viewpoints were most likely to be attractors for multiple values. People tend to
accept and appreciate familiar landscapes, thus proponents should make particular
allowances for locations of key values and multiplex values.
3.4 Keywords
Geographic Information; Hydroelectric Dam; Landscape Values; Spatial Analysis; Social
Media; Instagram
67
3.5 Introduction
Proposals involving landscape changes, especially hydroelectric dams that lead to water
impoundment, call for a better understanding of landscape values held by local residents
to inform the conversations about future development options. Generally, energy
proposals are often seen as disrupting and threatening people’s perceptions of landscape,
place attachment, and senses of self that are associated with physical and social
environments (Devine-Wright, 2009; Collins & Kearns, 2010). Physical landscape
changes can result in uncomfortable feelings like anxiety, threat, and a sense of loss and
displacement (Atkins, Simmons, & Roberts, 1998; Kaplan, Kaplan, & Ryan, 1998;
Devine-Wright, 2009). At the same time, community-based support networks are also
disrupted (Devine-Wright, 2009). In hydroelectricity proposals, the disruptions can be
more critical than others because water bodies (e.g., rivers and lakes) are attractors for
many landscape uses and values, such as recreation, aesthetics, educational use, and
spiritual values (Beverly, Uto, Wikes, & Bothwell, 2008). Visually, water landscapes
play a role in connecting various landscape features (Menarguez & Holgado, 2014),
which are disrupted by the appearance of a hydroelectric dam (Parkhill, Butler, &
Pidgeon, 2014; Filova, Vojar, Svobodova, & Sklenicka, 2015). Culturally, water bodies
like rivers, lakes, and oceans were the birthplaces of human civilization, providing
appropriate conditions for settlement and trade (Menarguez & Holgado, 2014), evident
today by towns scattered along rivers. Socially, water bodies can be the carriers of
people’s livelihoods and lifestyle. In some agricultural regions, for instance, the way
farmers lead their lives is tied to fertile soil and sources of irrigation, and their social
networks rely on a stable settlement pattern around such resources (Atkins et al., 1998).
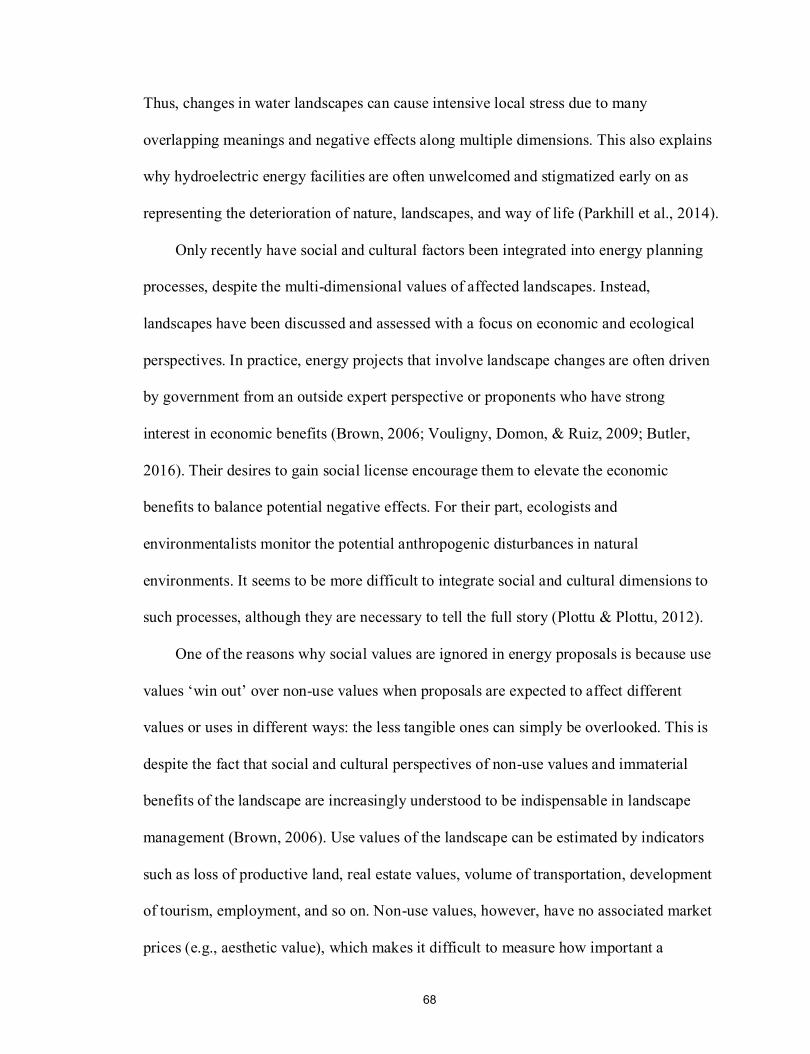
68
Thus, changes in water landscapes can cause intensive local stress due to many
overlapping meanings and negative effects along multiple dimensions. This also explains
why hydroelectric energy facilities are often unwelcomed and stigmatized early on as
representing the deterioration of nature, landscapes, and way of life (Parkhill et al., 2014).
Only recently have social and cultural factors been integrated into energy planning
processes, despite the multi-dimensional values of affected landscapes. Instead,
landscapes have been discussed and assessed with a focus on economic and ecological
perspectives. In practice, energy projects that involve landscape changes are often driven
by government from an outside expert perspective or proponents who have strong
interest in economic benefits (Brown, 2006; Vouligny, Domon, & Ruiz, 2009; Butler,
2016). Their desires to gain social license encourage them to elevate the economic
benefits to balance potential negative effects. For their part, ecologists and
environmentalists monitor the potential anthropogenic disturbances in natural
environments. It seems to be more difficult to integrate social and cultural dimensions to
such processes, although they are necessary to tell the full story (Plottu & Plottu, 2012).
One of the reasons why social values are ignored in energy proposals is because use
values ‘win out’ over non-use values when proposals are expected to affect different
values or uses in different ways: the less tangible ones can simply be overlooked. This is
despite the fact that social and cultural perspectives of non-use values and immaterial
benefits of the landscape are increasingly understood to be indispensable in landscape
management (Brown, 2006). Use values of the landscape can be estimated by indicators
such as loss of productive land, real estate values, volume of transportation, development
of tourism, employment, and so on. Non-use values, however, have no associated market
prices (e.g., aesthetic value), which makes it difficult to measure how important a
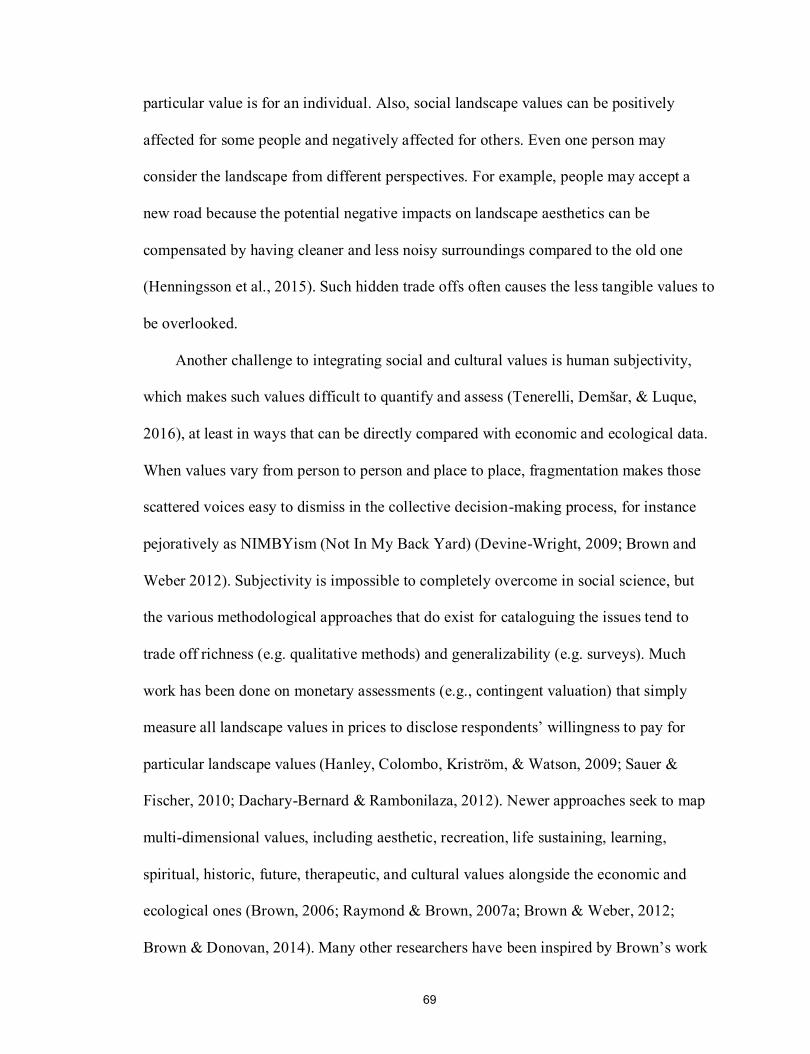
69
particular value is for an individual. Also, social landscape values can be positively
affected for some people and negatively affected for others. Even one person may
consider the landscape from different perspectives. For example, people may accept a
new road because the potential negative impacts on landscape aesthetics can be
compensated by having cleaner and less noisy surroundings compared to the old one
(Henningsson et al., 2015). Such hidden trade offs often causes the less tangible values to
be overlooked.
Another challenge to integrating social and cultural values is human subjectivity,
which makes such values difficult to quantify and assess (Tenerelli, Demšar, & Luque,
2016), at least in ways that can be directly compared with economic and ecological data.
When values vary from person to person and place to place, fragmentation makes those
scattered voices easy to dismiss in the collective decision-making process, for instance
pejoratively as NIMBYism (Not In My Back Yard) (Devine-Wright, 2009; Brown and
Weber 2012). Subjectivity is impossible to completely overcome in social science, but
the various methodological approaches that do exist for cataloguing the issues tend to
trade off richness (e.g. qualitative methods) and generalizability (e.g. surveys). Much
work has been done on monetary assessments (e.g., contingent valuation) that simply
measure all landscape values in prices to disclose respondents’ willingness to pay for
particular landscape values (Hanley, Colombo, Kristrom, & Watson, 2009; Sauer &
Fischer, 2010; Dachary-Bernard & Rambonilaza, 2012). Newer approaches seek to map
multi-dimensional values, including aesthetic, recreation, life sustaining, learning,
spiritual, historic, future, therapeutic, and cultural values alongside the economic and
ecological ones (Brown, 2006; Raymond & Brown, 2007a; Brown & Weber, 2012;
Brown & Donovan, 2014). Many other researchers have been inspired by Brown’s work
70
to fully understand comprehensive landscape values (Beverly et al., 2008; Zhu, Pfueller,
Whitelaw, & Winter, 2010).
Finally, a last challenge to incorporating social and cultural values is the bias that
can be introduced or simply perceived as a result of research or stakeholder participation.
When applying active participation approaches (e.g., survey, interview, etc.) in social
science research, it can be difficult to attract the necessary respondents (Reed & Brown,
2003), and the high cost per response limits the number of participants (Brown & Weber,
2012). In addition, influence from researchers cannot be avoided when participants only
answer the provided questions and may be further affected by interview dynamics (e.g.,
power, gender, etc.). More importantly, there is other demographic bias in the samples
because the younger generations are less actively engaged in public participation or
research activities (Pasek, Kenski, Romer, & Jamieson, 2006; Sloam, 2012; Sherren,
Beckley, Parkins, Stedman, Keilty, & Morin, 2016).
Using social media data to map landscape values presents opportunities to overcome
the challenges mentioned above. It has seen limited use thus far in cultural ecosystem
services, planning, and landscape studies (with recent exceptions see: Barry, 2013; de
Vries et al., 2016; Martínez Pastur, Peri, Lencinas, García-Llorente, & Martín-López,
2015; Richards & Friess, 2015; Tenerelli, Demšar, & Luque, 2016). Social media users
document their lifestyles and attitudes which may indicate thus-far hidden information
for cultural and social values of the landscape. Mapping landscape values by geo-tagged
social media data can expose and aggregate otherwise hidden values held by scattered
individuals and thus help integrate lay planning perspectives into expert-orientated
processes. Compared with conventional approaches (e.g., interview, survey, and focus
group, as well as public participation GIS), using social media as secondary data has its
71
own strengths, such as cost-efficiency for data collection, convenience given precise
geographic information for each datum, and reduced subjectivity because the data are not
gathered by direct contact between researcher and participant. Using social media data
also changes demographic biases: first, it gives access to the ‘silent majority’ rather than
the groups who have stronger interests in any specific proposal and who are more likely
to speak up in formal processes; second, it most effectively reaches the younger
generations who are hard to attract to research or stakeholder processes (Delli Carpini,
2000; Quintelier & Vissers, 2008; Park, Kee, & Valenzuela, 2009).
In our previous work, we have shown that it is feasible to use Instagram photos and
captions to understand people’s perceptions of physical landscape features, human
activities and experiences, and landscape values based on a year of Instagram images
geotagged to two Canadian hydro proposals (see Chapter 2). In this paper, we will use
these geo-tagged Instagram posts collected in the two study areas, the degrading
Mactaquac Generating Station (Mactaquac), New Brunswick, and the in-progress Site C
Clean Energy Project (Site C), British Columbia, to map landscape values. We will probe
two questions: (1) if and how social media data from Instagram can be used to map
landscape values; and (2) what insights and implications such landscape value maps
present for the two hydroelectric projects.
3.6 Background
3.6.1 The Evolution of Landscape Value Assessment
The majority of early landscape studies were carried out far from daily life, such as in a
forest, thus the values of place were firstly understood based on pure physical features
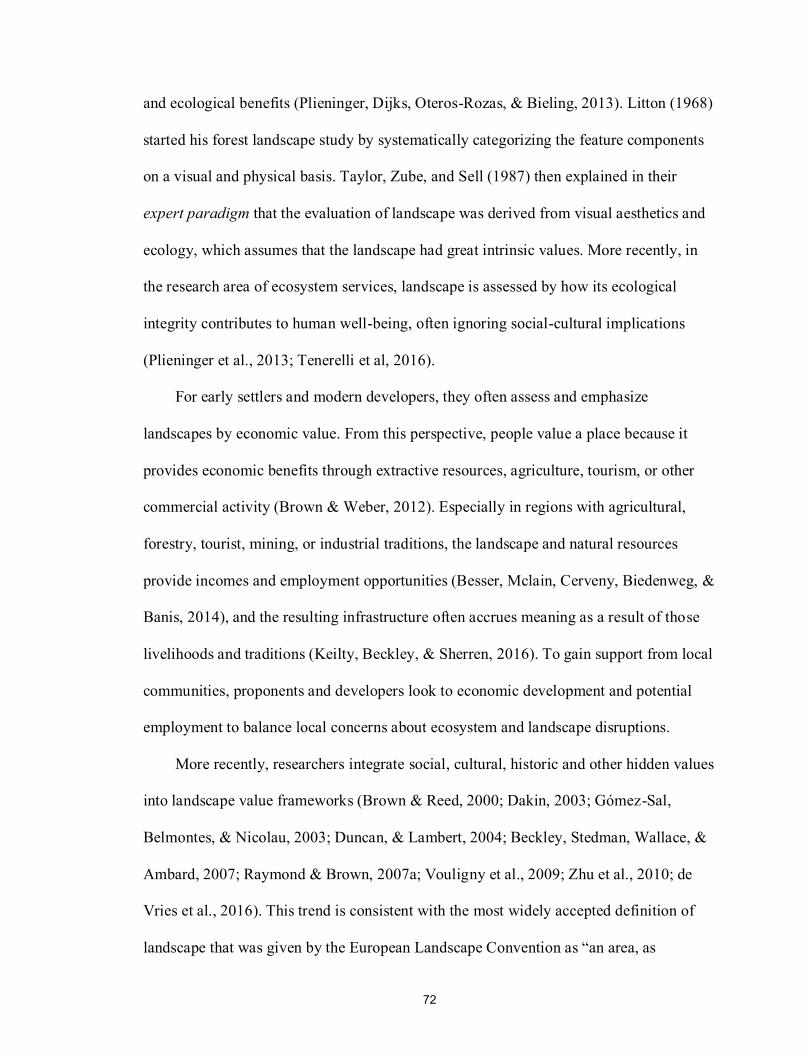
72
and ecological benefits (Plieninger, Dijks, Oteros-Rozas, & Bieling, 2013). Litton (1968)
started his forest landscape study by systematically categorizing the feature components
on a visual and physical basis. Taylor, Zube, and Sell (1987) then explained in their
expert paradigm that the evaluation of landscape was derived from visual aesthetics and
ecology, which assumes that the landscape had great intrinsic values. More recently, in
the research area of ecosystem services, landscape is assessed by how its ecological
integrity contributes to human well-being, often ignoring social-cultural implications
(Plieninger et al., 2013; Tenerelli et al, 2016).
For early settlers and modern developers, they often assess and emphasize
landscapes by economic value. From this perspective, people value a place because it
provides economic benefits through extractive resources, agriculture, tourism, or other
commercial activity (Brown & Weber, 2012). Especially in regions with agricultural,
forestry, tourist, mining, or industrial traditions, the landscape and natural resources
provide incomes and employment opportunities (Besser, Mclain, Cerveny, Biedenweg, &
Banis, 2014), and the resulting infrastructure often accrues meaning as a result of those
livelihoods and traditions (Keilty, Beckley, & Sherren, 2016). To gain support from local
communities, proponents and developers look to economic development and potential
employment to balance local concerns about ecosystem and landscape disruptions.
More recently, researchers integrate social, cultural, historic and other hidden values
into landscape value frameworks (Brown & Reed, 2000; Dakin, 2003; Gomez-Sal,
Belmontes, & Nicolau, 2003; Duncan, & Lambert, 2004; Beckley, Stedman, Wallace, &
Ambard, 2007; Raymond & Brown, 2007a; Vouligny et al., 2009; Zhu et al., 2010; de
Vries et al., 2016). This trend is consistent with the most widely accepted definition of
landscape that was given by the European Landscape Convention as “an area, as
73
perceived by people, whose character is the result of the action and interaction of natural
and/or human factors” (Council of Europe, 2000, p. 2). Inspired by Rolston and Coufal’s
(1991) forest landscape typology, Brown and his colleagues have developed and applied
an integrated landscape value typology that includes spiritual, intrinsic, historic, future,
and cultural landscape values (Brown & Reed, 2000; Brown, Smith, Alessa, & Kliskey,
2004; Alessa, Kliskey, & Brown, 2008). Their work inspires many other researchers to
use and adapt the typology in study of place and landscape values (Beverly et al., 2008;
Zhu et al., 2010; Butler, 2016). Other established landscape value typologies,
independently from Brown’s work, show a similar integrated ethic. Gomez-Sal et al.
(2003) classified landscape values into ecological, productive, economic, cultural, and
social dimensions, which was more concise but roughly grouped some distinctive values
regarding human life and development into the social dimension. Vouligny et al. (2009)
evaluated landscape from a more comprehensive system including 19 attributes, among
which detailed dimensions were shown, such as sense of home, memories, tranquility,
particularities, and community. Butler (2016) studied various landscape value typologies
utilized in previous research and synthesized them into a six-category list: economic,
natural significance, aesthetic/scenic, recreation, cultural significance, and intrinsic. This
is believed by Butler (2016) to be a relatively developed and synthetic typology.
Although comprehensive landscape value typologies were established, to
understand perceived social and cultural values at an individual level is still problematic.
As discussed earlier, since they are difficult to assess, and thus difficult to incorporate
into broader analytical frameworks, they are often dismissed by decision makers.
Individuals evaluate landscapes based on personal knowledge and their experience of
nearby spaces, communities they foster, assessments of utility, feelings of belonging,
74
established lifestyles, and many other factors (Zube, 1987; Vouligny et al., 2009). The
same landscape may thus be perceived as valuable in different ways for different people.
Attempts are made to assess these individual values through such methods as contingent
valuation and public participation GIS (PPGIS). While contingent valuation is widely
used, given many of the hidden landscape values (e.g., heritage, symbolic, and identity)
cannot be defined in monetary format, defining all values in prices limits the capacity to
express the differences which emerge in multiple dimensions of the landscape (Plottu &
Plottu, 2012). That is to say, we may only know people are willing to pay more for one
value than another, but we are not able to understand why and how the differences are
derived. To understand how landscape is perceived differently in different places, some
researchers are mapping where specific landscape values occur and why (e.g., PPGIS).
Mapping landscape values help reveal place-specific perceptions, attitudes, and
preferences among different stakeholders and land use groups (de Vries et al., 2016;
Plieninger et al., 2013). This is also a feasible approach to spatially aggregate varying
and scattered individually perceived landscape values, while revealing diversities among
people, communities, and places.
3.6.2 Mapping Landscape Values and the Use of Social Media Data
Early approaches to mapping landscape values were manual, based on capture
through paper maps, followed by improvement to do the mapping exercises online, but
still showed problems. For instance, Brown and Raymond (2007) used their adapted 12-
category landscape value typology in a mail survey to ask participants to stick variously-
sized paper dots, representing differing importance of each particular value, on a real
map. The geographic information was then digitized into statistical and spatial analysis
75
software. This was a costly and cumbersome process. With the development of online
tools, i.e., Google Maps, this method has been much improved (Brown & Weber, 2012).
With online mapping tools, participants are required to open a web link and click & drag
the virtual dots onto the map. All the geographic information associated with each
landscape value is automatically digitized. In recent years, this concept of PPGIS has
contributed to studies of landscape values, forest landscape planning, and public land
assessment (Brown & Reed, 2012; De Meo, Ferretti, Frattegiani, Lora, & Paletto, 2013;
Brown, Weber, & de Bie, 2014). However, challenges still exist with this method,
including standardizing the scale and precision of capture, as well as respondents being
promoted with a specific limited set of values. There are also barriers to participate by
aged populations and those without good internet source.
Unlike PPGIS, other methods track responses of mobile participants as they move
through space to map landscape values. Bergeron, Paquette, and Poullaouec-Gonidec
(2014) applied on-site and mobile interviews to understand place-specific values.
Participants answered questions when they were at different sites on a fixed route. The
advantage is that people can immerse themselves into the landscape, rather than just
thinking about it when looking at a map. Drawbacks include the difficulty to eliminate
influence from interviewers and the limitation of constructed questions. Sherren, Fischer,
and Price (2010) used photo elicitation to catch the spatially-varying values of graziers in
New South Wales, Australia. Participants were asked to photograph significant features
on their properties and the photos, and their respective viewsheds, were mapped to
understand attachment to trees. Both of these approaches were expensive and time-
consuming and only feasible for small samples.
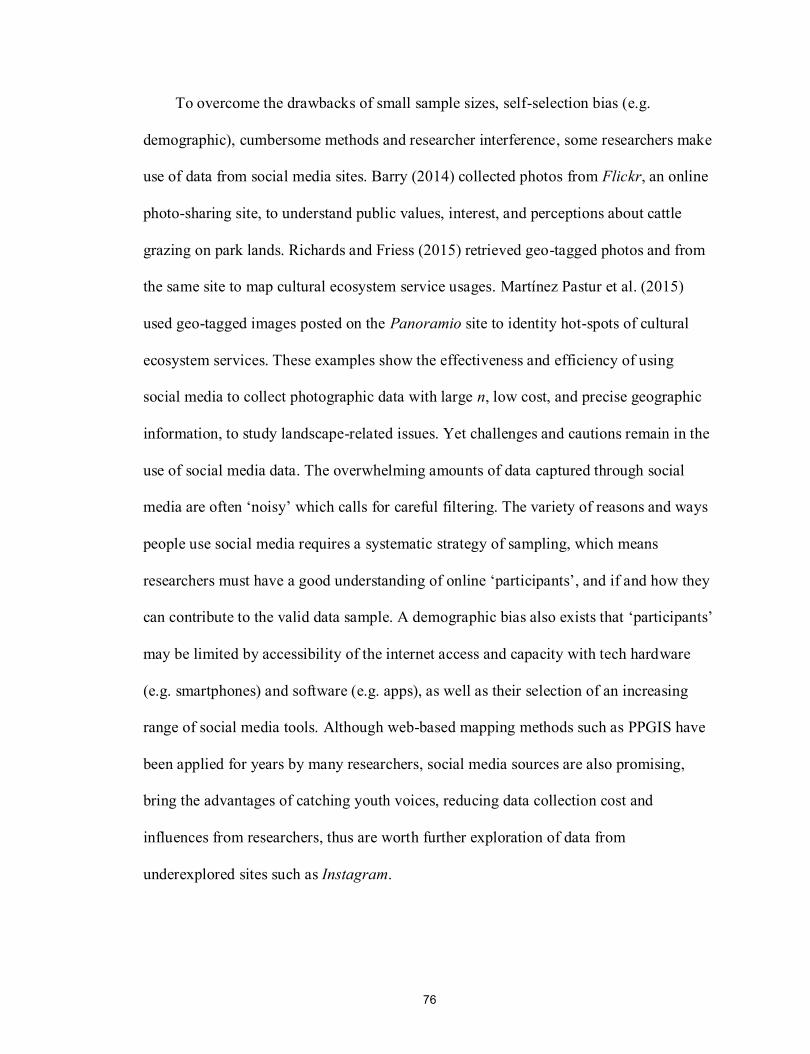
76
To overcome the drawbacks of small sample sizes, self-selection bias (e.g.
demographic), cumbersome methods and researcher interference, some researchers make
use of data from social media sites. Barry (2014) collected photos from Flickr, an online
photo-sharing site, to understand public values, interest, and perceptions about cattle
grazing on park lands. Richards and Friess (2015) retrieved geo-tagged photos and from
the same site to map cultural ecosystem service usages. Martínez Pastur et al. (2015)
used geo-tagged images posted on the Panoramio site to identity hot-spots of cultural
ecosystem services. These examples show the effectiveness and efficiency of using
social media to collect photographic data with large n, low cost, and precise geographic
information, to study landscape-related issues. Yet challenges and cautions remain in the
use of social media data. The overwhelming amounts of data captured through social
media are often ‘noisy’ which calls for careful filtering. The variety of reasons and ways
people use social media requires a systematic strategy of sampling, which means
researchers must have a good understanding of online ‘participants’, and if and how they
can contribute to the valid data sample. A demographic bias also exists that ‘participants’
may be limited by accessibility of the internet access and capacity with tech hardware
(e.g. smartphones) and software (e.g. apps), as well as their selection of an increasing
range of social media tools. Although web-based mapping methods such as PPGIS have
been applied for years by many researchers, social media sources are also promising,
bring the advantages of catching youth voices, reducing data collection cost and
influences from researchers, thus are worth further exploration of data from
underexplored sites such as Instagram.
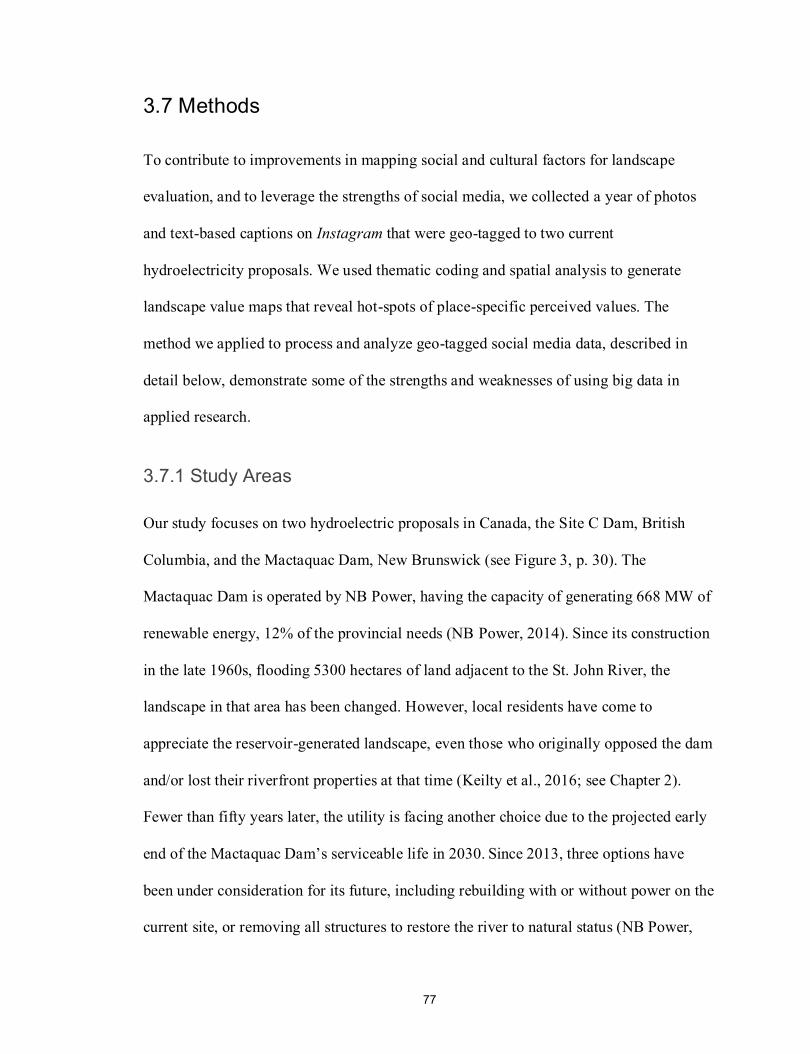
77
3.7 Methods
To contribute to improvements in mapping social and cultural factors for landscape
evaluation, and to leverage the strengths of social media, we collected a year of photos
and text-based captions on Instagram that were geo-tagged to two current
hydroelectricity proposals. We used thematic coding and spatial analysis to generate
landscape value maps that reveal hot-spots of place-specific perceived values. The
method we applied to process and analyze geo-tagged social media data, described in
detail below, demonstrate some of the strengths and weaknesses of using big data in
applied research.
3.7.1 Study Areas
Our study focuses on two hydroelectric proposals in Canada, the Site C Dam, British
Columbia, and the Mactaquac Dam, New Brunswick (see Figure 3, p. 30). The
Mactaquac Dam is operated by NB Power, having the capacity of generating 668 MW of
renewable energy, 12% of the provincial needs (NB Power, 2014). Since its construction
in the late 1960s, flooding 5300 hectares of land adjacent to the St. John River, the
landscape in that area has been changed. However, local residents have come to
appreciate the reservoir-generated landscape, even those who originally opposed the dam
and/or lost their riverfront properties at that time (Keilty et al., 2016; see Chapter 2).
Fewer than fifty years later, the utility is facing another choice due to the projected early
end of the Mactaquac Dam’s serviceable life in 2030. Since 2013, three options have
been under consideration for its future, including rebuilding with or without power on the
current site, or removing all structures to restore the river to natural status (NB Power,
78
2016a). This year, NB Power announced that new approaches may allow the dam to be
repaired so that it can generate power to its original 100-year service life, but the
viability of this fourth extended life option has not yet been confirmed (NB Power,
2016a). All options have inspired heated public discussions, informally and through
formal stakeholder processes, around associated economic, environmental, and especially
social issues (Sherren et al., 2016). The most ecosystem-beneficial option, to restore the
river, is actually least favored among locals because they have come to love the
reservoir’s amenities (Keilty et al., 2016; see Chapter 2). Local opinions are of great
importance this time because the original dam construction was stigmatized as a top-
down decision by the government and approved despite public concerns for communities
and the ecosystem (Canadian Rivers Institute, 2011). While NB Power has conducted
open houses and online surveys to share information and elicit opinions, both are subject
to demographic bias and other self-selection; little rigorous social science has been
undertaken that seeks to aggregate the disparate voices and stories, and what has been
was not funded by the utility (Sherren et al., 2016; Keilty et al., 2016; NB Power, 2016b).
According to our recent work conceptually mapping landscape features, activities and
values, we have identified that reservoir-based lifestyle is key to understanding local
attachments to the place (see Chapter 2).
The approved Site C Dam project has begun construction in the Peace River
catchment, although there remains considerable resistance from local Aboriginal
communities and scholars (Amnesty International, 2016; Mccarthy, 2016). Unless some
last ditch protests are successful, the dam will flood about 3000 hectares of fertile, low-
lying farmland under the reservoir in the near future (Hume, 2014). Compared with the
Mactaquac case, the Site C Dam is located in a remoter area with fewer communities and
79
sparser population. The Joint Review Panel report on BC Hydro’s environmental impact
statement about the Site C Dam indicated that the effect of the project on the landscape
would be a significant adverse effect which would be irreversible (BC Hydro & Power
Authority British Columbia, 2014), but only from the visual and biophysical perspectives.
This project has also met with opposition within local communities, as well as social
mobilization in far-flung population centers such as the provincial capital of Victoria
(Chen, 2015). Our previous research reveals the current landscape with the composition
of river, riparian land and mountains is widely appreciated as aesthetically valuable and
that the farmland along the river is at the root of their senses of belong to the place (see
Chapter 2).
While the case studies differ in many ways, the oppositions toward the hydroelectric
energy proposals are driven in part by the same reason: to keep the current landscape.
The general landscape in the two case areas are similar. Both dam locations are within a
short distance of a significant town, with an upstream area (originally) characterized by
farmland and small resource towns. Also, both dams are the most downstream of three
on their respective rivers.
3.7.2 Data Collection
We use Instagram as our secondary data source. Instagram is a popular photo- and
video-sharing social media platform and had 400 million monthly active users in
September 2015 (Statista, 2015). Its geo-tagging system allows users to assign photos
with geographic information of where the picture was taken or where it was posted. We
collected photos and text-based captions which were geo-tagged to the areas within 5 km
radius of a range of data collection points via Netlytic (2016) during a one-year period,
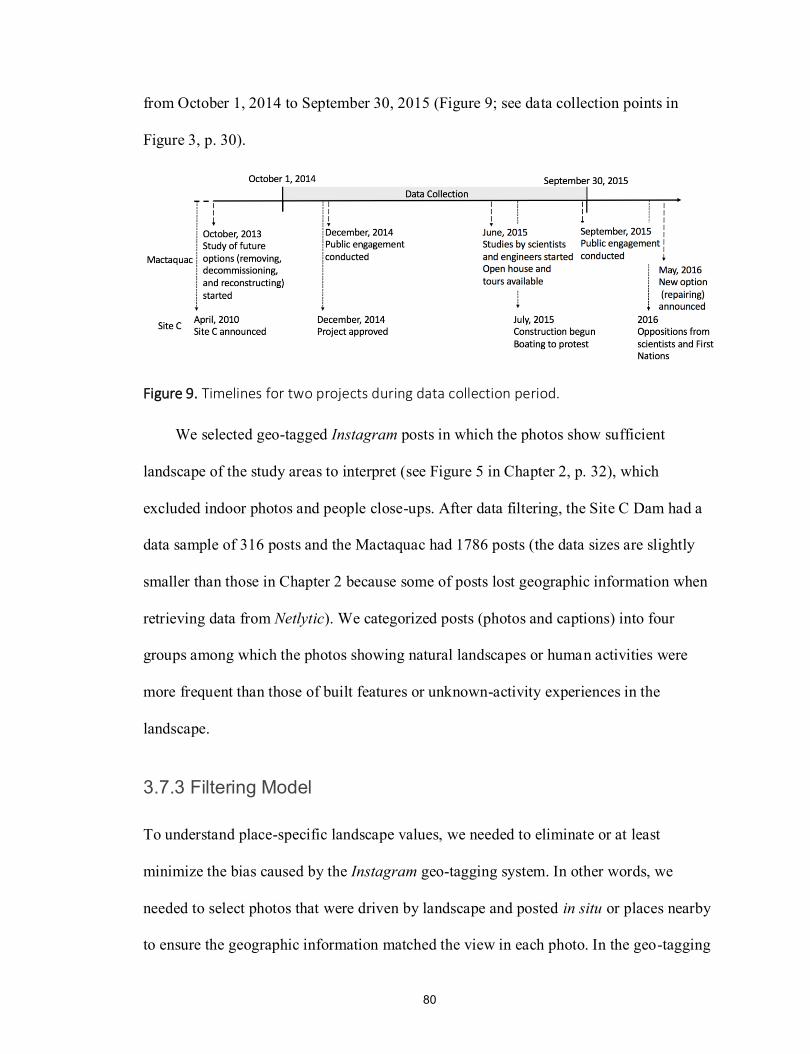
80
from October 1, 2014 to September 30, 2015 (Figure 9; see data collection points in
Figure 3, p. 30).
Figure 9. Timelines for two projects during data collection period.
We selected geo-tagged Instagram posts in which the photos show sufficient
landscape of the study areas to interpret (see Figure 5 in Chapter 2, p. 32), which
excluded indoor photos and people close-ups. After data filtering, the Site C Dam had a
data sample of 316 posts and the Mactaquac had 1786 posts (the data sizes are slightly
smaller than those in Chapter 2 because some of posts lost geographic information when
retrieving data from Netlytic). We categorized posts (photos and captions) into four
groups among which the photos showing natural landscapes or human activities were
more frequent than those of built features or unknown-activity experiences in the
landscape.
3.7.3 Filtering Model
To understand place-specific landscape values, we needed to eliminate or at least
minimize the bias caused by the Instagram geo-tagging system. In other words, we
needed to select photos that were driven by landscape and posted in situ or places nearby
to ensure the geographic information matched the view in each photo. In the geo-tagging
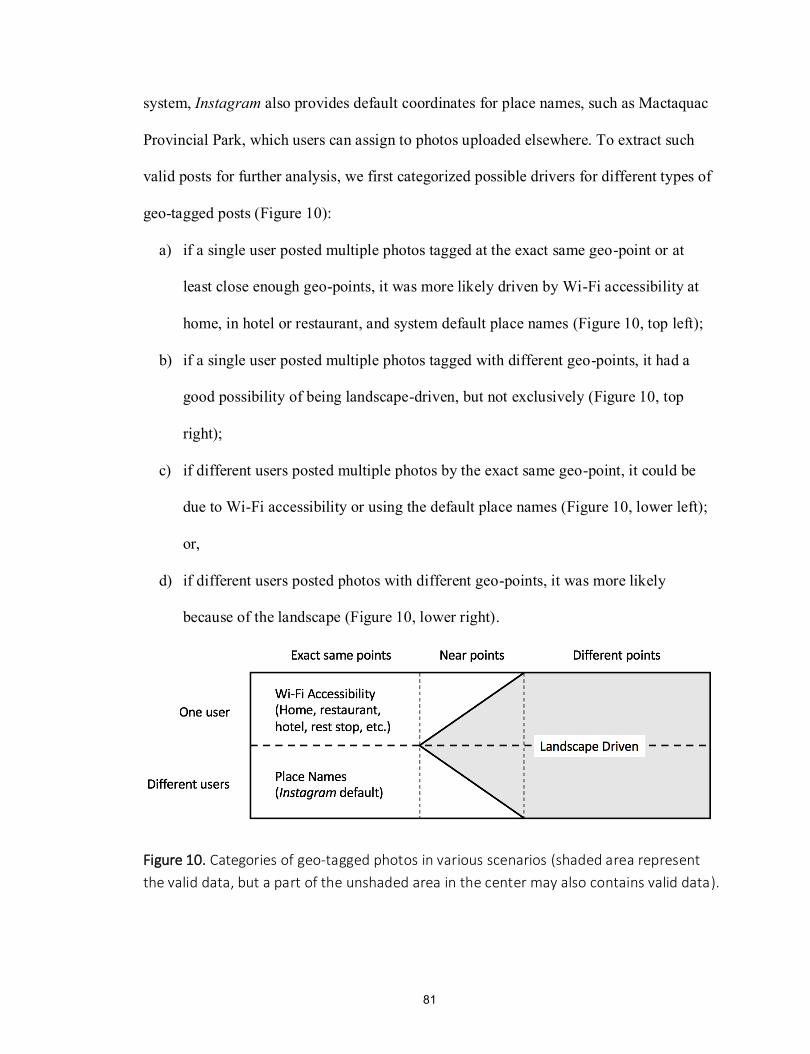
81
system, Instagram also provides default coordinates for place names, such as Mactaquac
Provincial Park, which users can assign to photos uploaded elsewhere. To extract such
valid posts for further analysis, we first categorized possible drivers for different types of
geo-tagged posts (Figure 10):
a) if a single user posted multiple photos tagged at the exact same geo-point or at
least close enough geo-points, it was more likely driven by Wi-Fi accessibility at
home, in hotel or restaurant, and system default place names (Figure 10, top left);
b) if a single user posted multiple photos tagged with different geo-points, it had a
good possibility of being landscape-driven, but not exclusively (Figure 10, top
right);
c) if different users posted multiple photos by the exact same geo-point, it could be
due to Wi-Fi accessibility or using the default place names (Figure 10, lower left);
or,
d) if different users posted photos with different geo-points, it was more likely
because of the landscape (Figure 10, lower right).
Figure 10. Categories of geo-tagged photos in various scenarios (shaded area represent
the valid data, but a part of the unshaded area in the center may also contains valid data).
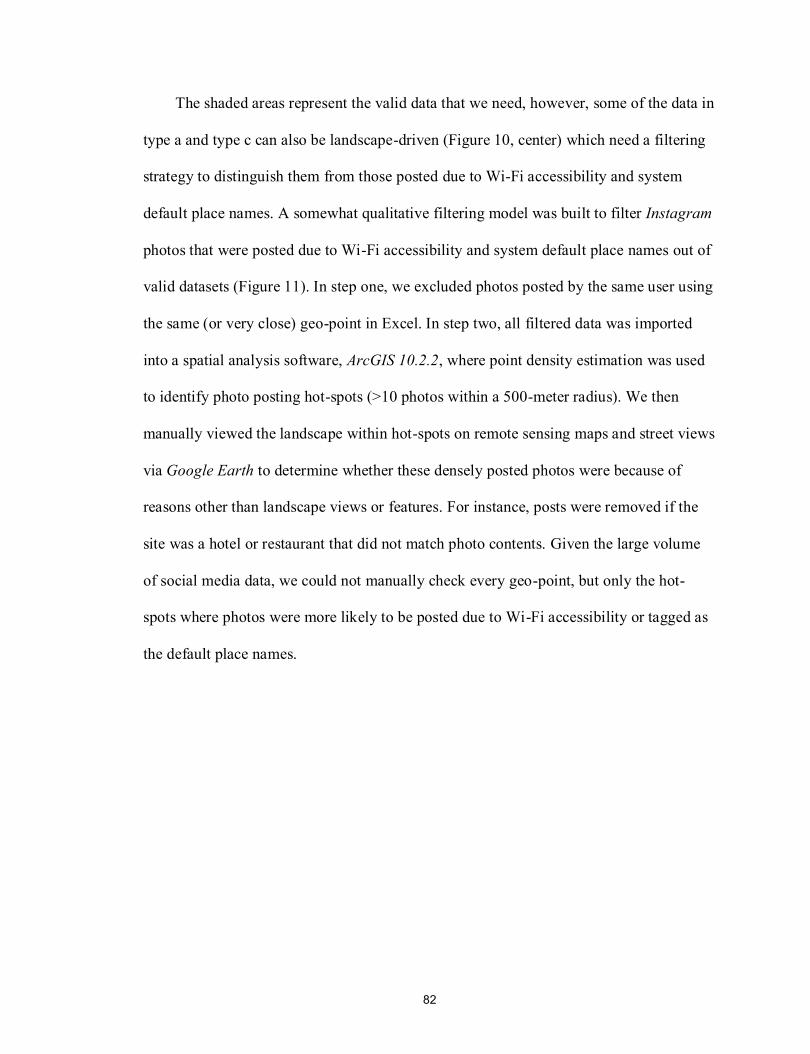
82
The shaded areas represent the valid data that we need, however, some of the data in
type a and type c can also be landscape-driven (Figure 10, center) which need a filtering
strategy to distinguish them from those posted due to Wi-Fi accessibility and system
default place names. A somewhat qualitative filtering model was built to filter Instagram
photos that were posted due to Wi-Fi accessibility and system default place names out of
valid datasets (Figure 11). In step one, we excluded photos posted by the same user using
the same (or very close) geo-point in Excel. In step two, all filtered data was imported
into a spatial analysis software, ArcGIS 10.2.2, where point density estimation was used
to identify photo posting hot-spots (>10 photos within a 500-meter radius). We then
manually viewed the landscape within hot-spots on remote sensing maps and street views
via Google Earth to determine whether these densely posted photos were because of
reasons other than landscape views or features. For instance, posts were removed if the
site was a hotel or restaurant that did not match photo contents. Given the large volume
of social media data, we could not manually check every geo-point, but only the hot-
spots where photos were more likely to be posted due to Wi-Fi accessibility or tagged as
the default place names.
83
Figure 11. Data filtering model (using Mactaquac dataset as an example).
This spatial filtering process resulted in the removal of 13% and 14% of photos,
respectively, in the Site C and Mactaquac datasets. In the Site C dataset, hot-spot No. 05
contained 24 photos tagged as the same geo-point for Hudson’s Hope but was far away
from the viewpoints (Figure 12a), which were filtered during step 3. In the Mactaquac
case, 198 photos were excluded because they were tagged at default place names, posted
at home but showing views elsewhere (e.g. tropical holidays), and at Wi-Fi accessible
locations such as gas stations where the real photo location could not be assured (Figure
12b). After data filtering, the remaining data was considered valid for generating
landscape value maps (Table 3).
84
Table 3. Data volumes during filtering process.
Site C Mactaquac
Geo-tagged landscape
photos 316 1786
Step 1 Exact same points excluded
300 1729
Step 2 Generate hot-spots
Photos within
hot-spots
Photos
without hot-
spots
Photos within
hot-spots
Photos
without hot-
spots
189 110 1182 547
Step 3 Photos that do not match geo-location removed
165 984
Valid Data 275 1531
a)
85
b)
Figure 12. Drivers for geo-tagged photo sharing on Instagram in a) the Site C area, British
Columbia, and b) the Mactaquac area, New Brunswick.
3.7.4 Landscape Value Coding and Mapping
We coded all valid photos and captions in NVivo 11 into landscape values (see details in
Chapter 2). Landscape values were only coded from text-based captions excluding
emojis which can have unclear meaning. We used semi-inductive content analysis (Hsieh
& Shannon, 2005; Thomas, 2006) and identified six social and cultural landscape values
from the captions both by sample words (Table 4) and a full understanding of the
contexts.
86
Table 4. Sample words for landscape value coding.
Landscape Values Sample Words
Aesthetics beautiful, beauty, pretty, view (as in “nice
view’, ‘good view’, ‘wonderful view’)
Sense of home home, family, house
Community attachment community, hometown
Lifestyle Life (as in ‘summerlife’, ‘riverlife’,
‘lakelife’), lifestyle
Memory miss, memory
Cultural identity Canadian (generally related to
characteristic winter)
Valid data was imported into ArcGIS 10.2.2, where each post contains the
geographic information and coding results for different types of landscape values
(recorded as Boolean: 1 if the value was coded and 0 if it was not). We used kernel
density estimation to first generate the post density map for all valid data to show where
photos were uploaded on Instagram; and then generated density maps for each landscape
value to identify hot-spots where each value was highly appreciated. The cell size
selected for kernel density estimation was 500 meters and the search radius was 5000
meters, which were heuristically determined by the geographic nature of the study areas,
and drawing on empirical insights from previous studies (Raymond & Brown, 2007b;
Alessa et al., 2008; Brown & Donovan, 2014).
We used the 2011 Canadian Census of Population census block data to compare
hot-spots with population density (Statistics Canada, 2011) to analyze whether they were
driven simply by increased observation or by the specific landscape in that place. We
converted population density to an integer raster layer with the same extent and cell size
as the photo density raster, and conducted band collection statistics. The resulting
correlation matrix showed the degree of linear relationship (and thus independence)
87
between the two variables, to help assess the effectiveness of using geo-tagged social
media data to map landscape values under the process established above; highly
correlated data would suggest that population density would be a simple proxy.
3.8 Results
This section discusses separately the thematic coding of landscape values, the maps of
those hot-spots, and how the value hot-spots correlate with population density. The
subsequent discussions section interprets the results in light of the literature and our
research questions.
3.8.1 Landscape Value Coding
The coding results (Table 5) show that six landscape values were identified from text-
based captions of Instagram photos. In the Site C area, aesthetics was the most common
landscape value, coded from 22% of the 275 posts which were often co-tagged with
hashtags like “#Peace River”, “#Peace Valley”, and “#British Columbia”. The caption
below is an example:
“Beauty day. #Peace Valley #Peace River #beautiful #scenery #lovethis #sunshine
#instagood #instagreat #doubletap #perf #home #myfave” (Instagram user
bobinster10, 2015).
This post also reveals another value, sense of home, which was coded to 4 posts out of
the total. Due to a smaller data size in this remote area, landscape values such as
community attachment, cultural identity, lifestyle, and memory, were also only identified
in a few posts, which affects some of the mapping and statistics that follow.
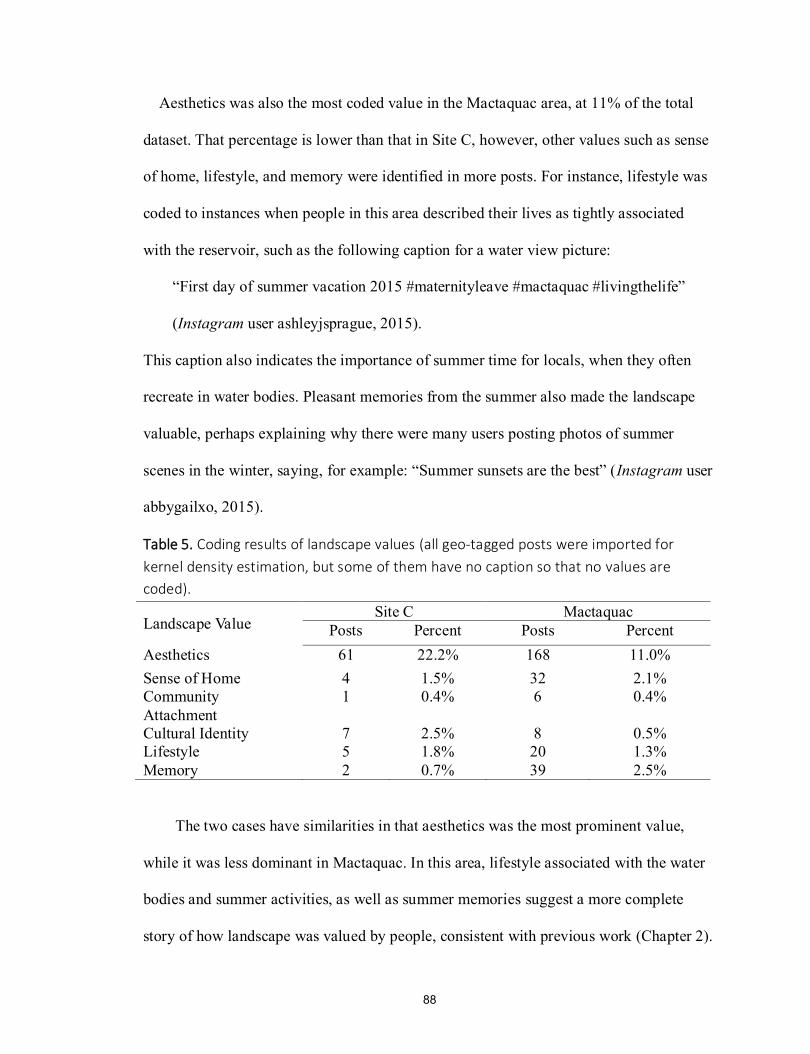
88
Aesthetics was also the most coded value in the Mactaquac area, at 11% of the total
dataset. That percentage is lower than that in Site C, however, other values such as sense
of home, lifestyle, and memory were identified in more posts. For instance, lifestyle was
coded to instances when people in this area described their lives as tightly associated
with the reservoir, such as the following caption for a water view picture:
“First day of summer vacation 2015 #maternityleave #mactaquac #livingthelife”
(Instagram user ashleyjsprague, 2015).
This caption also indicates the importance of summer time for locals, when they often
recreate in water bodies. Pleasant memories from the summer also made the landscape
valuable, perhaps explaining why there were many users posting photos of summer
scenes in the winter, saying, for example: “Summer sunsets are the best” (Instagram user
abbygailxo, 2015).
Table 5. Coding results of landscape values (all geo-tagged posts were imported for
kernel density estimation, but some of them have no caption so that no values are
coded).
Landscape Value Site C Mactaquac
Posts Percent Posts Percent
Aesthetics 61 22.2% 168 11.0%
Sense of Home 4 1.5% 32 2.1%
Community
Attachment
1 0.4% 6 0.4%
Cultural Identity 7 2.5% 8 0.5%
Lifestyle 5 1.8% 20 1.3%
Memory 2 0.7% 39 2.5%
The two cases have similarities in that aesthetics was the most prominent value,
while it was less dominant in Mactaquac. In this area, lifestyle associated with the water
bodies and summer activities, as well as summer memories suggest a more complete
story of how landscape was valued by people, consistent with previous work (Chapter 2).
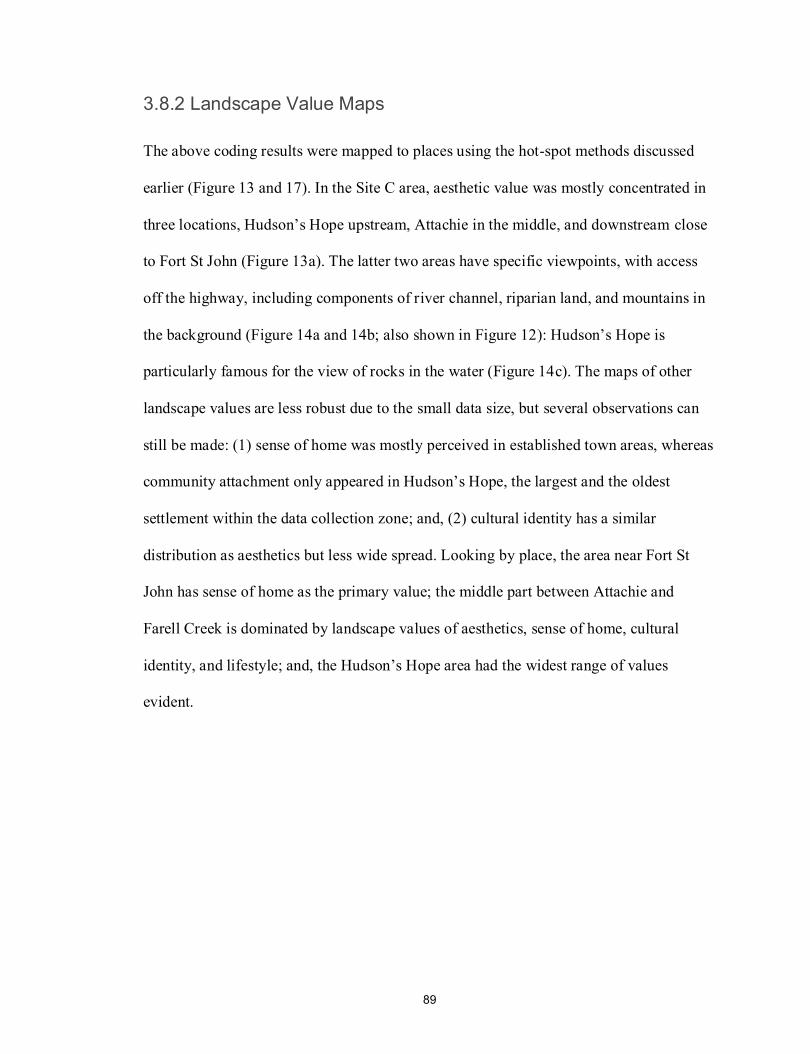
89
3.8.2 Landscape Value Maps
The above coding results were mapped to places using the hot-spot methods discussed
earlier (Figure 13 and 17). In the Site C area, aesthetic value was mostly concentrated in
three locations, Hudson’s Hope upstream, Attachie in the middle, and downstream close
to Fort St John (Figure 13a). The latter two areas have specific viewpoints, with access
off the highway, including components of river channel, riparian land, and mountains in
the background (Figure 14a and 14b; also shown in Figure 12): Hudson’s Hope is
particularly famous for the view of rocks in the water (Figure 14c). The maps of other
landscape values are less robust due to the small data size, but several observations can
still be made: (1) sense of home was mostly perceived in established town areas, whereas
community attachment only appeared in Hudson’s Hope, the largest and the oldest
settlement within the data collection zone; and, (2) cultural identity has a similar
distribution as aesthetics but less wide spread. Looking by place, the area near Fort St
John has sense of home as the primary value; the middle part between Attachie and
Farell Creek is dominated by landscape values of aesthetics, sense of home, cultural
identity, and lifestyle; and, the Hudson’s Hope area had the widest range of values
evident.
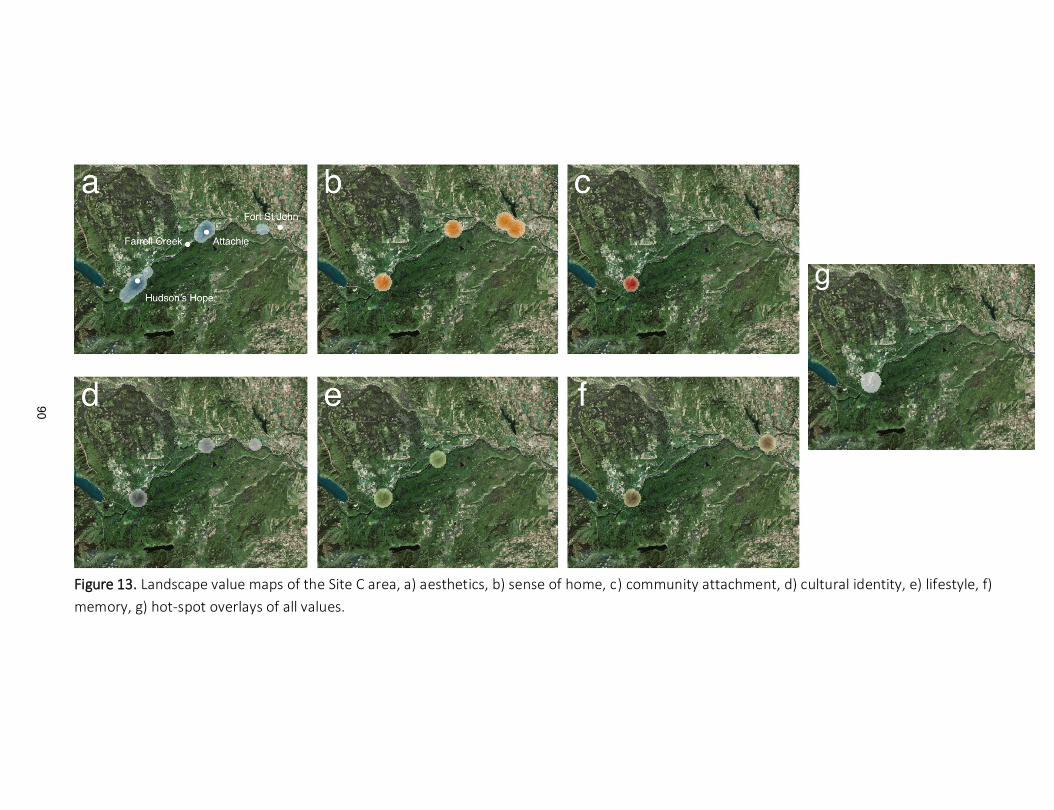
90
Figure 13. Landscape value maps of the Site C area, a) aesthetics, b) sense of home, c) community attachment, d) cultural identity, e) lifestyle, f)
memory, g) hot-spot overlays of all values.
90
91
Figure 14. Viewpoints in the aesthetically valued areas in the Site C, a) place close to Fort
St John (scott_neo, 2015), b) place around Attachie (beckysue100, 2015), c) Hudson’s
Hope (parkamus, 2015).
Based on a larger data size in the Mactaquac area, we have richer results for
interpretation (Figure 15). Landscape aesthetic value was revealed in extended areas
along the reservoir rather than places merely around the towns. Particularly, it extended
from places near the dam and provincial park to 20 kilometers up. Numerous places
along the Mactaquac reservoir were perceived as aesthetically valuable, for instance, the
Mactaquac Beach and river views (Figure 16a and 16b), as well as the nearby falls, lakes,
and trails (see details in Figure 12). Unlike the general poor accessibility in Site C, these
viewpoints could be visited and appreciated on a daily basis because there were more
human settlements and the landscape is flatter for extended horizons. Community
attachment was highly associated with towns along the reservoir, including Fredericton,
Keswick Ridge, Nackawic, Meductic, Woodstock, and Hartland. However, sense of
home spread to adjacent rural areas. Among those towns along the reservoir, the new
town of Nackawic (officially incorporated in 1976) is a blank spot for all values except
community attachment, which is different from other towns that are attractors for
multiple values. Lifestyle and memory values were more widely perceived over a large

92
area in this area than that in Site C, considering the numbers of photos coded. These two
values were highly related to water bodies including the reservoir, lakes, and streams
(Figure 16c). The geographic distributions of lifestyle and memory values overlap the
town areas, but also occur in less densely populated places.
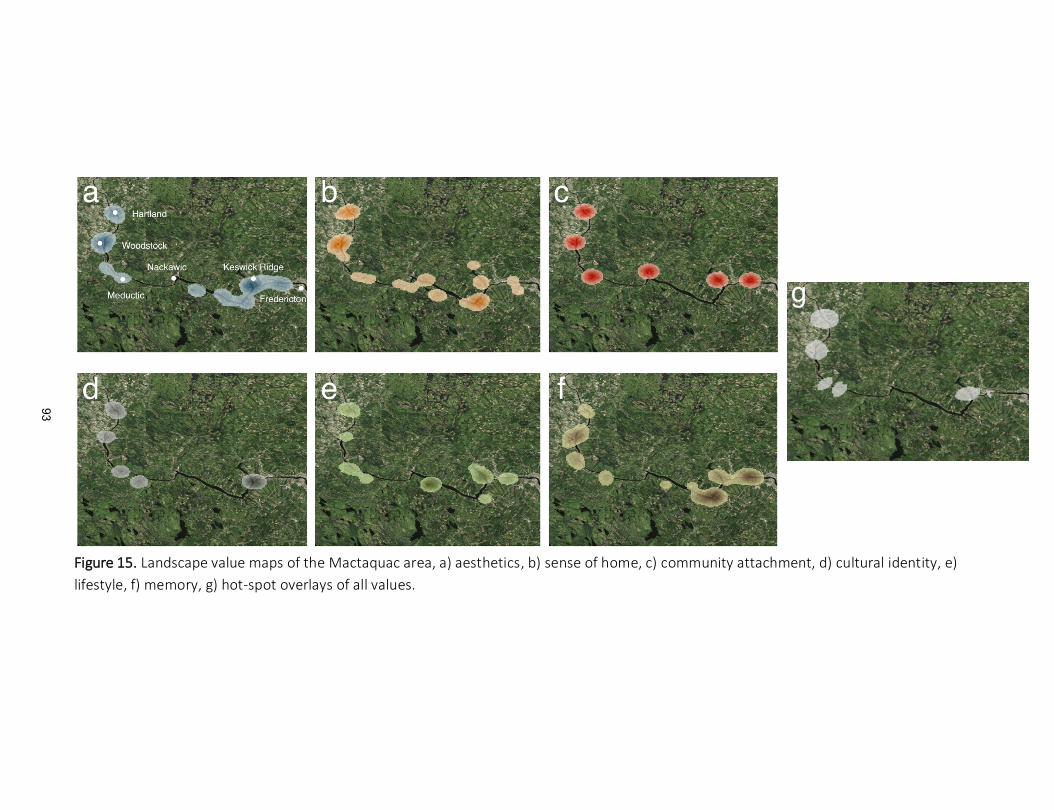
93
Figure 15. Landscape value maps of the Mactaquac area, a) aesthetics, b) sense of home, c) community attachment, d) cultural identity, e)
lifestyle, f) memory, g) hot-spot overlays of all values.
93
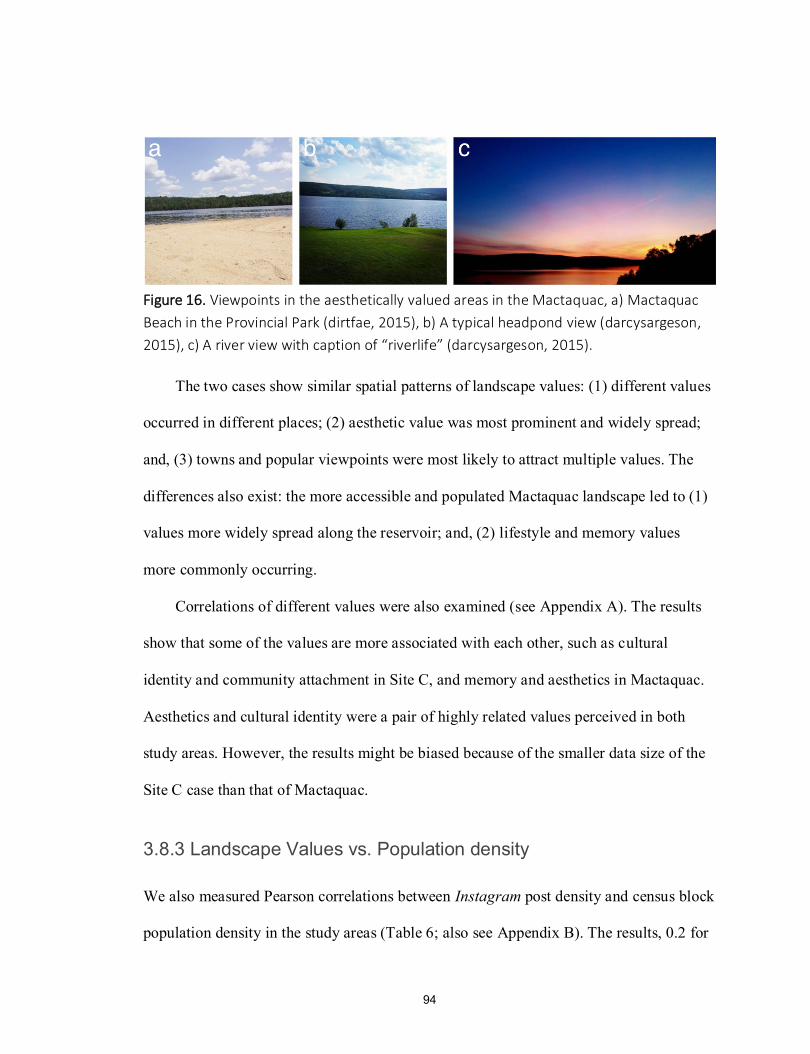
94
Figure 16. Viewpoints in the aesthetically valued areas in the Mactaquac, a) Mactaquac
Beach in the Provincial Park (dirtfae, 2015), b) A typical headpond view (darcysargeson,
2015), c) A river view with caption of “riverlife” (darcysargeson, 2015).
The two cases show similar spatial patterns of landscape values: (1) different values
occurred in different places; (2) aesthetic value was most prominent and widely spread;
and, (3) towns and popular viewpoints were most likely to attract multiple values. The
differences also exist: the more accessible and populated Mactaquac landscape led to (1)
values more widely spread along the reservoir; and, (2) lifestyle and memory values
more commonly occurring.
Correlations of different values were also examined (see Appendix A). The results
show that some of the values are more associated with each other, such as cultural
identity and community attachment in Site C, and memory and aesthetics in Mactaquac.
Aesthetics and cultural identity were a pair of highly related values perceived in both
study areas. However, the results might be biased because of the smaller data size of the
Site C case than that of Mactaquac.
3.8.3 Landscape Values vs. Population density
We also measured Pearson correlations between Instagram post density and census block
population density in the study areas (Table 6; also see Appendix B). The results, 0.2 for
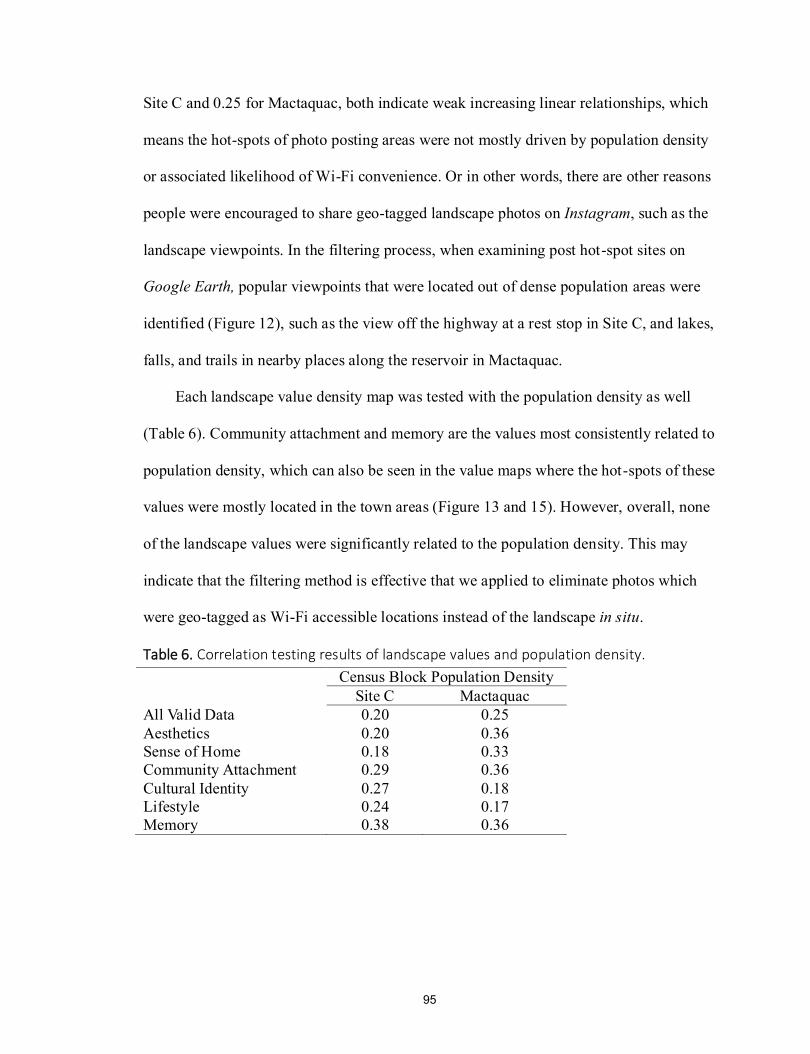
95
Site C and 0.25 for Mactaquac, both indicate weak increasing linear relationships, which
means the hot-spots of photo posting areas were not mostly driven by population density
or associated likelihood of Wi-Fi convenience. Or in other words, there are other reasons
people were encouraged to share geo-tagged landscape photos on Instagram, such as the
landscape viewpoints. In the filtering process, when examining post hot-spot sites on
Google Earth, popular viewpoints that were located out of dense population areas were
identified (Figure 12), such as the view off the highway at a rest stop in Site C, and lakes,
falls, and trails in nearby places along the reservoir in Mactaquac.
Each landscape value density map was tested with the population density as well
(Table 6). Community attachment and memory are the values most consistently related to
population density, which can also be seen in the value maps where the hot-spots of these
values were mostly located in the town areas (Figure 13 and 15). However, overall, none
of the landscape values were significantly related to the population density. This may
indicate that the filtering method is effective that we applied to eliminate photos which
were geo-tagged as Wi-Fi accessible locations instead of the landscape in situ.
Table 6. Correlation testing results of landscape values and population density.
Census Block Population Density
Site C Mactaquac
All Valid Data 0.20 0.25
Aesthetics 0.20 0.36
Sense of Home 0.18 0.33
Community Attachment 0.29 0.36
Cultural Identity 0.27 0.18
Lifestyle 0.24 0.17
Memory 0.38 0.36
96
3.9 Discussion
We leveraged geo-tagged landscape photos and captions on Instagram to understand
place-specific landscape values. This focuses on intangible values. We built a filtering
model to systematically select photos that were driven by landscape viewpoints in situ
rather than Wi-Fi accessibility or system default place names. While we focused on
intangible values, seeking to fill gaps in available methods and protocols for integrating
social and cultural landscape assessment, similar approaches could be used to map more
tangible evidence in photos, such as landscape features or human activities. In this
section, we discuss the key geographic patterns of different landscape values, and the
drivers that might cause hot-spots of each value. Furthermore, the methodology is
discussed to assess the viability of large-sized social media data for landscape study.
3.9.1 The Patterns and Drivers of Landscape Values
The landscape value maps show that different landscape values occurred in different
places and had their own patterns in our study areas. This result supports findings by
recent place-based research that landscape values are complex in space: different places
can be perceived as valuable from different dimensions (Brown, 2006). Unlike early
landscape work, which underestimated how spatial factors can affect people’s
perceptions of specific landscapes, place-specific approaches indicate that landscape
values should be seen and analyzed as relationship values that connect people and place,
which means that the person is a key factor in understanding landscape value formation
(Brown & Donovan, 2014). Individuals often value landscapes differently on the basis of
self-interest and experiences, instead merely of the objective features (Vouligny et al.,
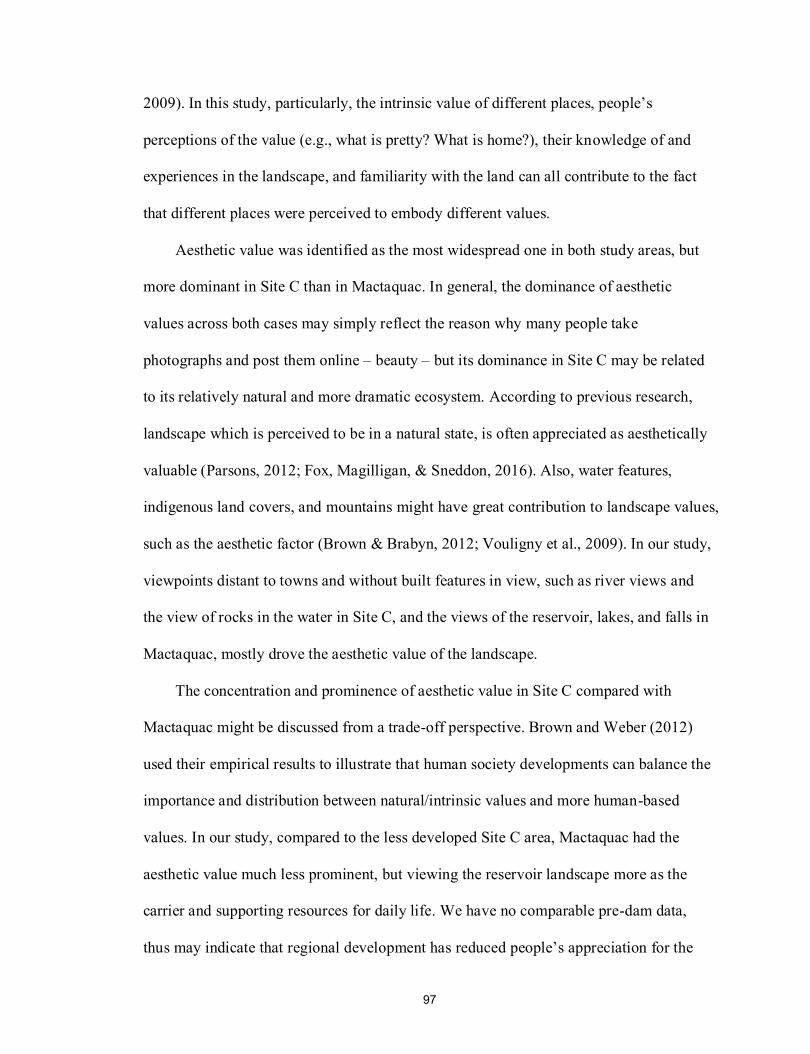
97
2009). In this study, particularly, the intrinsic value of different places, people’s
perceptions of the value (e.g., what is pretty? What is home?), their knowledge of and
experiences in the landscape, and familiarity with the land can all contribute to the fact
that different places were perceived to embody different values.
Aesthetic value was identified as the most widespread one in both study areas, but
more dominant in Site C than in Mactaquac. In general, the dominance of aesthetic
values across both cases may simply reflect the reason why many people take
photographs and post them online – beauty – but its dominance in Site C may be related
to its relatively natural and more dramatic ecosystem. According to previous research,
landscape which is perceived to be in a natural state, is often appreciated as aesthetically
valuable (Parsons, 2012; Fox, Magilligan, & Sneddon, 2016). Also, water features,
indigenous land covers, and mountains might have great contribution to landscape values,
such as the aesthetic factor (Brown & Brabyn, 2012; Vouligny et al., 2009). In our study,
viewpoints distant to towns and without built features in view, such as river views and
the view of rocks in the water in Site C, and the views of the reservoir, lakes, and falls in
Mactaquac, mostly drove the aesthetic value of the landscape.
The concentration and prominence of aesthetic value in Site C compared with
Mactaquac might be discussed from a trade-off perspective. Brown and Weber (2012)
used their empirical results to illustrate that human society developments can balance the
importance and distribution between natural/intrinsic values and more human-based
values. In our study, compared to the less developed Site C area, Mactaquac had the
aesthetic value much less prominent, but viewing the reservoir landscape more as the
carrier and supporting resources for daily life. We have no comparable pre-dam data,
thus may indicate that regional development has reduced people’s appreciation for the
98
landscape as a purely visual source for aesthetics. In Mactaquac, the distribution of
lifestyle reveals a story of individual daily lives and recreational activities. The maps
show locally appreciated “#riverlife” and “lakelife” in the ‘lifestyle’ hot-spots along the
reservoir and near other water bodies, such as Blue Lagoon, Hays Falls, and Davidson
Lake. Memory values distributed similarly with lifestyle, whereby it was tied to summer
memories about the “riverlife”. In our previous research, similar results can be found
from Mactaquac residents’ conceptual landscapes where lifestyle, water-based activities,
and summer life sat at the central point (see Chapter 2).
Notwithstanding these patterns of lifestyle on the landscape, like other studies using
photos online, accessibility also drives geographic patterns of revealed values to some
extent. That is, an area may have the potential to hold a value, if people can get there to
see it and experience it (and in our case, photograph, it) (Brown & Brabyn, 2012; Brown
& Weber, 2012). This explains that the aesthetic value was focused in three spots in Site
C, but was spread further along the reservoir in Mactaquac, since the latter area is flatter
and less remote. There are few ways to overcome this in spatial studies, but conceptual
mapping of features, activities and values (see Chapter 2) can help to identify ‘untapped’
areas of landscape value.
In both cases, sense of home was found spread around towns; however, the
community attachment was strictly concentrated in towns. In our recent research where
we analyzed landscape values from the conceptual aspect, it was difficult to distinguish
the nuance between sense of home and community attachment (see Chapter 2). In this
study, the value maps show the differences that sense of home was more shaped by the
perception of individual’s home and property, such as cottages, which were not
necessarily located in the towns or populated areas (Hough, 1990; Stedman et al., 2007);
99
whereas the community attachment was adhered to towns where people gained the sense
of being connected. These two values both significantly contribute to human sense of and
their attachment to the place (Spirn, 1998; Duncan & Lambert, 2004; Beckley et al.,
2007).
All of the six landscape values we mapped had spatial overlaps, such as town areas
which might be partially caused by the fact that there were more people visiting or living
in the places which results in more posts on Instagram. Despite this, our findings are
consistent with a previous study that revealed communities are the attractors for
landscape values, specifically for the social and cultural values (Beverly et al., 2008).
Our overlaps were mostly in town areas where people live and work, which means they
accessed the landscape frequently and were familiar with it. Such familiarity clearly
affects the acceptance of landscapes and perception of landscape values (Tuan, 1979;
Atkins et al., 1998; Kaplan et al., 1998). But not all towns were perceived the same in
this analysis, and those differences were telling and suggestive of real sensitivity in our
approach. The small mill-town of Nackawic, NB, was built in parallel with the
Mactaquac Dam and the pulp and paper mill that was to use most of its power, to house
new workers at that mill and those who were displaced as a result of the flooding it
caused. Comprised predominantly of pre-fabricated houses, it is arguably not a beautiful
place, but it has a strong community, and this is the only value revealed for it in the
Mactaquac analysis. Interestingly, the old homesteads and settlements around Nackawic
where many of tis families may have roots show as high in sense of home. By contrast,
Hudson’s Hope, BC, is the third oldest community in British Columbia, much older than
others on the Peace River, and revealed all six landscape values in situ.
100
Overlaps appear in places with landscape viewpoints or in recreational sites as well.
It seems clear that the false separation of use and non-use values is unhelpful: many non-
use values arise through use. For instance, the aesthetic value and lifestyle value were
identified at places such as lakes and falls where people could do recreational activities
in the Mactaquac area. This was also seen in our recent research where summer activities
and lifestyle were conceptually associated (see Chapter 2). The appearance of humans
and their activities will also greatly force landscape value shaping and changing (Brown
& Weber, 2012). In addition, landscape values are not independent with each other;
conversely, values are perceived correlated and some values are more likely to be co-
located (Beverly et al., 2008; Zhu et al., 2010). The drivers, such as landscape viewpoints,
attractions, access/activity sites, or dense populations may drive a cluster of relevant
landscape values in the same place. Also, time in place may be a good predictor of
multiple values, contrasting new towns like Fort St. John and Nackawic with old ones
like Woodstock and Hudson’s Hope.
All the landscape values discussed above have parallels within the sense of place
literature. Perceived values reflect the affective bond between the physical environment
and human beings’ inside world, which is defined as the concept of topophilia (Tuan,
1974). Individuals may view the same landscape differently on the basis of different
experiences, yet within groups demonstrate similar perspectives towards its suitability to
live. Cresswell (2015) also discusses sense of place as human subjective and emotional
attachment to a place, which may change and be lost under the pressure of time-space
compression (Massy, 1993) as development increases and spaces homogenize. Massy
(1993) discussed that how time-space compression – people increasingly moving and
communicating across space – can influence their sense of place. The economic
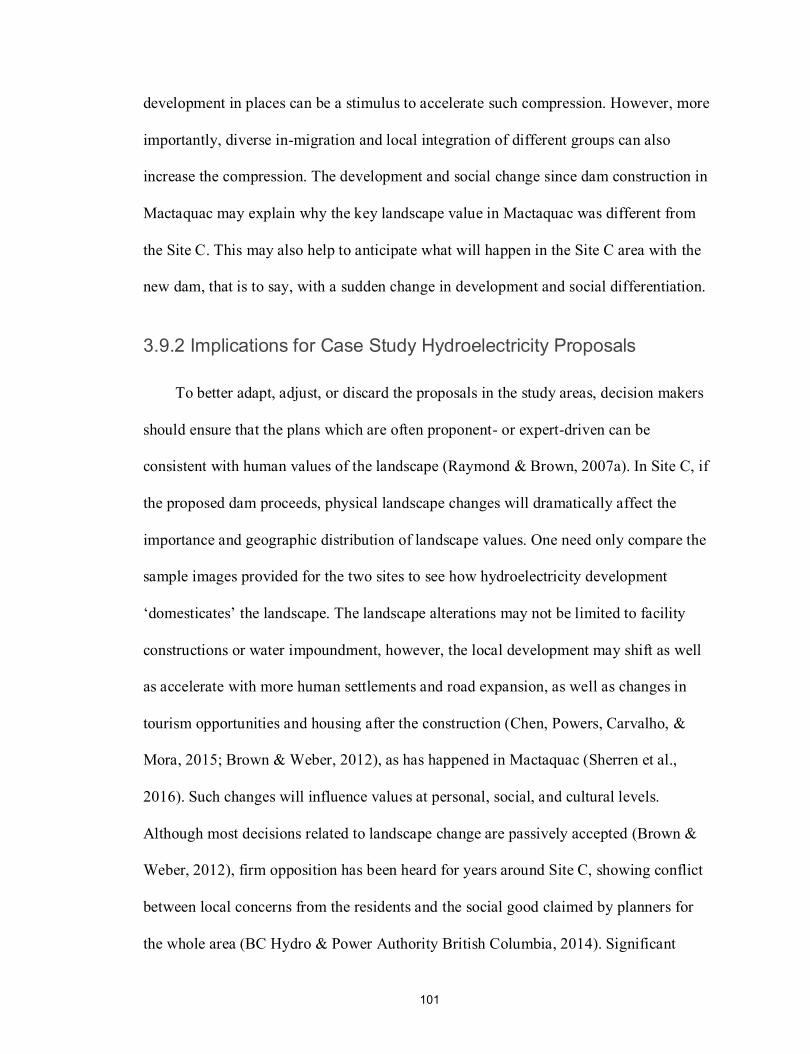
101
development in places can be a stimulus to accelerate such compression. However, more
importantly, diverse in-migration and local integration of different groups can also
increase the compression. The development and social change since dam construction in
Mactaquac may explain why the key landscape value in Mactaquac was different from
the Site C. This may also help to anticipate what will happen in the Site C area with the
new dam, that is to say, with a sudden change in development and social differentiation.
3.9.2 Implications for Case Study Hydroelectricity Proposals
To better adapt, adjust, or discard the proposals in the study areas, decision makers
should ensure that the plans which are often proponent- or expert-driven can be
consistent with human values of the landscape (Raymond & Brown, 2007a). In Site C, if
the proposed dam proceeds, physical landscape changes will dramatically affect the
importance and geographic distribution of landscape values. One need only compare the
sample images provided for the two sites to see how hydroelectricity development
‘domesticates’ the landscape. The landscape alterations may not be limited to facility
constructions or water impoundment, however, the local development may shift as well
as accelerate with more human settlements and road expansion, as well as changes in
tourism opportunities and housing after the construction (Chen, Powers, Carvalho, &
Mora, 2015; Brown & Weber, 2012), as has happened in Mactaquac (Sherren et al.,
2016). Such changes will influence values at personal, social, and cultural levels.
Although most decisions related to landscape change are passively accepted (Brown &
Weber, 2012), firm opposition has been heard for years around Site C, showing conflict
between local concerns from the residents and the social good claimed by planners for
the whole area (BC Hydro & Power Authority British Columbia, 2014). Significant
102
landscape value hot-spots, particularly those with multiple perceived values, should be
paid particular attention in design and impact mitigation. The popular landscape view of
rock pillars in the river at Hudson’s Hope would be significantly affected by the flooding,
perhaps entirely lost, as was Pokiok Falls in Mactaquac. Meanwhile, low-lying home and
property loss would also happen. These will affect the importance and distribution of all
values, particularly of aesthetics and sense of home in Site C.
The negative effects cannot be eliminated, however. Negative influences on one
value may be compensated by forming or increasing other values. Referring to the
hydroelectric development in Mactaquac, promoting the benefits of a reservoir-based
lifestyle may help form new patterns of place-specific values. But, it is hard to say
whether residents get the same benefit from the replacement landscape values. We can be
sure that people in Mactaquac initially suffered from the changes, but adapted to that
change over time to embrace reservoir living (Keilty et al., 2016). Now, the Mactaquac
dam is facing different options for its future, among which to remove the dam is least
favored, locally. The current landscape has been beloved for long time and all identified
landscape values were found along the reservoir. It is rational to conclude that people
tend to seek status quo and a more stable pattern of perceived landscape values. Thus,
decisions that will least affect places with highly or multiply perceived landscape values
would be most benefit for locals, from the consideration of social and cultural landscape.
3.9.3 Using and Filtering Social Media Data for Values Mapping
Spatial mapping of values has been widely applied in various fields and demonstrated as
effective in showing geographic distribution and hot-spots, with some caveats (Brown,
2006). An additional goal in this exploratory work was to determine whether and how we
103
can use social media data for this purpose. Particularly, can we robustly identify
landscape values from Instagram posts? Can these identified values be seen to represent
the perceived values in situ? Can the resulting maps inform decision makers?
The results generated through Instagram posts analysis can offer useful insights for
decision makers to understand the potential conflicts between current perceived
landscape values and expected alterations by energy proposals. Our experience suggests
that there is great potential for using social media data in landscape research. First, just
like conventional approaches, such as interview, survey, and photo elicitation, social
media data can help reveal human attitudes and preferences for the landscape, including
these intangible values (e.g., lifestyle). Second, collecting social media data as secondary
data is a type of passive public participation, without interventions from researchers.
Moreover, social media has additional power in collecting large volume of (often geo-
tagged) data at low cost. And most importantly, it offers a new way to include the
perspectives of young people in public discussions or research activities to offset existing
demographic biases, since the main users of social media are young.
While the method in general is effective, drawbacks appeared in the data collecting
and filtering processes. First, there are many ways Instagram posts can be geo-tagged,
and not all are consistent with the original location where the photo was taken. The
filtering approach taken to ensure a match was systematic yet cumbersome and imperfect,
and in part relied on our knowledge of the study area landscapes, which may not be
viable in all situations. The study areas were also reasonably small and rural, and thus the
number of posts manageable; the approach used may have to be more automated in other
settings, likely causing increased error. Future work should focus on how to improve the
data collection and filtering models. How can we ensure the data retrieved have precise
104
geographic information that matches the photo content? Additionally, the subjectivity of
qualitative coding may be problematic with larger studies and more photos, requiring
more analysts. Is it possible with new semantic classifiers to establish a model to
automatically analyze photos? Such methods will of course not be error-free: any
approach will be vulnerable to confounding situations like the perplexing plastic palm
trees at a Mactaquac-area resort.
In general, the validity, reliability, and interpretability of social media data should
be more critically examined. First, people use different social media sites for different
reasons, such as Twitter for more public ends and Instagram for private life (Chen, 2015).
Even for the same site, people can have different uses and online behaviors (Park, Lee &
Kim, 2012), and this is not yet fully understood. The potential heterogeneity of use
requires a good strategy of sampling, which means researchers must understand their
‘participants’ (see Appendix C). Second, not all demographic cohorts have equal access
to the internet (Statistics Canada, 2006, cited in Beverly et al., 2008), meaning social
media introduces biases related to age, income and education levels. Third, Instagram
posts may not be able to reveal all landscape values. According to our coding work,
identifying social and cultural values of the landscape using social media is easier than
other values, such as learning and biodiversity. Instagram users are less likely to
explicitly discuss about the education values or the biological features of the landscape
on a photo-sharing site. This makes it potentially complementary with other approaches.
Fourth, another concern is about online personality and sanitized self-image which may
affect self-expression. While this is no different from the ways that people may change
behavior to optimize appearances in a conventional interview, it is new, and worth
investigating further. This problem may have larger influences on some sensitive topics
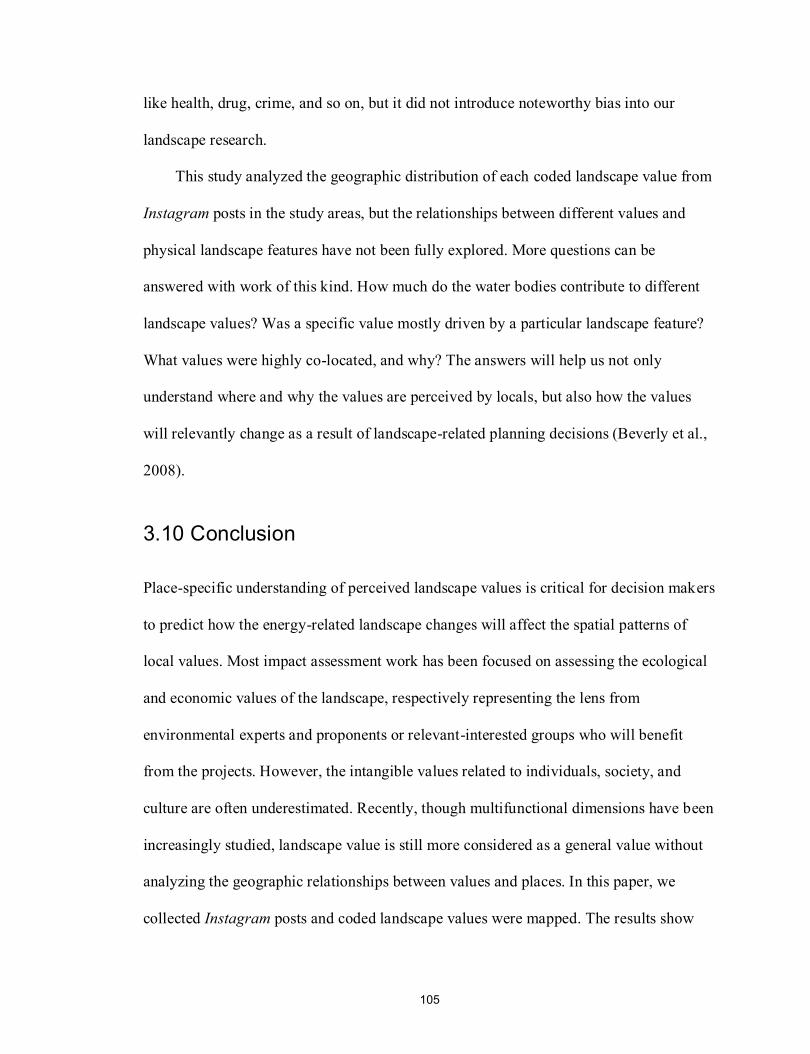
105
like health, drug, crime, and so on, but it did not introduce noteworthy bias into our
landscape research.
This study analyzed the geographic distribution of each coded landscape value from
Instagram posts in the study areas, but the relationships between different values and
physical landscape features have not been fully explored. More questions can be
answered with work of this kind. How much do the water bodies contribute to different
landscape values? Was a specific value mostly driven by a particular landscape feature?
What values were highly co-located, and why? The answers will help us not only
understand where and why the values are perceived by locals, but also how the values
will relevantly change as a result of landscape-related planning decisions (Beverly et al.,
2008).
3.10 Conclusion
Place-specific understanding of perceived landscape values is critical for decision makers
to predict how the energy-related landscape changes will affect the spatial patterns of
local values. Most impact assessment work has been focused on assessing the ecological
and economic values of the landscape, respectively representing the lens from
environmental experts and proponents or relevant-interested groups who will benefit
from the projects. However, the intangible values related to individuals, society, and
culture are often underestimated. Recently, though multifunctional dimensions have been
increasingly studied, landscape value is still more considered as a general value without
analyzing the geographic relationships between values and places. In this paper, we
collected Instagram posts and coded landscape values were mapped. The results show
106
that: (1) different values had different spatial patterns and many overlapped; (2)
aesthetics dominated study areas and was highly correlated with landscape viewpoints
(e.g., water bodies) instead of towns; and (3) old towns held more values. In general,
hydroelectricity-driven landscape changes will undoubtedly affect the spatial patterns of
landscape values. While residents typically seek stability this is not always possible; yet,
decision-makers should pay more attention to preserving locations and viewpoints that
were perceived with one concentrated or multiple values. This paper explored a feasible
and insightful way to using geo-tagged social media data in spatial analysis to understand
landscape values. Although this method can overcome many of the drawbacks that
appear in conventional approaches, it has shortcomings in data collecting and filtering as
well. Future work may improve data validity and reliability, as well as explore spatial
relationships of values and features.
107
References
abbygailxo. (2015, February 19). [Summer sunsets are the best] [Instagram photography].
Retrieved from http://instagram.com/p/zTQZwKnwUM/
Aggestam, F. (2014). Wetland restoration and the involvement of stakeholders: An
analysis based on value-perspectives. Landscape Research, 39(6), 680-697.
Alessa, L., Kliskey, A., & Brown, G. (2008). Social–ecological hot-spots mapping: A
spatial approach for identifying coupled social–ecological space. Landscape and
Urban Planning, 85, 27-39.
ashleyjsprague. (2015, May 29). [First day of summer vacation 2015 #maternityleave
#mactaquac #livingthelife] [Instagram photography]. Retrieved from
https://instagram.com/p/3SAlickfAj/
Atkins, P., Simmons, I., & Roberts, B. (1998). People, land & time: An historical
introduction to the relations between landscape, cultural and environment. New
York, NY: Oxford University Press Inc.
Barry, S. J. (2014). Using social media to discover public values, interests, and
perceptions about cattle grazing on park lands. Environmental Management, 53(2),
454–464.
BC Hydro, & Power Authority British Columbia. (2014, May 1). Report of the Joint
Review Panel: Site C clean energy project. Retrieved from http://www.ceaa-
acee.gc.ca/050/documents/p63919/99173E.pdf
Beckley, T. M., Stedman, R. C., Wallace, S. M., & Ambard, M. (2007). Snapshots of
what matters most: Using resident-employed photography to articulate attachment
to place. Society & Natural Resources, 20(10), 913-929.
beckysue100. (2015, June 28). [#beautifulBC #mypeaceriver drive out to #HudsonsHope
lookout @mypeaceriver] [Instagram photography]. Retrieved from
https://instagram.com/p/4fZN3zG_Q4/
Bergeron, J., Paquette, S., & Poullaouec-Gonidec, P. (2014). Uncovering landscape
values and micro-geographies of meanings with the go-along method. Landscape
and Urban Planning, 122, 108-121.
108
Besser, D. T., Mclain, R., Cerveny, L., Biedenweg, K., & Banis, D. (2014). Mapping
landscape values: Issues, challenges and lessons learned from field work on the
Olympic Peninsula, Washington. Environmental Practice, 16(2), 139-150.
Beverly, J. L., Uto, K., Wikes, J., & Bothwell, P. (2008). Assessing spatial attributes of
forest landscape values: an internet-based participatory mapping approach.
Canadian Journal of Forest Research, 38, 289-303.
bobinster10. (2015, February 23). [Beauty day. #Peace Valley #Peace River #beautiful
#scenery #lovethis #sunshine #instagood #instagreat #doubletap #perf #home
#myfave] [Instagram photography]. Retrieved from
https://instagram.com/p/zdOszrHUgP/
Brown, G. (2006). Mapping landscape values and development preferences: A method
for tourism and residential development planning. International Journal of Tourism
Research, 8, 101-113.
Brown, G., & Brabyn, L. (2012). An analysis of the relationships between multiple
values and physical landscapes at a regional scale using public participation GIS
and landscape character classification. Landscape and Urban Planning, 107, 317-
331.
Brown, G., & Donovan, S. (2014). Measuring change in place values for environmental
and natural resource planning using public participation GIS (PPGIS): Results and
challenges for longitudinal research. Society & Natural Resources, 27(1), 36-54.
Brown, G., & Raymond, C. (2007). The relationship between place attachment and
landscape values: Toward mapping place attachment. Applied Geography, 27, 89-
111.
Brown, G., & Reed, P. (2000). Validation of a forest values typology for use in national
forest planning. Forest Science, 46(2), 240-247.
Brown, G., & Reed, P. (2012). Social landscape metrics: Measures for understanding
place values from public participation geographic information systems (PPGIS).
Landscape Research, 37(1), 73-90.
Brown, G., Smith, C., Alessa, L., & Kliskey, A. (2004). A comparison of perceptions of
biological value with scientific assessment of biological importance. Applied
Geography, 24, 161-180.
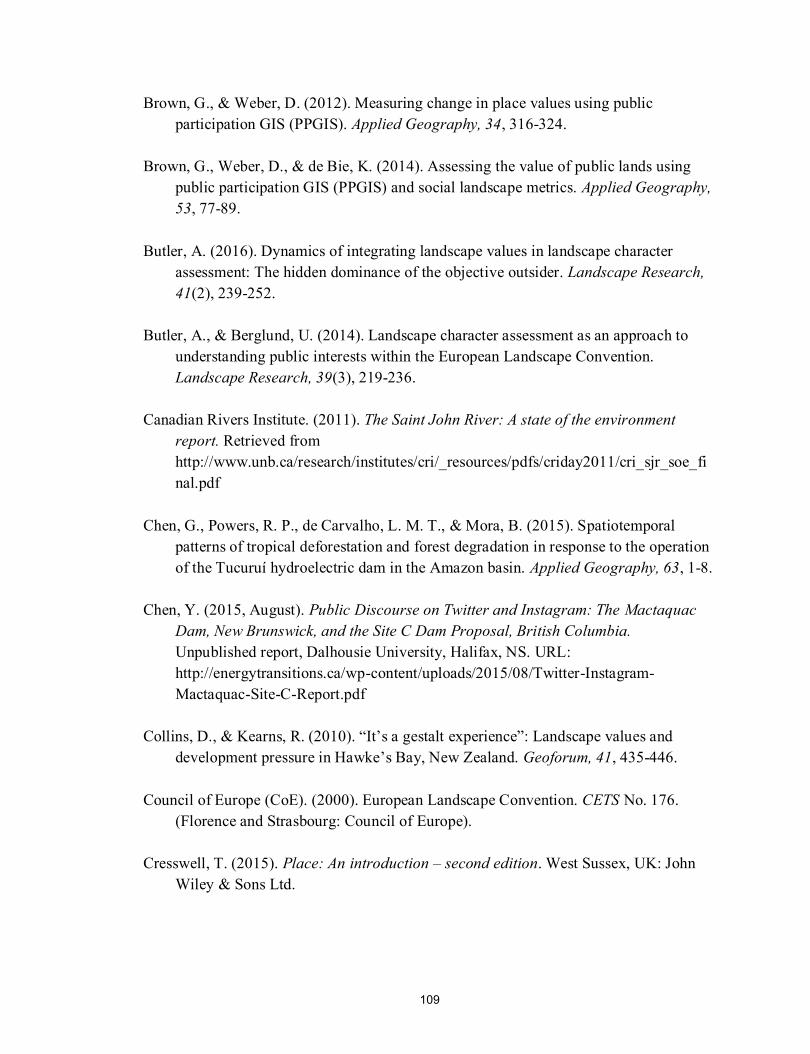
109
Brown, G., & Weber, D. (2012). Measuring change in place values using public
participation GIS (PPGIS). Applied Geography, 34, 316-324.
Brown, G., Weber, D., & de Bie, K. (2014). Assessing the value of public lands using
public participation GIS (PPGIS) and social landscape metrics. Applied Geography,
53, 77-89.
Butler, A. (2016). Dynamics of integrating landscape values in landscape character
assessment: The hidden dominance of the objective outsider. Landscape Research,
41(2), 239-252.
Butler, A., & Berglund, U. (2014). Landscape character assessment as an approach to
understanding public interests within the European Landscape Convention.
Landscape Research, 39(3), 219-236.
Canadian Rivers Institute. (2011). The Saint John River: A state of the environment
report. Retrieved from
http://www.unb.ca/research/institutes/cri/_resources/pdfs/criday2011/cri_sjr_soe_fi
nal.pdf
Chen, G., Powers, R. P., de Carvalho, L. M. T., & Mora, B. (2015). Spatiotemporal
patterns of tropical deforestation and forest degradation in response to the operation
of the Tucuruí hydroelectric dam in the Amazon basin. Applied Geography, 63, 1-8.
Chen, Y. (2015, August). Public Discourse on Twitter and Instagram: The Mactaquac
Dam, New Brunswick, and the Site C Dam Proposal, British Columbia.
Unpublished report, Dalhousie University, Halifax, NS. URL:
http://energytransitions.ca/wp-content/uploads/2015/08/Twitter-Instagram-
Mactaquac-Site-C-Report.pdf
Collins, D., & Kearns, R. (2010). “It’s a gestalt experience”: Landscape values and
development pressure in Hawke’s Bay, New Zealand. Geoforum, 41, 435-446.
Council of Europe (CoE). (2000). European Landscape Convention. CETS No. 176.
(Florence and Strasbourg: Council of Europe).
Cresswell, T. (2015). Place: An introduction – second edition. West Sussex, UK: John
Wiley & Sons Ltd.
110
Dachary-Bernard, J., & Rambonilaza, T. (2012). Choice experiment, multiple
programmes contingent valuation and landscape preferences: How can we support
the land use decision making process? Land Use Policy, 29, 846-854.
Dakin, S. (2003). There’s more to landscape than meets the eye: Towards inclusive
landscape assessment in resource and environmental management. The Canadian
Geographer, 47(2), 185-200.
darcysargeson. (2015, July 28). [My backyard #peaceful]. Retrieved from
https://instagram.com/p/5srE6Nxnx2/
darcysargeson. (2015, September 5). [#Riverlife]. Retrieved from
https://www.instagram.com/p/7RGRUxxn1K/
Delli Carpini, M. X. (2000). Gen.com: Youth, civic engagement, and the new
information environment. Political Communication, 17(4), 341–349.
De Meo, I., Ferretti, F., Frattegiani, M., Lora, C., & Paletto, A. (2013). Public
participation GIS to support a bottom-up approach in forest landscape planning.
iForest, 6, 347-352.
de Vries, S., Buijs, A. E., Langers, F., Farjon, H., van Hinsberg, A., & Sijtsma, F. J.
(2016). Measuring the attractiveness of Dutch landscapes: Identifying national hot-
spots of highly valued places using Google Maps. Applied Geography, 45, 220-229.
Devine-Wright, P. (2009). Rethinking NIMBYism: The role of place attachment and
place identity in explaining place-protective action. Journal of Community &
Applied Social Psychology, 19, 426-441.
dirtfae. (2015, July 10). [chilling on the river w/ @pickles_thehedgehog] [Instagram
photography]. Retrieved from https://instagram.com/p/49nHMkH4gX/
Duncan, J. S., & Lambert, D. (2004). Landscapes of home. In J. S. Duncan, N. C.
Johnson, & R. H. Schein (Eds.), A companion to cultural geography (pp. 382-403).
Malden, MA: Blackwell Publishing.
Filova, L., Vojar, J., Svobodova, L., & Sklenicka, P. (2015): The effect of landscape type
and landscape elements on public visual preferences: Ways to use knowledge in the
context of landscape planning. Journal of Environmental Planning and
Management, 58(11), 2037-2055.
111
Fox, C. A., Magilligan, F. J., & Sneddon, C. S. (2016). “You kill the dam, you are killing
a part of me”: Dam removal and the environmental politics of river restoration.
Geoforum, 70, 93-104.
Gomez-Sal, A., Belmontes, J. A., & Nicolau, J. M. (2003). Assessing landscape values:
A proposal for a multidimensional conceptual model. Ecological Modelling, 168,
319-341.
Hanley, N., Colombo, S., Kristrom, B., & Watson, F. (2009). Accounting for negative,
zero and positive willingness to pay for landscape change in national park. Journal
of Agricultural Economics, 60(1), 1-16.
Henningsson, M., Blicharska, M., Antonson, H., Mikusinski, G., Goransson, G.,
Angelstam, P., Folkeson, L., & Jonsson, S. (2015). Perceived landscape values and
public participation in a road-planning process – a case study in Sweden. Journal of
Environmental Planning and Management, 58(4), 631-653.
Hough, M. (1990). Out of place: Restoring identity to the regional landscape. New
Haven and London, CO: Yale University Press.
Hsieh, H., & Shannon, S. E. (2005). Three approaches to qualitative content analysis.
Qualitative Health Research, 15(9), 1277-1288.
Hume, M. (2014, February 9). Site C dam protesters preparing to descend on Victoria.
The Globe and Mail. Retrieved from http://www.theglobeandmail.com/news/british-
columbia/site-c-dam-protesters-preparing-to-descend-on-victoria/article16770754/
Kaplan, R., Kaplan, S., & Ryan, R. L. (1998). With people in mind: Design and
management of everyday nature. Washington, DC: Island Press.
Keilty, K., Beckley, T. M., Sherren, K. (2016). Landscape acceptability and generational
change on the Mactaquac hydroelectric dam headpond, New Brunswick, Canada.
Geoforum, 75, 234-248.
Kyle, G. T., Jun, J., & Absher, J. D. (2014). Repositioning identity in conceptualizations
of human-place bonding. Environment and Behavior, 46(8), 1018-1043.
Lawson, P. M., Farnsworth, G., & Hartley, M. A. (1985). The Nackawic Bend, 200 years
of history. Canada: Nackawic Town of Nackawic.
112
Litton, R.B, Jr. (1968). Forest landscape description and inventories - a basis for land
planning and design. Berkeley, Calif., Pacific SW. Forest and Range Exp. Sta. 64
pp., illus. (U. S. D. A. Forest Serv. Res. Paper PSW-49).
Martínez Pastur, G., Peri, P. L., Lencinas, M. V., García-Llorente, M., & Martín-López,
B. (2015). Spatial patterns of cultural ecosystem services provision in Southern
Patagonia. Landscape Ecology, 31(2), 383-399.
Massey, D. (2005). Power-geometry and a progressive sense of place. In Bird, J., Curtis,
B., Putnam, T., Robertson, G., & Tickner, L. (Eds.), Mapping the futures: local
cultures, global change. New York, NY: Taylor & Francis e-Library.
Mccarthy, S. (2016, May 24). Ottawa pushes ahead with Site C dam amid opposition
from academics. The Globe and Mail. Retrieved from
http://www.theglobeandmail.com/news/british-columbia/royal-society-of-canada-
academics-call-on-ottawa-to-halt-site-c-project/article30127279/
Menarguez, A. B., & Holgado, P. M. (2014). Assessing the landscape value of public
works: Validation of the methods in the lowlands of the middle section of Tajo
River, Spain. Landscape Research, 39(3), 305-323.
Natural Resources Canada. (2001). [An outline map without names which shows only
Canada’s coastline and boundaries]. Retrieved August 27, 2016, from
http://www.nrcan.gc.ca/earth-sciences/geography/atlas-canada/reference-
maps/16846
NB Power. (2014). Project Description- Mactaquac Project. Retrieved March 30, 2015,
from http://www.mactaquac.ca/project-description/
NB Power. (2016a, May 6). Update on studies exploring Mactaquac operations beyond
2030. Retrieved from http://www.mactaquac.ca/update-on-studies-exploring-
mactaquac-operations-beyond-2030/
NB Power. (2016b). What was said final report. Retrieved September 9, 2016 from
http://www.mactaquac.ca/wp-
content/uploads/2016/08/What_was_said_Report_Mactaquac.pdf
Netlytic [Online software]. (2016). Retrieved from https://netlytic.org/
Park, N., Kee, K. F., & Valenzuela, S. (2009). Being immersed in social networking
environment: Facebook groups, uses and gratifications, and social outcomes. Cyber
Psychology & Behavior, 12(6), 729-733.
113
Park, N., Lee, S., & Kim, J. H. (2012). Individuals’ personal network characteristics and
patterns of Facebook use: A social network approach. Computers in Human
Behavior, 28(5), 1700–1707.
parkamus. (2015, January 29). [The Peace River #tbt #explorebc #greatnorthcollective]
[Instagram photography]. Retrieved from http://instagram.com/p/yclJV1uNae/
Parkhill, K. A., Butler, C., & Pidgeon, N. F. (2014) Landscapes of threat? Exploring
discourses of stigma around large energy developments. Landscape Research, 39(5),
566-582.
Parsons, G. (2012). Aesthetic Preservation. In B. Williston (Ed.), Environmental Ethics
for Canadians (pp. 205-211). Canada: Oxford University Press.
Pasek, J., Kenski, K., Romer, D., & Jamieson, K. H. (2006). America’s youth and
community engagement: How use of mass media is related to civic activity and
political awareness in 14- to 22-year-olds. Communication Research, 33(3), 115–
135.
Plieninger, T., Dijks, S., Oteros-Rozas, E., & Bieling, C. (2013). Assessing, mapping,
and quantifying cultural ecosystem services at community level. Land Use Policy,
33, 118-129.
Plottu, E., & Plottu, B. (2012). Total landscape values: A multi- dimensional approach.
Journal of Environmental Planning and Management, 55(6), 797-811.
Pollon, E. K., & Matheson, S. S. (2003). This was our valley. Canada: Deselig
Enterprises.
Quintelier, E., & Vissers, S. (2008). The effect of Internet use on political participation:
An analysis of survey results for 16-year-olds in Belgium. Social Science Computer
Review, 26(4), 411–427.
Raymond, C., & Brown, G. (2007a). A Method for assessing protected area allocations
using a typology of landscape values. Journal of Environmental Planning and
Management, 49(6), 797-812.
Raymond, C., & Brown, G. (2007b). A spatial method for assessing resident and visitor
attitudes towards tourism growth and development. Journal of Sustainable Tourism,
15(5), 520-540.
114
Reed, P., & Brown, G. (2003) Values suitability analysis: A methodology for identifying
and integrating public perceptions of ecosystem values in forest planning. Journal
of Environmental Planning and Management, 46(5), 643-658.
Richards, D. R., & Friess, D. A. (2015). A rapid indicator of cultural ecosystem service
usage at a fine spatial scale: Content analysis of social media photographs.
Ecological Indicators, 53, 187-195.
Rolston, H., & Coufal, J. (1991). A forest ethic and multivalue forest management.
Journal of Forestry, 89(1), 35-40.
Sauer, U., & Fischer, A. (2010). Willingness to pay, attitudes and fundamental values —
On the cognitive context of public preferences for diversity in agricultural
landscapes. Ecological Economics, 70, 1-9.
scott_neo. (2015, April 11). [#mypeaceriver] [Instagram photography]. Retrieved from
https://www.instagram.com/p/1Wx9fFncjX/
Sherren, K., Beckley, T. M., Parkins, J. R., Stedman, R. C., Keilty, K., Morin, I. (2016).
Learning (or living) to love the landscapes of hydroelectricity in Canada: Eliciting
local perspectives on the Mactaquac Dam via headpond boat tours. Energy
Research & Social Science, 14, 102-110.
Sherren, K., Fischer, J., & Price, R. (2010). Using photography to elicit grazier values
and management practices relating to tree survival and recruitment. Land Use
Policy, 27, 1056-1067.
Sloam, J. (2012). “Rejuvenating democracy?” Young people and the “Big Society”
Project. Parliamentary Affairs, 65, 90–114.
Soini, K., Vaarala, H., & Pouta, E. (2012). Residents’ sense of place and landscape
perceptions at the rural–urban interface. Landscape and Urban Planning, 104(1),
124–134.
Spirn, A. W. (1998). The language of landscape. New Haven and London, CO: Yale
University Press.
Statista. (2015). Number of monthly active Instagram users from January 2013 to
September 2015 (in millions) [Data]. Retrieved from
115
http://www.statista.com/statistics/253577/number-of-monthly-active-instagram-
users/
Statistics Canada. (2006). Canadian internet use survey: 2005 [electronic version].
Retrieved from www.statcan.ca/Daily/English/060815/d060815.pdf.
Statistics Canada. (2011). Canadian census profile: 2011 [Data file]. Retrieved April 29,
2016, from https://www12.statcan.gc.ca/census-recensement/2011/dp-
pd/prof/details/download-telecharger/comprehensive/comp-csv-tab-dwnld-
tlchrgr.cfm?Lang=E#tabs2011.
Stedman, R. C., Lathrop, R. C., Clark, B., Ejsmont-Karabin, J., Kasprzak, P., Nielsen, K.,
Osgood, D., Powell, M., Ventelä, A., Webster, A. E., & Zhukova, A. (2007).
Perceived environmental quality and place attachment in North American and
European temperate lake districts. Lake and Reservoir Management, 23(4), 330-344.
Taylor, J. G., Zube, E. H., & Sell, J. L. (1987). Landscape assessment and perception
research methods. In R. Bechtel, R. Marans, & W. Michaelson (Eds.), Methods in
environment and behavioral research (pp. 361-393). New York, NY: Van Nostrans
Reinhold.
Tenerelli, P., Demšar, U., & Luque, S. (2016). Crowdsourcing indicators for cultural
ecosystem services: A geographically weighted approach for mountain landscapes.
Ecological Indicators, 64, 237-248.
Thomas, D. R. (2006). A general inductive approach for analyzing qualitative evaluation
data. American Journal of Evaluation, 27(2), 237-246.
Tuan, Y. (1974). Topophilia: A study of environmental perception, attitudes, and values.
Englewood Cliffs, NJ: Prentice-Hall Inc.
Tuan, Y. (1979). Thought and landscape: The eye and the mind’s eye. In D. W. Meinig
(Ed.), The interpretation of ordinary landscapes (pp. 89-102). New York, NY:
Oxford University Press.
Vouligny, E., Domon, G., & Ruiz, J. (2009). An assessment of ordinary landscapes by
expert and by its residents: Landscape values in areas of intensive agricultural use.
Land Use Policy, 26, 890-900.

116
Zhu, X., Pfueller, S., Whitelaw, P., & Winter, C. (2010). Spatial differentiation of
landscape values in the Murray River region of Victoria, Australia. Environmental
Management, 45, 896-911.
Zube, E. H. (1987). Perceived land use patterns and landscape values. Landscape
Ecology, 1(1), 37-45.
117
Chapter 4 Conclusion
Around hydroelectricity landscapes, this thesis explored how young people perceive the
landscape around sites of past or future hydroelectricity development: how did they see,
use, and value the landscape? Chapter 2 asked how youth perceived the current
landscape in terms of the physical features, activities, and landscape values. We coded
the photos and captions collected from Instagram by geo-tags within two study areas,
and calculated the relationships to find significant connections among different
categories of features, activities, and values. Based on the results, we built conceptual
diagrams to show aggregate landscape perceptions: how features were perceived by the
photographers, what activities they did in the landscape, and how the features and
activities facilitated the formation of values. These allowed for explorations of how the
modification of specific features (e.g. water bodies and adjacent areas) would impact
lifestyles and values. Moreover, since each of the Instagram posts we collected contained
a geographic coordinate, we mapped the spatial patterns of the landscape values in
Chapter 3. This thesis aims not only to understand how and why people conceptually
perceive the landscape as a lived place, but where those concepts are anchored.
Specifically, which places are most rich in landscape meanings and values, and do the
photos help us to understand why? Methodologically, using social media data, we had to
be cautious about the validity of the large volume of data for specific purposes. For
Chapter 2 we simply had to remove photographs where landscape did not comprise a
significant part of the frame. In Chapter 3, we built a multi-stage filtering model to select
posts where photo content matched geographic information. After data filtering, we
118
imported the geo-tags and landscape value coding results into ArcGIS 10.2.2 to conduct
kernel density estimation and generate hot-spots of landscape values. These density maps
show the different spatial patterns of the six values as perceived in the research areas.
The results from Chapter 2 indicate that river (reservoir), mountain, and riparian
land were perceived as important landscape features in both study areas. These three
things were often viewed together largely because they had great likelihood of co-
occurring in the same photos. This feature cluster had a significant association with
landscape aesthetic values in the Site C area, where people valued the landscape more
often from the visual perspective. This might be explained by the fact that the Site C area
is more remote and less densely settled so that Instagram photographers had fewer social
and cultural ties with the landscape. In the photo captions, people linked their Peace
River, Peace Valley, or British Columbia identity with the aesthetics of the current
landscape. Thus, it is reasonable to foresee that if the Site C dam is completed, the
natural river and riparian land would be significantly affected, which would most
negatively impact the aesthetic value and thus identity. In addition, property loss,
including farmland and low-lying houses, would undermine the local sense of home and
sense of place. In Mactaquac, none of the options for the dam future will cause
significant or long-term displacement or relocation as the dam is already in place. For the
residents in that area, under the scenario of dam removal, their sense of home or of place
might be influenced by the changing view during and after river restoration. The story in
Mactaquac was different from that of Site C, however, because the key value in the
former lies in lifestyle, not simply aesthetics. The reservoir is important not only from
the aesthetic perspective, but for how locals use the water body and how they have
formed their lifestyle around it. We identified many posts showing the river view and
119
their recreational activities in the water, accompanied with hashtags like “#riverlife” or
“#lakelife”. Photos of summer scenes were even uploaded in the winter time to reminisce
about summer time when they could view the running water and do more outdoor
activities. Thus, to keep the Mactaquac dam and its headpond would be the most
preferred local option from the landscape perspective, whether it is done to produce
power or not. To remove the dam would likely cause stress and difficulty for people to
accept the new landscape in the future.
Chapter 3 was partly based on the work in Chapter 2. After understanding the
general landscape perceptions at each site, we continued on to explore the spatial patterns
of landscape values to see whether the landscape in different places would facilitate
people to perceive it as valuable in different dimensions, especially in social and cultural
contexts. The hot-spots of the six landscape values generated by kernel density
estimation show that different values did occur in different places. Values overlapped
mostly in town areas and landscape viewpoints in both study areas. Sense of home and
community attachment were more concentrated in towns where people lived and
connected with each other. However, aesthetics and lifestyle expanded to outskirts and
landscape viewpoints far from human settlements. Generally, to support local landscape
values, decision-makers should carefully consider the potential conflicts in areas with
high concentrated value or multiple values. According to the results in Chapter 2, in the
Site C area, places with high aesthetics should be given more attention by decision
makers, as should the areas with high lifestyle value in Mactaquac.
Another methodological exploration in this thesis was whether and how social
media data can contribute to landscape studies, overcome the drawbacks in conventional
approaches, and fill the gap of youth participation. In Chapter 2, we discussed the
120
effectiveness of capturing young people’s voices through social media, as well as of
analyzing Instagram photos and text-based captions to understand their landscape
perceptions. Generally, the cost of collecting social media data as secondary data is lower
than conventional approaches, and the data volume can be quite considerable. In addition,
there is less influence from the researchers if using social media data because the photos
were not taken for research purpose nor were the information in captions facilitated by
survey questions or the conversations with researchers. However, drawbacks exist as
well. Manual work is substantial while ensuring the precision of a large volume of social
media data. Demographic biases of social media participation, internet access and
information literacy may affect the results. The different ways that people use a given
social media platform, and the careful grooming of self-image through such venues, may
also affect its use as a research tool.
In conclusion, the methods we applied to use Instagram posts to understand
people’s landscape perceptions and the spatial patterns of landscape values in
hydroelectricity study areas were effective, while presenting new opportunities for
research. The results reveal stories that ring true and can inform decision makers about
the current hydropower proposals in the study areas. In the future, more work is
recommended in two directions: 1) how to exploit more social media sites and establish
automatic analysis model, particularly for image-based data; and 2) whether and how
physical landscape features or activities can facilitate formation of particular landscape
values, whether based on the images themselves or drawing on base data from other
sources.
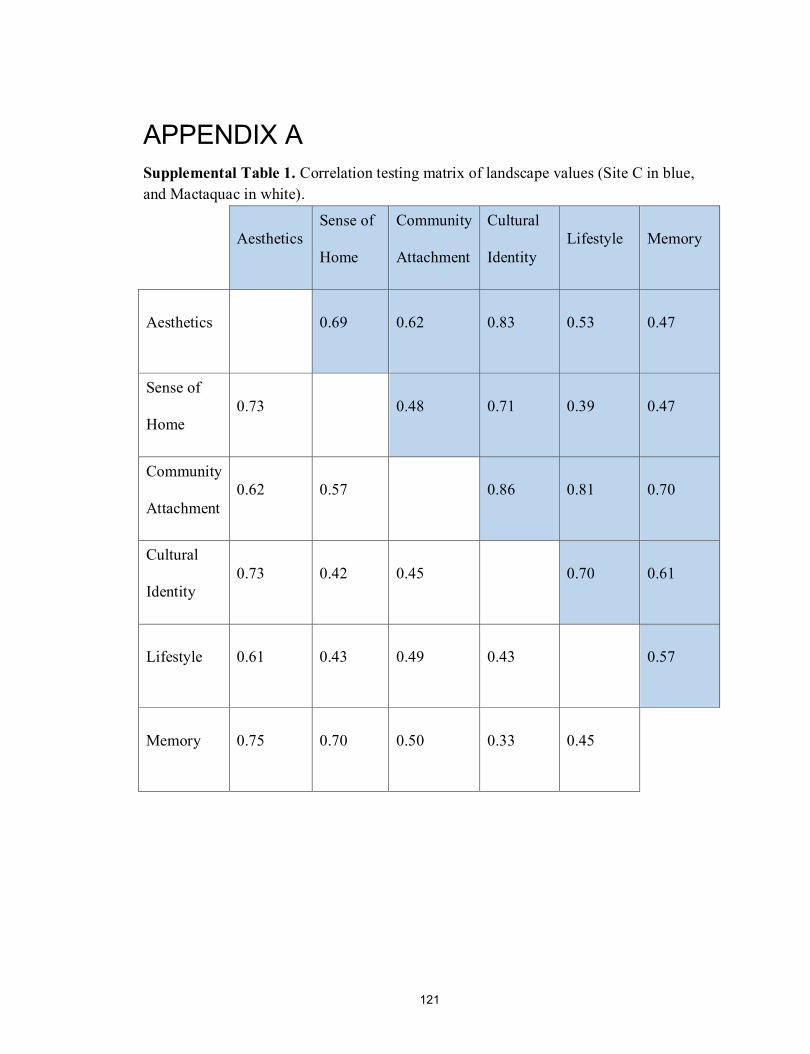
121
APPENDIX A
Supplemental Table 1. Correlation testing matrix of landscape values (Site C in blue,
and Mactaquac in white).
Aesthetics
Sense of
Home
Community
Attachment
Cultural
Identity
Lifestyle Memory
Aesthetics 0.69 0.62 0.83 0.53 0.47
Sense of
Home
0.73 0.48 0.71 0.39 0.47
Community
Attachment
0.62 0.57 0.86 0.81 0.70
Cultural
Identity
0.73 0.42 0.45 0.70 0.61
Lifestyle 0.61 0.43 0.49 0.43 0.57
Memory 0.75 0.70 0.50 0.33 0.45
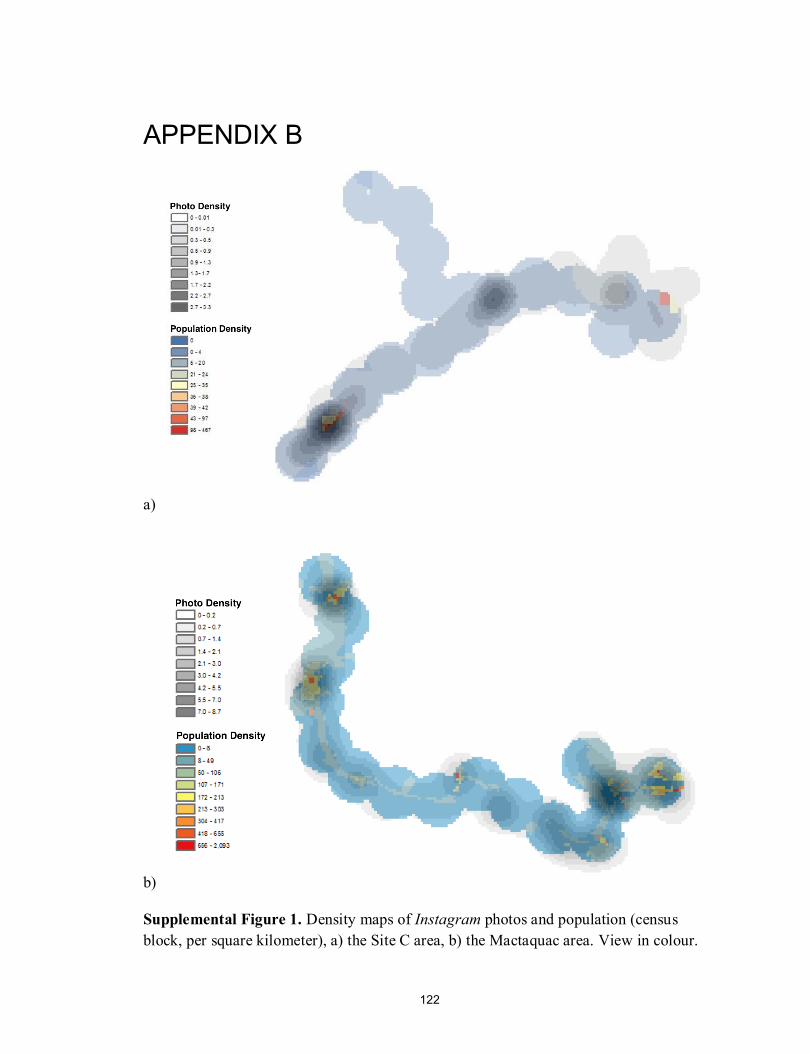
122
APPENDIX B
a)
b)
Supplemental Figure 1. Density maps of Instagram photos and population (census
block, per square kilometer), a) the Site C area, b) the Mactaquac area. View in colour.
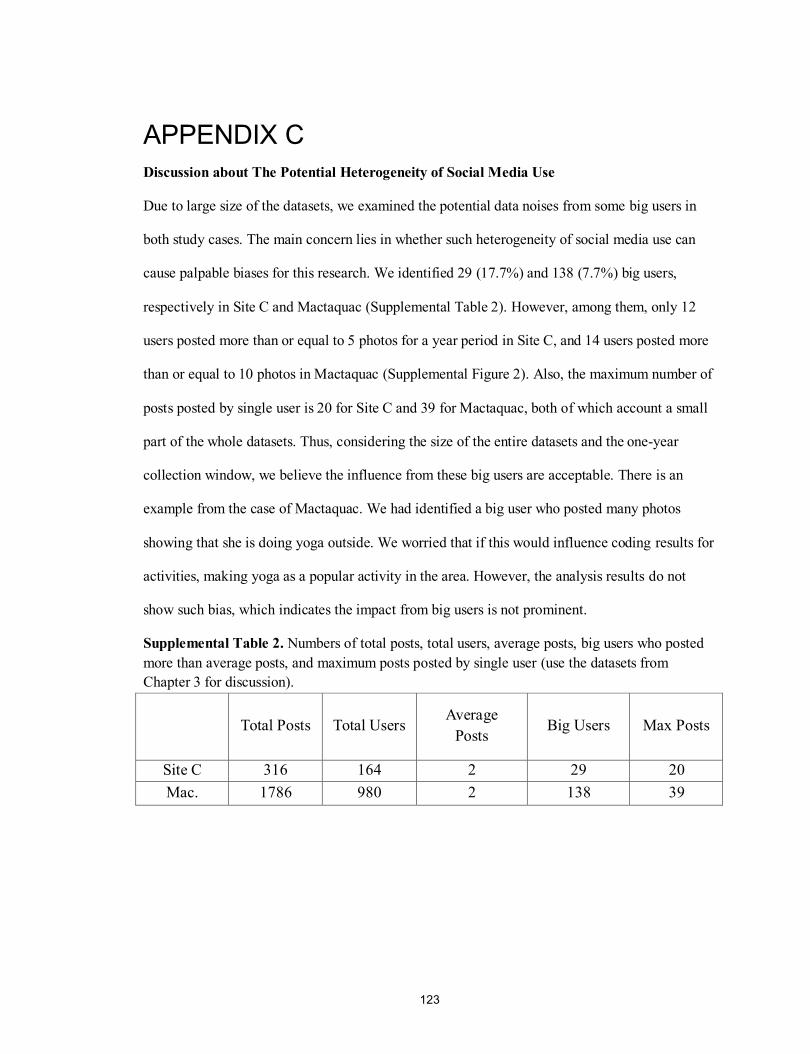
123
APPENDIX C
Discussion about The Potential Heterogeneity of Social Media Use
Due to large size of the datasets, we examined the potential data noises from some big users in
both study cases. The main concern lies in whether such heterogeneity of social media use can
cause palpable biases for this research. We identified 29 (17.7%) and 138 (7.7%) big users,
respectively in Site C and Mactaquac (Supplemental Table 2). However, among them, only 12
users posted more than or equal to 5 photos for a year period in Site C, and 14 users posted more
than or equal to 10 photos in Mactaquac (Supplemental Figure 2). Also, the maximum number of
posts posted by single user is 20 for Site C and 39 for Mactaquac, both of which account a small
part of the whole datasets. Thus, considering the size of the entire datasets and the one-year
collection window, we believe the influence from these big users are acceptable. There is an
example from the case of Mactaquac. We had identified a big user who posted many photos
showing that she is doing yoga outside. We worried that if this would influence coding results for
activities, making yoga as a popular activity in the area. However, the analysis results do not
show such bias, which indicates the impact from big users is not prominent.
Supplemental Table 2. Numbers of total posts, total users, average posts, big users who posted
more than average posts, and maximum posts posted by single user (use the datasets from
Chapter 3 for discussion).
Total Posts Total Users Average
Posts Big Users Max Posts
Site C 316 164 2 29 20
Mac. 1786 980 2 138 39
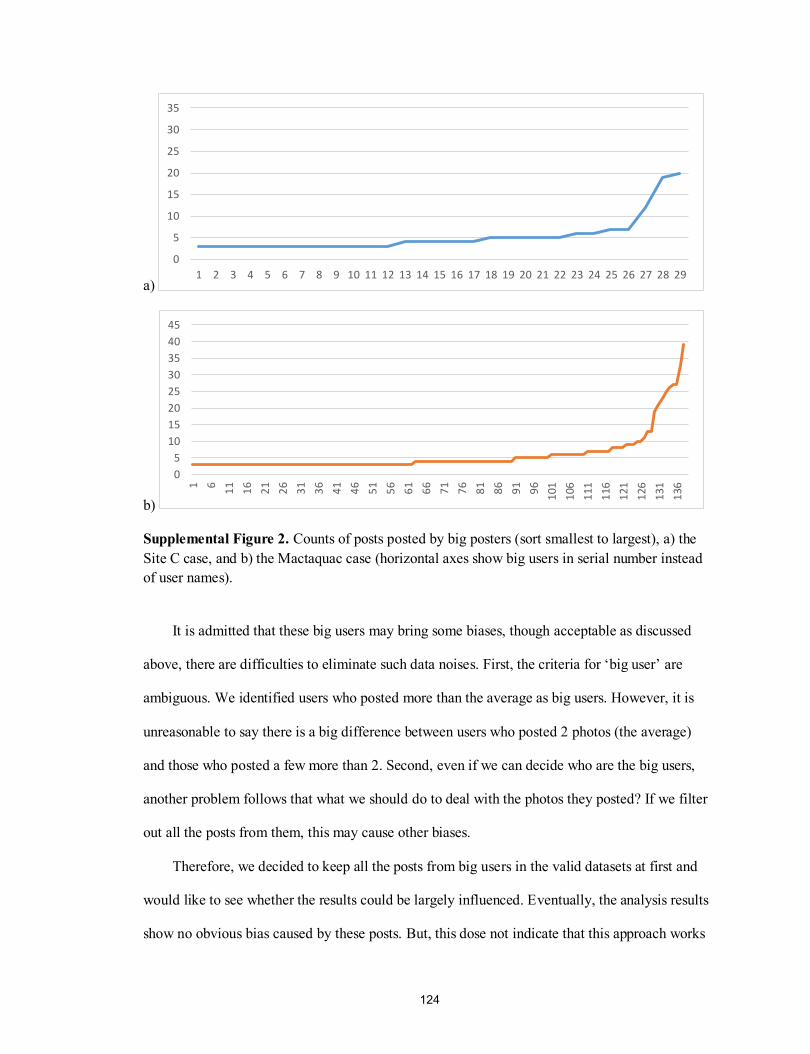
124
a)
b)
Supplemental Figure 2. Counts of posts posted by big posters (sort smallest to largest), a) the
Site C case, and b) the Mactaquac case (horizontal axes show big users in serial number instead
of user names).
It is admitted that these big users may bring some biases, though acceptable as discussed
above, there are difficulties to eliminate such data noises. First, the criteria for ‘big user’ are
ambiguous. We identified users who posted more than the average as big users. However, it is
unreasonable to say there is a big difference between users who posted 2 photos (the average)
and those who posted a few more than 2. Second, even if we can decide who are the big users,
another problem follows that what we should do to deal with the photos they posted? If we filter
out all the posts from them, this may cause other biases.
Therefore, we decided to keep all the posts from big users in the valid datasets at first and
would like to see whether the results could be largely influenced. Eventually, the analysis results
show no obvious bias caused by these posts. But, this dose not indicate that this approach works
0
5
10
15
20
25
30
35
1 2 3 4 5 6 7 8 9 10 11 12 13 14 15 16 17 18 19 20 21 22 23 24 25 26 27 28 29
0
5
10
15
20
25
30
35
40
45
1 6
11
16
21
26
31
36
41
46
51
56
61
66
71
76
81
86
91
96
101
106
111
116
121
126
131
136

125
for every case. On the contrary, we suggest that potential heterogeneity of social media use
should be carefully examined case by case.
126
BIBLIOGRAPHY
abbygailxo. (2015, February 19). [Summer sunsets are the best] [Instagram photography].
Retrieved from http://instagram.com/p/zTQZwKnwUM/
Aggestam, F. (2014). Wetland restoration and the involvement of stakeholders: An
analysis based on value-perspectives. Landscape Research, 39(6), 680-697.
Alessa, L., Kliskey, A., & Brown, G. (2008). Social–ecological hot-spots mapping: A
spatial approach for identifying coupled social–ecological space. Landscape and
Urban Planning, 85, 27-39.
Ambrose, P. (1969). Analytical human geography: A collection and interpretation of
some recent work. New York, NY: American Elsevier Publishing Company, INC.
Amnesty International. (2016). The point of no return: The human rights of indigenous
people in Canada threatened by the Site C Dam. Retrieved from
http://www.amnesty.ca/sites/amnesty/files/Canada%20Site%20C%20Report.pdf
ashleyjsprague. (2015, May 29). [First day of summer vacation 2015 #maternityleave
#mactaquac #livingthelife] [Instagram photography]. Retrieved from
https://instagram.com/p/3SAlickfAj/
Atkins, P., Simmons, I., & Roberts, B. (1998). People, land & time: An historical
introduction to the relations between landscape, cultural and environment. New
York, NY: Oxford University Press Inc.
Autry, M. K., & Kelly, A. R. (2012). Merging Duke Energy and Progress Energy: Online
public discourse, post-Fukushima reactions, and the absence of environmental
communication. Environmental Communication: A Journal of Nature and Culture,
6(2), 278–284.
Bourassa, S.C. (1990). A paradigm for landscape aesthetics. Environment and Behavior,
22(6), 787-812.
Barry, S. J. (2014). Using social media to discover public values, interests, and
perceptions about cattle grazing on park lands. Environmental Management, 53(2),
454–464.
BC Hydro, & Power Authority British Columbia. (2014, May 1). Report of the Joint
Review Panel: Site C clean energy project. Retrieved from http://www.ceaa-
acee.gc.ca/050/documents/p63919/99173E.pdf
127
BC Hydro. (n.d.). Site C clean energy project. The official website of BC Hydro.
Retrieved from https://www.bchydro.com/energy-in-bc/projects/site_c.html
BC Hydro. (2015, July 22). Construction notification letter. The official website of BC
Hydro. Retrieved from https://www.sitecproject.com/construction-notification-letter
Beckley, T. M., Stedman, R. C., Wallace, S. M., & Ambard, M. (2007). Snapshots of
what matters most: Using resident-employed photography to articulate attachment
to place. Society & Natural Resources, 20(10), 913-929.
beckysue100. (2015, June 28). [#beautifulBC #mypeaceriver drive out to #HudsonsHope
lookout @mypeaceriver] [Instagram photography]. Retrieved from
https://instagram.com/p/4fZN3zG_Q4/
Bergeron, J., Paquette, S., & Poullaouec-Gonidec, P. (2014). Uncovering landscape
values and micro-geographies of meanings with the go-along method. Landscape
and Urban Planning, 122, 108-121.
Bernáldez, F., 1985. Invitación a la ecología humana. La adaptación afectiva al entorno.
Tecnos S. A, Madrid.
Besser, D. T., Mclain, R., Cerveny, L., Biedenweg, K., & Banis, D. (2014). Mapping
landscape values: Issues, challenges and lessons learned from field work on the
Olympic Peninsula, Washington. Environmental Practice, 16(2), 139-150.
Beverly, J. L., Uto, K., Wikes, J., & Bothwell, P. (2008). Assessing spatial attributes of
forest landscape values: an internet-based participatory mapping approach.
Canadian Journal of Forest Research, 38, 289-303.
bobinster10. (2015, February 23). [Beauty day. #Peace Valley #Peace River #beautiful
#scenery #lovethis #sunshine #instagood #instagreat #doubletap #perf #home
#myfave] [Instagram photography]. Retrieved from
https://instagram.com/p/zdOszrHUgP/
Brown, G. (2006). Mapping landscape values and development preferences: A method
for tourism and residential development planning. International Journal of Tourism
Research, 8, 101-113.
Brown, G., & Brabyn, L. (2012). An analysis of the relationships between multiple
values and physical landscapes at a regional scale using public participation GIS
and landscape character classification. Landscape and Urban Planning, 107, 317-
331.
128
Brown, G., & Donovan, S. (2014). Measuring change in place values for environmental
and natural resource planning using public participation GIS (PPGIS): Results and
challenges for longitudinal research. Society & Natural Resources, 27(1), 36-54.
Brown, G., & Raymond, C. (2007). The relationship between place attachment and
landscape values: Toward mapping place attachment. Applied Geography, 27, 89-
111.
Brown, G., & Reed, P. (2000). Validation of a forest values typology for use in national
forest planning. Forest Science, 46(2), 240-247.
Brown, G., & Reed, P. (2012). Social landscape metrics: Measures for understanding
place values from public participation geographic information systems (PPGIS).
Landscape Research, 37(1), 73-90.
Brown, G., Smith, C., Alessa, L., & Kliskey, A. (2004). A comparison of perceptions of
biological value with scientific assessment of biological importance. Applied
Geography, 24, 161-180.
Brown, G., & Weber, D. (2012). Measuring change in place values using public
participation GIS (PPGIS). Applied Geography, 34, 316-324.
Brown, G., Weber, D., & de Bie, K. (2014). Assessing the value of public lands using
public participation GIS (PPGIS) and social landscape metrics. Applied Geography,
53, 77-89.
Butler, A. (2016). Dynamics of integrating landscape values in landscape character
assessment: The hidden dominance of the objective outsider. Landscape Research,
41(2), 239-252.
Butler, A., & Berglund, U. (2014). Landscape character assessment as an approach to
understanding public interests within the European Landscape Convention.
Landscape Research, 39(3), 219-236.
Cabral, J. (2011). Is Generation Y addicted to social media? The Elon Journal of
Undergraduate Research in Communications, 2(1), 5–14.
Canada NewsWire. (2003, November 17). Canada’s car confessions – singing, flirting
and even loving [web news]. Retrieved from
https://global.factiva.com/ha/default.aspx#./!?&_suid=14586732973210481223954
8034769
129
Canadian Rivers Institute. (2011). The Saint John River: A state of the environment
report. Retrieved from
http://www.unb.ca/research/institutes/cri/_resources/pdfs/criday2011/cri_sjr_soe_fi
nal.pd f
Carlson, A. (2012). Aesthetic appreciation of nature and environmentalism. In B.
Williston (Ed.), Environmental Ethics for Canadians (pp. 189-196). Canada: Oxford
University Press.
Charney, T., & Greenberg, B. S. (2002). Uses and gratifications of the Internet. In C. A.
Lin & D. J. Atkin (Eds.), Communication technology and society: Audience
adoption and uses (pp. 379–407). Cresskill, NJ: Hampton Press Inc.
Checkoway, B., Allison, T., & Montoya, C. (2005). Youth participation in public policy
at the municipal level. Children and Youth Services Review, 27(10), 1149–1162.
Chen, G., Powers, R. P., de Carvalho, L. M. T., & Mora, B. (2015). Spatiotemporal
patterns of tropical deforestation and forest degradation in response to the operation
of the Tucuruí hydroelectric dam in the Amazon basin. Applied Geography, 63, 1-8.
Chen, Y. (2015, August). Public Discourse on Twitter and Instagram: The Mactaquac
Dam, New Brunswick, and the Site C Dam Proposal, British Columbia.
Unpublished report, Dalhousie University, Halifax, NS. URL:
http://energytransitions.ca/wp-content/uploads/2015/08/Twitter-Instagram-
Mactaquac-Site-C-Report.pdf
Collignon, B. (2001). Esprit des lieux et modèles culturels. La mutation des espaces
domestiques en arctique inuit. Annales de Géographie, 110(620), 383-404.
Collins, D., & Kearns, R. (2010). “It’s a gestalt experience”: Landscape values and
development pressure in Hawke’s Bay, New Zealand. Geoforum, 41, 435-446.
Corscadden, K. et al. (2016, May). Energy projects, social license, public acceptance
and regulatory systems in Canada: A white paper. Retrieved from
https://www.researchgate.net/publication/303446533
Council of Europe (CoE). (2000). European Landscape Convention. CETS No. 176.
(Florence and Strasbourg: Council of Europe).
Crewsswell, T. (2015). Place: An introduction – second edition. West Sussex, UK: John
Wiley & Sons Ltd.
Dachary-Bernard, J., & Rambonilaza, T. (2012). Choice experiment, multiple
programmes contingent valuation and landscape preferences: How can we support
the land use decision making process? Land Use Policy, 29, 846-854.

130
Dakin, S. (2003). There’s more to landscape than meets the eye: Towards inclusive
landscape assessment in resource and environmental management. The Canadian
Geographer, 47(2), 185-200.
Dalhousie University. (2013). Dalhousie University Fair Dealing Policy. Retrieved from
http://libraries.dal.ca/content/dam/dalhousie/pdf/copyrightoffice/Dalhousie-
University-Fair-Dealing-Policy-2013.pdf
Daniel, T. C. (2001). Whither scenic beauty? Visual landscape quality assessment in the
21st century. Landscape and Urban Planning, 54, 267-281.
darcysargeson. (2015, July 28). [My backyard #peaceful]. Retrieved from
https://instagram.com/p/5srE6Nxnx2/
darcysargeson. (2015, September 5). [#Riverlife]. Retrieved from
https://www.instagram.com/p/7RGRUxxn1K/
Delli Carpini, M. X. (2000). Gen.com: Youth, civic engagement, and the new
information environment. Political Communication, 17(4), 341–349.
De Meo, I., Ferretti, F., Frattegiani, M., Lora, C., & Paletto, A. (2013). Public
participation GIS to support a bottom-up approach in forest landscape planning.
iForest, 6, 347-352.
de Vries, S., Buijs, A. E., Langers, F., Farjon, H., van Hinsberg, A., & Sijtsma, F. J.
(2016). Measuring the attractiveness of Dutch landscapes: Identifying national hot-
spots of highly valued places using Google Maps. Applied Geography, 45, 220-229.
Devine-Wright, P. (2009). Rethinking NIMBYism: The role of place attachment and
place identity in explaining place-protective action. Journal of Community &
Applied Social Psychology, 19, 426-441.
dirtfae. (2015, July 10). [chilling on the river w/ @pickles_thehedgehog] [Instagram
photography]. Retrieved from https://instagram.com/p/49nHMkH4gX/
Duggan, M., & Smith, A. (2013, December 30). Social Media Update 2013. Pew
Research Center. Retrieved from http://www.pewinternet.org/2013/12/30/social-
media-update-2013/
Duggan, M. (2015, August 19). Mobile messaging and social media 2015. Pew Research
Center. Retrieved from http://www.pewinternet.org/2015/08/19/mobile-messaging-
and-social-media-2015/
131
Duncan, J. S., & Lambert, D. (2004). Landscapes of home. In J. S. Duncan, N. C.
Johnson, & R. H. Schein (Eds.), A companion to cultural geography (pp. 382-403).
Malden, MA: Blackwell Publishing.
Dupont, L., Antrop, M., & Van Eetvelde, V. (2014). Eye-tracking analysis in landscape
perception research: Influence of photograph properties and landscape
characteristics. Landscape Research, 39(4), 417-432.
Environment and Natural Resources Canada. (2016a). Canadian Climate Normals 1981-
2010: Fort St. John A [Data file]. Retrieved October 31, 2016, from
http://climate.weather.gc.ca/climate_normals/results_1981_2010_e.html?searchTyp
e=stnProx&txtRadius=25&selCity=&selPark=&optProxType=custom&txtCentralL
atDeg=56&txtCentralLatMin=11&txtCentralLatSec=57&txtCentralLongDeg=120&
txtCentralLongMin=55&txtCentralLongSec=14&stnID=1413&dispBack=0
Environment and Natural Resources Canada. (2016b). Canadian Climate Normals 1981-
2010: Mactaquac Prov Park [Data file]. Retrieved October 31, 2016, from
http://climate.weather.gc.ca/climate_normals/results_1981_2010_e.html?searchTyp
e=stnProx&txtRadius=25&optProxType=city&selCity=45%7C58%7C66%7C39%7
CFredericton&selPark=&txtCentralLatDeg=&txtCentralLatMin=0&txtCentralLatSe
c=0&txtCentralLongDeg=&txtCentralLongMin=0&txtCentralLongSec=0&stnID=6
194&dispBack=0
Fearnside, P. M. (2014). Impacts of Brazil’s Madeira River Dams: Unlearned lessons for
hydroelectric development in Amazonia. Environmental Science & Policy, 38, 164-
172.
Filova, L., Vojar, J., Svobodova, L., & Sklenicka, P. (2015): The effect of landscape type
and landscape elements on public visual preferences: Ways to use knowledge in the
context of landscape planning. Journal of Environmental Planning and
Management, 58(11), 2037-2055.
Fox, C. A., Magilligan, F. J., & Sneddon, C. S. (2016). “You kill the dam, you are killing
a part of me”: Dam removal and the environmental politics of river restoration.
Geoforum, 70, 93-104.
Gomez-Sal, A., Belmontes, J. A., & Nicolau, J. M. (2003). Assessing landscape values:
A proposal for a multidimensional conceptual model. Ecological Modelling, 168,
319-341.
Greider, T., & Garkovich, L. (1994). Landscape: The social construction of nature and
the environment. Rural Sociology, 59(1), 1-24.
132
Hanley, N., Colombo, S., Kristrom, B., & Watson, F. (2009). Accounting for negative,
zero and positive willingness to pay for landscape change in national park. Journal
of Agricultural Economics, 60(1), 1-16.
Henningsson, M., Blicharska, M., Antonson, H., Mikusinski, G., Goransson, G.,
Angelstam, P., Folkeson, L., & Jonsson, S. (2015). Perceived landscape values and
public participation in a road-planning process – a case study in Sweden. Journal of
Environmental Planning and Management, 58(4), 631-653.
Hough, M. (1990). Out of place: Restoring identity to the regional landscape. New
Haven and London, CO: Yale University Press.
Hsieh, H., & Shannon, S. E. (2005). Three approaches to qualitative content analysis.
Qualitative Health Research, 15(9), 1277-1288.
Hume, M. (2014, February 9). Site C Dam protesters preparing to descend on Victoria.
The Globe and Mail. Retrieved from http://www.theglobeandmail.com/news/british-
columbia/site-c-dam-protesters-preparing-to-descend-on-victoria/article16770754/
Hunt, D. S., Lin, C. A., & Atkin, D. J. (2014). Photo-messaging: Adopter attributes,
technology factors and use motives. Computers in Human Behavior, 40, 171-179.
Hunziker, M. (1995). The spontaneous reafforestation in abandoned agricultural lands:
Perception and aesthetic assessment by locals and tourists. Landscape and Urban
Planning, 31, 399-410.
Instagram. (2016). Terms of Use. Retrieved from
https://help.instagram.com/478745558852511/?helpref=hc_fnav
Jacobsen, J. K. S. (2007). Use of landscape perception methods in tourism studies: A
review of photo-based research approaches. Tourism Geographies, 9(3), 234-253.
Jacques Whitford Environment Limited. (2004). Final comprehensive study report: New
route 2 Trans-Canada highway project Perth-Andover to Woodstock New
Brunswick. Retrieved from http://ceaa-acee.gc.ca/94D3062E-F7AC-4546-9811-
DF68BCB48B79/6- 8_e.pdf
Joseph, A. J., Tandon, N., Yang, L. H., Duckworth, K., Torous, J., Seidman, L. J., &
Keshavan, M. S. (2015). #Schizophrenia: Use and misuse on Twitter. Schizophrenia
Research. Retrieved from http://doi.org/10.1016/j.schres.2015.04.009
Kaplan, R., & Kaplan, S. (1989). The experience of nature: A psychological perspective.
New York, NY: Cambridge University Press.
133
Kaplan, R., Kaplan, S., & Ryan, R. L. (1998). With people in mind: Design and
management of everyday nature. Washington, DC: Island Press.
Kaplan, S., & Kaplan, R. (2009). Creating a larger role for environmental psychology:
The Reasonable Person Model as an integrative framework. Journal of
Environmental Psychology, 29, 329-339.
Karl, F. (2014). White Gold: Hydroelectric power in Canada. Vancouver, Canada: UBC
Press.
Kaymaz, I. C. (2012). Landscape Perception. In Ozyavuz M. (Ed.), Landscape Planning
(pp. 251-276). InTech, DOI: 10.5772/38998. Available from:
http://www.intechopen.com/books/landscape-planning/landscape-perception
Keating, R. (2012). Landscape aesthetics in practice. Journal of Visual Art Practice,
11(1), 15–25.
Keilty, K., Beckley, T. M., Sherren, K. (2016). Landscape acceptability and generational
change on the Mactaquac hydroelectric dam headpond, New Brunswick, Canada.
Geoforum, 75, 234-248.
Kirilenko, A. P., & Stepchenkova, S. O. (2014). Public microblogging on climate change:
One year of Twitter worldwide. Global Environmental Change, 26, 171–182.
Kyle, G. T., Jun, J., & Absher, J. D. (2014). Repositioning identity in conceptualizations
of human-place bonding. Environment and Behavior, 46(8), 1018-1043.
Lenhart, A., Madden, M., Smith, A., & Macgill, A. (2007, December 19). Teens and
social media. Pew Research Center. Retrieved from
http://www.pewinternet.org/2007/12/19/teens-and-social-media/
Lawson, P. M., Farnsworth, G., & Hartley, M. A. (1985). The Nackawic Bend, 200 years
of history. Canada: Nackawic Town of Nackawic.
Lee, K. L. (1998). The Columbia River Basin: Experimenting with sustainability. In J. S.
Dryzek, and D. Schlosberg (Eds.), Debating the earth: The environmental politics
reader (pp. 96-109). New York, NY: Oxford University Press.
Li, X., & Stepchenkova, S. (2012). Chinese outbound tourists’ destination image of
America: Part I. Journal of Travel Research, 51(3), 250–266.
Litton, R.B, Jr. (1968). Forest landscape description and inventories - a basis for land
planning and design. Berkeley, Calif., Pacific SW. Forest and Range Exp. Sta. 64
pp., illus. (U. S. D. A. Forest Serv. Res. Paper PSW-49).
134
Lothian, A. (1999). Landscape and the philosophy of aesthetics: Is landscape quality
inherent in the landscape or in the eye of the beholder? Landscape and Urban
Planning, 44, 177-198.
Luckman, K., Lagemann, V., & Menzel, S. (2013). Landscape assessment and evaluation
of young people: Comparing nature-orientated habitat and engineered habitat
preferences. Environment and Behavior, 45(1), 86-112.
Martínez Pastur, G., Peri, P. L., Lencinas, M. V., García-Llorente, M., & Martín-López,
B. (2015). Spatial patterns of cultural ecosystem services provision in Southern
Patagonia. Landscape Ecology, 31(2), 383-399.
Matteucci, X. (2013). Photo elicitation: Exploring tourist experiences with researcher-
found images. Tourism Management, 35, 190-197.
Massey, D. (2005). Power-geometry and a progressive sense of place. In Bird, J., Curtis,
B., Putnam, T., Robertson, G., & Tickner, L. (Eds.), Mapping the futures: local
cultures, global change. New York, NY: Taylor & Francis e-Library.
Mccarthy, S. (2016, May 24). Ottawa pushes ahead with Site C dam amid opposition
from academics. The Globe and Mail. Retrieved from
http://www.theglobeandmail.com/news/british-columbia/royal-society-of-canada-
academics-call-on-ottawa-to-halt-site-c-project/article30127279/
Menarguez, A. B., & Holgado, P. M. (2014). Assessing the landscape value of public
works: Validation of the methods in the lowlands of the middle section of Tajo
River, Spain. Landscape Research, 39(3), 305-323.
Meinig, D. W. (1976). The beholding eye. In D. W. Meinig (Ed.), The interpretation of
ordinary landscapes (pp. 33-48). New York, NY: Oxford University Press.
michyday. (2015, July 31). [Jealous of my sweet picnic spot? #beautifulbc
#adventuresinthenorth #landofdinosaurs] [Instagram photography]. Retrieved from
https://instagram.com/p/50E1wPKdFr/
Million, M. L. (1992). “It was home”: A phenomenology of place and involuntary
displacement as illustrated by the forced dislocation of five Southern Alberta
families in the Oldman River Dam flood area [doctoral dissertation]. Saybrook
Graduate School and Research Centre, San Francisco.
Natural Resources Canada. (2001). [An outline map without names which shows only
Canada’s coastline and boundaries]. Retrieved August 27, 2016, from
http://www.nrcan.gc.ca/earth-sciences/geography/atlas-canada/reference-
maps/16846
135
Navratil, J., Picha, K., Knotek, J., Kucera, T., Navratilova, J., & Rajchard, J. (2013).
Tourismos: An International Multidisciplinary Journal of Tourism, 8(1), 35-51.
NB Power. (2014). Project Description- Mactaquac Project. Retrieved March 30, 2015,
from http://www.mactaquac.ca/project-description/
NB Power. (2016a, May 6). Update on studies exploring Mactaquac operations beyond
2030. Retrieved from http://www.mactaquac.ca/update-on-studies-exploring-
mactaquac-operations-beyond-2030/
NB Power. (2016b). What was said final report. Retrieved September 9, 2016 from
http://www.mactaquac.ca/wp-
content/uploads/2016/08/What_was_said_Report_Mactaquac.pdf
Netlytic [Online software]. (2016). Retrieved from https://netlytic.org/
Nielsen, A. B., Heyman, E., & Richnau, G. (2012). Liked, disliked and unseen forest
attributes: Relation to modes of viewing and cognitive constructs. Journal of
Environmental Management, 113, 456–66.
Netlytic. (2015). The introduction of Netlytic. Netlytic. Retrieved from
https://netlytic.org/home/
O’Connor, C., & Kelly, K. (2006). Auto theft and youth culture: A nexus of
masculinities, femininities and car culture. Journal of Youth Studies, 9(3), 247-267.
Panwar, S., Agrawal, D. K., Negi, G. C. S., Kanwal, K. S., Sharma, V., Lodhi, M. S.,
Singh, J., & Bhatt, V. (2010). Impact assessment of a hydroelectric project on the
flora in the Western Himalayan region based on vegetation analysis and socio-
economic studies. Journal of Environmental Planning and Management, 53(7),
907-923.
Park, N., Kee, K. F., & Valenzuela, S. (2009). Being immersed in social networking
environment: Facebook groups, uses and gratifications, and social outcomes. Cyber
Psychology & Behavior, 12(6), 729-733.
Park, N., Lee, S., & Kim, J. H. (2012). Individuals’ personal network characteristics and
patterns of Facebook use: A social network approach. Computers in Human
Behavior, 28(5), 1700–1707.
parkamus. (2015, January 29). [The Peace River #tbt #explorebc #greatnorthcollective]
[Instagram photography]. Retrieved from http://instagram.com/p/yclJV1uNae/
136
Parkhill, K. A., Butler, C., & Pidgeon, N. F. (2014) Landscapes of threat? Exploring
discourses of stigma around large energy developments. Landscape Research, 39(5),
566-582.
Parsons, G. (2012). Aesthetic Preservation. In B. Williston (Ed.), Environmental Ethics
for Canadians (pp. 205-211). Canada: Oxford University Press.
Pasek, J., Kenski, K., Romer, D., & Jamieson, K. H. (2006). America’s youth and
community engagement: How use of mass media is related to civic activity and
political awareness in 14- to 22-year-olds. Communication Research, 33(3), 115–
135.
Plieninger, T., Dijks, S., Oteros-Rozas, E., & Bieling, C. (2013). Assessing, mapping,
and quantifying cultural ecosystem services at community level. Land Use Policy,
33, 118-129.
Plottu, E., & Plottu, B. (2012). Total landscape values: A multi- dimensional approach.
Journal of Environmental Planning and Management, 55(6), 797-811.
Pollon, E. K., & Matheson, S. S. (2003). This was our valley. Canada: Deselig
Enterprises.
Quintelier, E., & Vissers, S. (2008). The effect of Internet use on political participation:
An analysis of survey results for 16-year-olds in Belgium. Social Science Computer
Review, 26(4), 411–427.
Raacke, J., & Bonds-Raacke, J. (2008). MySpace and Facebook: Applying the uses and
gratifications theory to exploring friend-networking sites. Cyberpsychology &
Behavior: The Impact of the Internet, Multimedia and Virtual Reality on Behavior
and Society, 11(2), 169–174.
Raymond, C., & Brown, G. (2007a). A Method for assessing protected area allocations
using a typology of landscape values. Journal of Environmental Planning and
Management, 49(6), 797-812.
Raymond, C., & Brown, G. (2007b). A spatial method for assessing resident and visitor
attitudes towards tourism growth and development. Journal of Sustainable Tourism,
15(5), 520-540.
Reed, P., & Brown, G. (2003) Values suitability analysis: A methodology for identifying
and integrating public perceptions of ecosystem values in forest planning. Journal
of Environmental Planning and Management, 46(5), 643-658.
137
Richards, D. R., & Friess, D. A. (2015). A rapid indicator of cultural ecosystem service
usage at a fine spatial scale: Content analysis of social media photographs.
Ecological Indicators, 53, 187-195.
Rolston, H., & Coufal, J. (1991). A forest ethic and multivalue forest management.
Journal of Forestry, 89(1), 35-40.
Sauer, C. R. (1974). The morphology of landscape. In J. Leighly (Ed.), Land and Life: A
selection from the writings of Carl Ortwin Sauer (pp. 315-350). Berkeley and Los
Angeles, CA: University of California Press.
Sauer, U., & Fischer, A. (2010). Willingness to pay, attitudes and fundamental values —
On the cognitive context of public preferences for diversity in agricultural
landscapes. Ecological Economics, 70, 1-9.
Scolozzi, R., Schirpke, U., Detassis, C., Abdullah, S., & Gretter, A. (2015). Mapping
alpine landscape values and related threats as perceived by tourists. Landscape
Research, 40(4), 451-465.
scott_neo. (2015, April 11). [#mypeaceriver] [Instagram photography]. Retrieved from
https://www.instagram.com/p/1Wx9fFncjX/
Sherren, K., Beckley, T. M., Parkins, J. R., Stedman, R. C., Keilty, K., Morin, I. (2016).
Learning (or living) to love the landscapes of hydroelectricity in Canada: Eliciting
local perspectives on the Mactaquac Dam via headpond boat tours. Energy
Research & Social Science, 14, 102-110.
Sherren, K., Fischer, J., & Price, R. (2010). Using photography to elicit grazier values
and management practices relating to tree survival and recruitment. Land Use
Policy, 27, 1056-1067.
Sherren, K., Greenland-Smith, S., Chen, Y., & Parkins, J. R. (2016, August). Mactaquac
and beyond: Citizen perspectives on energy issues in New Brunswick. Retrieved
from https://drive.google.com/file/d/0BxGBnBJ2924iU2h0OUFfRjRuRjQ/view
Sloam, J. (2012). “Rejuvenating democracy?” Young people and the “Big Society”
Project. Parliamentary Affairs, 65, 90–114.
Smith, A. (2014, November 3). Cell phones, social media and campaign 2014. Pew
Research Center. Retrieved from http://www.pewinternet.org/2014/11/03/cell-
phones-social-media-and-campaign-2014/
138
Soini, K., Vaarala, H., & Pouta, E. (2012). Residents’ sense of place and landscape
perceptions at the rural–urban interface. Landscape and Urban Planning, 104(1),
124–134.
Spirn, A. W. (1998). The language of landscape. New Haven and London, CO: Yale
University Press.
Statista. (2015). Number of monthly active Instagram users from January 2013 to
September 2015 (in millions) [Data]. Retrieved from
http://www.statista.com/statistics/253577/number-of-monthly-active-instagram-
users/
Statistics Canada. (2006). Canadian internet use survey: 2005 [electronic version].
Retrieved from www.statcan.ca/Daily/English/060815/d060815.pdf.
Statistics Canada. (2011). Canadian census profile: 2011 [Data file]. Retrieved April 29,
2016, from https://www12.statcan.gc.ca/census-recensement/2011/dp-
pd/prof/details/download-telecharger/comprehensive/comp-csv-tab-dwnld-
tlchrgr.cfm?Lang=E#tabs2011.
Stedman, R. C. (2003). Is it really just a social construction? The contribution of the
physical environment to sense of place. Society & Natural Resources, 16(8), 671–
685.
Stedman, R. C., Lathrop, R. C., Clark, B., Ejsmont-Karabin, J., Kasprzak, P., Nielsen, K.,
Osgood, D., Powell, M., Ventelä, A., Webster, A. E., & Zhukova, A. (2007).
Perceived environmental quality and place attachment in North American and
European temperate lake districts. Lake and Reservoir Management, 23(4), 330-344.
Stepchenkova, S., & Zhan, F. (2013). Visual destination images of Peru: Comparative
content analysis of DMO and user-generated photography. Tourism Management,
36, 590–601.
Taylor, J. G., Zube, E. H., & Sell, J. L. (1987). Landscape assessment and perception
research methods. In R. Bechtel, R. Marans, & W. Michaelson (Eds.), Methods in
environment and behavioral research (pp. 361-393). New York, NY: Van Nostrans
Reinhold.
Tenerelli, P., Demšar, U., & Luque, S. (2016). Crowdsourcing indicators for cultural
ecosystem services: A geographically weighted approach for mountain landscapes.
Ecological Indicators, 64, 237-248.
The World Commission on Dams. (2000). Dams and development: A new framework for
decision making. Retrieved from
http://www.unep.org/dams/WCD/report/WCD_DAMS%20report.pdf
139
Thomas, D. R. (2006). A general inductive approach for analyzing qualitative evaluation
data. American Journal of Evaluation, 27(2), 237-246.
Thwaites, K., & Simkins, I. (2007). Experiential landscape: An approach to people,
place and space. London, UK: Routledge.
Treaty 8 Tribal Association. (2015). Affiliated First Nations. Retrieved from
http://treaty8.bc.ca/cultural-section/
Tuan, Y. (1974). Topophilia: A study of environmental perception, attitudes, and values.
Englewood Cliffs, NJ: Prentice-Hall Inc.
Tuan, Y. (1979). Thought and landscape: The eye and the mind’s eye. In D. W. Meinig
(Ed.), The interpretation of ordinary landscapes (pp. 89-102). New York, NY:
Oxford University Press.
Tuan, Y. (1977). Space and place: The perspective of experience. Minneapolis, MI:
University of Minnesota Press.
Tveit, M. S. (2009). Indicators of visual scale as predictors of landscape preference; a
comparison between groups. Journal of Environmental Management, 90, 2882-2888.
Vieweg, S., Hughes, A. L., Starbird, K., & Palen, L. (2010). Microblogging during two
natural hazards events: What Twitter may contribute to situational awareness. In
Proceedings of the SIGCHI Conference on Human Factors in Computing Systems
(pp. 1079-1088). ACM.
von Maltzahn, K.E. (1994). Nature as landscape: Dwelling and understanding. Montreal
& Kingston, Canada: McGill-Queen’s University Press.
Vouligny, E., Domon, G., & Ruiz, J. (2009). An assessment of ordinary landscapes by
expert and by its residents: Landscape values in areas of intensive agricultural use.
Land Use Policy, 26, 890-900.
Wang, B., Nistor, I., Murty, T., & Wei, Y. (2014). Efficiency assessment of hydroelectric
power plants in Canada: A multi-criteria decision making approach. Energy
Economics, 46, 112-121.
Zhu, X., Pfueller, S., Whitelaw, P., & Winter, C. (2010). Spatial differentiation of
landscape values in the Murray River region of Victoria, Australia. Environmental
Management, 45, 896-911.
Zube, E. H. (1987). Perceived land use patterns and landscape values. Landscape
Ecology, 1(1), 37-45.