unemployment and the supply of and demand for education
TRANSCRIPT

Unemployment and the Supply of and Demand for Educa5on in Metropolitan America
Jonathan Rothwell Ph.D. Brookings Ins5tu5on
Metropolitan Policy Program
Presenta5on for the 2012 Federa5on of Tax Administrators Revenue Es5ma5on & Tax Research Conference, Provide, RI
Oct 22, 2012
1

Outline of ques5ons
1. Why is skill mismatch worth studying? 2. How can skill mismatch be measured? 3. Is there a mismatch & does it help explain
regional unemployment rates? 4. How does skill mismatch compare to cyclical
industrial demand and housing market trends in predic5ng unemployment across metropolitan areas?
5. How does mismatch affect unemployment?
2

3
Presenta5on is based on two related Brookings reports from September of 2011 and August 2012. Both measure skill mismatch, with the first using exis5ng jobs to measure the
demand and the second using job openings
hYp://www.brookings.edu/research/papers/2012/08/29-‐educa5on-‐gap-‐rothwell#M10420

4
MSA profiles available
on website

Why look at Skill Mismatch? • May have cyclical importance. – Severe recession with worst recovery since Great Depression; low-‐skill sectors (manufacturing and construc5on) dispropor5onately affected
– Individual unemployment rates are low for highly educated workers • (4.0% for Bachelors vs. 8.2% for High School in Sept 2012)
• May have structural importance: – Job growth & college aYainment from 1980-‐2010 lower than 1950-‐1980
– College wage premium has steadily increased since 1980 (59% in 2010)
5

How to measure mismatch: Educa5on Gap Indexes
• Educa5on Gap for filled jobs= Ave Years of Edu Demanded for filled jobs
Ave Years of Edu Supplied
• Educa5on Gap by vacancies = Ave Years of Edu Demanded by Vacancies
Ave Years of Edu Supplied
6

Data Sources • Educa5on Demand:
– Jobs by Occupa5on by MSA • BLS OES (roughly 1.5 year delay) • Openings from Conference Board HWOL Series (monthly and 5mely—has SOC codes and MSA data, unlike JOLTS)
– Educa5onal Requirements of Occupa5ons • IPUMS files for Census American Community Survey: Calculate educa5on distribu5on for each minor occupa5on (BLS EPP also provides these data)
• Educa5on Supply: – Share of working age popula5on by level of educa5onal aYainment • Census American Community Survey (roughly two year delay)
7

8
Occupations with the Largest Discrepancies in Share of All Occupations Across Databases, Comparing HWOL Openings to JOLTS Openings for January and February of 2012
Minor Occupation Title HWOL Openings,
Jan-Feb 2012 JOLTS Openings,
Jan-Feb 2012 Share of HWOL Share of JOLTS
Large potential over-estimation of openings by HWOL compared to JOLTS
Computer Occupations 859,833 388,006 16% 5%
Health Diagnosing and Treating Practitioners 443,611 303,059 8% 4%
Advertising, Marketing, Promotions, Public Relations, and Sales Managers 168,646 43,303 3% 1%
Other Management Occupations 196,199 111,653 4% 1%
Supervisors of Sales Workers 164,610 70,737 3% 1%
Sales Representatives, Services 178,859 123,054 3% 2%
Operations Specialties Managers 161,686 103,064 3% 1%
Large potential under-estimation of openings by HWOL compared to JOLTS
Material Recording, Scheduling, Dispatching, and Distributing Workers 59,235 189,850 1% 3%
Material Moving Workers 34,980 166,637 1% 2%
Retail Sales Workers 163,735 361,769 3% 5%
Other Office and Administrative Support Workers 46,874 240,868 1% 3%
Food and Beverage Serving Workers 59,719 361,020 1% 5%
Brookings analysis of data from the BLS, JOLTS, and Conference Board HWOL. All 3-digit (minor) occupations are shown if the difference in the occupational-share of job openings between the two series is greater than 1.5 percentage points. The HWOL data include new openings and those re-announced after being posted
the previous month. Data on only “new” openings are available as well but JOLTS does not make that distinction.
Online Data versus JOLTS Survey Data

9
13.20
13.35
13.50
13.65
13.80
13.95
14.10
14.25
14.40
14.55
14.70
2006 2007 2008 2009 2010 2011 2012
Years o
f Edu
ca-o
n Popula-on-‐weighted Years of Educa-on Required by Average Job
Opening and Filled Job in 100 Largest Metropolitan Areas, 2006-‐2011
Job Openings
Filled Jobs
Recovery
Construc5on & Manufacturing
Jobs Lost

10
0%
5%
10%
15%
20%
25%
30%
35%
40%
45%
2006 2007 2008 2009 2010 2011 2012
Shar
e of
Ope
ning
s Share of Job Openings in 100 Largest Metropolitan Areas by Level of
Education, 2006 to February of 2012
High school or less
Some college or associate's
Bachelors or higher

11
New Annual Job Openings per Unemployed Worker by Educa5on Level in 100 largest metropolitan areas, 2007 and 2011
2.9
6.5
12.0
5.2
1.6
3.0
5.6
2.4
0.0
2.0
4.0
6.0
8.0
10.0
12.0
14.0
High school diploma or less Some college or associate's degree
Bachelor's degree or higher All Workers
New
ope
ning
s per
une
mpl
oyed
wor
ker

12
The share of adults aged 25 and older by level of educa5on in large metro areas compared to the share of 2012 job opening by level of educa5on, 100 largest metropolitan areas
40%
34%
25%
28%
33% 32% 32% 32%
43%
0%
5%
10%
15%
20%
25%
30%
35%
40%
45%
50%
Share of adults 25 and older Share of jobs from openings & exis5ng jobs
Share of jobs from openings
High School or Less
Some college or associates's degree
Bachelor's degree or higher

13
Akron,
Albany AlbuquAllent
Atlant August
Austin
Bakers
Baltim BatonBirmin
Boise
Boston
BridgeBuffal
Cape C
Charle
Charlo
Chatta
ChicagCincin
Clevel
ColoraColumb
Columb Dallas
DaytonDenver
Des Mo
Detroi
El Pas
Fresno
Grand
Greens
Greenv
Harris
Hartfo
Honolu
HoustoIndian
Jackso
Jackso
KansasKnoxvi
Lakela
Lancas
Las Ve
Little
Los An
Louisv
Madiso
McAlle
MemphiMiami-
Milwau
Minnea
Modest
Nashvi
New Ha
New Or
New Yo
Braden
Ogden-
OklahoOmaha-
OrlandOxnardPalm B
Philad Phoeni
Pittsb
Portla
Poughk
Provid
Provo-
Raleig
Richmo
Rivers
Roches
Sacram
St. Lo
Salt LSan An
San DiSan Fr
San JoScrant
SeattlSpring
Stockt
Syracu
Tampa-Toledo
Tucson
Tulsa,VirginWashin
WichitWorces
Youngs
510
1520
Ave
rage
Une
mpl
oym
ent R
ate
1 1.05 1.1 1.15Average Education Gap
Brookings analysis of Conference Board & BLS
The Education Gap and UnemploymentIn Large MSAs, 2010-2012
Does Skill Mismatch Help Explain Metropolitan Unemployment Rates?

14
The education gap and unemployment rates for all workers, less educated workers, and youth by large metro area, 2010
Education gap for openings,
2012 Unemployment rate,
January 2012
Less educated unemployment rate,
2010 Metro areas with smallest education gap for job openings
Madison, WI -1.1% 5.3 9.2 Honolulu, HI 0.2% 5.7 8.9
Provo-Orem, UT 0.5% 5.9 12.8 Raleigh-Cary, NC 1.3% 8.4 14.6
Washington-Arlington-Alexandria, DC-VA-MD-WV 1.4% 5.7 10.6
Average of 10 metro areas with smallest gap 1.3% 7.1 11.4 Metro areas with largest education gap for job openings
Fresno, CA 11.0% 16.9 18.7 Modesto, CA 11.8% 16.9 20.1 El Paso, TX 13.0% 10 9
Bakersfield-Delano, CA 13.7% 15 17.4 McAllen-Edinburg-Mission, TX 13.9% 11.7 11.9
Average of 10 metro areas with largest gap 11.0% 12.7 15.8
Average of 100 largest metro areas 5.1% 8.7 13.5
Source: Brookings analysis of Conference Board HWOL, BLS, and 2010 American Community Survey. Unemployment rate of less educated workers refers to those with a high diploma or less education. Youth refers to
adults between and including the ages of 18 and 24.

Formal analysis of mismatches’ role
• Methods – Dis5nguish between short-‐term and long-‐term by looking at level of unemployment and annual changes in unemployment
– Control for housing market and exogenous industry trends
– Control for metropolitan fixed effects to pick up ins5tu5ons and geography
– Control for 5me effects to capture broad macroeconomic trend
15

Regression equa5on
• Level of Unemployment in a given year (2006-‐2012)
UNEMP(m,t) = α + β(1)*EDU(mt) + β(2)*IND(mt)
+β(3)*HOUSING(mt)+t+m+e
• Change in unemployment from previous year – Repeat equa5on with change in unemployment rate as dependent variable and add change in educa5on gap and
lagged educa5on gap
16

Calcula5ng effect
1. Effect of variable on low-‐scoring metros=Е[B*X] if X>Mean
2. Effect of variable on low-‐scoring metros=Е[B*X] if X<Mean
Effect of scoring high versus low=Difference between 1 & 2
17

18
0.00
0.10
0.20
0.30
0.40
0.50
0.60
0.70
2006 2007 2008 2009 2010 2011 2012
Annu
al cha
nge in une
mploymen
t rate
Industry Growth
Educa5on Gap
HPI
Cyclical Unemployment: Es5mated effect of industry demand, educa5on matching, and housing markets on annual changes in metro area unemployment rates by percentage point, 2007-‐2012
19
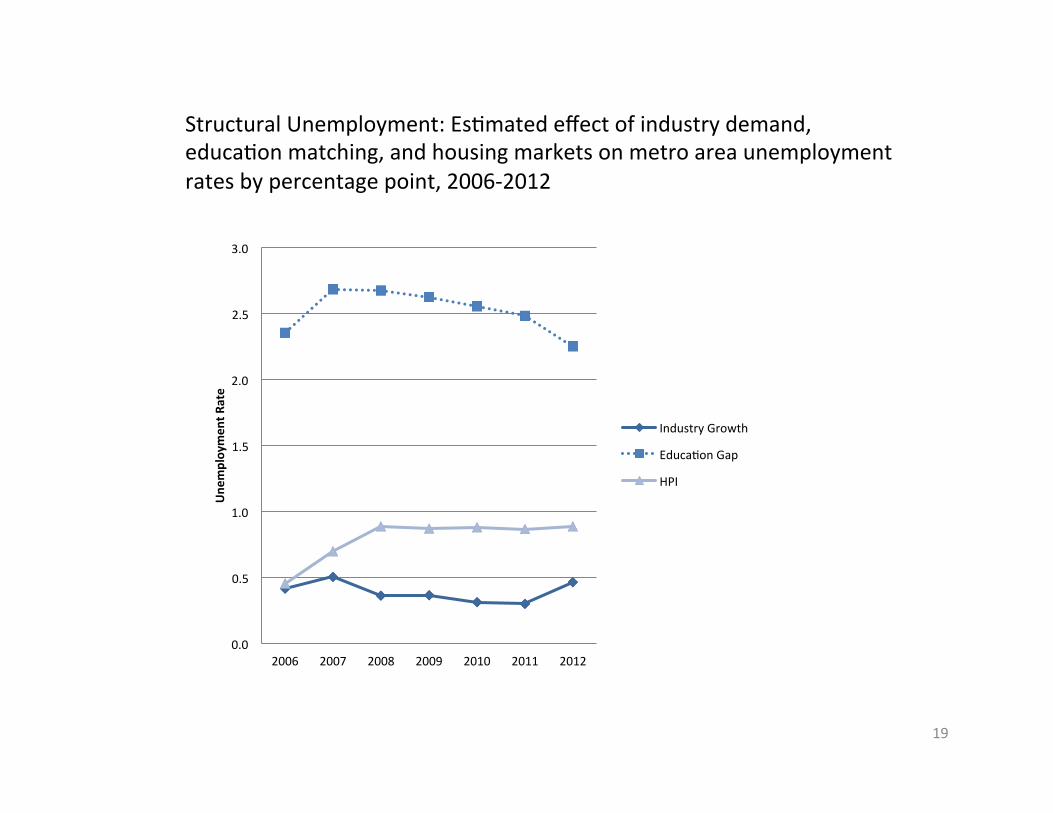
Structural Unemployment: Es5mated effect of industry demand, educa5on matching, and housing markets on metro area unemployment rates by percentage point, 2006-‐2012
0.0
0.5
1.0
1.5
2.0
2.5
3.0
2006 2007 2008 2009 2010 2011 2012
Une
mploymen
t Rate
Industry Growth
Educa5on Gap
HPI

Summary of Regression Results
• Short-‐term/cyclical: – roughly 1/4 of unemployment changes due to educa5on gap
– Roughly 3/4 of unemployment changes due to industry demand and housing
• Long-‐term/structural – Roughly 2/3 of unemployment explained by educa5on gap
– Roughly 1/3 related to housing and industry demand
20

21
Large metro areas with most recession resilient short-term labor markets based on education matching, housing market performance, and industry demand
Average education
gap, 2010-2012
Housing Price
Growth, 2006-2012
Q1
Predicted Industry Growth,
2010Q1-2012Q1
Change in unemployment rate since pre-recession minimum
Predicted change in unemployment rate since pre-recession minimum
10 metro areas with most resilient labor markets based on predicted change in unemployment rate Pittsburgh, PA 3.1% 7.3% 3.0% 2.3 1.6
Tulsa, OK 4.5% 6.1% 3.3% 1.6 1.6 Oklahoma City, OK 3.7% 5.8% 3.0% 0.7 1.8
Buffalo-Niagara Falls, NY 2.6% 9.1% 2.6% 3.6 1.9 Houston-Sugar Land-Baytown, TX 8.7% 9.1% 3.6% 2.6 1.9
Average of strongest metros 4.3% 6.3% 2.9% 2.5 1.9
10 metro areas with least resilient labor markets based on predicted change in unemployment rate Riverside-San Bernardino-Ontario, CA 9.2% -48.3% 2.3% 6.9 6.0
Bakersfield-Delano, CA 13.9% -49.9% 2.6% 6.1 6.5 Stockton, CA 10.0% -58.6% 2.0% 7.1 6.9 Fresno, CA 11.1% -48.0% 1.6% 6.9 6.9
Modesto, CA 11.9% -59.7% 2.1% 7.6 7.1 Average of weakest metros 9.3% -51.0% 2.3% 6.4 6.1
Average of 100 largest metro areas 5.3% -15.1% 2.6% 3.5 3.5
Source: Brookings analysis of Conference Board HWOL, BLS, Moody's Economy.com, the Federal Housing Finance Agency and 2010 American Community Survey. Metro areas are ranked according to the predicted change in
unemployment from each metro area's pre-recession minimum annual unemployment rate to the most current rate as of writing (May of 2012). The education gap measure displayed here uses 2010, 2011, and 2012 openings data but
only 2010 educational attainment data.

22
The long-term strongest and weakest large metro areas based on education matching, housing market performance, and industry demand
Average education
gap, 2010-2012
Housing Price
Growth, 2006-2012
Q1
Predicted Industry Growth,
2010Q1-2012Q1
Unemployment Rate, May 2012
Predicted Unemployment Rate, May 2012
10 metro areas with the strongest labor markets based on predicted unemployment rate Rochester, NY 1.6% 4.0% 2.6% 8.0 5.5 Pittsburgh, PA 3.1% 7.3% 3.0% 6.6 5.5 Madison, WI -1.2% -4.3% 1.8% 4.9 5.6
Buffalo-Niagara Falls, NY 2.6% 9.1% 2.6% 8.5 5.7 Raleigh-Cary, NC 1.2% 0.4% 2.3% 7.7 5.8
Average of strongest metros 2.1% 1.5% 2.6% 6.3 5.8 10 metro areas with the strongest labor markets based on predicted unemployment rate
Lakeland-Winter Haven, FL 11.4% -43.2% 2.6% 9.2 11.6 Stockton, CA 10.0% -58.6% 2.0% 14.5 12.2 Fresno, CA 11.1% -48.0% 1.6% 14.9 12.6
Bakersfield-Delano, CA 13.9% -49.9% 2.6% 13.6 12.8 Modesto, CA 11.9% -59.7% 2.1% 15.6 13.0
Average of weakest metros 11.0% -40.9% 2.2% 12.2 11.6 Average of 100 largest metro areas 5.3% -15.1% 2.6% 7.9 7.9
Source: Brookings analysis of Conference Board HWOL, BLS, Moody's Economy.com, the Federal Housing Finance Agency and 2010 American Community Survey. Predicted unemployment is based on regression of actual
unemployment rates on the variables in the first three columns. The education gap measure displayed here uses 2010, 2011, and 2012 openings data but only 2010 educational attainment data.

How Educa5on Gap Affects Unemployment
Two Hypotheses: 1. Efficiency of matching is hindered when
workers have less educa5on in high-‐demand markets, so unemployed workers stay unemployed longer
2. Fewer jobs are created when workers are under-‐educated
23

Evidence against the matching efficiency hypothesis
• Short-‐term changes are beYer explained by industry demand and housing markets
• Jobs are not harder to fill. – Share of jobs going unfilled in 100 largest MSAs azer one month is lower in recession and recovery than before recession (41% vs. 34%).
– Unfilled opening ra5o was similar in 1966 (31%) (NBER analysis)
– U.S. Hiring/Openings Ra5o is unchanged (JOLTS data) • Before Recession: Feb 2002-‐2007=1.3 • Recovery: July 2009-‐May 2012: 1.4
– No correla5on between share unfilled at MSA level and unemployment rate in recent years
24

Evidence in favor of entrepreneurship hypothesis
• There is a significant cyclical effect from under-‐educa5on
• College educated workers are twice as likely to own businesses that employ workers (Census data)
• U.S. job growth has fallen along with U.S. college aYainment growth since 1980
• Metros with lower educa5on gaps have more openings per worker and had fewer job losses during recession
25

Conclusions • Skill mismatch can be measured and used to predict changes in labor markets
• An “educa5on gap index” explains most of the varia5on in unemployment rates between metro areas, but only one quarter of the change from year to year.
• The educa5on gap lowers the number of job openings but does not seem to make them harder to fill
• There are too few job openings, especially for less educated workers
26

For More Informa-on
Jonathan Rothwell Associate Fellow Brookings Ins5tu5on Metropolitan Policy Program 202.797.6314 [email protected]
27