unep report1 stocks 100920
TRANSCRIPT
7/24/2019 UNEP Report1 Stocks 100920
http://slidepdf.com/reader/full/unep-report1-stocks-100920 1/52
U N
I T E
D
N
A T I O
N
S
E N
V I R
O
N
M
E N
T
P R
O
G
R
A
M
M
E
METAL STOCKS
IN SOCIETY
Scientific Synthesis

7/24/2019 UNEP Report1 Stocks 100920
http://slidepdf.com/reader/full/unep-report1-stocks-100920 2/52
Copyright © United Nations Environment Programme, 2010
Design: 3f design; cover concept UNEP;
Photos: iStockphoto.com: background title/page 8 © Huchen Lu, title 1 © oneclearvi-
sion, title 2 © Marco Hegner, title 3/page 37 © Milos Peric, title 4/page 29 © DNY 59,
page 11 © Rob Belknap, page 13 © Youra Pechkin, page 26 © Ermin Gutenberge, page
27 © gitches, page 30 © Mike Clarke; page 21 © Umicore Precious Metals Refining
This publication may be reproduced in whole or in part and in any form for
educational or non-profit purposes without special permission from the copyright
holder, provided acknowledgement of the source is made. UNEP would appreciate
receiving a copy of any publication that uses this publication as a source.
No use of this publication may be made for resale or for any other commercial
purpose whatsoever without prior permission in writing from the United Nations
Environment Programme.
Disclaimer
The designations employed and the presentation of the material in this
publication do not imply the expression of any opinion whatsoever
on the part of the United Nations Environment Programme
concerning the legal status of any country, territory, city or
area or of its authorities, or concerning delimitation of its
frontiers or boundaries. Moreover, the views expressed
do not necessarily represent the decision or the
stated policy of the United Nations Environment
Programme, nor does citing of trade names or
commercial processes constitute endorsement.
ISBN: 978-92-807-3082-1
Editor: International Panel for Sustainable Resource Management,Working Group on the Global Metal Flows
Lead author: T. E. Graedel
This report is a rewritten and enhanced version based on M. D. Gerst and
T. E. Graedel, Environmental Science & Technology, 42, 7038 – 7045, 2008. Parts
of it were developed at a workshop held August 15 – 16, 2008, with the following
participants: Thomas Graedel, Yale University, USA, coordinator; A. Dubreuil, Natural
Resources Canada; Michael Gerst, Dartmouth College; Seiji Hashimoto, National
Institute for Environmental Studies, Japan; Yuichi Moriguchi, National Institute for
Environmental Studies, Japan; Daniel Müller, Norwegian University of Science
and Technology; Claudia Pena, CIMM, Chile; Jason Rauch, Yale University, USA;
Thompson Sinkala, School of Mines, Zambia; and Guido Sonnemann, UNEP,
France.
Guido Sonnemann, UNEP, provided valuable input and comments; the Resource
Panel’s secretariat coordinated the preparation of this report.
Thanks go to Ernst Ulrich von Weizsäcker and Ashok Khosla as co-chairs of the
Resource Panel, the members of the Resource Panel and the Steering Committee
for fruitful discussions. Additional comments of a technical nature were received from
some governments participating in the Steering Committee.
Helpful comments were received from several anonymous reviewers in a peer-review
process coordinated in an efficient and constructive way by Lea Kauppi together
with the Resource Panel secretariat. The preparation of this report also benefitted
from discussions with many colleagues at various meetings, although the main
responsibility for mistakes will remain with the authors.
UNEPpromotes environ-
mentally sound practicesglobally and in its own activities.
This publication is printed on FSC-certified paper with 60 % recycled fibre,using eco-friendly practices. Our distri-
bution policy aims to reduce UNEP’scarbon footprint.
Acknowledgements

7/24/2019 UNEP Report1 Stocks 100920
http://slidepdf.com/reader/full/unep-report1-stocks-100920 3/52
METAL STOCKS
IN SOCIETY
Scientific Synthesis
7/24/2019 UNEP Report1 Stocks 100920
http://slidepdf.com/reader/full/unep-report1-stocks-100920 4/52
2
Metal Stocks in Society – Scientific Synthesis
Preface
Economic development is deeply coupled
with the use of metals. During the 20th cen-tury the variety of metal applications in soci-
ety grew rapidly. In addition to mass appli-
cations such as steel in buildings and alu-minium in planes, more and more differentmetals are in use for innovative technologies
such as the use of the specialty metal indiumin LCD screens.
Metals are present everywhere around us
and are one of the major materials uponwhich our economies are built. In particular
in emerging economies, but also in industri-alized countries, the demand for metals is
increasing.
Therefore, mining activities expand, poten-tially leading to growing environmental
impacts. Recycling is a way to mitigate theseimpacts. We can call this “mining above
ground” or “urban mining”, and these activi-ties are of increasing importance in generat-
ing raw materials.
The continued increase in the use of metalsover the 20th century has led to a substantial
shift in metal stocks from below ground toabove ground in applications in society. Such
a shift raises social, economic, and environ-mental issues that have to be addressed by
quantifying the amount of metal stocks insociety and their lifetimes. For instance, the
average lifetime of copper in a building is 25to 40 years; afterwards, the metal is ready for
mining.
Comparison of the per capita stocks in indus-
trialized countries with those in developingcountries suggests that if the total world pop-
ulation were to enjoy the same levels of use
as the industrialized countries, the amount ofglobal in-use metal stocks required would be3−9 times those existing at present.
This report, the first in a series of six, has
been compiled by the Global Metals FlowsGroup of UNEP’s Resource Panel. It provides
reasonably detailed information on the in-usestocks for five metals, and sparse but poten-
tially useful information for nineteen othermetals.
Closing the information gaps about stocks inhuman society provides important informa-tion about the potential of metal recycling to
supply future demand. The utilization of thesegrowing metal stocks through recycling is
expected to be an important source for metalsupply in the future.
Prof. Thomas E. Graedel
Leader of theGlobal Metal Flows Working Group

7/24/2019 UNEP Report1 Stocks 100920
http://slidepdf.com/reader/full/unep-report1-stocks-100920 5/52
3
Metal Stocks in Society – Scientific Synthesis
Preface
Metals are a core, centre-piece of the glo-
bal, economy: Whether it be in the manu-facture of buildings or cars to the booming
production of mobile phone, computers and
other electronic goods, metals have becomeincreasingly important to commerce.
But metals are also part of the challengesociety is facing in its transition to a low car-
bon, resource efficient 21st Green Economy.
Metals are a finite resource, whose manage-ment, consumption and production echo to
the need to adopt a recycling economy. Met-als also have impacts as a result of their
mining, extraction and refining. Meanwhile
some metals have, as a result of their useand disposal in products and processes,health implications and ones that impact on
the wider environment.
Understanding, quantifying and estimatingthe ways metals flow through economies is
part of the solution to better managing theirimpacts and their benefits. Indeed the Inter-
national Panel for Sustainable ResourceManagement, hosted by UNEP and estab-
lished in 2007, identified metals as a key areain terms of the 21st century sustainability
challenge.
The Panel’s Global Metal Flows Group hasidentified six, central assessment reports
as needed to bring clarity and to promoteaction towards a sustainable metals econo-
my: stocks in society, recycling rates, envi-ronmental impacts, geological stocks, future
demand, and critical metals.
This, the first report in this area, focuses on
the stocks of metals in society. It provides,from a global perspective, the best scientific
information available on the quantity of metal
stocks in the world.
In particular it provides authoritative esti-
mates of metals currently in use and theirlifetimes. This in turn allows evaluations on
the amounts of metals that may re-enter theglobal and national economies allowing gov-
ernments to make more intelligent and tar-geted decisions on metals management.
This is no easy task and here I would like
to congratulate the Resource Panel and its
experts and partners for bringing to govern-ments, business and civil society a furtherand important piece in the sustainability jig-
saw puzzle.
Metals encapsulate the 21st century chal-lenge of realizing sustainable development:
development that requires and requests a farmore intelligent understanding and trajectory
that reflects the needs of a planet of six bil-lion people, moving to more than nine billion
by 2050.
Achim Steiner
UN Under-Secretary General andExecutive Director UNEP
7/24/2019 UNEP Report1 Stocks 100920
http://slidepdf.com/reader/full/unep-report1-stocks-100920 6/52
7/24/2019 UNEP Report1 Stocks 100920
http://slidepdf.com/reader/full/unep-report1-stocks-100920 7/52
5
Metal Stocks in Society – Scientific Synthesis
List of Figures
Figure 1. The Generic Life Cycle of a Metal, with Stock Locations Indicated ______________ 12
Figure 2. The Nickel Recycling Map ________________________________________________ 15
Figure 3. A Schematic Diagram of the Methodology for Calculating Outflows
from In-Use Stocks ______________________________________________________ 22
Figure 4. Information Availability on In-Use Stocks of Metals __________________________
24
List of Tables
Table 1. Extant In-Use Metal Stock Estimations for the Major Engineering Metal _______ 17
Table 2. Extant In-Use Metal Stock Estimations for Precious Metals __________________ 18
Table 3. Extant In-Use Metal Stock Estimations for Specialty Metals __________________ 19

7/24/2019 UNEP Report1 Stocks 100920
http://slidepdf.com/reader/full/unep-report1-stocks-100920 8/52
6
Metal Stocks in Society – Scientific Synthesis
Abbreviations and Acronyms
EC European Commission
EU-15 European Union with 15 memberstates
GIS Geographic Information System
MDC The more-developed countries
(MDC): are Australia, Canada, theEuropean Union EU15, Norway,
Switzerland, Japan, New Zealand,and the United States
LDC The less-developed countries
(LDC) consist of all countries ex-cept those in the “more-devel-
oped” category
USGS United States Geological Survey
Units
g Gram
kg Kilogram (103 grams)
Mg Megagram (106 grams)
Tg Teragram (1012 grams)
metric ton Megagram (106 grams)

7/24/2019 UNEP Report1 Stocks 100920
http://slidepdf.com/reader/full/unep-report1-stocks-100920 9/52
7
Metal Stocks in Society – Scientific Synthesis
Chemical Abbreviations
Ferrous Metals
Fe – Iron
Mn – Manganese
V – Vanadium
Nb – Niobium
Cr – Chromium
Ni – Nickel
Mo – Molybdenum
Si – Silicon
Bi – Bismuth
Non-Ferrous Metals
Al – Aluminium
Co – Cobalt
Cu – Copper
Pb – Lead
Mg – Magnesium
Sn – Tin
Ti – Titanium
Zn – Zinc
Precious Metals
Ag – Silver
Au – Gold
Pt – Platinum
Pd – Palladium
Rh – Rhodium
Os – Osmium
Ir – Iridium
Ru – Ruthenium
Specialty Metals
Sb – Antimony
As – Arsenic
Ba – Barium
Be – Beryllium
B – Boron
Cd – Cadmium
Cs – Cesium
Ga – Gallium
Ge – Germanium
Hf – Hafnium
In – Indium
Li – Lithium
Hg – Mercury
Re – Rhenium
Sc – Scandium
Se – Selenium
Sr – Strontium
Ta – Tantalum
Te – Tellurium
Tl – Thallium
W – Tungsten
Y – Yttrium
Zr – Zirconium
La – Lanthanum
Ce – Cerium
Pr – Praseodymium
Nd – NeodymiumSm – Samarium
Eu – Europium
Gd – Gadolinium
Tb – Terbium
Dy – Dysprosium
Ho – Holmium
Er – Erbium
Tm – Thulium
Yb – Ytterbium
Lu – Lutetium
Steel Alloy Family
SS – Stainless Steel
ST – Steel
7/24/2019 UNEP Report1 Stocks 100920
http://slidepdf.com/reader/full/unep-report1-stocks-100920 10/52
8
Metal Stocks in Society – Scientific Synthesis
7/24/2019 UNEP Report1 Stocks 100920
http://slidepdf.com/reader/full/unep-report1-stocks-100920 11/52
Executive Summary
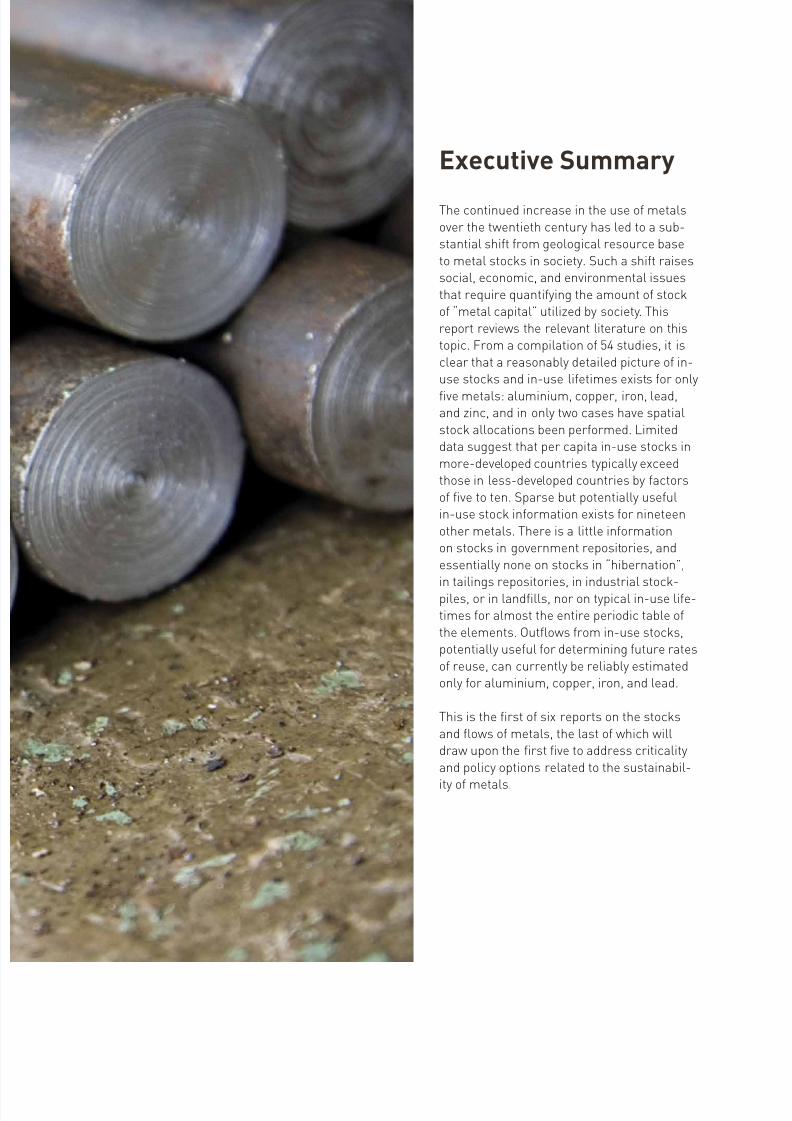
The continued increase in the use of metals
over the twentieth century has led to a sub-stantial shift from geological resource base
to metal stocks in society. Such a shift raisessocial, economic, and environmental issues
that require quantifying the amount of stockof “metal capital” utilized by society. This
report reviews the relevant literature on thistopic. From a compilation of 54 studies, it is
clear that a reasonably detailed picture of in-
use stocks and in-use lifetimes exists for onlyfive metals: aluminium, copper, iron, lead,and zinc, and in only two cases have spatial
stock allocations been performed. Limiteddata suggest that per capita in-use stocks in
more-developed countries typically exceedthose in less-developed countries by factors
of five to ten. Sparse but potentially usefulin-use stock information exists for nineteen
other metals. There is a little informationon stocks in government repositories, and
essentially none on stocks in “hibernation”,
in tailings repositories, in industrial stock-piles, or in landfills, nor on typical in-use life-times for almost the entire periodic table of
the elements. Outflows from in-use stocks,potentially useful for determining future rates
of reuse, can currently be reliably estimatedonly for aluminium, copper, iron, and lead.
This is the first of six reports on the stocks
and flows of metals, the last of which willdraw upon the first five to address criticality
and policy options related to the sustainabil-ity of metals.
7/24/2019 UNEP Report1 Stocks 100920
http://slidepdf.com/reader/full/unep-report1-stocks-100920 12/52
10
Metal Stocks in Society – Scientific Synthesis
1. Nature’s Non-
Renewable, Non-FuelResources
Nature provides human society with a rich
spectrum of starting materials. In practice,the metal minerals constitute the largest set
of these resources – more than sixty differentelements in all. Modern technology is totally
dependent on perhaps four of them – the iron
and manganese that (with minor amountsof other metals) form structural steels, thealuminium widely used in transportation, the
lead used for storage batteries, and the cop-per that transmits power from the generator
to the user. Cases nearly as strong could bemade for perhaps four others – the chromi-
um and nickel that (together with iron) formthe stainless steels, the zinc that inhibits
metal corrosion, and the tin that is essentialto modern electronics.
In actuality, however, hardly any element canbe eliminated from a list of those important
to modern society and cutting-edge technol-ogy. Manufacturers of everything from com-
puter chips to health care equipment routine-ly employ dozens of different elements, each
carefully chosen because of a specific physi-cal or chemical property. Some have just the
right conductivity for a specific purpose, orthe right melting point, or the right photon
wavelength, or the right catalytic efficiency athigh temperature. It is not generally realized,
but modern technology makes use of virtu-
ally every gift of nature, and if it doesn’t doso in some instances today, it probably willtomorrow.
A key question that relates to this very broad
and intensive use of metals is whether soci-ety needs to be concerned about long-term
supplies of any or many of them. This is amany-faceted question that cannot be an-
swered quickly or unequivocally. To addressit, the Global Metal Flows Group envisions a
series of six reports, of which this is the first:
Report 1 – Metal Stocks in Society
Report 2a – Recycling Rates of Metals
Report 2b – Metal Recycling – Opportunities, Limits, Infrastructure
Report 3 – Environmental Risks and Challenges of Anthropogenic MetalsFlows and Cycles
Report 4 – Future Demand Scenarios for Metals
Report 5 – Critical Metals and Metal Policy Options
The first five reports form the necessary basis for the last report.
A number of policy-relevant issues will beaddressed in these reports, including the
following:
■ To what extent is information available onthe metal stocks in society? (Report 1)
■ How well can scientists quantify the spa-tial distributions of metal stocks in society?
(Report 1)
■ What is the efficiency with regard to metalrecovery? (Report 2)

7/24/2019 UNEP Report1 Stocks 100920
http://slidepdf.com/reader/full/unep-report1-stocks-100920 13/52
11
Metal Stocks in Society – Scientific Synthesis
■ What are the recycling rates of metals invarious countries, various regions, and the
planet as a whole? (Report 2)
■ What are the related environmental im-pacts of different metal mining refining
and recycling techniques? (Report 3)
■ To what extent is information availableon the virgin reserves and resources of
metals?
■ To what extent can end of life discard
streams from electronics, automobiles,and other products be used as a secondarysource of metals? (Report 2b)
■ What information is needed to develop re-
alistic scenarios for potential metal stocksand rates of use in the future? (Report 4)
■ How well can future rates of demand for
metals be predicted? (Report 4)
■ For which metals may supplies becomecritical, and over what time frames?
(Report 5)
■ Is today’s use of metals sustainable? If not,what policy options are suggested by the
information developed in Reports 1 – 4?(Report 5)
The first three of the six reports are in the
current Terms of Reference and Work Planfor the Group, and are expected to be com-
pleted by 2010. The second three are expect-
ed to constitute the Work Plan for the Groupfor the 2010 – 2012 time period.

7/24/2019 UNEP Report1 Stocks 100920
http://slidepdf.com/reader/full/unep-report1-stocks-100920 14/52
12
Metal Stocks in Society – Scientific Synthesis
2. The Concept of
Stocks
One aspect of the availability of metals con-
cerns the natural (or virgin) stocks of metals:those deposited by geological processes in
concentrations suitable for being extractedand processed, now and in the future. The
total amounts of metals in such depositsare difficult to quantify accurately, but global
estimates are publicly reported (e. g., USGS,
2008). This information is important to evalu-ations of resource sustainability, but is notthe subject of this report and so is not treated
further herein.
A group of less well studied stocks are
termed “anthropogenic”; these are themetal stocks in society, already extracted,
processed, put into use, currently providingservice, or discarded or dissipated over time.
These types of metal stocks in society canbe appreciated with the help of the life-cycle
diagram of Figure 1. Metal ores are minedfrom the ground, processed into the metal
itself, fabricated into products, and thenput into use. During processing, waste rock
and impurities containing small amounts ofthe target metals are deposited in “tailings
ponds”. Some metal is held in stockpilesby processors, fabricators, and sometimes
by governments. Eventually, the product isdiscarded, perhaps to recycling, perhaps lost
to the environment. The metal in one form oranother moves rapidly through most of these
stages, but may stay in use for long periods– years, decades, perhaps a century or more.
In some cases, such as metal in obsolete
undersea cables, the metal is no longer inuse, but not (yet?) recovered and recycled(Hashimoto et al., 2007). These “hibernating”
stocks are potentially reusable, but their
recovery may well not be economically
feasible. All of these stocks are, in principle,the subject of the present report.
Material flow analysis characterizes and
quantifies flows of materials into, out of, andthrough a system of interest, equating flows
at each reservoir within the system by con-servation of mass. In this analysis, the choice
Processing
3
Ore 1
4
Environment 8
Fabrication
5
Use
6
DiscardMgt.
7
2
Import / Export
Figure 1.
The generic
life cycle of
a metal, with
stock locations
indicated:
1,
metal in virginore bodies;
2,
metal in tailings;
3,
metal in
processor
stockpiles;
4,
metal ingovernment
stockpiles;
5,
metal in
manufacturer
stockpiles;
6,
metal in-use
stock;
7,metal in recycler
stockpiles;
8,
metal in landfill
stockpiles.
Emissions from
the Use stage are
small, and not
indicated here.

7/24/2019 UNEP Report1 Stocks 100920
http://slidepdf.com/reader/full/unep-report1-stocks-100920 15/52
13
Metal Stocks in Society – Scientific Synthesis
of scale and level is critical (scale is “a spa-tial, temporal, quantitative, or analytic dimen-
sion used to measure or study a phenom-enon” [Gibson et al., 2000], as with a ruler,
level is a position along the scale.) The quan-tity of mass of a chosen material that exists
within the system boundary of choice at aspecific time is considered stock within the
system. In terms of units of measurement,stock is a level variable (i. e., kg), while flow
is a rate variable (i. e., kg per unit of time). Ingeneral, the metal stock in society is high-
est by far when material is in use (rather than
in processing, fabrication, manufacturing, orwaste management).
The metal portion of in-use stock can be de-fined in two ways. If an individual element is
specified, in-use stock of metal refers to thetotal mass of that element, regardless of its
chemical form. If a metal alloy is specified,in-use stock of metal refers to the total mass
of that alloy (including all its constituent ele-ments).
7/24/2019 UNEP Report1 Stocks 100920
http://slidepdf.com/reader/full/unep-report1-stocks-100920 16/52
14
Metal Stocks in Society – Scientific Synthesis
3. Methodology for
Metal Stocks inSociety
The definition of in-use stock is, as discussed
previously, sensitive to the scale and levelchosen. For reasons of relevance and data
availability, most studies either explicitly orimplicitly choose a time-scale of one year.
System boundaries are typically interpret-
ed to be spatial, and correspond to a pre-de-fined geopolitical or industrial sector bound-ary (e. g., industrial region, city, or country).
Spatial boundaries are convenient from adata collection standpoint. They also allow for
straightforward normalization of in-use stockestimates. Normalization by, for example,
people or area within a system boundary isoften desirable when comparing the relative
states of different systems.
Once the appropriate time interval and spa-
tial level have been chosen, the next step is todefine an estimating procedure. This quan-tification is a considerable challenge, be-
cause there are no convenient, regularly-col-lected data that can be drawn upon. Instead,
one of two complementary methods of es-timation must be employed for the purpose
(Brunner and Rechberger, 2004; Gerst andGraedel, 2008).
The first method is termed “top-down” an-
thropogenic stock estimation. Top-down es-timations take information regarding flows,
and infer metal stocks in society by comput-ing the cumulative difference between inflow
and outflow. Mathematically, if St is stock at
time t, then in discrete time steps
S t = (Inflowt - Outflowt )+ S o∑T o
T
where To is the time of the initial time step,
T is the current time step, and So is the extantstock at the initial time step. Typically, the
range from To to T is 50 to 100 years, or
longer. This yields the result that St is much
larger than So, making the contribution of So negligible because of the general increase in
metal stocks in society over the past severaldecades, and therefore generally unneces-
sary to include in practice.
In contrast, more recent top-down methodsare utilizing increasingly complex methods.
With the help of computing power and betteraccess to data, contemporary top-down stud-
ies have been able to disaggregate metal pro-
duction into inflow of specific final goods cat-egories, and then model discard by defininglifetime functions for final product groups.
While an improvement, this method is stillcompletely dependent on inflow data, be-
cause historical outflow data is poor to non-existent. Future efforts to collect historical
data on outflows would allow for a well-need-ed empirical check on the results creating by
discard models (see Ruhrberg (2006) for anexample).
The types of available data have a significanteffect on the system boundary defined fortop-down analyses. Time steps are typically
one year, because most applicable data areavailable as per year flows. The data used for
inflow is gathered from government docu-ments, technical literature, expert elicitation,
and industry trade organizations. Usually, lit-tle discussion is spent on the relative reliabil-
ity of these various sources. The appropriatespatial boundary is heavily dependent on the
underlying data available, and as most inflowdata are only collected at the country-level,
this limits the scope of application. This canbe problematic if higher spatial resolution is
desired.
The “bottom-up” method takes an oppositestrategy to top-down methods because it
gathers information on stock variables toestimate in-use stock, and (if desired) infer
the behaviour of flows. In its simplest form,estimating in-use stock via the bottom-up
method is represented bywhere Nit is thequantity of final good i in-use at time t, m
it is

7/24/2019 UNEP Report1 Stocks 100920
http://slidepdf.com/reader/full/unep-report1-stocks-100920 17/52
15
Metal Stocks in Society – Scientific Synthesis
the metal content of in-use final productgroup I (see Appendix 1), and A is the number
of different types of final goods.
S t = N it mit ∑i
A
More complicated versions of the bottom-upmethod keep the same formulation of Equa-
tion 2, but allow for more precise definitionsof the good categories and metal contents.
The types of available data also have a sig-nificant effect on the system boundaries of
bottom-up approaches. As with the top-downmethod, most data collected are interpreted
as being representative of a year time peri-od. In this case though, the data are of stock
existent during a year instead of the rate offlow per year. Also in similarity with the data
collected for the top-down approach, datacollected for the bottom-up approach are of-
ten constrained by geopolitical boundaries.However, this constraint is often not as strict
for bottom-up methods, because stock-rele-vant (e. g., houses or cars) data are frequently
available at the city/town or lower level of ag-
gregation.
Figure 2.
The nickel
recycling map
(adapted from
Dubreuil et al.,
2009).
Mininglaterites /sulphites
Concentrationlaterites /sulphites
Carbon steel
Other metalsSmeltingferro-Ni /mattes
Refiningmetalic Ni
Metal finishing
Use
Collection
Battery chemistries& catalysts
Use
Collection
Stainless steelNi chemicals
Semi-manufacture
Manufacture andassembly
Use
Collection
Ni aloys
Semi-manufacture
Manufacture andassembly
Use
Collection
Disassembly
Loss (disposal and emissions)
Exit to carbon steel
Low aloy steels
Semi-manufacture
Manufacture andassembly
Use
Collection
Simplified map of significant nickel and
nickel-containing material flow a
a This map focuses on product end of life recycling. Recyclingflows from processing and manufacturing are not illustrated.
Nickel (Ni) commodity and productNi containing disposals/lossesNi recyclingconnections to other metal pools

7/24/2019 UNEP Report1 Stocks 100920
http://slidepdf.com/reader/full/unep-report1-stocks-100920 18/52
16
Metal Stocks in Society – Scientific Synthesis
In these cases, where high spatial resolutionand good count data for N
it are acquired, pre-
cision in determining metal content becomesthe limitation. For many new final goods be-
ing input into use, such as machinery, elec-tronics, and cars, metal content can be
measured or obtained from manufacturers.Goods such as buildings are more difficult
because they are less of a mass-producedcommodity. However, using the metal con-
tent of new goods to infer the metal contentof in-use stock can be problematic, because
in-use stock contains an amalgam of stock
vintages that have been accumulated overtime. For example, applying the copper con-tent of a newly built house to a house built
in the 1950s would yield a misleading result.Alleviation of this data problem may prove to
be difficult as it would require either a statis-tically significant regime of sampling of the
metal content of in-use stock, or a significanthistorical investigation of engineering design
plans for various goods.
Although both methods seek to measure the
same quantity, they work in fundamental-ly different ways, and current datasets andtechnology are more appropriate for some
goals than others. Inherent in the top-downmethod is evolution over time. As a result,
that approach is often employed where in-flow/outflow time series data are available.
Because the top-down method is, to someextent, a more derived estimate of stock than
the bottom-up method, it could be viewed asless precise. However, the bottom-up method
is hindered by the inability to count everythingin use, and from uncertainties as to the metal
content of many of the units being included inthe assessment. This trade-off must be con-
sidered in the context of the study goal. If amore detailed and spatially explicit analysis is
desired, then the bottom-up method is likelyto be more desirable. If less detail is accept-
able, and larger temporal and spatial scale isthe focus, then the top-down method may be
the more appropriate method to employ.
Metals are rarely used in the pure form, butrather in alloys. From a thermodynamic point
of view and from the economic perspective, itis not always feasible to “un-mix” the alloy to
their metallic constituent. For noble metals(gold, platinum group metals, copper, lead
for example), the recycling can produce themetal at high purity level. In contrast, nick-
el and chromium in stainless steel alloys willbe recycled as stainless steel, but no nick-
el will be produced (see Figure 2). In orderto report the stock of nickel, it is desirable to
express stock as divided among the principal
uses such as batteries & catalysts, low alloysteels, etc. Bottom-up studies are capableof doing this, and some of these studies are
quite detailed in this regard (e. g., Rostkowskiet al., 2007).
The above procedures do not apply to stocks
of metals below the ground, either in virginores or in landfills. For the former, it is nec-
essary to rely on information from test drill-ings supplemented and interpreted by geo-
logical theory. In the case of landfills, the
data are so sparse that rough estimates aremade based on calculations of discard ofend-of-life products combined with informa-
tion on the amount of recycled metal usedover time.

7/24/2019 UNEP Report1 Stocks 100920
http://slidepdf.com/reader/full/unep-report1-stocks-100920 19/52
17
Metal Stocks in Society – Scientific Synthesis
4. A Review of
Metal StocksDeterminations
4.1 In-Use Stocks
Given the definition of in-use stock and
estimation methodologies, comparison ofmetal stock estimates from the literature can
be made. A review of the scholarly literature,
as well as industry publications and presenta-tions, yielded a total of 54 studies of metalstocks in society from the peer-reviewed
literature, published reports, and personalcommunications. The publication dates range
from 1932 to 2007, with 70 % of those publica-tions occurring after the year 2000. Twenty-
four different metals (22 elements and 2 alloygroups) have been addressed, with a total of
124 metal stock in-use estimates, a few ofwhich provide dynamic temporal information.
The individual data assembled in our revieware presented in two Appendices: a specifica-
tion of the principal final product categories(i. e., the sectors of principal use) in which
each metal resides when in use (informationnecessary for bottom-up studies), and a list-
ing of all the extant per-capita in-use stockdeterminations, by locale, applicable year,
amount, and reference source. We contentourselves here with a presentation of a sum-
mary on a per capita basis and a discussionof the overall picture shown by the data. We
also note that few of the papers deal with un-
certainty in the data, despite the general im-pression that those uncertainties are large(see, for example, Hebrant and Sörme, 2001).
Table 1 lists the summarized in-use stock
information for the major engineering met-als. Copper, lead, zinc, and iron are the top
four metals in terms of number of estimatesin the study pool. Aluminium’s stock in
society is also fairly well characterized. Thereare several determinations for stainless steel,
Metal Number of
estimates
Percent of
all estimates
Global per
capita stock
MDC per
capita stockb
LDC per
capita stockc
Aluminum 9 7.4 80 350 – 500 35
Copper 34 27.0 35 – 55 140 – 300 30 – 40
Iron 13 10.7 2200 7000 – 14000 2000
Lead 20 16.4 8 20 – 150 1 – 4
Steel 1 0.8 7085
Stainless
steel
5 4.1 80 – 180 15
Zinc 14 11.5 80 – 200 20 – 40
a The years of the determinations in Tables 1 – 3 vary, but most are for the period 2000 – 2006. The units of per capita stock arekg of metal in most cases, but g of metal for cadmium, gold, mercury, palladium, platinum, rhodium, and silver. The totalnumber of estimates is 124.
b The more-developed countries (MDC) used in this calculation are Australia, Canada, the European Union EU15, Norway,Switzerland, Japan, New Zealand, and the United States (altogether about 860 million people in 2005).
c The less-developed countries (LDC) used in this calculation consist of all countries except those in the “more-developed”category (altogether about 5620 million people in 2005).
Table 1.
Extant In-Use
Metal Stock
Estimations
for the Major
Engineering
Metalsa

7/24/2019 UNEP Report1 Stocks 100920
http://slidepdf.com/reader/full/unep-report1-stocks-100920 20/52
18
Metal Stocks in Society – Scientific Synthesis
and one for the aggregate of all types of steel(a mixture that is roughly 95 % iron). Geo-
graphically, an overwhelming majority of theestimates concern more-developed coun-
tries. On a global basis, top-down estimatesfor in-use stocks exist for only four of these
elements: aluminium, copper, iron, and lead.The per capita stock of iron is largest, as
befits its high rate of flow into use; alumini-um’s stock is slightly larger than that of
copper, and that for lead is significantlylower. (Global values are generated by divid-
ing total estimated in-use stock by global
population. The results should not be inter-preted as suggesting equivalent per capitain-use stocks around the world; most stocks
clearly reside in more-developed countries.)
Few stock estimates are available on a re-gional basis - only aluminium for Europe,
copper for North America and Europe, andstainless steel for several. The stock evalua-
tions are all quite recent, and appear reason-ably reliable. On a country basis, data exist
for Japan, USA, Australia, and several Euro-pean countries.
Urban-level evaluations have been performed
for several metals and several cities, all on
a bottom-up basis. The locales are diverse:Stockholm, Vienna, New Haven, Cape Town,
Beijing, and Sydney. There are still too fewbottom-up studies to evaluate the accuracy of
this approach, although where comparisonsof results can be made, they appear reason-
able. At the city level, it is possible to allo-cate the stock on a spatial basis, and this has
been done for Cape Town and Sydney.
Anthropogenic stock estimates exist for fiveprecious metals, as shown in Table 2; most
are for more developed countries. The excep-
tion is silver, for which a rather poorly docu-mented global estimate exists.
For the “specialty metals” (those used inmore modest quantities than the major engi-
neering metals, particular for unique physicalor chemical properties), Table 3 gives the an-
thropogenic stock estimates. Twelve differentmetals are listed, none with more than three
determinations. The only global estimate inthis group is for cadmium; it is seriously out
of date and cannot be regarded with confi-dence. In a recent unpublished presentation,
Halada (2008) described a top-down esti-
Metal Number of
estimates
Percent of
all estimates
Global per
capita stock
MDC per
capita stockb
LDC per
capita stockc
Gold 2 1.6 35 – 90
Palladium 2 1.6 1 – 4
Platinum 2 1.6 1 – 3
Rhodium 1 0.8 0.2
Silver 2 1.6 110 13
a The years of the determinations in Tables 1 – 3 vary, but most are for the period 2000 – 2006. The units of per capita stock arekg of metal in most cases, but g of metal for cadmium, gold, mercury, palladium, platinum, rhodium, and silver. The totalnumber of estimates is 124.
b The more-developed countries (MDC) used in this calculation are Australia, Canada, the European Union EU15, Norway,Switzerland, Japan, New Zealand, and the United States (altogether about 860 million people in 2005).
c The less-developed countries (LDC) used in this calculation consist of all countries except those in the “more-developed”
category (altogether about 5620 million people in 2005).
Table 2.
Extant In-Use
Metal Stock
Estimations
for Precious
Metals.a
7/24/2019 UNEP Report1 Stocks 100920
http://slidepdf.com/reader/full/unep-report1-stocks-100920 21/52
19
Metal Stocks in Society – Scientific Synthesis
mate of in-use stocks for some 20 elementsin Japan; he found that the Japanese in-use
stocks of gold, indium, silver, tin, and tanta-lum were 10 – 20 % of estimated virgin re-
serves of those metals, indicating the impor-tance of enhanced reserach efforts for these
less-abundant metals.
For the more-developed countries, there issufficient information in Table 1 to compute
an average person’s allocation of in-usemetal stock. Doing so demonstrates the
dependence of modern lifestyles on a sub-
stantial stock of metal, a perspective espe-cially useful because few individuals areaware of their share of metals in infrastruc-
tures such as communications, rail networks,and power generation and distribution
systems, as well as in their personal homesand vehicles. The average more-developed
country citizen’s in-use metal stock is be-tween ten and fifteen metric tons. Of this
amount, five metals – iron, aluminium,copper, zinc, and manganese, make up more
than 98 %.
One feature of the limited data is that thereappear to be significant differences at
present in the per capita in-use stock of themore-developed and less-developed coun-
tries. Additionally, when measured at differ-ent spatial levels suburban residents appear
to have larger per capita in-use stock thando urban or especially rural residents, al-
though this is an observation that needs inputfrom future research on in-use stock varia-
tions. Given the obvious wealth discrepan-cies, these results seem qualitatively reason-
able, but much work remains to be done to
better understand stocks from a spatial (orspatial analytical level) perspective. An addi-tional factor is that taking into account an en-
tire nation may increase the per capita in-usestock due to infrastructure and other in-use
final goods that occur only in sparsely pop-ulated areas. Such final goods may include
ships, large trucks, heavy industrial equip-ment, offshore drilling equipment, railways,
military hardware, and aircraft.
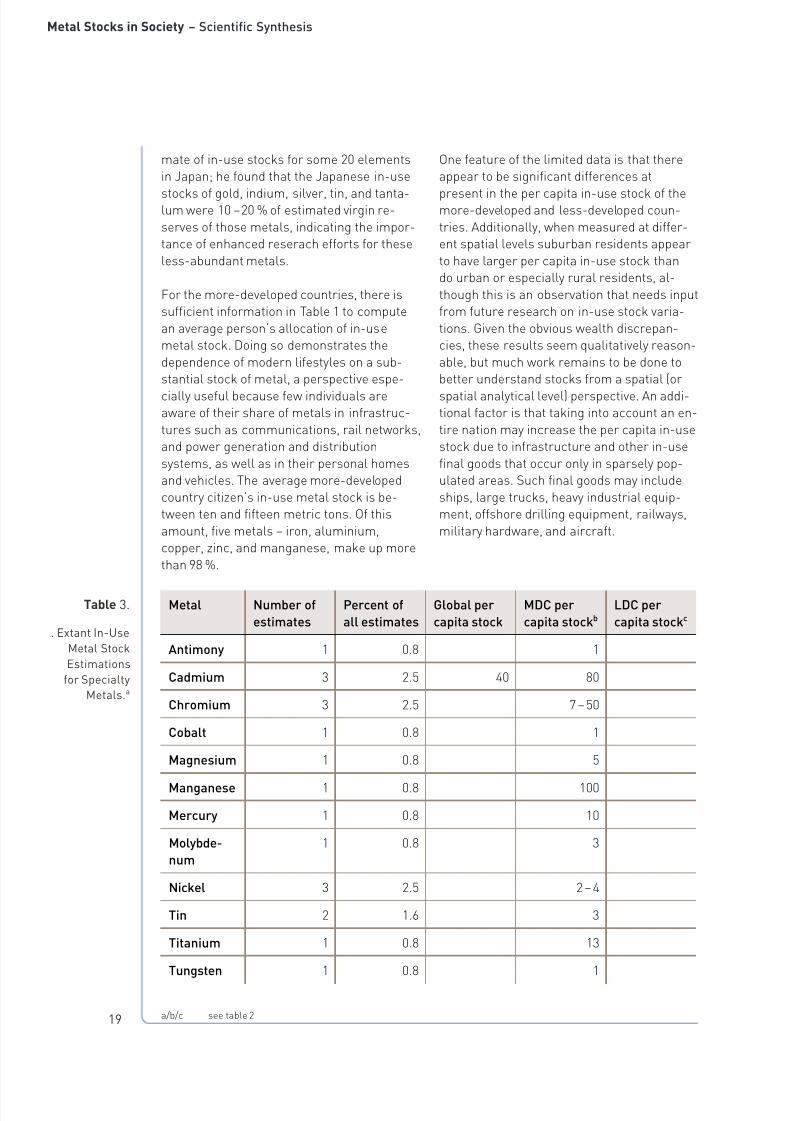
Metal Number of
estimates
Percent of
all estimates
Global per
capita stock
MDC per
capita stockb
LDC per
capita stockc
Antimony 1 0.8 1
Cadmium 3 2.5 40 80
Chromium 3 2.5 7 – 50
Cobalt 1 0.8 1
Magnesium 1 0.8 5
Manganese 1 0.8 100
Mercury 1 0.8 10
Molybde-
num
1 0.8 3
Nickel 3 2.5 2 – 4
Tin 2 1.6 3
Titanium 1 0.8 13
Tungsten 1 0.8 1
a/b/c see table 2
Table 3.
. Extant In-Use
Metal Stock
Estimations
for Specialty
Metals.a

7/24/2019 UNEP Report1 Stocks 100920
http://slidepdf.com/reader/full/unep-report1-stocks-100920 22/52
20
Metal Stocks in Society – Scientific Synthesis
For perhaps only copper, iron, aluminium,and lead, and only for the more-developed
countries, can we feel we have enough infor-mation to give us a reliable estimate of the
stocks of metal in use. Nonetheless, the or-der of magnitude of in-use stocks, for those
metals, at least, can readily be appreciatedfrom the information assembled herein.
4.2 Stocks in Unmined Ores(“Resources” of Metals)
This subject will be addressed in a future re-port of the Global Metal Flows Group and isnot discussed herein.
4.3 Stocks in Tailings
The metal contents of tailings are highly de-pendent on the efficiency of the separation
process applied to the ore that was mined.Modern mines measure the metals concen-
trations in tailings discards, but the informa-
tion is generally proprietary. We know of nostock estimates at levels higher than individ-ual processing facilities.
4.4 Stocks in Processing Facilities
No general information is available on proc-essor stockpiles. Most material moves rapid-
ly through processing facilities, so the quanti-ties in these stockpiles are probably relatively
small.
4.5 Government Stockpiles
At least three governments, Japan, China,
and the United States, are known to main-tain stockpiles of selected metals. Those
for Japan are reported to be completed byY. Moriguchi. There is no official informa-
tion on China’s stockpiles, though some es-timates are made (Shanghai Metal Corpora-
tion, 2008). Those for the United States arereported in USGS (2008 and preceding years).
4.6 Stocks in ManufacturingFacilities
No general information is available on man-
ufacturer stockpiles. Most material movesrapidly through processing facilities, so the
quantities in these stockpiles are probablyrelatively small.
4.7 Stocks in Recycling Facilities
No general information is available on recy-
cler stockpiles. Most material moves rapidlythrough processing facilities, so the quanti-ties in these stockpiles are probably relatively
small.
4.8 Landfill Stockpiles
Little information is available on the amount
and location of metals in landfills. We areaware of only two estimates: for iron in U.S.
landfills (850 Tg Fe; Müller et al., 2006), and
for copper in global landfills (225 Tg Cu; Ka-pur, 2004). These amounts are relativelylarge, but the material in landfills is wide-
ly dispersed and resides in discarded prod-ucts rather than ores. There are no instanc-
es of any significance where metal has beenrecovered from landfill stocks. In the case of
materials whose use is increasingly regulat-ed (e. g., mercury and cadmium), the landfill
stock may, over time, exceed the stock in use.

7/24/2019 UNEP Report1 Stocks 100920
http://slidepdf.com/reader/full/unep-report1-stocks-100920 23/52
21
Metal Stocks in Society – Scientific Synthesis

7/24/2019 UNEP Report1 Stocks 100920
http://slidepdf.com/reader/full/unep-report1-stocks-100920 24/52
22
Metal Stocks in Society – Scientific Synthesis
Outflows (if recycled) from in-use stock rep-resent a resource that decreases the require-
ments for mining of virgin material (as wellas the associated environmental consequenc-
es). Although the amount of outflow (the “sec-ondary material”) that is supplied to smelters
and refiners is generally measured, the out-flow itself is not, so must be computed.
The outflow computation requires dynam-
ic information on inflows over a number ofyears, plus estimates of the fractions of that
flow entering each of the major uses, plusestimates of the average lifetimes of those
uses, as shown in Figure 3.
It is important to mention that the potentialrecyclability of the several individual outflows
can be quite different. For example, the re-covery efficiency of copper from infrastruc-
ture is much more efficient than from elec-tronics. In the recycling report of this work-
ing group (to be completed), these issues willbe addressed in some detail. In most uses,
some metal is lost to the environment byprocesses such as dissipation or corrosion.
The amounts are quite small relative to otherflows, however (e. g., Wang et al., 2007; Mao
et al., 2008), and can be neglected for pur-poses of assessing metal stocks in society.
5. Outflows from In-Use Stocks
Figure 3.
A schematic
diagram of the
methodology
for calculating
outflows from
in-use stocks.
7/24/2019 UNEP Report1 Stocks 100920
http://slidepdf.com/reader/full/unep-report1-stocks-100920 25/52
23
Metal Stocks in Society – Scientific Synthesis
6. Potential Users
of In-Use StockInformation
Mining Industries. The mining industries ex-
tract and concentrate minerals. Their opera-tions often produce a number of by-product
metals as a result of mineral associations inthe ore. The interest of this sector is prima-
rily in the sustainability of metal markets and
in the future demand for virgin metals, a de-mand that is enhanced by increasing per cap-ita resource intensity throughout the world
and reduced by recycled scrap that can sub-stitute for virgin metal. Perspectives poten-
tially useful to these industries include metalin-use stock estimates to measure the stock
of metal required to deliver any given serviceto a population, and the creation of scenarios
of potential metal demand based on differentassumptions of technology choice, population
growth, and other relevant parameters such
as the substitution for certain major uses ofthe metal by other metals or manmade ma-terials (as in the substitution of copper elec-
trical wire by aluminium wire). The paucity ofin-use stock estimates, a lack of metal de-
mand scenarios, and the absence of stockdiscard scenarios have to date prevented
these industries from utilizing in-use stockinformation in these ways. All these consid-
erations apply as well to countries for whichmining is an important part of the national
economy, especially if the mines are undergovernmental control.
Metal Production Industries. These indus-
tries produce metal from either ore or recy-cled scrap into metal of desired purity. They
could benefit from scenarios of discards fromstock in use, especially if the form of the
metal (alloy, coated metal, etc.) were part ofthe scenario. Current in-use stock studies
provide the basis for scenario development,but the analyses remain to be done.
Waste Management and Scrap Industries.
The primary function of the waste manage-
ment and scrap industries is to recover met-als and minimize their loss to the environ-
ment. The factors determining which path ametal might take include the concentration
and speciation of metal in discarded goods,the ease of separation and concentration,
and by what manner the metal is discarded(separated or mixed). Thus, waste manage-
ment and scrap industries have as their ba-sic inputs materials which are spatially-het-
erogeneous and that embody a significant
amount of uncertainty with regard to materialcontent and timing of discard. Here, in-usestock information in itself is not of value here,
but discard scenarios linked to in-use stockwith relatively high temporal and spatial res-
olution could be.
Public Health and Environmental Agencies. Unlike the potential users discussed above,
who are concerned with the quantity andform of metals recovered at discard, these
agencies are concerned with the quantity and
form of metals that are discarded or dissipat-ed and not recovered. As with the waste man-agement industries, they would value discard
scenarios with high spatial resolution, in or-der to predict effects on public health and/or
the environment.
Public Policy Organizations. These organiza-tions are diverse, with many different goals.
Economic and national security policy-mak-ers are often concerned with having adequate
scrap supply for certain metals in the caseof disruption of trade in either metal com-
modities or final goods containing metals.Environmental policy-makers, at least in the
context of resource efficiency, are concernedwith promoting the environmental benefits
of metal recycling, a goal that would be bet-ter enabled by discard data and/or scenarios
with high spatial resolution.
7/24/2019 UNEP Report1 Stocks 100920
http://slidepdf.com/reader/full/unep-report1-stocks-100920 26/52
24
Metal Stocks in Society – Scientific Synthesis
Anthropogenic metal stock estimation hasthe potential to address several interesting
and pertinent questions concerning the fu-ture of metal use in society and associated
environmental impacts, such as:
■ Patterns in the way different societies ornations use, accumulate, and discard met-
al that is relevant to investigating futuredemand scenario
■ The comparative quality and amount of
metal in natural and anthropogenic stocks,and the potential of this information to in-
form discussions large-scale mining ofcities?
■ Ways in which the scale of environmental
impacts from dissipative uses (corrosion,wear, etc.) change with increasing popula-
tion growth and affluence?
■ Scrap generation rate predictions (nation-al, regional, global), and the virgin mate-
rial demand offset that this scrap wouldprovide
■ Stimulating the development of effective
public policy to increase collection andrecovery.
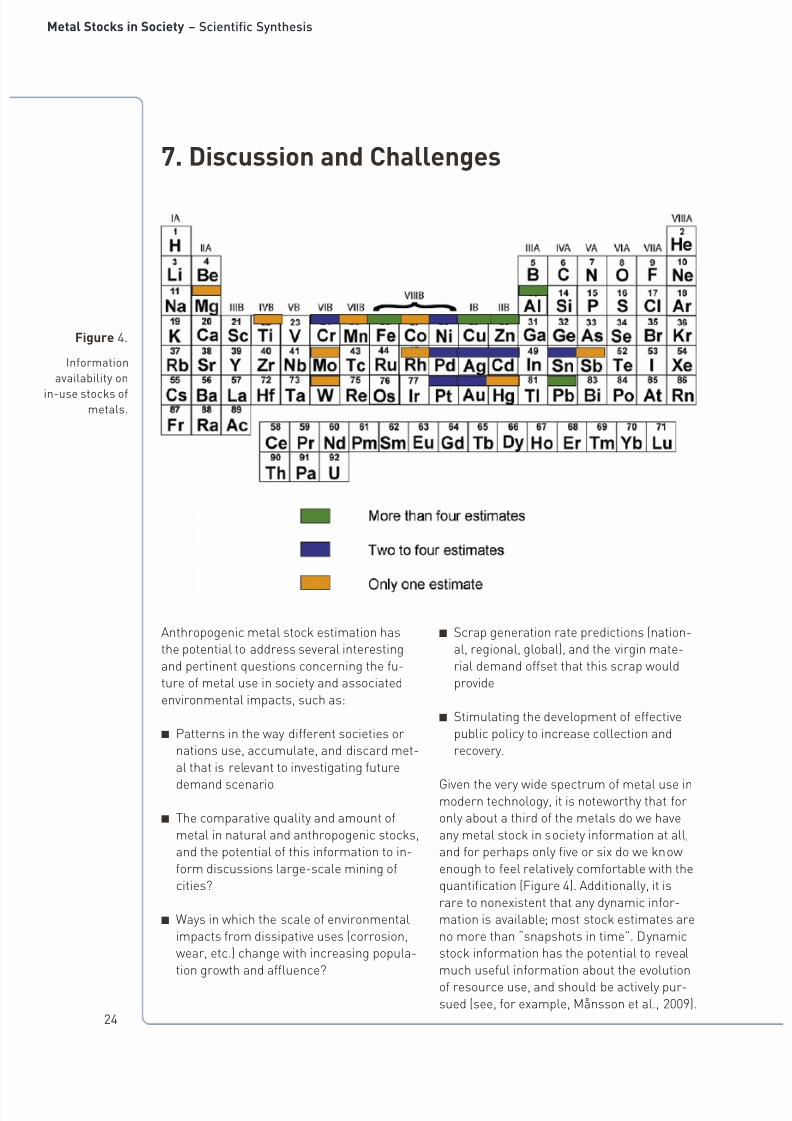
Given the very wide spectrum of metal use in
modern technology, it is noteworthy that foronly about a third of the metals do we have
any metal stock in society information at all,and for perhaps only five or six do we know
enough to feel relatively comfortable with thequantification (Figure 4). Additionally, it is
rare to nonexistent that any dynamic infor-mation is available; most stock estimates are
no more than “snapshots in time”. Dynamicstock information has the potential to reveal
much useful information about the evolutionof resource use, and should be actively pur-
sued (see, for example, Månsson et al., 2009).
7. Discussion and Challenges
Figure 4.
Information
availability on
in-use stocks of
metals.

7/24/2019 UNEP Report1 Stocks 100920
http://slidepdf.com/reader/full/unep-report1-stocks-100920 27/52
25
Metal Stocks in Society – Scientific Synthesis
There are what seem to be obvious gaps inthe information available for materials used
in large quantities. For example, there ap-pears to exist no global estimate for zinc
stocks in society. Neither are there globalstock estimates for the major alloying metals
chromium, manganese, nickel, and tin, andonly a few at country level for these metals.
The stocks of magnesium, a light metal see-ing increasing use in reduced-weight vehi-
cles, have been evaluated only in Japan. Foruranium and zirconium, necessary elements
for nuclear power, there are no extant stock
estimates at all.
Anthropogenic stock estimates of the spe-
cialty metals are almost nonexistent. Thissituation is partly due to lack of data, partly to
lack of interest in such studies in the past fewdecades. One might target for attention the
lanthanides (separately or as a group), whichsee extensive use in electronics and medical
equipment, and indium, an element essen-tial at present for flat-panel displays, and one
perceived to be under supply pressure as it
is only available as a byproduct of zinc oreprocessing (Fraunhofer Institute for Systemsand Innovation Research, 2009).
Another obvious area of need is anthropo-
genic stock studies focused on less-devel-oped countries. The gaps between the stocks
of those countries and those of more-devel-oped countries have much to tell us about
potential future demands for resources, butlittle effort is underway to fill those knowl-
edge gaps.
Quantification of metal stocks in society islimited by the availability of data in most cas-
es. Information on flows into use is generallybetter than on flows out of use. Were govern-
ments to routinely collect discard, recycling,and waste data, in-use stock estimates could
be significantly improved.
It is notable that very few studies of in-usestocks make any attempt to discuss or esti-
mate uncertainty. Unlike laboratory systemswhere uncertainty can be rather precisely
determined, in-use stock uncertainty is re-
lated to such factors as the average lifetimesof different products groups and the elemen-
tal compositions of buildings and equipment,which have significant but poorly determined
variability. Some researchers (e. g., Ros-tkowski et al., 2007) have discussed potential
sources of error in these studies. It is thoughtthat recent stock estimates are accurate to
perhaps +/- 25 %, and such accuracies areperfectly adequate bases on which to base
public policy.
An avenue of research yet to be extensive-
ly explored is that of spatially-explicit in-usestock estimation. van Beers and Graedel(2007) have shown in a bottom-up study that
relatively fine spatial resolution can be ob-tained through the utilization of GIS and spa-
tially-explicit stock and population data. A re-cent study by Terakado et al. (2009) attempt-
ed to estimate the spatial distribution of thein-use stock of copper in Japan by utiliza-
tion of nocturnal light images from satellite.This appears to be the first effort to exploit
the combination of GIS and remote sensing
for inferring in-use metal stock. Such workcould be advantageous, as the results couldbe linked with other spatial attributes useful
to decision makers.
It is worth noting that a variety of spatialboundaries have been the subject of anthro-
pogenic stock studies, and one could askwhat makes the choice of a city or any other
geopolitical border appropriate for a stockstudy? The answer depends on the problem
for which the in-use stock estimate is to beused. If one seeks to create a map of in-use
stock for the purpose of providing insight intofuture scrap flows, then a geopolitical or any
other sort of spatial boundary seems appro-priate. Similarly, city boundaries are useful
in employing in-use stock studies to estimatedissipative outflows (e. g., Sörme and La-
gerkvist, 2002; McKenzie et al., 2009) How-ever, if one seeks to infer conclusions about
population affluence via in-use stock, a sys-tem that (such as city borders) is too small
might be inappropriate for some metals. Forexample, a small spatial boundary might be
appropriate for a metal which is mostly con-
7/24/2019 UNEP Report1 Stocks 100920
http://slidepdf.com/reader/full/unep-report1-stocks-100920 28/52
26
Metal Stocks in Society – Scientific Synthesis
tained in residential buildings, but not formetals which have significant stocks in in-
frastructure or manufacturing equipmentthat could be outside of the city border. Even
if a spatial boundary as large as a country ischosen, stocks in a different country or con-
tinent, such as manufacturing equipment,could still be thought of as being used by the
population in the system boundary. The sameis true of metal in potentially mineable tail-
ings. The answer could be to consider theseas “hidden” stocks, much as the concept of
hidden flows has been developed in the ma-
terial flow analysis literature (Adriaanse etal., 1997).
All of the gaps discussed above are unlikelyto be filled very soon unless more research-
ers become involved and unless more finan-cial support for their efforts is forthcom-
ing. At present, nearly all the anthropogen-ic stocks research is occurring in one small
group each in Japan and the USA, and occa-sional efforts by groups in Europe. The scale
of the need clearly outweighs the resources
and staff currently striving to fill that need.
All potential applications of in-use stock in-formation can benefit from significant im-
provements in the science of producing in-use stock estimates. First, the overall meth-
odology would benefit from a blending of thetop-down and bottom-up methods, incorpo-
rating the detail of bottom-up methods withthe temporal aspect of top-down methods.
(Only one study that compares results of bothmethods in a specific location (China in 2005;
Wang et al., 2009) is known to us. It is en-couraging that the methods give very similar
results.) Second, the regional specificity must
increase. A large majority of the studies re-viewed are from developed countries, whosevalues are not representative of developing
countries. Third, spatial resolution and great-er disaggregation of final goods categories
will become increasingly important for someend-users. And fourth, a common focus for
future research is a more directed approachto quantifying and communicating uncertain-
ty and validation of results. These four re-search foci have the potential to concentrate
research time and resources where they will
make the highest impact.

7/24/2019 UNEP Report1 Stocks 100920
http://slidepdf.com/reader/full/unep-report1-stocks-100920 29/52
27
Metal Stocks in Society – Scientific Synthesis
8. Conclusions
This report brings together the extant in-
formation on stocks of metals in society. Insome cases, a good deal of consistency is
shown to exist. In other cases, it is clear thatthe stocks have yet to be well characterized.
A review of potential users makes it clear thatin-use stock information by itself has limit-
ed utility. It is when this information is usedto generate scenarios of future use intensi-
ty, discard, and reuse, with good spatial and
temporal resolution and final good disaggre-gation, that its value is manifest. Such dataand scenarios are now beginning to appear.
In providing perspective and relative magni-tudes, the results here thus are of inherent
use as they stand, but they point as well to alarge challenge ahead – to do a better job of
evaluating stocks and their rates of growthand decay, and to use that information to
make informed inferences about the future.Only by so doing can a fully adequate picture
be created of the rich “anthropogenic mines”
that have the potential to be tapped as sourc-es of metal for the uses of modern society.
7/24/2019 UNEP Report1 Stocks 100920
http://slidepdf.com/reader/full/unep-report1-stocks-100920 30/52
28
Metal Stocks in Society – Scientific Synthesis
References
Adriaanse, A.; Bringezu, S.; Hammond, A.;
Moriguchi, Y.; Rodenburg, E.; Rogich, D.;Schütz, H., Resource Flows: The Material Ba-
sis of Industrial Economies, Washington, DC:World Resources Institute, 1997.
Brunner, P.H.; Rechberger, H., Practical
Handbook of Material Flow Analysis, BocaRaton, FL: Lewis Publishers, 2004.
Dubreuil, S. Young, J. Atherton, and T.P. Glo-ria, Metals recycling maps and allocationprocedures in life cycle assessment, In prep-
aration, 2009.
Fraunhofer Institute for Systems and Innova-tion Research, Raw Materials for Emerging
Technologies, Karlsruhe, 2009.
Gerst, M.D.; Graedel, T.E., In-use stocksof metals: Status and implicaitions, En-
vironmental Science & Technology, 42,
7038 – 7045, 2008.
Gibson, C.C.; Ostrom, E., Ahn, T.K., The con-
cept of scale and the human dimensions ofglobal change: A survey, Ecological Econom-
ics, 2000, 32, 217 – 239.
Halada, K., M. Shimada, and K. Ijima: Fore-casting of the consumption of metals up to
2050, Materials Transactions, 50, 453 – 460,2009.
Hashimoto, S., H. Tanikawa, and Y. Moriguchi,
Where will the large amounts of materialsaccumulated within the economy go? A ma-
terial flow analysis of construction materials,
Waste Management, 27, 1725 – 1738, 2007.
Hedbrant, J., and L. Sörme, Data vagueness
and uncertainties in urban heavy metal datacollection, Water, Air, and Soil Pollution Fo-
cus, 1, 43 – 53, 2001.
Kapur, A., The Future of the Red Metal: Sce-nario Analysis and Implications for Policy,
PhD Dissertation, Yale University, 2004.
Mao, J.S., J. Dong, and T.E. Graedel, Themultilevel cycle of anthropogenic lead. II. Re-
sults and discussion, Resources, Conserva-tion, and Recyling, 52, 1050 – 1057, 2008.
Månsson, N., B. Bergbäck, and L. Sörme,
Phasing out cadmium, lead, and mercury: Ef-fects on urban stocks and flows, Journal of
Industrial Ecology, 13, 94 – 111, 2009.
McKenzie, E., J. Money, P. Green, and T.Young, Metals associated with stormwater-
relevant brake and tire samples, Science ofthe Total Environment, 407, 5855 – 5860, 2009.
Müller, D.B.; Wang, T.; Duval, B.; Graedel,
T.E., Exploring the engine of anthropo-genic iron cycles, Proceedings of the Na-
tional Academy of Sciences, 2006, 103,16111 – 16116.
Rostkowski, K., J. Rauch, K. Drakonakis, B.Reck, R.B. Gordon, and T.E. Graedel, “Bot-tom-up” study of in-use nickel stocks in New
Haven, CT, Resources, Conservation, and Re-cycling, 50, 58 – 70, 2007.
Ruhrberg, M., Assessing the recycling effi-
ciency of copper from end-of-life products inWestern Europe, Resources, Conservation,
and Recycling, 2006, 48, 141 – 165.
Shanghai Metal Corporation, China state re-serve may boost copper stockpile by 74 %,
http://www.shanghaimetal.com/news-detail/China_State_Reserve_May_Boost_Copper.
htm (accessed Jan. 11, 2008).
Sörme, L., and R. Lagerkvist, Soruces ofheavy metals in urban wastewater in Stock-
holm, Science of the Total Environment, 298,131 – 145, 2002.
7/24/2019 UNEP Report1 Stocks 100920
http://slidepdf.com/reader/full/unep-report1-stocks-100920 31/52
29
Metal Stocks in Society – Scientific Synthesis
Terakado, R.; Takahashi, K.I.; Nakamura, J.;Daigo, I.; Matsuno, T.; Adachi, T., Calculation
of in-use stock of copper with nocturnal lightimage by DMSP/OLS, Abstract 23, Conac-
count, 2008.
United States Geological Survey, MineralCommodity Summaries; Department of the
Interior: Washington, D.C., 2008.
van Beers, D.; Graedel, T.E., Spatial charac-terization of multi-level in-use copper and
zinc stocks in Australia, Journal of Cleaner
Production, 2007, 15, 849 – 861.
Wang, T., Forging the Anthropogenic Iron Cy-
cle, Ph.D. Dissertation, Yale University, 2009.
Wang, T., D.B. Müller, and T.E. Graedel,Forging the anthropogenic iron cycle, En-
vironmental Science & Technology, 41,5120 – 5129, 2007.
7/24/2019 UNEP Report1 Stocks 100920
http://slidepdf.com/reader/full/unep-report1-stocks-100920 32/52
30
Metal Stocks in Society – Scientific Synthesis
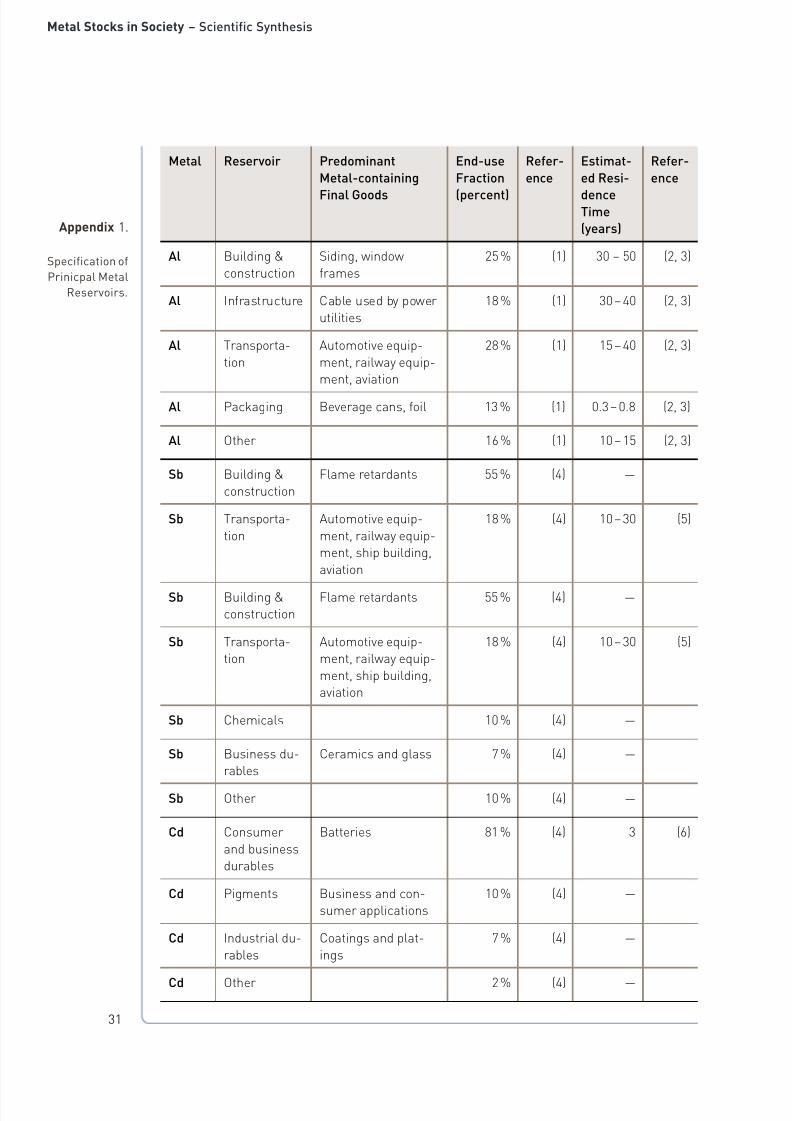
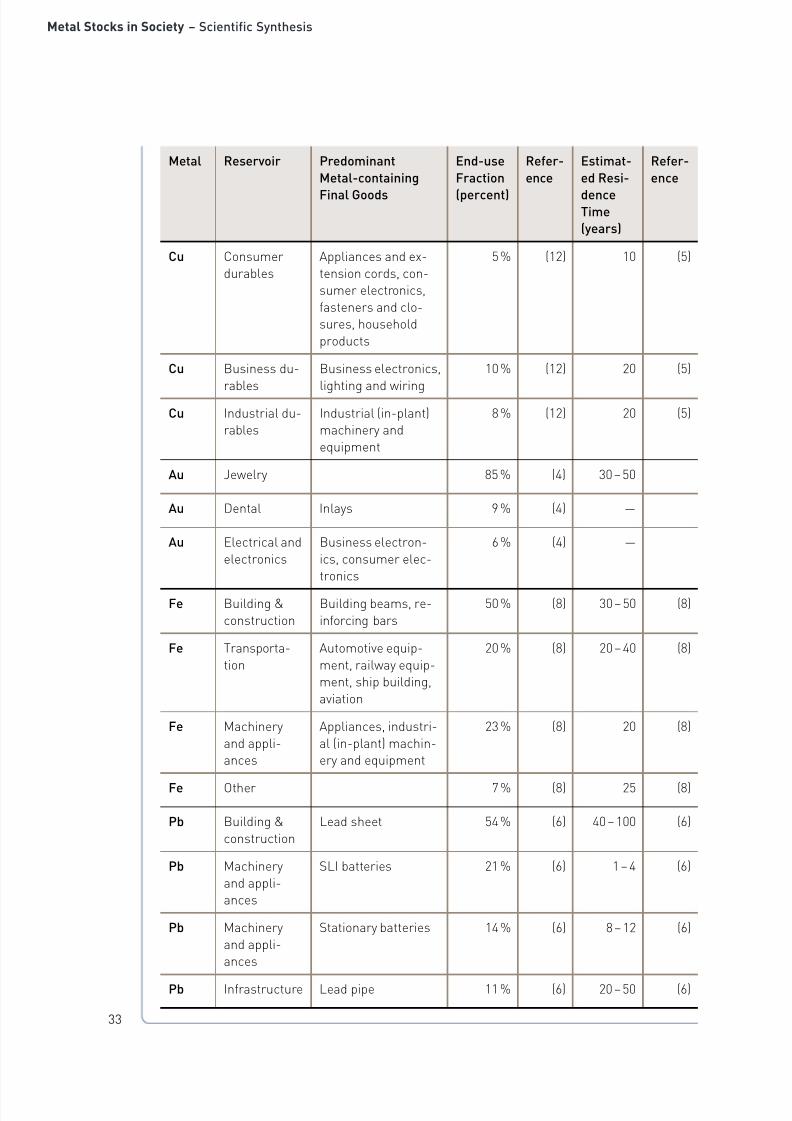
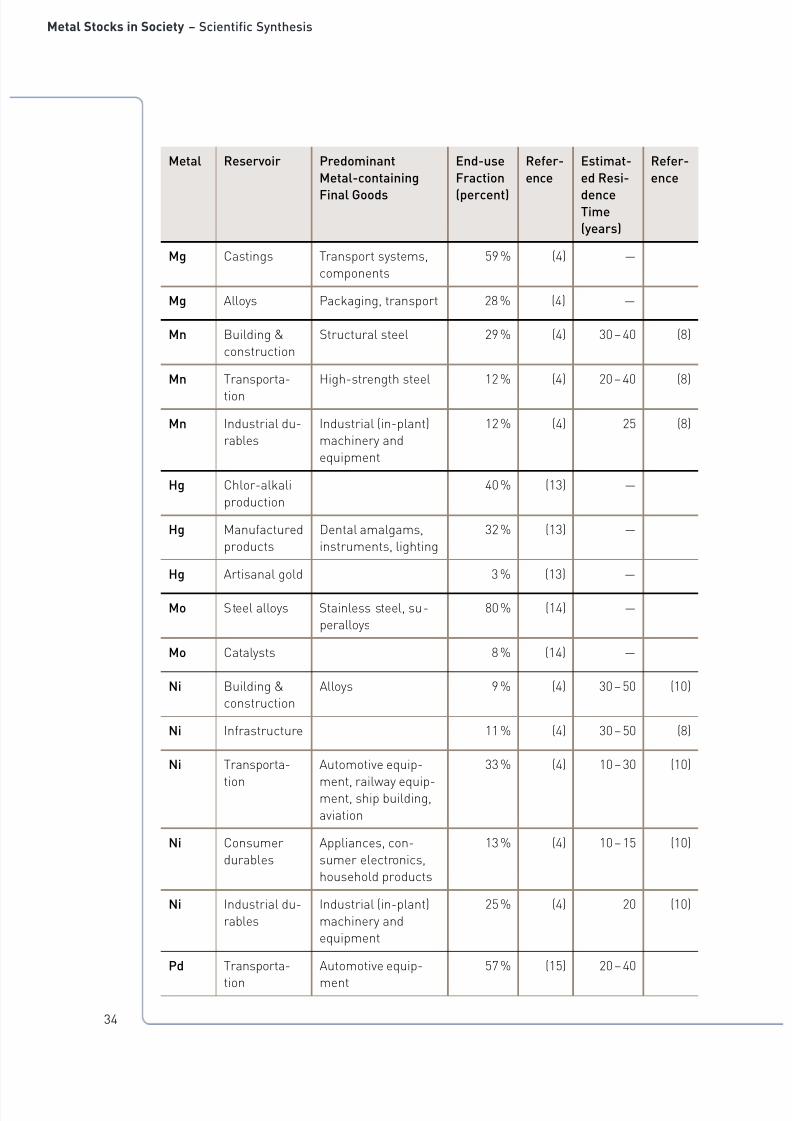
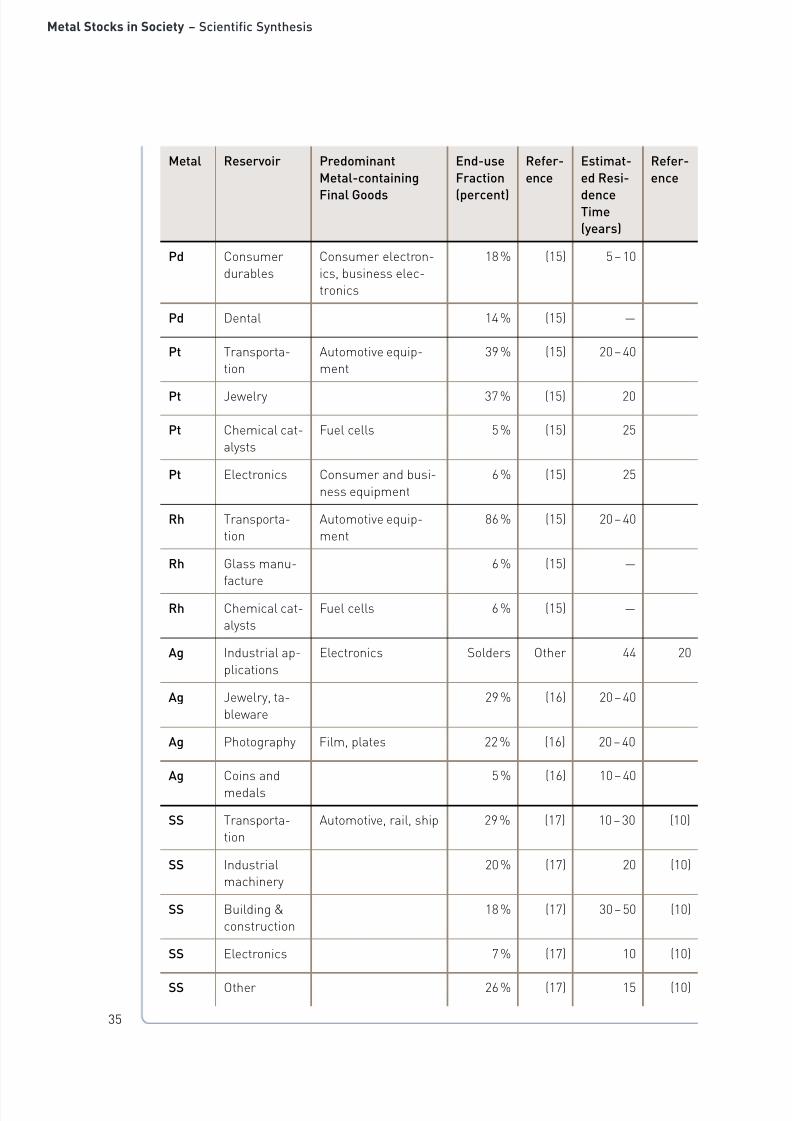
Appendices
The Appendices for this paper consists of two
tables. The first provides background infor-mation for each metal in the study. The head-
ings of these tables are defined as follows:
Metal: Scientific abbreviation of element (ex-cept for steel and stainless steel, which are
denoted by ST and SS, respectively)
Reservoir: A category which groups a collec-
tion of related final goods in which a metalresides in-use.
Predominant final goods: Major final goodswithin a reservoir category.
End-use fraction: As of 2006, the weight per-
centage of metal produced that is an inflowfor each reservoir. Percentages refer to spe-
cific metal. For example, the 25% listed foraluminum that will be used for building and
construction means that 25% of aluminum
inflow will go into building and construction.
Estimated residence time: Amount of time (inyears) that a metal will remain in stock be-
fore being discarded. Values are taken fromthe literature. In the case where a value could
not be obtained, a dash is used.
The second table provides information on
each in-use stock estimate collected fromthe literature.
7/24/2019 UNEP Report1 Stocks 100920
http://slidepdf.com/reader/full/unep-report1-stocks-100920 33/52
31
Metal Stocks in Society – Scientific Synthesis
Metal Reservoir Predominant
Metal-containing
Final Goods
End-use
Fraction
(percent)
Refer-
ence
Estimat-
ed Resi-
denceTime
(years)
Refer-
ence
Al Building &
construction
Siding, window
frames
25 % (1) 30 – 50 (2, 3)
Al Infrastructure Cable used by power
utilities
18 % (1) 30 – 40 (2, 3)
Al Transporta-
tion
Automotive equip-
ment, railway equip-
ment, aviation
28 % (1) 15 – 40 (2, 3)
Al Packaging Beverage cans, foil 13 % (1) 0.3 – 0.8 (2, 3)
Al Other 16 % (1) 10 – 15 (2, 3)
Sb Building &
construction
Flame retardants 55 % (4) —
Sb Transporta-
tion
Automotive equip-
ment, railway equip-ment, ship building,
aviation
18 % (4) 10 – 30 (5)
Sb Building &construction
Flame retardants 55 % (4) —
Sb Transporta-tion
Automotive equip-ment, railway equip-
ment, ship building,aviation
18 % (4) 10 – 30 (5)
Sb Chemicals 10 % (4) —
Sb Business du-
rables
Ceramics and glass 7 % (4) —
Sb Other 10 % (4) —
Cd Consumer
and businessdurables
Batteries 81 % (4) 3 (6)
Cd Pigments Business and con-sumer applications
10 % (4) —
Cd Industrial du-
rables
Coatings and plat-
ings
7 % (4) —
Cd Other 2 % (4) —
Appendix 1.
Specification of
Prinicpal Metal
Reservoirs.

7/24/2019 UNEP Report1 Stocks 100920
http://slidepdf.com/reader/full/unep-report1-stocks-100920 34/52
32
Metal Stocks in Society – Scientific Synthesis
Metal Reservoir Predominant
Metal-containing
Final Goods
End-use
Fraction
(percent)
Refer-
ence
Estimat-
ed Resi-
denceTime
(years)
Refer-
ence
Cr Building & in-
frastructure
Elevators, railways 25 % (7) 30 – 50 (8)
Cr Transporta-
tion
Automotive ex-
haust systems, rail-way equipment, ship
building, aviation
15 % (7) 30 for
planes,trains,
and ships
5-15
for au-tomo-
bilesand
parts
Cr Householdappliances &
electronics
Appliances, house-hold products
5 % (7) 15 (10)
Cr Metal goods
& other uses
Cutlery, fasteners 30 % (7) 5 – 15 (10)
Cr Industrial
machinery
Heat exchangers,
tanks
25 % (7) 20 (8)
Co Transporta-
tion
Automotive equip-
ment, railway equip-ment, ship building,aviation
43 % (4) 20 – 40 (8)
Co Chemicals 26 % (4) —
Co Cutting tools Blades, disks 22 % (4) 1 (11)
Co Industrial du-rables
Industrial (in-plant)machinery and
equipment
22 % (4) 20 (8)
Cu Building &construction
Building wire andcopper tube
50 % (12) 25 – 40 (5)
Cu Infrastructure Copper cable used bytelecom utilities and
power utilities
22 % (12) 50 (5)
Cu Transporta-
tion
Automotive equip-
ment, railway equip-ment, ship building,
aviation
5 % (12) 10 – 30 (5)
7/24/2019 UNEP Report1 Stocks 100920
http://slidepdf.com/reader/full/unep-report1-stocks-100920 35/52
33
Metal Stocks in Society – Scientific Synthesis
Metal Reservoir Predominant
Metal-containing
Final Goods
End-use
Fraction
(percent)
Refer-
ence
Estimat-
ed Resi-
denceTime
(years)
Refer-
ence
Cu Consumer
durables
Appliances and ex-
tension cords, con-sumer electronics,
fasteners and clo-sures, household
products
5 % (12) 10 (5)
Cu Business du-
rables
Business electronics,
lighting and wiring
10 % (12) 20 (5)
Cu Industrial du-rables
Industrial (in-plant)machinery and
equipment
8 % (12) 20 (5)
Au Jewelry 85 % (4) 30 – 50
Au Dental Inlays 9 % (4) —
Au Electrical and
electronics
Business electron-
ics, consumer elec-
tronics
6 % (4) —
Fe Building &
construction
Building beams, re-
inforcing bars
50 % (8) 30 – 50 (8)
Fe Transporta-
tion
Automotive equip-
ment, railway equip-ment, ship building,
aviation
20 % (8) 20 – 40 (8)
Fe Machinery
and appli-ances
Appliances, industri-
al (in-plant) machin-ery and equipment
23 % (8) 20 (8)
Fe Other 7 % (8) 25 (8)
Pb Building &
construction
Lead sheet 54 % (6) 40 – 100 (6)
Pb Machinery
and appli-ances
SLI batteries 21 % (6) 1 – 4 (6)
Pb Machinery
and appli-
ances
Stationary batteries 14 % (6) 8 – 12 (6)
Pb Infrastructure Lead pipe 11 % (6) 20 – 50 (6)
7/24/2019 UNEP Report1 Stocks 100920
http://slidepdf.com/reader/full/unep-report1-stocks-100920 36/52
34
Metal Stocks in Society – Scientific Synthesis
Metal Reservoir Predominant
Metal-containing
Final Goods
End-use
Fraction
(percent)
Refer-
ence
Estimat-
ed Resi-
denceTime
(years)
Refer-
ence
Mg Castings Transport systems,
components
59 % (4) —
Mg Alloys Packaging, transport 28 % (4) —
Mn Building &
construction
Structural steel 29 % (4) 30 – 40 (8)
Mn Transporta-tion High-strength steel 12 % (4) 20 – 40 (8)
Mn Industrial du-rables
Industrial (in-plant)machinery and
equipment
12 % (4) 25 (8)
Hg Chlor-alkali
production
40 % (13) —
Hg Manufacturedproducts
Dental amalgams,instruments, lighting
32 % (13) —
Hg Artisanal gold 3 % (13) —
Mo Steel alloys Stainless steel, su-peralloys
80 % (14) —
Mo Catalysts 8 % (14) —
Ni Building &construction
Alloys 9 % (4) 30 – 50 (10)
Ni Infrastructure 11 % (4) 30 – 50 (8)
Ni Transporta-
tion
Automotive equip-
ment, railway equip-ment, ship building,
aviation
33 % (4) 10 – 30 (10)
Ni Consumer
durables
Appliances, con-
sumer electronics,household products
13 % (4) 10 – 15 (10)
Ni Industrial du-
rables
Industrial (in-plant)
machinery andequipment
25 % (4) 20 (10)
Pd Transporta-tion
Automotive equip-ment
57 % (15) 20 – 40
7/24/2019 UNEP Report1 Stocks 100920
http://slidepdf.com/reader/full/unep-report1-stocks-100920 37/52
35
Metal Stocks in Society – Scientific Synthesis
Metal Reservoir Predominant
Metal-containing
Final Goods
End-use
Fraction
(percent)
Refer-
ence
Estimat-
ed Resi-
denceTime
(years)
Refer-
ence
Pd Consumer
durables
Consumer electron-
ics, business elec-tronics
18 % (15) 5 – 10
Pd Dental 14 % (15) —
Pt Transporta-tion
Automotive equip-ment
39 % (15) 20 – 40
Pt Jewelry 37 % (15) 20
Pt Chemical cat-
alysts
Fuel cells 5 % (15) 25
Pt Electronics Consumer and busi-
ness equipment
6 % (15) 25
Rh Transporta-tion
Automotive equip-ment
86 % (15) 20 – 40
Rh Glass manu-
facture
6 % (15) —
Rh Chemical cat-alysts
Fuel cells 6 % (15) —
Ag Industrial ap-
plications
Electronics Solders Other 44 20
Ag Jewelry, ta-
bleware
29 % (16) 20 – 40
Ag Photography Film, plates 22 % (16) 20 – 40
Ag Coins andmedals
5 % (16) 10 – 40
SS Transporta-tion
Automotive, rail, ship 29 % (17) 10 – 30 (10)
SS Industrialmachinery
20 % (17) 20 (10)
SS Building &construction
18 % (17) 30 – 50 (10)
SS Electronics 7 % (17) 10 (10)
SS Other 26 % (17) 15 (10)

7/24/2019 UNEP Report1 Stocks 100920
http://slidepdf.com/reader/full/unep-report1-stocks-100920 38/52
36
Metal Stocks in Society – Scientific Synthesis
Metal Reservoir Predominant
Metal-containing
Final Goods
End-use
Fraction
(percent)
Refer-
ence
Estimat-
ed Resi-
denceTime
(years)
Refer-
ence
Sn Cans and
containers
27 % (4) —
Sn Electrical and
electronics
23 % (4) —
Sn Construction Corrosion prevention 10 % (4) 30 – 50 (8)
Sn Transport Corrosion preven-tion, solder 10 % (4) 20 – 40 (5)
Ti Carbides,chemicals,
metal andmetal alloys
3 % (4) —
W Cutting tools 50 % (11) 1 (11)
W Lighting 22 % (11) —
Zn Building &construction
Galvanised steel(e.g., frames, pip-
ing), zinc alloys (e.g.,brass appliances),
and pure zinc (e.g.,roofing)
48 % (18) 10 – 50 (5, 8)
Zn Transporta-
tion
Motor vehicles, vehi-
cle tires, and railwaytransport, sea and
air transport
36 % (18) 2-20 (5, 8)
Zn Business du-
rables
Machinery 7 % (18) —
Zn Chemicals 5 % (18) —
7/24/2019 UNEP Report1 Stocks 100920
http://slidepdf.com/reader/full/unep-report1-stocks-100920 39/52
37
Metal Stocks in Society – Scientific Synthesis

7/24/2019 UNEP Report1 Stocks 100920
http://slidepdf.com/reader/full/unep-report1-stocks-100920 40/52
38
Metal Stocks in Society – Scientific Synthesis
Metal Locale Year In-use
Stock
Per
Capita
MassUnit
Refer-
ence
Al World 1947 2.2 kg (19)
Al World 2002 79 kg (20)
Al World 2003 82 kg (2)
Al Europe 2004 199 kg (1)
Al UK 1968 52 kg (21)
Al Japan 2000 343 kg (22)
Al USA 2000 483 kg (23)
Al China 2005 37 kg (24)
Al Connecticut, USA 2006 361 kg (25)
Sb Japan 2000 1.0 kg (22)
Cd World 1985 41 g (26)
Cd Steiermark, Austria 2003 320 g (27)
Cd Stockholm, Sweden 1995 79 g (28)
Cr Japan 2000 54 kg (22)
Cr Stockholm, Sweden 1995 8 kg (28)
Cr New Haven, USA 2005 7.1 kg (29)
Co Japan 2000 0.8 kg (22)
Cu World 1929 17 kg (30)
Cu World 1947 19 kg (19)
Cu World 1960 25 kg (31)Cu World 1994 55 kg (32)
Cu World 1998 35 kg (33)
Cu World 2000 50 kg (34)
Cu North America 1999 170 kg (5)
Cu Western Europe 1999 190 kg (35)
Cu USA 1932 73 kg (36)
Cu USA 1948 139 kg (37)Cu USA 1957 161 kg (38)
Appendix 2.
Per capita
in-use stock
estimates.
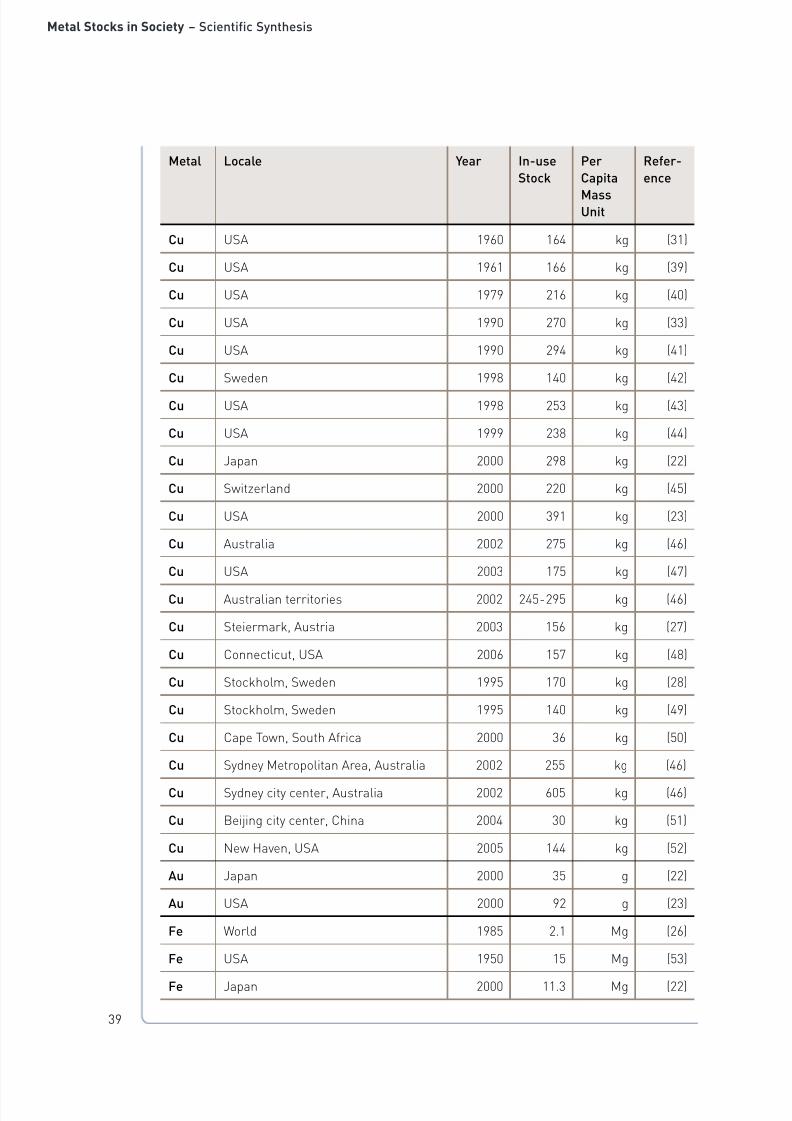
7/24/2019 UNEP Report1 Stocks 100920
http://slidepdf.com/reader/full/unep-report1-stocks-100920 41/52
39
Metal Stocks in Society – Scientific Synthesis
Metal Locale Year In-use
Stock
Per
Capita
MassUnit
Refer-
ence
Cu USA 1960 164 kg (31)
Cu USA 1961 166 kg (39)
Cu USA 1979 216 kg (40)
Cu USA 1990 270 kg (33)
Cu USA 1990 294 kg (41)
Cu Sweden 1998 140 kg (42)
Cu USA 1998 253 kg (43)
Cu USA 1999 238 kg (44)
Cu Japan 2000 298 kg (22)
Cu Switzerland 2000 220 kg (45)
Cu USA 2000 391 kg (23)
Cu Australia 2002 275 kg (46)
Cu USA 2003 175 kg (47)
Cu Australian territories 2002 245 - 295 kg (46)
Cu Steiermark, Austria 2003 156 kg (27)
Cu Connecticut, USA 2006 157 kg (48)
Cu Stockholm, Sweden 1995 170 kg (28)
Cu Stockholm, Sweden 1995 140 kg (49)
Cu Cape Town, South Africa 2000 36 kg (50)
Cu Sydney Metropolitan Area, Australia 2002 255 kg (46)Cu Sydney city center, Australia 2002 605 kg (46)
Cu Beijing city center, China 2004 30 kg (51)
Cu New Haven, USA 2005 144 kg (52)
Au Japan 2000 35 g (22)
Au USA 2000 92 g (23)
Fe World 1985 2.1 Mg (26)
Fe USA 1950 15 Mg (53)Fe Japan 2000 11.3 Mg (22)
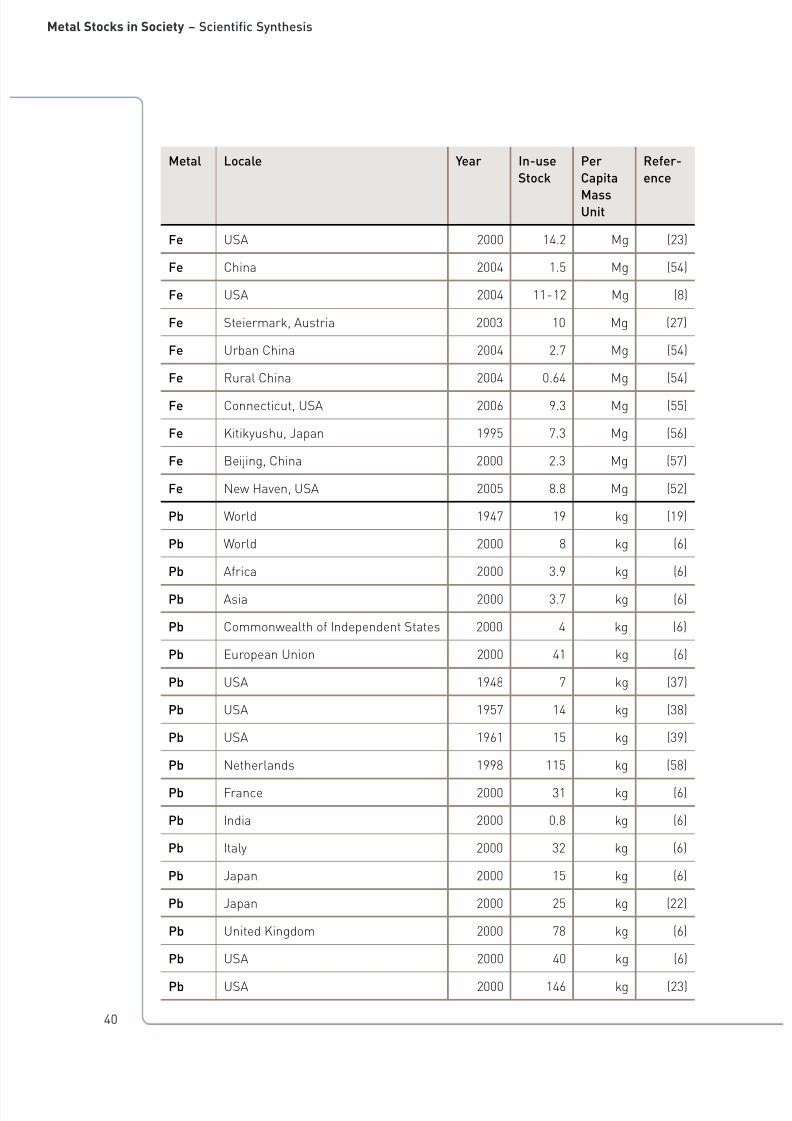
7/24/2019 UNEP Report1 Stocks 100920
http://slidepdf.com/reader/full/unep-report1-stocks-100920 42/52
40
Metal Stocks in Society – Scientific Synthesis
Metal Locale Year In-use
Stock
Per
Capita
MassUnit
Refer-
ence
Fe USA 2000 14.2 Mg (23)
Fe China 2004 1.5 Mg (54)
Fe USA 2004 11 - 12 Mg (8)
Fe Steiermark, Austria 2003 10 Mg (27)
Fe Urban China 2004 2.7 Mg (54)
Fe Rural China 2004 0.64 Mg (54)
Fe Connecticut, USA 2006 9.3 Mg (55)
Fe Kitikyushu, Japan 1995 7.3 Mg (56)
Fe Beijing, China 2000 2.3 Mg (57)
Fe New Haven, USA 2005 8.8 Mg (52)
Pb World 1947 19 kg (19)
Pb World 2000 8 kg (6)
Pb Africa 2000 3.9 kg (6)
Pb Asia 2000 3.7 kg (6)
Pb Commonwealth of Independent States 2000 4 kg (6)
Pb European Union 2000 41 kg (6)
Pb USA 1948 7 kg (37)
Pb USA 1957 14 kg (38)
Pb USA 1961 15 kg (39)
Pb Netherlands 1998 115 kg (58)Pb France 2000 31 kg (6)
Pb India 2000 0.8 kg (6)
Pb Italy 2000 32 kg (6)
Pb Japan 2000 15 kg (6)
Pb Japan 2000 25 kg (22)
Pb United Kingdom 2000 78 kg (6)
Pb USA 2000 40 kg (6)Pb USA 2000 146 kg (23)
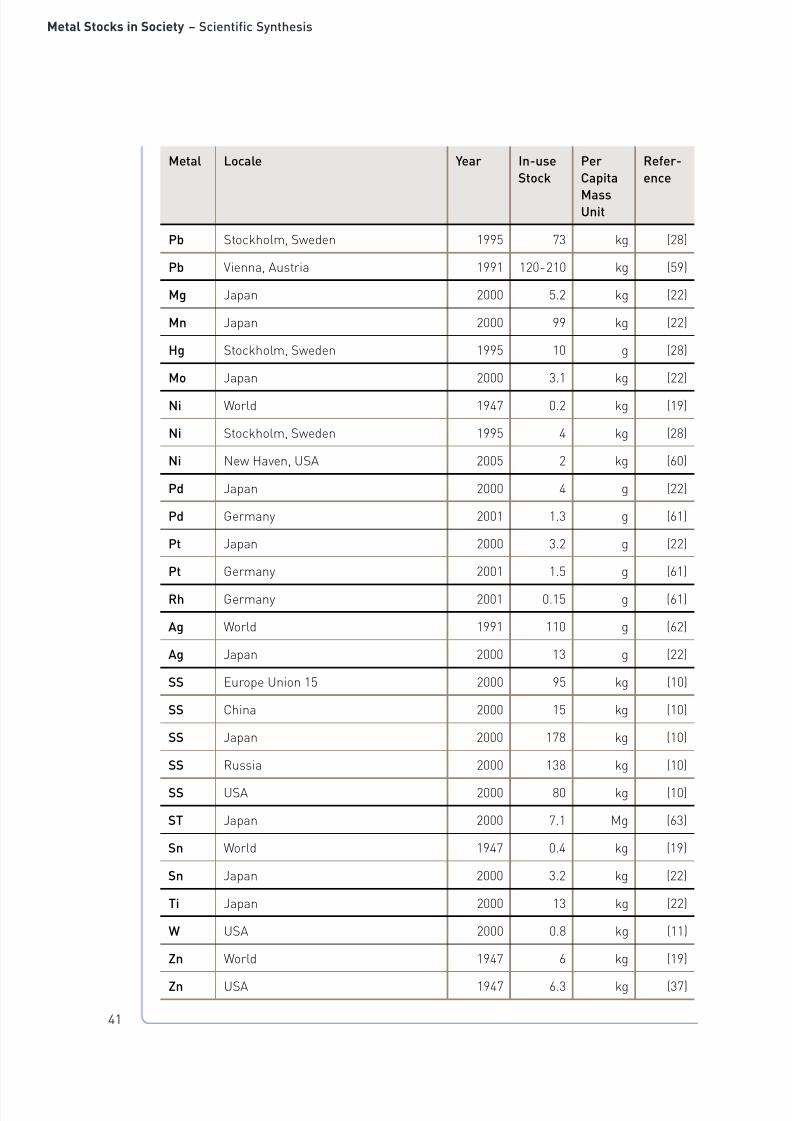
7/24/2019 UNEP Report1 Stocks 100920
http://slidepdf.com/reader/full/unep-report1-stocks-100920 43/52
41
Metal Stocks in Society – Scientific Synthesis
Metal Locale Year In-use
Stock
Per
Capita
MassUnit
Refer-
ence
Pb Stockholm, Sweden 1995 73 kg (28)
Pb Vienna, Austria 1991 120 - 210 kg (59)
Mg Japan 2000 5.2 kg (22)
Mn Japan 2000 99 kg (22)
Hg Stockholm, Sweden 1995 10 g (28)
Mo Japan 2000 3.1 kg (22)
Ni World 1947 0.2 kg (19)
Ni Stockholm, Sweden 1995 4 kg (28)
Ni New Haven, USA 2005 2 kg (60)
Pd Japan 2000 4 g (22)
Pd Germany 2001 1.3 g (61)
Pt Japan 2000 3.2 g (22)
Pt Germany 2001 1.5 g (61)
Rh Germany 2001 0.15 g (61)
Ag World 1991 110 g (62)
Ag Japan 2000 13 g (22)
SS Europe Union 15 2000 95 kg (10)
SS China 2000 15 kg (10)
SS Japan 2000 178 kg (10)
SS Russia 2000 138 kg (10)SS USA 2000 80 kg (10)
ST Japan 2000 7.1 Mg (63)
Sn World 1947 0.4 kg (19)
Sn Japan 2000 3.2 kg (22)
Ti Japan 2000 13 kg (22)
W USA 2000 0.8 kg (11)
Zn World 1947 6 kg (19)Zn USA 1947 6.3 kg (37)
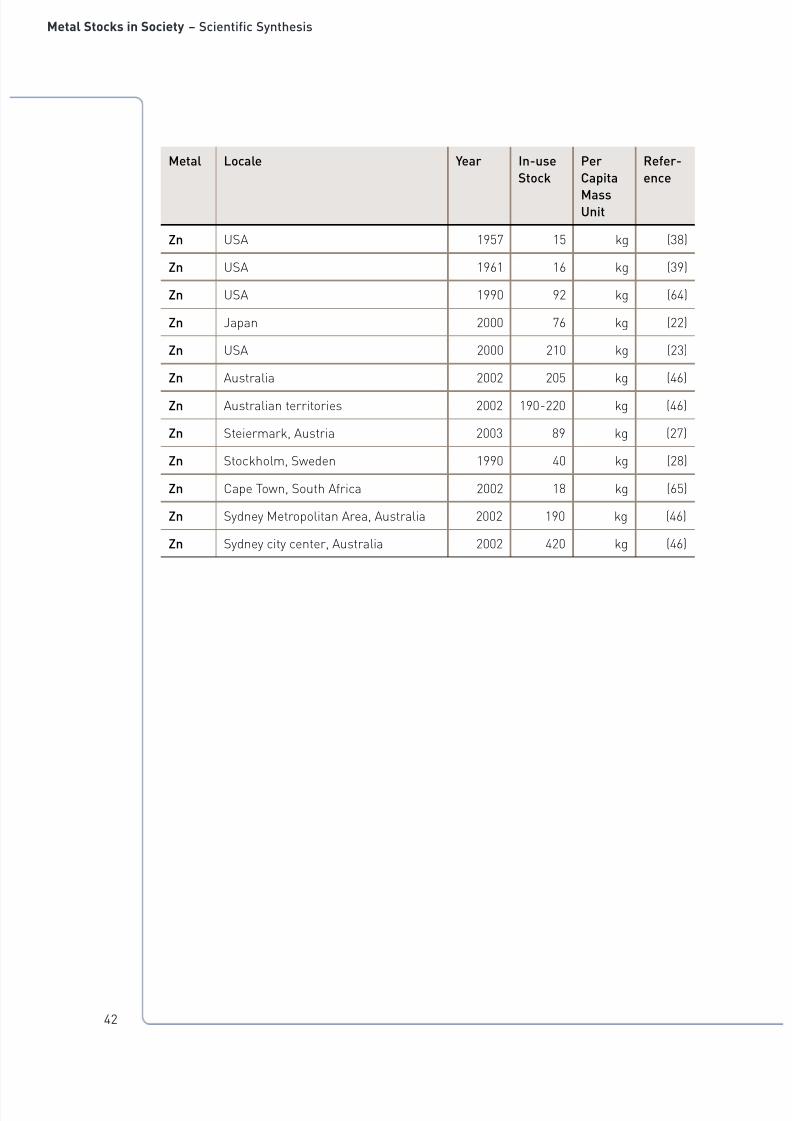
7/24/2019 UNEP Report1 Stocks 100920
http://slidepdf.com/reader/full/unep-report1-stocks-100920 44/52
42
Metal Stocks in Society – Scientific Synthesis
Metal Locale Year In-use
Stock
Per
Capita
MassUnit
Refer-
ence
Zn USA 1957 15 kg (38)
Zn USA 1961 16 kg (39)
Zn USA 1990 92 kg (64)
Zn Japan 2000 76 kg (22)
Zn USA 2000 210 kg (23)
Zn Australia 2002 205 kg (46)
Zn Australian territories 2002 190 -220 kg (46)
Zn Steiermark, Austria 2003 89 kg (27)
Zn Stockholm, Sweden 1990 40 kg (28)
Zn Cape Town, South Africa 2002 18 kg (65)
Zn Sydney Metropolitan Area, Australia 2002 190 kg (46)
Zn Sydney city center, Australia 2002 420 kg (46)
7/24/2019 UNEP Report1 Stocks 100920
http://slidepdf.com/reader/full/unep-report1-stocks-100920 45/52
43
Metal Stocks in Society – Scientific Synthesis
References of
Appendices
1. European Aluminum Association, Glo-
bal Aluminum Recycling: A Cornerstoneof Sustainable Development; Brussels,
2006.
2. Martchek, K., Personal communication,Alcoa Aluminum Company, 2006.
3. Melo, M. T., Statistical analysis of metalscrap generation: the case of aluminiumin Germany. Resources, Conservation and
Recycling 1999, 26, 91 – 113.
4. United States Geological Survey, MineralCommodity Summaries; Department of
the Interior: Washington, D.C., 2006.
5. Spatari, S.; Bertram, M.; Gordon, R. B.;Henderson, K.; Graedel, T. E., Twentieth
century copper stocks and flows in North
America: A dynamic analysis. EcologicalEconomics 2005, 54, 37 – 51.
6. Mao, J. S.; Graedel, T. E., Lead in-usestocks: A dynamic analysis. Journal of In-
dustrial Ecology 2009, 13, 112 – 126, 2009.
7. Johnson, J.; Schewel, L.; Graedel, T. E.,The Contemporary Anthropogenic Chro-
mium Cycle. Environmental Science &Technology 2006, 40, 7060 – 7069.
8. Müller, D. B.; Wang, T.; Duval, B.;
Graedel, T. E., Exploring the engine ofanthropogenic iron cycles. Proceedings of
the National Academy of Sciences 2006,103, 16111.
9. Papp, J., Personal communication, Unit-
ed States Geological Survey, 2006.
10. Teroerde, F., Personal communication,ELG Metals, Duisburg, Germany, 2006.
11. Harper, E. M., Illuminating tungsten’s lifecycle in the United States, 1975 – 2000,
Environmental Science & Technology, 42,3835 – 3842, 2008.
12. Joseph, G.; Kundig, K. J. A.; International
Copper Association., Copper: its trade,manufacture, use, and environmental
status. ASM International: MaterialsPark, Ohio, 1999; p vii, 451 p.
13. Sznopek, J. L.; Goonan, T. G., The Materi-
als Flow of Mercury in the Economies of
the United States and the World; Infor-mation Circular 1197; United States Geo-logical Survey: Washington, D.C., 2000.
14. International Molybdenum Association,
http://www.imoa.info (December 27,2008).
15. National Institute for Materials Science,
Worldwide Supply and Demand of Plati-num Group Metals and Trends in Recy-
cling of Autocatalyst in Japan; Tsukuba,
Japan, 2004.
16. Silver Institute, World Silver Survey; Lon-
don, 2005.
17. Kaumanns, P., Personal communica-tion, International Stainless Steel Forum,
Brussels, 2006.
18. Gordon, R. B.; Graedel, T. E.; Bertram,M.; Fuse, K.; Lifset, R.; Rechberger, H.;
Spatari, S., The characterization of tech-nological zinc cycles. Resources, Conser-
vation and Recycling 2003, 39, 107 – 135.
19. Miller, H. J. In The supply and industrialapplications of scrap metals, Proceedings
of the United Nations Scientific Confer-ence on the Conservation and Utilization
of Resources, Lake Success, New York,1949; United Nations Department of Eco-
nomic Affairs: Lake Success, New York,1949.
7/24/2019 UNEP Report1 Stocks 100920
http://slidepdf.com/reader/full/unep-report1-stocks-100920 46/52
44
Metal Stocks in Society – Scientific Synthesis
20. European Aluminium Association, Alu-minium Recycling: The Road to High
Quality Products; Brussels, 2004.
21. Chapman, P. F.; Roberts, F., Metal Re-sources and Energy. Butterworths: Lon-
don, 1983; p 238.
22. Murakami, S. In Material flows andstocks of metals surrounding Japan,
Symposium on Advanced Material FlowAnalysis for the Sustainable Society,
Sendai, Japan, 2006; Sendai, Japan, 2006;
pp 187 – 190.
23. Sullivan, D. E., Indicators of Stocks-in-
use in the United States for Aluminum,Copper, Gold, Iron, Steel, Lead, and Zinc.
Unpublished report; United States Geo-logical Survey: Washington, D.C., 2003.
24. Wang, J.; Graedel, T. E., Preliminary As-
sessment of In-Use Aluminum Stocks inChina. Unpublished report; Yale Center
for Industrial Ecology: New Haven, 2007.
25. Recalde, K.; Wang, J.; Graedel, T.E.,Aluminum Stocks in the State of Con-
necticut. Resources, Conservation, andRecycling, 52, 1271 – 1282, 2008.
26. Baccini, P.; Brunner, P. H., Metabolism
of the Anthroposphere. Springer-Verlag:Berlin, 1991; p 157.
27. Schöller, G.; Oberleitner, C.; Fehringer,
R.; Döberl, G.; Brunner, P. H., Verknüp-fung Rohstofflager – anthropogene Lager
– letzte Senken im Bundesland Steier-mark; Vienna University of Technology:
Vienna, 2006.
28. Sörme, L.; Bergbäck, B.; Lohm, U., Cen-tury perspective of heavy metal use in
urban areas. A case study in Stockholm.Water, Air, & Soil Pollution: Focus 2001,
1, 197 – 211.
29. Kwo, F., In-use Stocks of Chromium inNew Haven, Connecticut. Unpublished
report; Yale Center for Industrial Ecology:New Haven, 2006.
30. Bain, H. F., The rise of scrap metals. In
Mineral economics; lectures under theauspices of the Brookings institution,
1st ed.; Tryon, F. G.; Eckel, E. C., Eds.McGraw-Hill: New York, 1932; p 331.
31. McMahon, A. D., Copper: A Materials
Survey; United States Bureau of Mines:
Washington, D.C., 1965; p 340.
32. Kapur, A. The Future of the Red Metal:
Scenario Analysis and Implications forPolicy. Ph.D. Dissertation, Yale, New Ha-
ven, 2004.
33. Jolly, J. L. W., The US copper-base scrapindustry and its byproducts: An overview;
United States Geological Survey: Wash-ington, D.C., 1999.
34. Lichtensteiger, T., The Petrologic Evalua-tion. Springer-Verlag: Berlin, 2002.
35. Ruhrberg, M., Assessing the recyclingefficiency of copper from end-of-life
products in Western Europe. Resources,Conservation & Recycling 2006, 48,
141 – 165.
36. Ingalls, W. R. In The economics of oldmetals especially copper, lead, zinc, and
tin, Mining and Metallurgical Society ofAmerica, Columbia University Club, New
York, 1935; Columbia University Club,New York, 1935; pp 75 – 95.
37. Merrill, C. W. In The accumulation and
conservation of metals-in-use, Proceed-ings of the United Nations Scientific
Conference on the Conservation andUtilization of Resources, Lake Success,
New York, 1949; United Nations Depart-ment of Economic Affairs: Lake Success,
New York, 1949.
7/24/2019 UNEP Report1 Stocks 100920
http://slidepdf.com/reader/full/unep-report1-stocks-100920 47/52
45
Metal Stocks in Society – Scientific Synthesis
38. Merrill, C. W., The significance of themineral industries in the economy. In
Economics of the mineral industries; aseries of articles by specialists, 1st ed.;
Robie, E. H., Ed. American Institute ofMining, Metallurgical, and Petroleum
Engineers: New York, 1959; p 755.
39. Merrill, C. W., The significance of themineral industries in the economy. In
Economics of the mineral industries; aseries of articles by specialists, 2d ed.;
Robie, E. H., Ed. American Institute of
Mining, Metallurgical, and PetroleumEngineers: New York, 1964; p 787.
40. Sousa, L. J., The U.S. Copper Industry:Problems, Issues, and Outlook. United
States Department of the Interior: Wash-ington, D.C., 1981; p 86.
41. Zeltner, C.; Bader, H. P.; Scheidegger, R.;
Baccini, P., Sustainable metal manage-ment exemplified by copper in the USA.
Regional Environmental Change 1999, 1,
31-46.
42. Landner, L.; Lindeström, L., Copper in
Society and in the Environment: An Ac-count of the Facts on Fluxes, Amounts
and Effects of Copper in Sweden. Swed-ish Environmental Research Group:
Vasteras, Sweden, 1999.
43. Ayres, R. U.; Ayres, L.; Rade, I., The LifeCycle of Copper, Its Co-Products and By-
products. Kluwer Academic Publishers:2003.
44. Gordon, R. B.; Bertram, M.; Graedel, T. E.,
Metal stocks and sustainability. Proceed-ings of the National Academy of Sciences
2006, 103, 1209 – 1214.
45. Wittmer, D.; Lichtensteiger, T.; Baccini,P. In Copper exploration for urban min-
ing, Copper/Cobre 2003, Santiago, Chile,2003; Santiago, Chile, 2003; pp 85 – 101.
46. van Beers, D.; Graedel, T. E., Spatialcharacterisation of multi-level in-use
copper and zinc stocks in Australia.Journal of Cleaner Production 2007, 15,
849 – 861.
47. Nathan Associates, The Obsolete CopperScrap Inventory: Accumulation and Avail-
ability, 1982 – 2003; United States Depart-ment of Commerce: Washington, D.C.,
2004; p 18.
48. Rauch, J.; Eckelman, M.; Gordon, R. B.,
Copper In-use Stock and Copper Scrapin the State of Connecticut, USA. WorkingPaper Number 10, School of Forestry and
Environmental Studies; Yale University:New Haven, 2007; p 79.
49. Bergbäck, B.; Johansson, K.; Mohlander,
U., Urban metal flows – A case study ofStockholm. Review and conclusions.
Water, Air, & Soil Pollution: Focus 2001,1, 3 – 24.
50. van Beers, D.; Graedel, T. E., The mag-nitude and spatial distribution of in-usecopper stocks in Cape Town, South Af-
rica. South African Journal of Science2003, 99, 61 – 69.
51. Zhang, Z., Spatial analysis of in-use
copper stocks in Beijing, China. In Citiesas Opportunities, Bai, X.; Graedel, T. E.;
Morishima, A., Eds. Cambridge UniversityPress: Cambridge, U.K., 2008.
52. Drakonakis, K.; Rostkowski, K.; Rauch,
J.; Graedel, T. E.; Gordon, R. B., Metalcapital sustaining a North American city:
Iron and copper in New Haven, CT. Re-sources, Conservation & Recycling 2007,
49, 406 – 420.
53. Brown, H., The Challenge of Man’s Fu-ture; An Inquiry Concerning the Condition
of Man During the Years that Lie Ahead.Viking Press: New York, 1954; p 290.

7/24/2019 UNEP Report1 Stocks 100920
http://slidepdf.com/reader/full/unep-report1-stocks-100920 48/52
46
Metal Stocks in Society – Scientific Synthesis
54. Wang, T. Forging the Anthropogenic IronCycle. Ph.D. Dissertation, Yale University,
New Haven, 2009.
55. Eckelman, M.; Rauch, J.; Gordon, R.B., In-Use Stocks of Iron in the State
of Connecticut, USA. Working PaperNumber 11, School of Forestry and Envi-
ronmental Studies; Yale University: NewHaven, 2007; p 52.
56. Tanikawa, H.; Hashimoto, S.; Moriguchi,
Y. In Estimation of Material Stock in
Urban Civil Infrastructures and Build-ings for the Prediction of Waste Genera-tion, Proceedings of the 5th International
Conference on Ecobalance, Tokyo, 2002;Society for Non-Traditional Technology:
Tokyo, 2002; pp 809 – 806.
57. Wang, T., Personal communication, YaleUniversity, New Haven, 2004.
58. Elshkaki, A.; Van der Voet, E.; Van Hol-
derbeke, M.; Timmermans, V., The envi-
ronmental and economic consequencesof the developments of lead stocks in theDutch economic system. Resources, Con-
servation & Recycling 2004, 42, 133 – 154.
59. Obernosterer, R.; Brunner, P. H., UrbanMetal Management The Example of Lead.
Water, Air, & Soil Pollution: Focus 2001,1, 241 – 253.
60. Rostkowski, K.; Rauch, J.; Drakonakis, K.;
Reck, B.; Gordon, R. B.; Graedel, T. E.,“Bottom–up” study of in-use nickel
stocks in New Haven, CT. Resources,Conservation & Recycling 2007, 50,
58 – 70.
61. Hagelüken, C., Materials Flow of Plati-num Group Metals. GFMS Limited: Lon-
don, 2005; p 300.
62. Charles River Associates, Silver Stocksaround the World; Cambridge, MA, 1992.
63. Daigo, I.; Igarashi, Y.; Matsuno, Y.; Adachi,Y., Accounting for steel stock in Japan.
Iron and Steel Institute of Japan Interna-tional 2007, 47, 1065 – 1069.
64. Jolly, J. H., Materials flow of zinc in the
United States 1850 – 1990. Resources,Conservation and Recycling 1993, 9,
1 – 30.
65. van Beers, D.; Graedel, T. E., The Mag-nitude and Spatial Distribution of In-use
Zinc Stocks in Cape Town, South Africa.
African Journal of Environmental Assess-ment and Management 2004, 9, 18 – 36.Groupings of Metals
7/24/2019 UNEP Report1 Stocks 100920
http://slidepdf.com/reader/full/unep-report1-stocks-100920 49/52
47
Metal Stocks in Society – Scientific Synthesis

7/24/2019 UNEP Report1 Stocks 100920
http://slidepdf.com/reader/full/unep-report1-stocks-100920 50/52
48
Metal Stocks in Society – Scientific Synthesis
International Panel
for SustainableResource
Management
As our economies have grown, so has the use
of materials and resources. In an increas-ingly globalised economy, the challenge for
policy-makers is to streamline actions for
ensuring a more sustainable management ofresources, both renewable and non-renew-able. There are existing measures such as
policies on climate change and biodiversi-ty that tackle certain aspects of the global
resource issues. However a holistic approachto resources management is needed to better
identify their interlinkages and gaps in a sys-temic way.
The establishment of UNEP’s Internation-
al Panel for Sustainable Resource Man-
agement, or Resource Panel for short, is afirst step towards addressing this need. TheResource Panel was officially launched in
November 2007 and aims to provide the sci-entific impetus for decoupling economic
growth and resource use from environmentaldegradation.
The objectives of the Resource Panel are to
provide independent, coherent and authorita-tive scientific assessments of policy relevance
on the sustainable use of natural resourcesand in particular their environmental impacts
over the full life cycle as well as to contributeto a better understanding of how to decou-
ple economic growth from environmentaldegradation.
This work builds on and will contribute
to other related international initiatives,including the development of the 10-year
framework on sustainable consumptionand production (Marrakech Process), the
Green Economy Initiative and the GlobalEnvironment.
Global Metal Flows
Working Group
Economic development is deeply coupled
with the use of metals. The growing demandfor metals implies a permanent pressure
on the resource base. Metals are resources
that have a high value and in principle can beeasily reused and recycled. Reuse and recy-cling activities of metals on a global scale can
contribute to closing the loops, turn wasteinto resources, and are expected to thereby
reduce environmental impacts, safeguard theavailability of metals, minimize metal prices,
and promote meaningful and safe jobs forpoor people in developing countries.
The Global Metal Flows Working Group aims
at contributing to the promotion of reuse and
recycling of metals and the establishment ofan international sound material-cycle societyby providing scientific and authoritative
assessment studies on the global flows ofmetals. Expected results include revealing
potentials for increasing the resourceefficiency of metal flows at the national and
international level.
7/24/2019 UNEP Report1 Stocks 100920
http://slidepdf.com/reader/full/unep-report1-stocks-100920 51/52
About the UNEP Division of Technology,
Industry and Economics
The UNEP Division of Technology, Industry and Economics (DTIE) helps
governments, local authorities and decision-makers in business and
industry to develop and implement policies and practices focusing on
sustainable development.
The Division works to promote:
> sustainable consumption and production,
> the efficient use of renewable energy,
> adequate management of chemicals,
> the integration of environmental costs in development policies.
The Office of the Director, located in Paris, coordinates activities
through:
> The International Environmental Technology Centre - IETC (Osaka, Shiga),
which implements integrated waste, water and disaster management programmes,
focusing in particular on Asia.
> Sustainable Consumption and Production (Paris), which promotes sustainable
consumption and production patterns as a contribution to human development
through global markets.
> Chemicals (Geneva), which catalyzes global actions to bring about the sound
management of chemicals and the improvement of chemical safety worldwide.
> Energy (Paris and Nairobi), which fosters energy and transport policies for
sustainable development and encourages investment in renewable energy and
energy efficiency.
> OzonAction (Paris), which supports the phase-out of ozone depleting substances
in developing countries and countries with economies in transition to ensure
implementation of the Montreal Protocol.
> Economics and Trade (Geneva), which helps countries to integrate environmental
considerations into economic and trade policies, and works with the finance sector
to incorporate sustainable development policies.
UNEP DTIE activities focus on raising awareness,
improving the transfer of knowledge and information,
fostering technological cooperation and partnerships, and
implementing international conventions and agreements.
For more information,see www.unep.fr
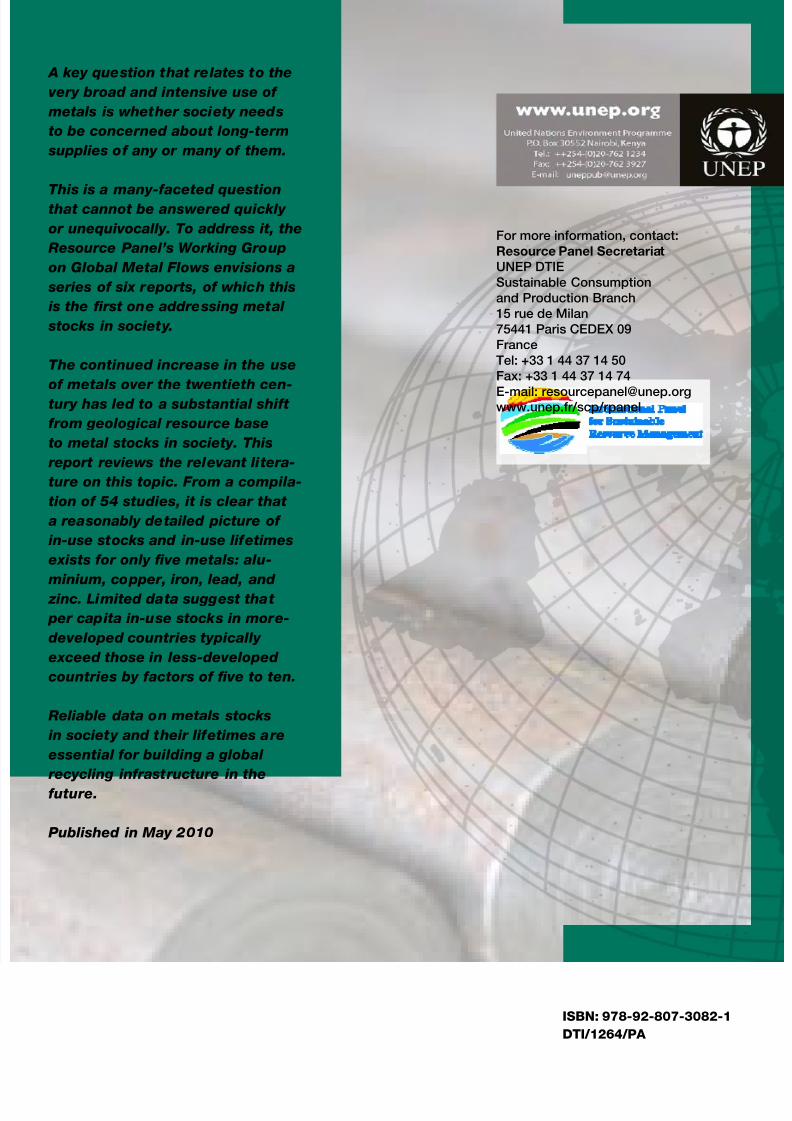
7/24/2019 UNEP Report1 Stocks 100920
http://slidepdf.com/reader/full/unep-report1-stocks-100920 52/52
A key question that relates to the
very broad and intensive use of
metals is whether society needs
to be concerned about long-term
supplies of any or many of them.
This is a many-faceted questionthat cannot be answered quickly
or unequivocally. To address it, the
Resource Panel’s Working Group
on Global Metal Flows envisions a
series of six reports, of which this
is the first one addressing metal
stocks in society.
The continued increase in the use
of metals over the twentieth cen-tury has led to a substantial shift
from geological resource base
to metal stocks in society. This
report reviews the relevant litera-
ture on this topic. From a compila-
tion of 54 studies, it is clear that
a reasonably detailed picture of
in-use stocks and in-use lifetimes
exists for only five metals: alu-
minium, copper, iron, lead, and zinc. Limited data suggest that
per capita in-use stocks in more-
developed countries typically
exceed those in less-developed
countries by factors of five to ten.
Reliable data on metals stocks
in society and their lifetimes are
essential for building a global
recycling infrastructure in thefuture.
Published in May 2010
For more information, contact:
Resource Panel Secretariat
UNEP DTIE
Sustainable Consumption
and Production Branch
15 rue de Milan
75441 Paris CEDEX 09
France
Tel: +33 1 44 37 14 50
Fax: +33 1 44 37 14 74
E-mail: [email protected]
www.unep.fr/scp/rpanel