uneven progress: the employment pathways of skilled
TRANSCRIPT

Uneven Progress:The Employment Pathways of Skilled Immigrants
in the United States
Jeanne Batalova & Michael Fix
Migration Policy Institute
October 22, 2008

Points of DeparturePoints of Departure
• Baby boom retirement
• No growth in native labor force
• Global competition
• Demographic importance
• Integration: lack of attention

MPI Study: Raising Important Questions
• What is the extent of brain waste in the United States?
• What are the barriers college-educated immigrants experience that limit their full economic contribution?
• How can these barriers be removed?

Major Findings…
• More than 1.3 million college-educated immigrants are unemployed or working in unskilled jobs.
• 22% of all college-educated immigrants – or 1 out of every 5 highly skilled immigrants – are working in unskilled jobs (e.g., construction laborers, babysitters, file clerks, etc.)
• Another 22% are in semi-skilled jobs (e.g., carpenters, electricians, massage therapists, etc.)
• 44% recent Mexican and Central American skilled immigrants, are working in unskilled jobs.
Brain waste is a realityBrain waste + brain drain = Worst policy outcome

Skilled Immigrant Integration in the US: Skilled Immigrant Integration in the US: Why Should Society Care?Why Should Society Care?
• Leverages foreign-funded educational investments
• Maximizes the skill use of immigrants already in the country
• Raises worker productivity, increases tax yields, and decreases reliance on public benefits
• Helps US compete for global talent
• Creates a new generation of immigrant leadership
• Increases economic and social remittances to migrant-sending countries

Skilled Immigrant Integration in the US: Skilled Immigrant Integration in the US: Why Should Employers Care?Why Should Employers Care?
• US companies are losing their competitive edge in an increasingly globalized world because they can’t recruit hard-to-find talent
• Canada, Australia, and Europe are already addressing licensing/credentialing issues and investing in attracting highly skilled immigrants
• Impending Baby Boomer retirement and need to plan for next-generation workforce

Skilled Immigrants in the United States

Skilled Immigrants as Professionals and Innovators
About 6 million college-educated immigrants in US labor force (2005-2006):• 30% of all immigrants (vs. 21% in 1990)• 15% of all college-educated (vs. 8% in 1990)
Among employed, skilled immigrants are:• 1 in 4 physicians • 1 in 2 medical scientists • 1 in 3 computer specialists• 1 in 5 postsecondary teachers
Source: Batalova & Fix. Uneven Progress: The Employment Trajectories of Skilled Immigrants in the United States (MPI 2008).
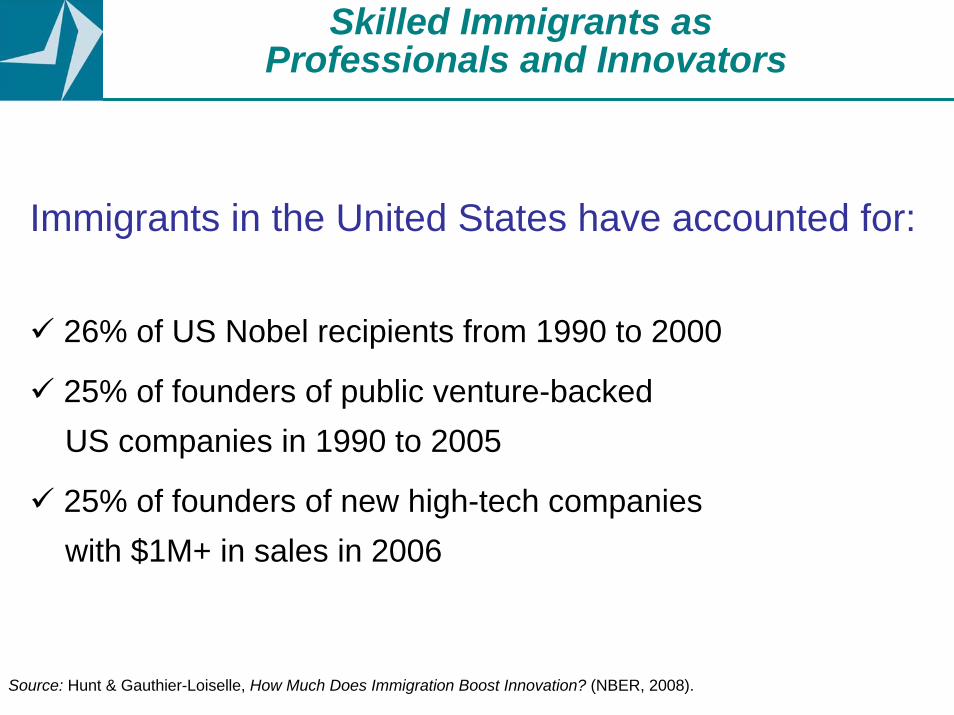
Skilled Immigrants as Professionals and Innovators
Immigrants in the United States have accounted for:
26% of US Nobel recipients from 1990 to 2000
25% of founders of public venture-backed US companies in 1990 to 2005
25% of founders of new high-tech companies with $1M+ in sales in 2006
Source: Hunt & Gauthier-Loiselle, How Much Does Immigration Boost Innovation? (NBER, 2008).

The US Immigration Process

US Immigration SystemUS Immigration System
Temporary Admissions
Foreign nationals are admittedtemporarily to engage in a certainactivity:
Work StudyTourismInvestment
Permanent Admissions
Foreign nationals are admitted for permanent residency:
Employment sponsorshipFamily reunificationHumanitarian protectionDiversity (Green card lottery)
Some skilled immigrants come on employment-based permanent and temporary (H-1B, L-1, O-1, F-1) visas…

US Immigration SystemUS Immigration System
Temporary Admissions
Foreign nationals are admittedtemporarily to engage in a certainactivity:
Work StudyTourismInvestment
Permanent Admissions
Foreign nationals are admitted for permanent residency:
Employment sponsorshipFamily reunificationHumanitarian protectionDiversity (Green card lottery)
…others come as family immigrants and refugees.

Study Questions
• What are the employment outcomes for skilled immigrants?
• Do they vary by country of origin and route to permanent residency?
• Is downward mobility inevitable for all newly arrived skilled immigrants? For how long?
• How does the US compare in its integration of skilled immigrants to Canada and Europe?
• What are the opportunities for private and public actors?

MPI Studied . . . MPI Studied . . .
• College-educated immigrants: unemployed or in unskilled jobs
• Unskilled jobs: require no more than modest on-the-job training
• Datasets with unique strengths: -- American Community Survey (ACS) -- New Immigrant Survey (NIS)

MPI Analyzed . . . MPI Analyzed . . .
2005-2006 American Community Survey:• Large sample of all immigrants• Country/region of origin • Time spent in the US • Place of education (proxy measure)• English proficiency • Comparison to college-educated US-born workers
2003 New Immigrant Survey:• Sample: only legal permanent residents• Migration history• Occupation/employment before and after arrival to the US• Place of education (direct measure)• Route to permanent residency

Higher Unemployment Rates: Higher Unemployment Rates: Recent Arrivals and African BornRecent Arrivals and African Born
Percentage of the College Educated Who Are Unemployed*
Notes: *Among foreign-educated, “recent” refers to immigrants who came to the US ten or fewer years ago, while “long-term”refers to immigrants who have been in the US for 11 years or longer. “US educated” are immigrants who have at least a BA degree and who came to the US before age 25. **”Europe” refers to Europe, Canada, and Oceania.Source: 2005-2006 ACS analysis from Batalova & Fix, Uneven Progress: The Employment Trajectories of Skilled Immigrants in the United States (MPI 2008).
3.74.1
3.4
4.8 5.0
6.0
3.6
2.6
4.4
3.43.9 4.1
3.43.1
2.8
US born All immigrants Foreign-edu immigrantsRecent Long term US educated
Europe** Asia Lat. America Africa

Skilled Immigrants as Skilled Immigrants as Taxi Drivers, Maids, and CashiersTaxi Drivers, Maids, and Cashiers
Percentage of the College Educated in Unskilled Jobs*
Notes: *Among foreign-educated, “recent” refers to immigrants who came to the US ten or fewer years ago, while “long-term”refers to immigrants who have been in the US for 11 years or longer. “US educated” are immigrants who have at least a BA degree and who came to the US before age 25. **”Europe” refers to Europe, Canada, and Oceania.Source: 2005-2006 ACS analysis from Batalova & Fix, Uneven Progress: The Employment Trajectories of Skilled Immigrants in the United States (MPI 2008).
2225
19 20
33
23
35
22
14
25
18
44
17 1618
US born All immigrants Foreign-edu immigrantsRecent Long term US educated
Europe** Asia Lat. America Africa

MARYLAND: One in Five CollegeMARYLAND: One in Five College--EducatedEducatedImmigrants is in Unskilled JobImmigrants is in Unskilled Job
Percentage of the College Educated in Unskilled Jobs in Maryland*
Notes: *Among foreign-educated, “recent” refers to immigrants who came to the US ten or fewer years ago, while “long-term”refers to immigrants who have been in the US for 11 years or longer. “US educated” are immigrants who have at least a BA degree and who came to the US before age 25. **”Europe” refers to Europe, Canada, and Oceania.Source: 2005-2006 ACS analysis from Batalova & Fix, Uneven Progress: The Employment Trajectories of Skilled Immigrants in the United States (MPI 2008).
1923
20
43 41
26 27
10
14 1215
11
16
22
15
US born All immigrants Foreign-edu immigrantsRecent Long term US educated
Europe** Asia Lat. America Africa

US Degree Matters US Degree Matters
Notes: LPRs are legal permanent residents, i.e., persons with permission to reside in the United States permanently, to work legally, and to become US citizens after residing for at least five years and passing a citizenship test. *“Not employed” is defined here as being either out of the civilian labor force or unemployed. Source: New Immigrant Survey, 2003 from Batalova & Fix, Uneven Progress: The Employment Trajectories of Skilled Immigrants in the United States (MPI 2008).
27
4351
22
17
2317
9
17
15 7
11
38
20 25
59
Before entry At the NIS interview Before entry At the NIS interview
High Skilled
Skilled technical
Unskilled
Not employed*
Foreign-educated LPRs US-educated LPRs

Occupational TransitionsOccupational Transitionsby Admission Category*by Admission Category*
1.00
1.50
2.00
2.50
3.00
Job Abroad First US Job Current US Job
Inde
x
Employment: statusadjusters (15%)
Employment: newarrivals (7%)
Family: status adjusters(28%)
Family: new arrivals(21%)
Refugee: statusadjusters (6%)
Diversity: all (13%)
Legalized/Others: all(9%)
Notes: *The percentages shown for each of the admission category represent the share of a given category of the NIS sample of the foreign-educated legal permanent residents who received their green cards in 2003. The green card gives a permission to reside in the United States permanently, to work legally, and to become US citizens after residing for at least five years and passing a citizenship test. Source: 2003 New Immigrant Survey analysis from Batalova & Fix, Uneven Progress: The Employment Trajectories of Skilled Immigrants in the United States (MPI 2008).
Unskilled jobs
High-skilled jobs
Foreign-educated green-card holders

Brain Waste in the United States:Brain Waste in the United States:Risk FactorsRisk Factors
• Lacking English skills• Having only foreign degree• Not working in the US prior to permanent settlement• Entering under nonemployment visa category • Coming from Latin America or Africa• Experiences periods of unauthorized residence• Lacking US professional and social networks
• Facing institutional barriers:-- Nonrecognition of foreign-earned credentials-- Lack of quality English classes teaching work-related language

Brain Waste in the United States: Brain Waste in the United States: Public and Private Response Public and Private Response
Immigrant integrationBusiness level• Incorporating language training into in-house communications skills training programs
State level• State workforce agency partnerships with other stakeholders• Mentorship and internship programs• Accredited work-skills training and English language programs• Effective bridge programs that serve immigrants and employers
Spillover benefits to other groups of workers
National level• Funding for innovative/successful programs• Information sharing

Brain Waste in the United States:Brain Waste in the United States:Rethinking AdmissionRethinking Admission
Immigrant admissionTransitional visas• are an opportunity for both employers and prospective foreign workers
to “test the waters”• give foreign workers the right to self-petition for permanent residence• introduce transparency in the process of switching between
“temporary” and “permanent” statuses
Standing Commission on Labor Markets and Immigration• analyzes local and regional labor-market needs, trends, worker-supply
chains, and the effects of recent immigration flows• makes regular recommendations to Congress and the President for
adjusting immigration levels• introduces flexibility and responsiveness into the system regarding
future needs and trends

Further MPI ResourcesFurther MPI Resources
* Batalova, J., and M. Fix. 2008. Uneven Progress: The Employment Trajectories of Skilled Immigrants in the United States, www.migrationpolicy.org/pubs/BrainWasteOct08.pdf
* Meissner, D., et al. 2006. Immigration and America's Future: A New Chapter, Final report of the Independent Task Force, www.migrationpolicy.org/ITFIAF/index.php
* Papademetriou, D., et al. 2007. Proposed Points System and Its Likely Impact on Prospective Immigrants, www.migrationpolicy.org/pubs/PointsSystem_051807.pdf
* Fix, M., et al. 2008. Los Angeles on the Leading Edge: Immigrant Integration Indicators and Their Policy Implications, www.migrationpolicy.org/pubs/NCIIP_Los_Angeles_on_the_Leading_Edge.pdf
* Terrazas, A., and M. Fix. 2008. Gambling on the Future: Managing the Education Challenges of Rapid Growth in Nevada, www.migrationpolicy.org/pubs/NCIIP_Nevada.pdf
* Collett, E. 2008. The Proposed European Blue Card System: Arming for the Global War for Talent? www.migrationinformation.org/Feature/display.cfm?ID=667
* Fix, M., and N. Kaushal. 2006. The Contributions of High-Skilled Immigrants www.migrationpolicy.org/ITFIAF/TF16_Kaushal.pdf
* Batalova, J. 2007. The “Brain Gain” Race Begins with Foreign Students, www.migrationinformation.org/Feature/display.cfm?ID=571

Find reports and other analysis at a state and national level at:
www.migrationpolicy.org
For More InformationFor More Information
Get quick immigration facts, maps, and stats at:
www.migrationpolicy.org/datahub
Jeanne [email protected]
Michael [email protected]
© Migration Policy Institute, 2008. All rights reserved.
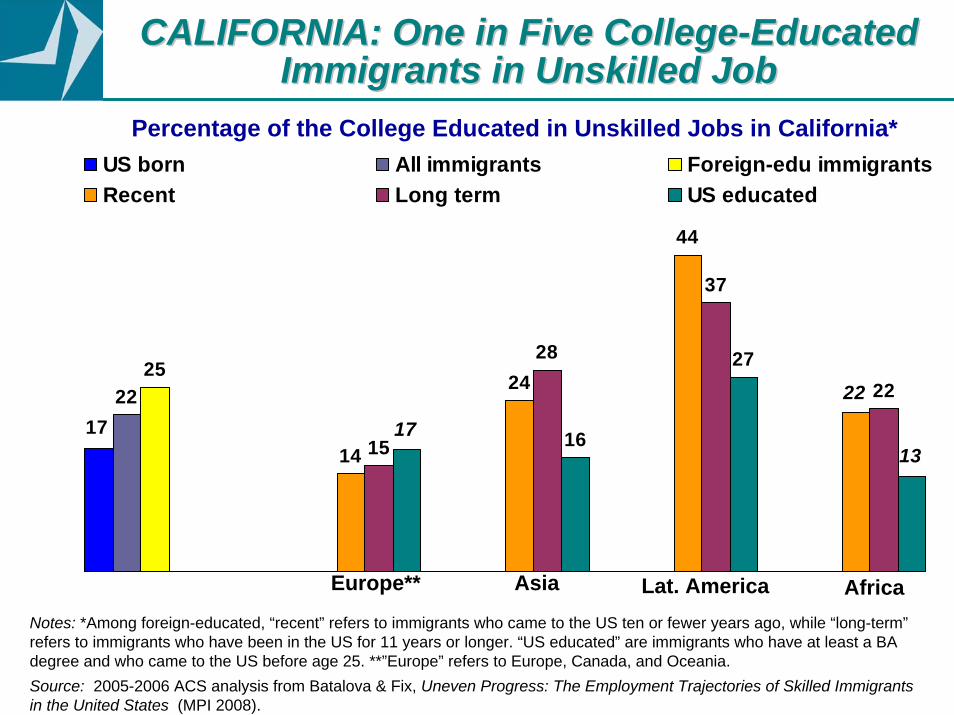
CALIFORNIA: One in Five CollegeCALIFORNIA: One in Five College--EducatedEducatedImmigrants in Unskilled JobImmigrants in Unskilled Job
Percentage of the College Educated in Unskilled Jobs in California*
Notes: *Among foreign-educated, “recent” refers to immigrants who came to the US ten or fewer years ago, while “long-term”refers to immigrants who have been in the US for 11 years or longer. “US educated” are immigrants who have at least a BA degree and who came to the US before age 25. **”Europe” refers to Europe, Canada, and Oceania.Source: 2005-2006 ACS analysis from Batalova & Fix, Uneven Progress: The Employment Trajectories of Skilled Immigrants in the United States (MPI 2008).
2225
14
24
44
28
37
22
16
27
17
22
15 1317
US born All immigrants Foreign-edu immigrantsRecent Long term US educated
Europe** Asia Lat. America Africa

NEW YORK: One in Five CollegeNEW YORK: One in Five College--EducatedEducatedImmigrants in Unskilled JobImmigrants in Unskilled Job
Percentage of the College Educated in Unskilled Jobs in New York*
Notes: *Among foreign-educated, “recent” refers to immigrants who came to the US ten or fewer years ago, while “long-term”refers to immigrants who have been in the US for 11 years or longer. “US educated” are immigrants who have at least a BA degree and who came to the US before age 25. **”Europe” refers to Europe, Canada, and Oceania.Source: 2005-2006 ACS analysis from Batalova & Fix Uneven Progress: The Employment Trajectories of Skilled Immigrants in the United States (MPI 2008).
2226
2024
38
24
31
2522
17
29
22
17 1816
US born All immigrants Foreign-edu immigrantsRecent Long term US educated
Europe** Asia Lat. America Africa

ILLINOIS: One in Four CollegeILLINOIS: One in Four College--EducatedEducatedImmigrants in Unskilled JobImmigrants in Unskilled Job
Percentage of the College Educated in Unskilled Jobs in Illinois*
Notes: *Among foreign-educated, “recent” refers to immigrants who came to the US ten or fewer years ago, while “long-term”refers to immigrants who have been in the US for 11 years or longer. “US educated” are immigrants who have at least a BA degree and who came to the US before age 25. **”Europe” refers to Europe, Canada, and Oceania. Data for African born was insufficient. Source: 2005-2006 ACS analysis from Batalova & Fix, Uneven Progress: The Employment Trajectories of Skilled Immigrants in the United States (MPI 2008).
2427 29
2421
32
14
34
18
57
2219
US born All immigrants Foreign-edu immigrantsRecent Long term US educated
Europe** Asia Lat. America

ImmigrantsImmigrants’’ Share: 15 Occupations Share: 15 Occupations With Fastest Growth, 2004With Fastest Growth, 2004--1414
Source: MPI’s tabulations of ACS 2005 & BLS Projections, 2004-2014; *At least an Associate’s degree required.
6%7%
9%10%
13%13%14%15%15%
19%20%21%
23%35%
46%
0% 5% 10% 15% 20% 25% 30% 35% 40% 45% 50%
Dental Hygienists*
Occupational Therapists*
Physical Therapist Assistants and Aides
Medical Assistants
Network and Comp. Systems Administrators*
Physician Assistants*
Physical Therapists*
Dental Assistants
Network Systems, Data Commun. Analysts*
Nursing, Psychiatric, and Home Health Aides
Postsecondary Teachers*
Database Administrators*
Personal and Home Care Aides
Computer Software Engineers*
Medical Scientists*
Job Growth, 2004-2014 (in thousands)
Immigrants' share in US labor force (2005) = 15%
2636928740
525676126115
5631
107202
413168