unexpected diffusion anisotropy of carbon dioxide in the...
TRANSCRIPT

Unexpected Diffusion Anisotropy of Carbon Dioxide in the Metal−Organic Framework Zn2(dobpdc)Alexander C. Forse,†,‡,§ Miguel I. Gonzalez,† Rebecca L. Siegelman,† Velencia J. Witherspoon,‡
Sudi Jawahery,‡ Rocio Mercado,‡ Phillip J. Milner,† Jeffrey D. Martell,† Berend Smit,†,‡,∥
Bernhard Blumich,⊥ Jeffrey R. Long,*,†,‡,# and Jeffrey A. Reimer*,‡,#
†Department of Chemistry, ‡Department of Chemical and Biomolecular Engineering, and §Berkeley Energy and Climate Institute,University of California, Berkeley, California 94720, United States∥Institut des Sciences et Ingenierie Chimiques, Valais, Ecole Polytechnique Federale de Lausanne (EPFL), Rue de l‘Industrie 17,CH-1951 Sion, Switzerland⊥Institut fur Technische und Makromolekulare Chemie (ITMC), RWTH Aachen University, 52062 Aachen, Germany#Materials Sciences Division, Lawrence Berkeley National Laboratory, Berkeley, California 94720, United States
*S Supporting Information
ABSTRACT: Metal−organic frameworks are promisingmaterials for energy-efficient gas separations, but little isknown about the diffusion of adsorbates in materials featuringone-dimensional porosity at the nanoscale. An understandingof the interplay between framework structure and gas diffusionis crucial for the practical application of these materials asadsorbents or in mixed-matrix membranes, since the rate of gasdiffusion within the adsorbent pores impacts the required size(and therefore cost) of the adsorbent column or membrane.Here, we investigate the diffusion of CO2 within the pores ofZn2(dobpdc) (dobpdc
4− = 4,4′-dioxidobiphenyl-3,3′-dicarbox-ylate) using pulsed field gradient (PFG) nuclear magneticresonance (NMR) spectroscopy and molecular dynamics(MD) simulations. The residual chemical shift anisotropy for pore-confined CO2 allows PFG NMR measurements of self-diffusion in different crystallographic directions, and our analysis of the entire NMR line shape as a function of the applied fieldgradient provides a precise determination of the self-diffusion coefficients. In addition to observing CO2 diffusion through thechannels parallel to the crystallographic c axis (self-diffusion coefficient D∥ = (5.8 ± 0.1) × 10−9 m2 s−1 at a pressure of 625 mbarCO2), we unexpectedly find that CO2 is also able to diffuse between the hexagonal channels in the crystallographic ab plane (D⊥= (1.9 ± 0.2) × 10−10 m2 s−1), despite the walls of these channels appearing impermeable by single-crystal X-ray crystallographyand flexible lattice MD simulations. Observation of such unexpected diffusion in the ab plane suggests the presence of defectsthat enable effective multidimensional CO2 transport in a metal−organic framework with nominally one-dimensional porosity.
■ INTRODUCTION
Synthetic porous materials such as metal−organic frameworks(MOFs) show great potential for energy-efficient gasseparations. A key advantage of MOFs compared to traditionalporous materials, such as carbons and zeolites, is their highlytunable chemistry, porosity, and topology, which allow thetargeted design of materials for particular separations. Frame-works in the MOF-74 family,1 such as M2(dobdc) (dobdc
4− =2,5-dioxido-1,4-benzenedicarboxylate; M = Mg, Mn, Fe, Co, Ni,Cu, Zn, Cd)1−8 and the expanded variants M2(dobpdc)(dobpdc4− = 4,4′-dioxidobiphenyl-3,3′-dicarboxylate; M =Mg, Mn, Fe, Co, Ni, Zn),9−11 in particular demonstratepromise for the separation of CO2 from simulated fossil fuelflue gas mixtures12−14 as well as for CO2/CH4 separations.15
These frameworks feature one-dimensional hexagonal channelslined with a high density of coordinatively unsaturated metal
centers (see Figure 1), and their CO2 capture performance hasbeen found to improve dramatically upon appending diaminesto the metal sites. The diamine-appended frameworkscooperatively adsorb CO2 via the formation of ammoniumcarbamate chains, resulting in a dramatically improvedperformance in the presence of water as well as lowregeneration energies.9,10,16−20
Despite the promise of MOF-74 materials for a variety of gasseparations, an understanding of gas diffusion in this class ofmaterials is lacking. The importance of strong CO2−metalinteractions in dictating local energy barriers for diffusivemotion between different binding sites in Mg2(dobdc) haspreviously been highlighted.21 Nuclear magnetic resonance
Received: September 4, 2017Published: January 4, 2018
Article
pubs.acs.org/JACSCite This: J. Am. Chem. Soc. 2018, 140, 1663−1673
© 2018 American Chemical Society 1663 DOI: 10.1021/jacs.7b09453J. Am. Chem. Soc. 2018, 140, 1663−1673

(NMR) spectroscopy has also been used to probe the hoppingdynamics and resulting average orientations of CO2 moleculesin the pores of Mg2(dobdc) via the measurement of residualchemical shift anisotropies.22,23 Despite this progress, little isknown about the long-range diffusive motion of moleculeswithin materials of this type. In particular, the magnitude anddirectionality of gas diffusion within the one-dimensionalnanosized pores of these adsorbents are poorly understood,even though such parameters have a substantial impact on theirpractical utility. By understanding gas diffusion in this class ofMOFs, we hope to guide the design of new materials withimproved gas transport properties.Pulsed-field gradient (PFG) NMR spectroscopy allows the
measurement of self-diffusion coefficients of pore-confinedmolecules24−30 and uses pulses of magnetic field gradients toencode and decode the positions of the molecules. In thistechnique, a series of NMR experiments are first carried outwith magnetic field gradient pulses of increasing strength, andself-diffusion coefficients are subsequently obtained by fittingthe decay of the NMR signal intensity as a function of the fieldgradient.31 PFG NMR spectroscopy is an attractive means ofcharacterization, as it can also be used to measure diffusion
anisotropy.31−34 For example, aligning single crystals of amaterial at different orientations relative to the magnetic fieldgradient direction (the direction in which diffusion ismeasured) allows one to probe the diffusion of adsorbedmolecules in different crystallographic directions.35−37 Analternative approach that does not require oriented singlecrystals is to make use of residual anisotropic NMR interactionsin static polycrystalline samples, wherein the resonancefrequency is dependent on the crystallite orientation. Usingthe latter approach, residual quadrupole interactions (2HNMR) combined with PFG experiments have been used tomeasure the diffusion anisotropy of 2H2O in a polycrystallineliquid crystal sample.36 Later studies employed similarapproaches based on residual chemical shift anisotropies.37−39
In particular, the qualitative analysis of powder line shapes forCO2 adsorbed in a metal−organic framework can be used todetermine the preferred crystallographic direction for self-diffusion.39,40
Here, we utilize the residual chemical shift anisotropy of CO2confined in the nanopores of Zn2(dobpdc) to extract thediffusion anisotropy as a function of gas pressure. The largesingle crystals of this material (up to ∼750 μm in length)facilitate the measurement of diffusion of the pore-confined gasmolecules, because exchange with the gas outside of the poresis negligible under the experimental conditions. Ourquantitative analysis of the evolution of the entire spectralline shape with increasing pulsed field gradient strength offersprecise determination of self-diffusion coefficients parallel andperpendicular to the hexagonal channels. Molecular dynamics(MD) simulations and in situ single-crystal X-ray diffractionmeasurements are employed as aides in trying to understandthe results.
■ RESULTS AND DISCUSSIONNMR Spectra of 13CO2-Dosed Zn2(dobpdc). The
reaction of Zn(NO3)2·6H2O and H4dobpdc at 100 °C for 2days17 yielded needle-like crystals of Zn2(dobpdc) (Figure 2,see also Figure 1). Successively washing the crystals with N,N-dimethylacetamide, methanol, and toluene, followed byactivation for 12 h at 250 °C under flowing Ar, yielded crystalswith lengths of up to 750 μm and widths of up to 120 μm(Figure 2b, Figure S1), which were then used to prepare NMRsamples.
Figure 1. A portion of the crystal structure of Zn2(dobpdc) at 298 Kshown from two different perspectives, as determined by single-crystalX-ray diffraction. Light blue, red, gray, and white spheres represent Zn,O, C, and H atoms, respectively.
Figure 2. (a) Photograph of as-synthesized crystals of Zn2(dobpdc)inside a sealed tube. (b) Microscope image of crystals in air followingwashing and activation.
Journal of the American Chemical Society Article
DOI: 10.1021/jacs.7b09453J. Am. Chem. Soc. 2018, 140, 1663−1673
1664

The Zn2(dobpdc) crystals were dosed ex situ with 13CO2
using a custom-built gas dosing manifold (Figure 3a). Static 13CNMR spectra of these crystals exhibit a feature that can beassigned to CO2 confined within the pores of the framework(Figure 3b). Measurements of the CO2 adsorption isothermand integrated NMR signal intensities from 0 to 2026 mbar ofCO2 (Figure S2) indicate occupancies of up to 0.9 CO2
molecules per metal site at the highest studied pressure. Anunusual powder pattern line shape is apparent in the NMRspectra, with the overall width depending on the gas pressure.
Previously reported 13C NMR spectra for solid CO2 and ourmeasured spectrum for gaseous CO2 (Figure 3c) provide auseful reference here.41 In the gas phase, isotropic molecularrotation yields a narrow resonance at the isotropic chemicalshift, δiso = 127.7 ppm. In the solid state, CO2 exhibits asignificant chemical shift anisotropy (ΔCSA), arising from thehighly anisotropic shape of the molecule. For solid CO2, ΔCSA =δ∥ − δiso is approximately −210 ppm, where δiso = (2δ⊥ + δ∥)/3,and intensity at δ⊥ arises from CO2 molecules that are orientedperpendicular to the applied magnetic field (B0), while intensity
Figure 3. (a) Custom-built gas dosing apparatus for preparing 13CO2-dosed NMR samples. (b) Static 13C NMR (7.1 T) spectra of Zn2(dobpdc)crystals (sample 1) dosed with 13CO2 at different pressures (T = 25 °C). Dashed blue line shows the predicted line shape at 2026 mbar for randomlyoriented crystals. Gray peaks indicate schematically the spectral contributions from crystals with different orientations. (c) Static 13C NMR spectra ofgaseous (1 bar) and solid CO2 (no adsorbent present), the latter is adapted from ref 41 with permission of Elsevier. (d) 13C NMR (18.8 T) spectrumof Zn2(dobpdc) powder dosed with 1056 mbar 13CO2 (T = 22 °C). (e) Pressure dependence of NMR parameters extracted from spectra on twoindependent samples, sample 1 and sample 2 (which were studied at different magnetic field strengths) and a powder sample, δiso = (2δ⊥ + δ∥)/3 andΔCSA = δ∥ − δiso.
Journal of the American Chemical Society Article
DOI: 10.1021/jacs.7b09453J. Am. Chem. Soc. 2018, 140, 1663−1673
1665

at δ∥ arises from CO2 molecules oriented parallel to the appliedfield.Pore-confined CO2 in Zn2(dobpdc) crystals exhibits a
residual chemical shift anisotropy. In this regime, crystalswith different orientations relative to B0 exhibit differentchemical shifts for confined CO2 molecules. This effect arisesbecause the molecular reorientation inside the pores is notisotropic, and CO2 has preferred average orientations relative tothe crystal frame (Figure 3b). We stress that it is the differentorientations of the crystals relative to B0 that give rise to theobserved spread of chemical shifts in Figure 3b. While the metalis the primary binding site for CO2 in these materials,14 CO2
undergoes translations between different metal sites on theNMR time scale, and a symmetric narrow line is thus expectedfor a single crystal (reflecting the average environment of pore-confined CO2 on a millisecond time scale; see below for moredetails).22,42 We note that similar line shapes for confined CO2
have previously been observed in other (noncubic)MOFs,39,40,43−47 including the isoreticular frameworkMg2(dobdc).
22,42
We hypothesize that intensity at the left-hand edge of thespectrum arises from CO2 inside the pores of crystals that areoriented perpendicular to the magnetic field (B0) direction andintensity at the right-hand edge arises from CO2 in the pores ofcrystals that are oriented parallel to the field direction (Figure3b). With this assumption, the calculated ΔCSA (= δ∥ − δiso)values are negative. The observed line shapes deviatesignificantly from that expected for a randomly orientedpolycrystalline powder sample (shown as a dashed blue linein Figure 3b). This deviation arises because the large crystalsizes result in a partial macroscopic alignment of their long axiswith the long axis of the NMR tube, leading to additionalintensity at δ∥. Consistent with this observation, we find thatphysical shaking of the crystal samples results in markedchanges of intensity in different regions of the spectra (FigureS3).Our assignments of δ⊥ and δ∥ are supported by four pieces of
evidence. First, magic angle spinning (MAS) spectra collectedfor gas-dosed single crystals (Figure S4) yield a negativechemical shift anisotropy, as well as an isotropic chemical shiftconsistent with our assignments. Second, measurements of
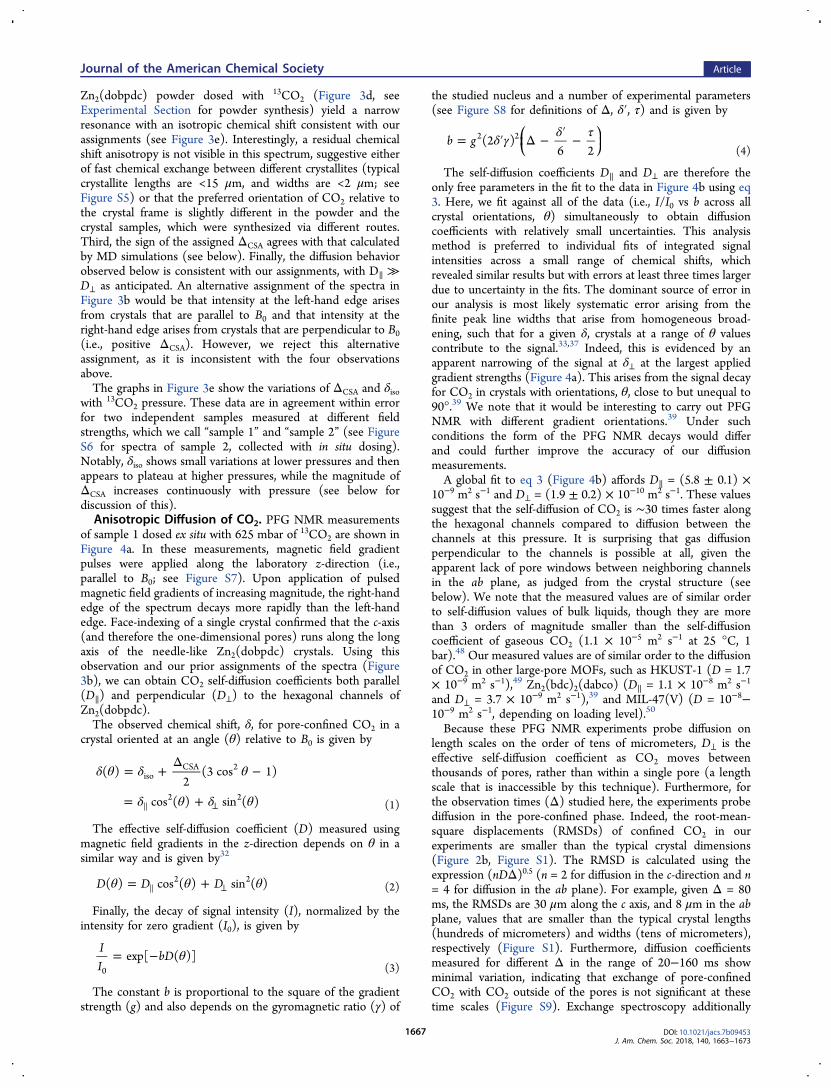
Figure 4. (a) PFG NMR (7.1 T) spectra for Zn2(dobpdc) crystals (sample 1) at a pressure of 625 mbar 13CO2 with different applied gradientstrengths (T = 25 °C). (b) Data and fit for results shown in panel a with PFG NMR signal decays shown as a function of crystal orientation, θ. Thefit is represented as a meshed surface. Data points are shown as blue circles and are normalized to 1 for g = 0.05 T m−1 for all crystal orientations(note that this normalization results in more noisy data at intermediate θ values where absolute signal intensities are weaker, due to the small numberof crystals at these orientations). (c) Self-diffusion coefficients obtained at 25 °C for Zn2(dobpdc) crystals (sample 1) dosed with different pressuresof 13CO2. The errors in these values arise from uncertainty in the fitting procedure and represent 95% confidence limits.
Journal of the American Chemical Society Article
DOI: 10.1021/jacs.7b09453J. Am. Chem. Soc. 2018, 140, 1663−1673
1666
Zn2(dobpdc) powder dosed with 13CO2 (Figure 3d, seeExperimental Section for powder synthesis) yield a narrowresonance with an isotropic chemical shift consistent with ourassignments (see Figure 3e). Interestingly, a residual chemicalshift anisotropy is not visible in this spectrum, suggestive eitherof fast chemical exchange between different crystallites (typicalcrystallite lengths are <15 μm, and widths are <2 μm; seeFigure S5) or that the preferred orientation of CO2 relative tothe crystal frame is slightly different in the powder and thecrystal samples, which were synthesized via different routes.Third, the sign of the assigned ΔCSA agrees with that calculatedby MD simulations (see below). Finally, the diffusion behaviorobserved below is consistent with our assignments, with D∥ ≫D⊥ as anticipated. An alternative assignment of the spectra inFigure 3b would be that intensity at the left-hand edge arisesfrom crystals that are parallel to B0 and that intensity at theright-hand edge arises from crystals that are perpendicular to B0(i.e., positive ΔCSA). However, we reject this alternativeassignment, as it is inconsistent with the four observationsabove.The graphs in Figure 3e show the variations of ΔCSA and δiso
with 13CO2 pressure. These data are in agreement within errorfor two independent samples measured at different fieldstrengths, which we call “sample 1” and “sample 2” (see FigureS6 for spectra of sample 2, collected with in situ dosing).Notably, δiso shows small variations at lower pressures and thenappears to plateau at higher pressures, while the magnitude ofΔCSA increases continuously with pressure (see below fordiscussion of this).Anisotropic Diffusion of CO2. PFG NMR measurements
of sample 1 dosed ex situ with 625 mbar of 13CO2 are shown inFigure 4a. In these measurements, magnetic field gradientpulses were applied along the laboratory z-direction (i.e.,parallel to B0; see Figure S7). Upon application of pulsedmagnetic field gradients of increasing magnitude, the right-handedge of the spectrum decays more rapidly than the left-handedge. Face-indexing of a single crystal confirmed that the c-axis(and therefore the one-dimensional pores) runs along the longaxis of the needle-like Zn2(dobpdc) crystals. Using thisobservation and our prior assignments of the spectra (Figure3b), we can obtain CO2 self-diffusion coefficients both parallel(D∥) and perpendicular (D⊥) to the hexagonal channels ofZn2(dobpdc).The observed chemical shift, δ, for pore-confined CO2 in a
crystal oriented at an angle (θ) relative to B0 is given by
δ θ δ θ
δ θ δ θ
= +Δ
−
= + ⊥
( )2
(3 cos 1)
cos ( ) sin ( )
isoCSA 2
2 2(1)
The effective self-diffusion coefficient (D) measured usingmagnetic field gradients in the z-direction depends on θ in asimilar way and is given by32
θ θ θ= + ⊥D D D( ) cos ( ) sin ( )2 2(2)
Finally, the decay of signal intensity (I), normalized by theintensity for zero gradient (I0), is given by
θ= −II
bDexp[ ( )]0 (3)
The constant b is proportional to the square of the gradientstrength (g) and also depends on the gyromagnetic ratio (γ) of
the studied nucleus and a number of experimental parameters(see Figure S8 for definitions of Δ, δ′, τ) and is given by
δ γ δ τ= ′ Δ − ′ −⎜ ⎟⎛⎝
⎞⎠b g (2 )
6 22 2
(4)
The self-diffusion coefficients D∥ and D⊥ are therefore theonly free parameters in the fit to the data in Figure 4b using eq3. Here, we fit against all of the data (i.e., I/I0 vs b across allcrystal orientations, θ) simultaneously to obtain diffusioncoefficients with relatively small uncertainties. This analysismethod is preferred to individual fits of integrated signalintensities across a small range of chemical shifts, whichrevealed similar results but with errors at least three times largerdue to uncertainty in the fits. The dominant source of error inour analysis is most likely systematic error arising from thefinite peak line widths that arise from homogeneous broad-ening, such that for a given δ, crystals at a range of θ valuescontribute to the signal.33,37 Indeed, this is evidenced by anapparent narrowing of the signal at δ⊥ at the largest appliedgradient strengths (Figure 4a). This arises from the signal decayfor CO2 in crystals with orientations, θ, close to but unequal to90°.39 We note that it would be interesting to carry out PFGNMR with different gradient orientations.39 Under suchconditions the form of the PFG NMR decays would differand could further improve the accuracy of our diffusionmeasurements.A global fit to eq 3 (Figure 4b) affords D∥ = (5.8 ± 0.1) ×
10−9 m2 s−1 and D⊥ = (1.9 ± 0.2) × 10−10 m2 s−1. These valuessuggest that the self-diffusion of CO2 is ∼30 times faster alongthe hexagonal channels compared to diffusion between thechannels at this pressure. It is surprising that gas diffusionperpendicular to the channels is possible at all, given theapparent lack of pore windows between neighboring channelsin the ab plane, as judged from the crystal structure (seebelow). We note that the measured values are of similar orderto self-diffusion values of bulk liquids, though they are morethan 3 orders of magnitude smaller than the self-diffusioncoefficient of gaseous CO2 (1.1 × 10⁻⁵ m2 s−1 at 25 °C, 1bar).48 Our measured values are of similar order to the diffusionof CO2 in other large-pore MOFs, such as HKUST-1 (D = 1.7× 10⁻⁹ m2 s−1),49 Zn2(bdc)2(dabco) (D∥ = 1.1 × 10⁻⁸ m2 s−1
and D⊥ = 3.7 × 10⁻⁹ m2 s−1),39 and MIL-47(V) (D = 10−8−10−9 m2 s−1, depending on loading level).50
Because these PFG NMR experiments probe diffusion onlength scales on the order of tens of micrometers, D⊥ is theeffective self-diffusion coefficient as CO2 moves betweenthousands of pores, rather than within a single pore (a lengthscale that is inaccessible by this technique). Furthermore, forthe observation times (Δ) studied here, the experiments probediffusion in the pore-confined phase. Indeed, the root-mean-square displacements (RMSDs) of confined CO2 in ourexperiments are smaller than the typical crystal dimensions(Figure 2b, Figure S1). The RMSD is calculated using theexpression (nDΔ)0.5 (n = 2 for diffusion in the c-direction and n= 4 for diffusion in the ab plane). For example, given Δ = 80ms, the RMSDs are 30 μm along the c axis, and 8 μm in the abplane, values that are smaller than the typical crystal lengths(hundreds of micrometers) and widths (tens of micrometers),respectively (Figure S1). Furthermore, diffusion coefficientsmeasured for different Δ in the range of 20−160 ms showminimal variation, indicating that exchange of pore-confinedCO2 with CO2 outside of the pores is not significant at thesetime scales (Figure S9). Exchange spectroscopy additionally
Journal of the American Chemical Society Article
DOI: 10.1021/jacs.7b09453J. Am. Chem. Soc. 2018, 140, 1663−1673
1667

reveals that significant exchange of 13CO2 between crystalsoccurs on time scales of hundreds of milliseconds, much longerthan the time scales employed here (Figure S10). In contrast,PFG NMR measurements on the powdered sample (typicalcrystallite lengths up to 15 μm, widths up to 2 μm; Figure S5)yield much larger effective self-diffusion values, on the order of10−7−10−8 m2 s−1, reflecting the more rapid exchange of CO2between different crystallites as well as rapid diffusion in theintercrystallite space. Indeed, the probed RMSDs in thisexperiment are between ∼100−300 μm for a relatively shortobservation time of 20 ms, highlighting the need for largecrystals to reliably measure intracrystalline diffusion coefficients.Further PFG NMR experiments on samples dosed at
different 13CO2 gas pressures yielded similar results (see PFGNMR spectra and fits in Figures S11 and S12). The measureddiffusion parameters at pressures of 635, 1010, and 2026 mbarare shown in Figure 4c and Table 1. The diffusion values appear
relatively constant at these pressures, a result that is perhapsunsurprising given the relatively small variations in CO2 loadingin the pressure range investigated (see CO2 adsorptionisotherm in Figure S2a).Molecular Dynamics Simulations. To further probe CO2
diffusion in Zn2(dobpdc), we performed MD simulations using(i) a fully flexible MOF lattice model and (ii) a rigid MOFlattice. Figure 5a shows the time-evolution of the mean squaredisplacement (MSD) of CO2 molecules in the differentcrystallographic directions for the flexible lattice model with aCO2 pressure of 1 bar. Since log(MSD) is given by log(nD) +log(t) in the diffusive regime, a slope of 1 and a y-intercept oflog(nD) are anticipated on a log−log plot, provided thatsufficiently long times are probed to reach this regime.Inspection of the plot in Figure 5a thus informs an assessmentof the diffusion behavior of CO2 in Zn2(dobpdc).Long-range self-diffusion of CO2 occurs along the c axis, as
anticipated, with the diffusive regime (slope = 1) being reachedat times longer than ∼10 ps (Figure 5a). In contrast, diffusionof CO2 in the ab plane is limited to displacements within asingle pore, with no diffusive jumps occurring between differentchannels. This observation is reflected by the apparentplateauing of the MSD in the ab plane at long times, withthe diffusive regime never being reached. At 298 K, the MSDclimbs to ∼160 Å2 at a time of 10 ns, corresponding to a RMSDof ∼13 Å, which, as expected, is less than the pore diameter of∼22 Å.Similar behavior is apparent at all three studied temperatures
of 298, 400, and 500 K, as well as at a lower pressure of 0.01 bar(Figure S13a), indicating the absence of a thermally activateddiffusion mechanism that could allow CO2 to move betweenpores. MD simulations with a rigid lattice also revealed theabsence of long-range diffusion in the ab plane. Thisobservation from MD simulations, which is based upon theassumption of perfect crystals, is in contrast to the results fromPFG NMR experiments, where crystal defects may affect CO2diffusion (see below).
The self-diffusion coefficients along the c axis (D∥)determined from MD simulations are shown in Figure 5band Figure S13b. These simulations allow access to pressuresfrom 10 mbar to 100 bar (a much wider range of pressures, andtherefore CO2 loadings, than is accessible with our currentNMR apparatus) and reveal loading-dependent diffusionbehavior. A clear increase in D∥ is observed at very lowloadings, followed by decreases at higher loadings. We postulatethat at the lowest loadings, the small D∥ values result from thehigh density of open metal sites. Indeed, DFT calculations ofCO2 diffusion pathways in a similar MOF, Mg2(dobdc), haveshown that the energy barrier for CO2 to move from a metalsite to a neighboring unoccupied metal site is ∼300 meV (∼30kJ mol−1).21 After some of the metal sites become occupied byCO2, additional lower energy pathways may give rise to theobserved increase in D∥, particularly diffusive motion of CO2through the pore center, which bypasses interaction with metalsites that are already occupied by other CO2 molecules (forMg2(dobdc), a barrier <40 meV or >4 kJ mol−1).21 The
Table 1. Self-Diffusion Coefficients of 13CO2 in Zn2(dobpdc)at 298 K
pressure, mbar D∥, m2 s−1 D⊥, m
2 s−1 D∥/D⊥
635 5.8(±0.1) × 10−9 1.9(±0.2) × 10−10 30 ± 31010 6.2(±0.2) × 10−9 2.3(±0.3) × 10−10 27 ± 42026 6.5(±0.2) × 10−9 1.4(±0.2) × 10−10 48 ± 7
Figure 5. (a) MSDs in different crystallographic directions fromflexible MOF MD simulations at 298, 400, and 500 K and a CO2pressure of 1 bar. Individual one-dimensional MSDs were calculatedfor the a and b directions, and the average is shown in the plot. (b)Self-diffusion coefficients (298 K) along the c axis (D∥) at a range ofpressures. Values are shown for rigid and flexible lattice MDsimulations as well as those obtained using PFG NMR. The amountof CO2 adsorbed for the PFG NMR samples was estimated fromFigure S2a. See Figure S13b for a plot of D∥ against CO2 pressure.
Journal of the American Chemical Society Article
DOI: 10.1021/jacs.7b09453J. Am. Chem. Soc. 2018, 140, 1663−1673
1668

availability of these additional pathways is exemplified by theupturn in D∥ between 750 and 1000 mbar, which alsocorresponds to the point at which a loading of 1 CO2 perZn2+ site is surpassed in the simulations. At higher CO2loadings, the observed decreases in D∥ are due to CO2−CO2interactions. We note that PFG NMR gives smaller self-diffusion values than MD by a factor of ∼10, with suchdiscrepancies not uncommon in the literature.51,52 In thepresent case, differences in the experimental and simulatedvalues may arise from both the presence of crystal defects in theexperiment and small errors in the parametrization of the forcefield used for simulations.The MD simulations also allow a prediction of the chemical
shift anisotropy parameter, ΔCSA. We assume that the observedchemical shift is dependent only on the molecular orientationof CO2 relative to the applied magnetic field and thatframework−CO2 interactions do not significantly perturb thechemical shift. This is a reasonable assumption given that ourexperimentally observed isotropic chemical shifts do not deviatesignificantly from that observed for free CO2 gas (Figure 3e).Furthermore, we assume that CO2 molecules exchange rapidlybetween different adsorption sites within the pores, such asprimary sites (metal-bound) and secondary sites (not directlymetal-bound) on the NMR time scale. Following a previouslypublished procedure,40,53 we first obtain probability distribu-tions for the molecular orientations of CO2 molecules in thecrystal frame from the MD trajectories. We then obtainmotionally averaged chemical shift tensors by performing aweighted average using the orientation probability distributions(see Supporting Information for details). Predicted ΔCSA valuesare then obtained from these tensors and are compared to thereported values for solid CO2,
41 ΔCSA,solid, as the orderparameter ΔCSA/ΔCSA,solid (Table 2).
Consistent with the NMR experiments, negative ΔCSA valuesare obtained that increase in magnitude with pressure (Table2). The values show reasonable agreement, with thediscrepancies similar to those in a related study.40 The valuesfrom MD are systematically larger in magnitude than the NMRvalues. This disagreement likely arises from the presence ofcrystal defects that will affect the orientations of the CO2molecules in the pores. Our observed increase of the magnitudeof ΔCSA with pressure is consistent with recent NMRmeasurements on the related metal−organic frameworkMg2(dobdc).
23 The observed increases in |ΔCSA| with pressurelikely reflect a competition between two factors: (i) thepreferred orientation of CO2 strongly interacting with Zn2+ inprimary adsorption sites and (ii) the occupation of secondarybinding sites with a range of different orientations. At lowpressures, the majority of CO2 is bound in primary binding sites(see X-ray measurements below) and factor i will tend todominate. At higher CO2 pressures, an increasingly large
population of CO2 in secondary sites is present in the pores,and factor ii becomes increasingly important.
X-ray Crystallography. To further explore the observedCO2 diffusion behavior and the nonzero value of D⊥ from PFGNMR, we used in situ single-crystal X-ray diffraction toinvestigate the structure of Zn2(dobpdc) before (Figures 1and S14) and after (Figure 6) exposure to 1.01 bar CO2 at 298K. Activated Zn2(dobpdc) is isostructural with previouslyreported solvated structures (Figure 1),9,17 and no cleardistortions of the framework are evident following theadsorption of CO2 (Figure 6).
Table 2. ΔCSA Values for 13CO2 in Zn2(dobpdc) at 298 Kfrom MD Simulations and NMR Spectroscopy (Sample 1)
method pressure, mbar ΔCSA, ppm ΔCSA/ΔCSA,solid
MD 750 −51.4 0.241000 −51.5 0.257500 −54.9 0.26
NMR 625 −6.5 0.031010 −8.7 0.042026 −12.1 0.06
Figure 6. Views of the structure of Zn2(dobpdc) under 1.01 bar CO2obtained from single-crystal X-ray diffraction at 298 K. Light blue, red,gray, and white ellipsoids represent Zn, O, C, and H atoms,respectively. Note that CO2 was found to be disordered over twoorientations with occupancies of 34% and 30%. Thermal ellipsoids aredrawn at a 50% probability level. In panel b, CO2 atoms are omitted toenable a clear view of the pore walls.
Journal of the American Chemical Society Article
DOI: 10.1021/jacs.7b09453J. Am. Chem. Soc. 2018, 140, 1663−1673
1669

We further examined the framework structure to determine ifCO2 can pass through the small space between dobpdc4−
linkers in the ab plane (Figure 6b). The H···H separationsbetween adjacent linkers are 2.5436(3) Å (central H atoms)and 2.7781(3) Å (outer H atoms). Taking the H atom van derWaals radius to be 1.1 Å,54 the maximum pore size of ∼0.6 Å ismuch smaller than the diameter of a CO2 molecule (estimatedas 3.4 Å, twice the van der Waals radius of carbon55), such thatdiffusion of CO2 in the ab plane is not expected. There are thustwo most likely causes of the unexpected diffusion in the abplane: (i) dynamics or (ii) defects.Thermal ellipsoids drawn at a 50% probability level are
shown in Figure 6 to aid the visualization of frameworkdynamics. The ellipsoids of the framework atoms are relativelysmall under the experimental conditions at 298 K, suggestingthat there is little movement of the framework atoms over theaverage of all unit cells. We note that coordination of threeoxygen donors at each end of the dobpdc4− to the metal chains(one bridging and one nonbridging carboxylate oxygen and onebridging aryloxide oxygen) restrain the linker, limiting themotion of the phenyl rings. This contrasts to other commonMOF linkers such as bpdc2− (bpdc2− = biphenyl-4,4′-dicarboxylate) that only bind through carboxylate groups. Inthese frameworks, the phenyl groups of the linker are often freeto rotate about the phenyl−carboxylate C−C bond, whichresults in large thermal ellipsoids even at 100 K.56 Note that ourcrystallographic data does not rule out an activated process inwhich the framework distorts to allow CO2 to pass through atransient pore, which would not be discernible by crystallog-raphy. However, the flexible lattice MD simulations (Figure 5a)reveal no evidence for such an activated process, even attemperatures as high as 500 K. We therefore conclude thatframework dynamics are unlikely to be responsible for thenonzero D⊥ value observed by PFG NMR spectroscopy.A second explanation for diffusion between channels in the
ab plane is the presence of crystal defects. For example, missinglinkers or missing Zn2+ ions could result in porosity in the abplane that would otherwise be absent. Refinement of theoccupancy of the Zn2+ site relative to a fixed occupancy of thedobpdc4− linkers suggests a slight deficiency of zinc, with94.8(4)% and 96.8(4)% of the anticipated electron densityobserved for activated and CO2-dosed (1.01 bar) Zn2(dobpdc),respectively. Inductively coupled plasma optical emissionspectrometry (ICP-OES) also indicated a slight deficiency ofzinc compared to the expected molecular formula. Althoughelemental analysis gave H and C mass ratios that agree with theexpected values for Zn2(dobpdc) within error (Table S2), wenote that some types of defects may not lead to significantchanges in the material stoichiometry. The nature of thepossible defects in this class of frameworks remains an activearea of investigation.Returning to the X-ray diffraction experiments, the CO2-
loaded structure (Figure 6) allows two preferred binding sitesfor CO2 to be resolved. The primary adsorption site lies at theopen Zn2+ coordination sites of the framework. We find thatthe Zn−OCO2
distance is 2.528(12) Å, which is slightly longerthan the distance of 2.43(4) Å determined by powder neutrondiffraction from an earlier study of CO2-dosed Zn2(dobdc) at10 K.14 This disparity in the distances may arise from the largedifference in data collection temperature for the two structures.By comparison, the most common Zn−OCO2
distance from ourMD simulations at similar conditions (1 bar CO2, 298 K) is
2.8−2.9 Å. This is in reasonable agreement with the DFTcalculations to which the MD force field was parametrized,though slightly longer than that from X-ray diffraction. Fromprevious DFT calculations using a dispersion-corrected func-tional,57,58 it was observed that the preferred Zn−OCO2
distancein Zn2(dobdc) is 2.7 Å, which is approximately 0.2 Å longerthan the other equilibrium M−OCO2
distances calculated (M =Mg, Co, Fe, and Ni) and also slightly longer than that observedexperimentally by diffraction. A systematic overestimation ofthe M−OCO2
distances from DFT calculations has beenobserved previously with the same dispersion-corrected func-tional.14 The longer distance obtained from MD may also bepartly accounted for by the relatively large thermal ellipsoid ofthe metal-bound oxygen in the X-ray diffraction structure(Figure 6a), which will tend to lengthen the Zn−OCO2
distance.The bound CO2 molecule in our X-ray structure exhibitsdisorder over two orientations with Zn−O−C angles of152(3)° and 122(3)° and occupancies of 34% and 30%,respectively (Figure 6a). These occupancies correspond to atotal of 0.64 CO2 molecules per Zn, which is similar to thevalue of 0.72 expected from the gas sorption isotherm (FigureS2). The discrepancy between the two values likely arises dueto the presence of some CO2 at secondary binding sites, whichare not resolvable in the diffraction experiments carried outhere but can be seen in our MD simulations (Figure S15). Inthe future, variable-pressure crystallographic experiments mayhelp us to further understand the nature of the different bindingsites, as has been performed for the smaller pore M2(dobdc)materials.14,59−61
■ CONCLUSIONSThe foregoing results demonstrate how the residual chemicalshift anisotropy for CO2 confined in the pores of the metal−organic framework Zn2(dobpdc) allows measurement of thediffusion anisotropy using PFG NMR spectroscopy. Surpris-ingly, we find that the pore-confined gas is able to diffusebetween adjacent framework channels in the ab plane, with self-diffusion coefficients of D∥ = (5.8 ± 0.1) × 10−9 m2 s−1 andD⊥ = (1.9 ± 0.2) × 10−10 m2 s−1 at 298 K and a pressure of 625mbar of CO2. Measurements at gas pressures between 625 and2026 mbar yielded very similar diffusion values, while MDsimulations showed significant variations of self-diffusion atmore extreme pressures. In situ single-crystal X-ray diffractionexperiments revealed no obvious structural distortions upon theadsorption of CO2, while flexible lattice MD simulationsrevealed no diffusion between different channels in the abplane. These findings indicate that defects in the frameworkstructure are likely responsible for the observed nonzerodiffusion in the ab plane. The marked diffusion anisotropyopens considerable opportunities for crystal engineering forCO2 capture as well as other gas storage and separationapplications, both for adsorbents and mixed-matrix membranes.For example, one could tune the crystal shapes and sizes tooptimize fast adsorption and desorption, while the possibility oforienting MOF crystals with anisotropic diffusion properties inmembranes should also be explored. The approaches describedherein should be readily applicable to other porous materialsexhibiting anisotropic pore structures.
■ EXPERIMENTAL SECTIONMaterials and Methods. All manipulations were performed under
an N2 atmosphere in a VAC atmospheres glovebox or using standard
Journal of the American Chemical Society Article
DOI: 10.1021/jacs.7b09453J. Am. Chem. Soc. 2018, 140, 1663−1673
1670

Schlenk techniques. The ligand H4dobpdc was purchased fromHangzhou Trylead Chemical Technology Co. N,N-Dimethylacetamide(DMA) and methanol were dried over 3 Å molecular sieves and thendegassed via three successive freeze−pump−thaw cycles. Toluene andN,N-dimethylformamide (DMF) were deoxygenated by purging withAr for 1 h and dried using a commercial solvent purification systemdesigned by JC Meyer Solvent Systems. All other reagents werepurchased from commercial sources and used without furtherpurification. Adsorption isotherms for CO2 and N2 were obtained byvolumetric methods using a Micromeritics ASAP 2020 gas adsorptionanalyzer. All gases were 99.998% purity or higher. The CO2 isothermrecorded at 25 °C was measured using a circulating water bath. The N2isotherm at 77 K was measured using a liquid nitrogen bath.Laboratory powder X-ray diffraction patterns were collected using aBruker AXS D8 Advance diffractometer using Cu Kα radiation (λ =1.5418 Å). Elemental analysis (H, C, and N) was conducted using aPerkinElmer 2400 Series II combustion analyzer. Inductively CoupledPlasma Optical Emission Spectrometry (ICP-OES) was conductingusing an ICP Optima 7000 DV instrument.Preparation of Zn2(dobpdc) Single Crystals. A previously
reported method was used to produce Zn2(dobpdc) crystals.17 Briefly,
H4dobpdc (164.6 mg, 600.0 μmol) was dissolved in 20 mL of DMA,while Zn(NO3)2·6H2O (446.2 mg, 1500 μmol) was dissolved in 40mL of a 1:1 (v/v) mixture of distilled water and ethanol. The twosolutions were combined, and ∼10 mL aliquots were dispensed into0.5 in. outer diameter borosilicate tubes. Each tube was subjected tothree freeze−pump−thaw cycles and then flame-sealed. The sealedtubes were placed in an oven preheated to 100 °C and kept at thattemperature for 2 days. The resulting pale yellow, needle-shapedcrystals were collected and washed by soaking in excess dry DMA, drymethanol, and dry toluene (3 washes for each solvent, each wash for atleast 2 h at room temperature) under an Ar atmosphere. The crystalsfor sample 1 were activated at 250 °C under flowing Ar for 12 h. Forsample 2, a second 24 h activation period (at 250 °C under highvacuum) was carried out.Synthesis of Zn2(dobpdc) Powder. A 1 L three-neck round-
bottom flask was charged with H4dobpdc (2.74 g, 10.0 mmol), ZnBr2·2H2O (8.35 g, 32.0 mmol), ethanol (250 mL), and DMF (250 mL).The mixture was deoxygenated by purging with dry Ar for 1 h. Theresulting solution was heated with magnetic stirring for 12 h at 120 °Cunder an Ar atmosphere. After the reaction mixture was allowed tocool to room temperature, the solvent was decanted, and the resultingoff-white microcrystalline powder was washed by soaking three timesin 500 mL of dry DMF at 120 °C for 24 h, then soaking three times in500 mL of dry methanol at 120 °C for 24 h. The methanol-solvatedpowder was then filtered under Ar via cannula and desolvated byheating under dynamic vacuum at 180 °C for 24 h to give fullydesolvated Zn2(dobpdc). Yield: 1.94 g (48.4%). Langmuir surface area(N2, 77 K): 3110 m2/g. The powder X-ray diffraction pattern of thematerial was found to match the pattern simulated from the single-crystal structure (see Figure S16).Single-Crystal X-ray Diffraction Experiments. Activation and
gas dosing of single crystals were performed using a custom-designedenvironmental gas cell modified from a previous system.61 A singlecrystal was first mounted on a MiTeGen loop using a minimal amountof epoxy, taking care to avoid the ends of the rod-shaped crystals. Thesample was then transferred to the environmental cell, which consistsof a borosilicate capillary with a vacuum-tight O-ring seal and aBeswick ball valve for dosing. Within the cell, the crystal wasdesolvated for 1 h at an external temperature of 200 °C using anOxford Cryosystems cryostream and a turbomolecular pump. Aftersolving the structure to confirm the absence of residual solvent in thepores, the crystal was cooled to 298 K, and the activated structure wascollected. The crystal was then dosed with 1.01 bar of CO2 to obtainthe structure of Zn2(dobpdc)·1.26CO2.Single-crystal X-ray diffraction data were collected at Beamline
11.3.1 at the Advanced Light Source, Lawrence Berkeley NationalLaboratory, using synchrotron radiation (λ = 0.7749 Å) and a BrukerAXS D8 diffractometer equipped with a PHOTON100 CMOSdetector. Both Zn2(dobpdc) and Zn2(dobpdc)·1.26CO2 were refined
in space group P3121 as inversion twins based on Flack parametervalues near 0.5. Raw data were corrected for Lorenz and polarizationeffects using Bruker AXS SAINT software62 and were corrected forabsorption using SADABS.63 The structures were solved usingSHELXT64 and refined using SHELXL65 operated in the OLEX266
interface. Thermal parameters were refined anisotropically for all non-hydrogen atoms. All hydrogen atoms were placed geometrically andrefined using a riding model. Disorder modeling of the CO2 moleculesbound to Zn2+ in Zn2(dobpdc)·1.26CO2 required the use ofdisplacement parameter (RIGU and SIMU) and distance (DFIX)restraints.
Face-indexing was performed at the CheXray Facility at UCBerkeley with a hexanes-solvated single crystal of Zn2(dobpdc)exposed to air. The crystal was mounted on a Bruker QUAZARdiffractometer (Mo Kα, λ = 0.71073 Å) equipped with a Bruker APEXII detector. Analysis of the crystal was performed using the BrukerAPEX3 software.62
Preparation of Samples for NMR Experiments. Valved high-pressure 5 mm NMR tubes (Norell) were filled with activated crystals,and the tube was connected to a custom dosing apparatus (Figure 2a).Samples were first evacuated for at least 30 min before dosing with13C-enriched CO2 gas (Sigma-Aldrich, 99 atom % 13C, <3 atom %18O) for 30 min for equilibration. For ex situ dosing (as performed forsample 1), the valve on the NMR tube was then closed before NMRmeasurements. For in situ dosing (sample 2), measurements weremade with the sample still attached to the custom dosing manifold.Here a long piece of copper tubing was used to connect the sampleinside the NMR magnet to the dosing manifold.
NMR Experiments. Static NMR experiments were conductedusing the magnetic field strengths indicated in the figure captions.Liquid state probes and 5 mm sample tubes were used for all staticmeasurements. MAS experiments (spectra are shown in theSupporting Information) were conducted using a DOTY 4 mmdouble resonance probe. For PFG NMR experiments, a Diff-30 probeand a 13-interval pulse sequence with bipolar magnetic field gradientpulses was employed (Figure S8).67 Gradients were calibrated usingthe known self-diffusion coefficient of water at 25 °C (2.3 × 10⁻⁹ m2
s−1).68 To test the system performance, diffusion coefficients weremeasured and verified against literature values for acetone, cyclo-hexane, toluene, and glycerol at 24 °C,68−70 covering a range of self-diffusion coefficients from 5 × 10⁻⁹ m2 s−1 (acetone) to 2 × 10⁻¹² m2
s−1 (glycerol). For experiments on MOF samples, the effectiveduration of the individual magnetic field gradient pulses (δ′) was 1 ms,and the maximum magnetic field gradient strength applied was 9 Tm−1, with sine-shaped gradient pulses used. Observation times (Δ) arestated in the text and were set to integer multiples of the period (20ms) of the 50 Hz mains alternating current to mitigate potential issuesfrom residual mains hum.31 The parameter τ was 3 ms (Figure S8).The PFG NMR decays were analyzed using eqs 3 and 4 and a fittingprogram written in Matlab software. 13C NMR chemical shifts arereferenced to the ethylene carbon of neat ethanol at 57.4 ppm as asecondary reference relative to tetramethylsilane (1 vol % indeuterated chloroform) at 0.0 ppm, except for MAS experimentsthat are referenced to the tertiary carbon atom in adamantane at 38.5ppm.
Molecular Dynamics Simulations. Molecular dynamics (MD)simulations were performed in the NVT ensemble with LAMMPS71
using a time step of 1.0 fs and the Nose−Hoover chain thermostat.72,73The dynamics of CO2 were treated using a rigid-body timeintegrator.74 The CO2 molecules were modeled using the TraPPEforce field,75 and CO2−framework interactions were modeled using apreviously published force field.58 The flexible lattice simulationsrequired a molecular model for the framework atoms. Bond, angle,dihedral, and torsion parameters for linker molecules were taken fromthe consistent valence force field,76 while Zn2+ ions were modeledusing a cationic dummy model.77 Lorenz−Berthelot mixing rules wereused to calculate cross-interactions between Zn2+ and linker atoms.For simulations at different pressures, the framework was loaded with anumber of CO2 molecules corresponding to previously publishedisotherms.58 All MD simulations were equilibrated for 1 ns, and
Journal of the American Chemical Society Article
DOI: 10.1021/jacs.7b09453J. Am. Chem. Soc. 2018, 140, 1663−1673
1671

production runs lasted at least 10 ns to ensure that the mean-squareddisplacement (MSD) became linear as a function of time. The order-nalgorithm78,79 was used to calculate the MSD as a function of time, andthe 1D self-diffusion coefficients were obtained by fitting the slope of
the linear regime: = ⟨ − ⟩→∞
D r t rlim [ ( ) (0)]t t
12
dd
2
■ ASSOCIATED CONTENT
*S Supporting InformationThe Supporting Information is available free of charge on theACS Publications website at DOI: 10.1021/jacs.7b09453.
Gas sorption, microscopy, elemental analysis, ICP,addit ional NMR spectra, characterization ofZn2(dobpdc) powder, and additional experimental de-tails (PDF)Crystallographic data for Zn2(dobpdc) (CIF)Crystallographic data for Zn2(dobpdc)·1.26CO2 (CIF)
■ AUTHOR INFORMATION
Corresponding Authors*[email protected]*[email protected]
ORCIDAlexander C. Forse: 0000-0001-9592-9821Velencia J. Witherspoon: 0000-0002-2718-6605Sudi Jawahery: 0000-0001-9950-6199Berend Smit: 0000-0003-4653-8562Jeffrey R. Long: 0000-0002-5324-1321NotesThe authors declare no competing financial interest.
■ ACKNOWLEDGMENTS
This research was supported through the Center for GasSeparations Relevant to Clean Energy Technologies, an EnergyFrontier Research Center funded by the U.S. Department ofEnergy (DOE), Office of Science, Office of Basic EnergySciences, under Award DE-SC0001015. We thank thePhilomathia Foundation and Berkeley Energy and ClimateInstitute for support of A.C.F. through a postdoctoralfellowship, the National Institutes of Health for support ofP.J.M. through a postdoctoral fellowship (GM120799), and theMiller Institute for Basic Research in Science for support ofJ.D.M. through a postdoctoral fellowship. This work employedresources at the Advanced Light Source at Lawrence BerkeleyNational Lab, a user facility supported by the Director, Office ofScience, Office of Basic Energy Sciences, of the DOE underContract No. DE-AC02-05CH11231. Single-crystal X-raydiffraction equipment within the UC Berkeley CheXray Facilitywas supported by NIH shared Instrumentation Grant S10-RR027172. We thank ACalNet, the Aachen-California Networkof Academic Exchange (DAAD Germany) for supporting aresearch visit of A.C.F. to RWTH Aachen University. Wefurther thank Stefan Benders and Patrick Offer for usefuldiscussions and assistance with PFG NMR experiments, KristenColwell for obtaining SEM images, Julia Oktawiec for assistancewith gas adsorption measurements, Richard Bounds forassistance with the development of gas dosing equipment forin situ NMR experiments, and Katie R. Meihaus for providingeditorial assistance.
■ REFERENCES(1) Rosi, N. L.; Kim, J.; Eddaoudi, M.; Chen, B.; O'Keeffe, M.; Yaghi,O. M. J. Am. Chem. Soc. 2005, 127, 1504.(2) Dietzel, P. D. C.; Morita, Y.; Blom, R.; Fjellvag, H. Angew. Chem.,Int. Ed. 2005, 44, 6354.(3) Dietzel, P. D. C.; Panella, B.; Hirscher, M.; Blom, R.; Fjellvag, H.Chem. Commun. 2006, 959.(4) Dietzel, P. D. C.; Blom, R.; Fjellvag, H. Eur. J. Inorg. Chem. 2008,2008, 3624.(5) Zhou, W.; Wu, H.; Yildirim, T. J. Am. Chem. Soc. 2008, 130,15268.(6) Bloch, E. D.; Murray, L. J.; Queen, W. L.; Chavan, S.; Maximoff,S. N.; Bigi, J. P.; Krishna, R.; Peterson, V. K.; Grandjean, F.; Long, G.J.; Smit, B.; Bordiga, S.; Brown, C. M.; Long, J. R. J. Am. Chem. Soc.2011, 133, 14814.(7) Sanz, R.; Martinez, F.; Orcajo, G.; Wojtas, L.; Briones, D. Dalt.Trans. 2013, 42, 2392.(8) Díaz-García, M.; Sanchez-Sanchez, M. Microporous MesoporousMater. 2014, 190, 248.(9) McDonald, T. M.; Lee, W. R.; Mason, J. A.; Wiers, B. M.; Hong,C. S.; Long, J. R. J. Am. Chem. Soc. 2012, 134, 7056.(10) McDonald, T. M.; Mason, J. A.; Kong, X.; Bloch, E. D.; Gygi,D.; Dani, A.; Crocella, V.; Giordanino, F.; Odoh, S. O.; Drisdell, W. S.;Vlaisavljevich, B.; Dzubak, A. L.; Poloni, R.; Schnell, S. K.; Planas, N.;Lee, K.; Pascal, T.; Wan, L. F.; Prendergast, D.; Neaton, J. B.; Smit, B.;Kortright, J. B.; Gagliardi, L.; Bordiga, S.; Reimer, J. A.; Long, J. R.Nature 2015, 519, 303.(11) Gygi, D.; Bloch, E. D.; Mason, J. A.; Hudson, M. R.; Gonzalez,M. I.; Siegelman, R. L.; Darwish, T. A.; Queen, W. L.; Brown, C. M.;Long, J. R. Chem. Mater. 2016, 28, 1128.(12) Caskey, S. R.; Wong-Foy, A. G.; Matzger, A. J. J. Am. Chem. Soc.2008, 130, 10870.(13) Mason, J. A.; Sumida, K.; Herm, Z. R.; Krishna, R.; Long, J. R.Energy Environ. Sci. 2011, 4, 3030.(14) Queen, W. L.; Hudson, M. R.; Bloch, E. D.; Mason, J. A.;Gonzalez, M. I.; Lee, J. S.; Gygi, D.; Howe, J. D.; Lee, K.; Darwish, T.A.; James, M.; Peterson, V. K.; Teat, S. J.; Smit, B.; Neaton, J. B.; Long,J. R.; Brown, C. M. Chem. Sci. 2014, 5, 4569.(15) Britt, D.; Furukawa, H.; Wang, B.; Glover, T. G.; Yaghi, O. M.Proc. Natl. Acad. Sci. U. S. A. 2009, 106, 20637.(16) Mason, J. A.; McDonald, T. M.; Bae, T.; Bachman, J. E.; Sumida,K.; Dutton, J. J.; Kaye, S. S.; Long, R. J. Am. Chem. Soc. 2015, 137,4787.(17) Siegelman, R. L.; McDonald, T. M.; Gonzalez, M. I.; Martell, J.D.; Milner, P. J.; Mason, J. A.; Berger, A. H.; Bhown, A. S.; Long, J. R.J. Am. Chem. Soc. 2017, 139, 10526.(18) Milner, P. J.; Siegelman, R. L.; Forse, A. C.; Gonzalez, M. I.;Runcevski, T.; Martell, J. D.; Reimer, J. A.; Long, J. R. J. Am. Chem. Soc.2017, 139, 13541.(19) Lee, W. R.; Jo, H.; Yang, L.-M.; Lee, H.; Ryu, D. W.; Lim, K. S.;Song, J. H.; Min, D. Y.; Han, S. S.; Seo, J. G.; Park, Y. K.; Moon, D.;Hong, C. S. Chem. Sci. 2015, 6, 3697.(20) Jo, H.; Lee, W. R.; Kim, N. W.; Jung, H.; Lim, K. S.; Kim, J. E.;Kang, D. W.; Lee, H.; Hiremath, V.; Seo, J. G.; Jin, H.; Moon, D.; Han,S. S.; Hong, C. S. ChemSusChem 2017, 10, 541.(21) Canepa, P.; Nijem, N.; Chabal, Y. J.; Thonhauser, T. Phys. Rev.Lett. 2013, 110, 026102.(22) Lin, L.-C.; Kim, J.; Kong, X.; Scott, E.; McDonald, T. M.; Long,J. R.; Reimer, J. A.; Smit, B. Angew. Chem., Int. Ed. 2013, 52, 4410.(23) Marti, R. M.; Howe, J. D.; Morelock, C. R.; Conradi, M. S.;Walton, K. S.; Sholl, D. S.; Hayes, S. E. J. Phys. Chem. C 2017, 121,25778.(24) Karger, J.; Ruthven, D. M.; Theodorou, D. N. Diffusion inNanoporous Materials; Wiley-VCH, 2012.(25) Karger, J.; Spindler, H. J. Am. Chem. Soc. 1991, 113, 7571.(26) Stallmach, F.; Groger, S.; Kunzel, V.; Karger, J.; Yaghi, O. M.;Hesse, M.; Muller, U. Angew. Chem., Int. Ed. 2006, 45, 2123.(27) Valiullin, R.; Porcheron, F.; Woo, H.-J.; Naumov, S.; Galvosas,P.; Monson, P. A.; Karger, J. Nature 2006, 443, 965.
Journal of the American Chemical Society Article
DOI: 10.1021/jacs.7b09453J. Am. Chem. Soc. 2018, 140, 1663−1673
1672

(28) Li, J.; Park, J. K.; Moore, R. B.; Madsen, L. A. Nat. Mater. 2011,10, 507.(29) Forse, A. C.; Griffin, J. M.; Merlet, C.; Carretero-Gonzalez, J.;Raji, A.-R. O.; Trease, N. M.; Grey, C. P. Nat. Energy 2017, 2, 16216.(30) Forman, E. M.; Pimentel, B. R.; Ziegler, K. J.; Lively, R. P.;Vasenkov, S. Microporous Mesoporous Mater. 2017, 248, 158.(31) Callaghan, P. T. Translational Dynamics & Magnetic Resonance;Oxford University Press, 2011.(32) Callaghan, P. T. Principles of Nuclear Magnetic ResonanceMicroscopy; Oxford University Press, 1991.(33) Furo, I.; Dvinskikh, S. V. Magn. Reson. Chem. 2002, 40, S3.(34) Topgaard, D. J. Magn. Reson. 2017, 275, 98.(35) Blinc, R.; Burgar, M.; Luzar, M.; Pirs, J.; Zupancic, I.; Zumer, S.Phys. Rev. Lett. 1974, 33, 1192.(36) Callaghan, P. T.; Le Gros, M. A.; Pinder, D. N. J. Chem. Phys.1983, 79, 6372.(37) Dvinskikh, S. V.; Furo, I. J. Magn. Reson. 2001, 148, 73.(38) Kadi, M.; Dvinskikh, S. V.; Furo, I.; Almgren, M. Langmuir2002, 18, 5015.(39) Peksa, M.; Lang, J.; Stallmach, F. Microporous Mesoporous Mater.2015, 205, 11.(40) Peksa, M.; Burrekaew, S.; Schmid, R.; Lang, J.; Stallmach, F.Microporous Mesoporous Mater. 2015, 216, 75.(41) Bowers, C. R.; Long, H. W.; Pietrass, T.; Pines, A.; Gaede, H. C.Chem. Phys. Lett. 1993, 205, 168.(42) Kong, X.; Scott, E.; Ding, W.; Mason, J. A.; Long, J. R.; Reimer,J. A. J. Am. Chem. Soc. 2012, 134, 14341.(43) Hoffmann, H.; Debowski, M.; Muller, P.; Paasch, S.; Senkovska,I.; Kaskel, S.; Brunner, E. Materials 2012, 5, 2537.(44) Bon, V.; Pallmann, J.; Eisbein, E.; Hoffmann, H. C.; Senkovska,I.; Schwedler, I.; Schneemann, A.; Henke, S.; Wallacher, D.; Fischer, R.A.; Seifert, G.; Brunner, E.; Kaskel, S. Microporous Mesoporous Mater.2015, 216, 64.(45) Chen, S.; Lucier, B. E. G.; Boyle, P. D.; Huang, Y. Chem. Mater.2016, 28, 5829.(46) Zhang, Y.; Lucier, B. E. G.; Huang, Y. Phys. Chem. Chem. Phys.2016, 18, 8327.(47) Lu, Y.; Lucier, B. E. G.; Zhang, Y.; Ren, P.; Zheng, A.; Huang, Y.Phys. Chem. Chem. Phys. 2017, 19, 6130.(48) Winn, E. B. Phys. Rev. 1950, 80, 1024.(49) Tovar, T. M.; Zhao, J.; Nunn, W. T.; Barton, H. F.; Peterson, G.W.; Parsons, G. N.; Levan, M. D. J. Am. Chem. Soc. 2016, 138, 11449.(50) Salles, F.; Jobic, H.; Devic, T.; Llewellyn, P. L.; Serre, C.; Ferey,G.; Maurin, G. ACS Nano 2010, 4, 143.(51) Jobic, H.; Laloue, N.; Laroche, C.; van Baten, J. M.; Krishna, R.J. Phys. Chem. B 2006, 110, 2195.(52) Fernandez, M.; Karger, J.; Freude, D.; Pampel, A.; van Baten, J.M.; Krishna, R. Microporous Mesoporous Mater. 2007, 105, 124.(53) Alavi, S.; Dornan, P.; Woo, T. K. ChemPhysChem 2008, 9, 911.(54) Rowland, R. S.; Taylor, R. J. Phys. Chem. 1996, 100, 7384.(55) Bondi, A. J. Phys. Chem. 1964, 68, 441.(56) Øien, S.; Wragg, D.; Reinsch, H.; Svelle, S.; Bordiga, S.;Lamberti, C.; Lillerud, K. P. Cryst. Growth Des. 2014, 14, 5370.(57) Lin, L.-C.; Lee, K.; Gagliardi, L.; Neaton, J. B.; Smit, B. J. Chem.Theory Comput. 2014, 10, 1477.(58) Mercado, R.; Vlaisavljevich, B.; Lin, L.-C.; Lee, K.; Lee, Y.;Mason, J. A.; Xiao, D. J.; Gonzalez, M. I.; Kapelewski, M. T.; Neaton, J.B.; Smit, B. J. Phys. Chem. C 2016, 120, 12590.(59) Dietzel, P. D. C.; Johnsen, R. E.; Fjellvag, H.; Bordiga, S.;Groppo, E.; Chavan, S.; Blom, R. Chem. Commun. 2008, 2, 5125.(60) Pato-Doldan, B.; Rosnes, M. H.; Dietzel, P. D. C. ChemSusChem2017, 10, 1710.(61) Gonzalez, M. I.; Mason, J. A.; Bloch, E. D.; Teat, S. J.; Gagnon,K. J.; Morrison, G. Y.; Queen, W. L.; Long, J. R. Chem. Sci. 2017, 8,4387.(62) SAINT, APEX2, and APEX3 Software for CCD Diffractometers,Bruker Analytical X-ray Systems Inc., Madison, WI, 2014.(63) Sheldrick, G. M. SADABS, program for empirical absorptioncorrection of area detector data; University of Gottingen, Germany.
(64) Sheldrick, G. M. Acta Crystallogr., Sect. A: Found. Adv. 2015, 71,3.(65) Sheldrick, G. M. Acta Crystallogr., Sect. C: Struct. Chem. 2015, 71,3.(66) Dolomanov, O. V.; Bourhis, L. J.; Gildea, R. J.; Howard, J. A. K.;Puschmann, H. J. Appl. Crystallogr. 2009, 42, 339.(67) Cotts, R. M.; Hoch, M. J. R.; Sun, T.; Markert, J. T. J. Magn.Reson. 1989, 83, 252.(68) Holz, M.; Heil, S. R.; Sacco, A. Phys. Chem. Chem. Phys. 2000, 2,4740.(69) Kruger, G. J.; Weiss, R. Z. Naturforsch Tl. A 1970, 25, 777.(70) Burnett, L. J.; Harmon, J. F. J. Chem. Phys. 1972, 57, 1293.(71) Plimpton, S. J. Comput. Phys. 1995, 117, 1.(72) Nose, S. A. Mol. Phys. 1984, 52, 255.(73) Hoover, W. G. Phys. Rev. A: At., Mol., Opt. Phys. 1985, 31, 1695.(74) Kamberaj, H.; Low, R. J.; Neal, M. P. J. Chem. Phys. 2005, 122,224114.(75) Wick, C. D.; Martin, M. G.; Siepmann, J. I. J. Phys. Chem. B2000, 104, 8008.(76) Dauber-Osguthorpe, P.; Roberts, V. A.; Osguthorpe, D. J.;Wolff, J.; Genest, M.; Hagler, A. T. Proteins: Struct., Funct., Genet. 1988,4, 31.(77) Duarte, F.; Bauer, P.; Barrozo, A.; Amrein, B. A.; Purg, M.;Åqvist, J.; Kamerlin, S. C. L. J. Phys. Chem. B 2014, 118, 4351.(78) Frenkel, D.; Smit, B. Understanding Molecular Simulation: FromAlgorithms to Applications; Elsevier Science, 2002.(79) Dubbeldam, D.; Ford, D.; Ellis, D.; Snurr, R. Mol. Simul. 2009,35, 1084.
Journal of the American Chemical Society Article
DOI: 10.1021/jacs.7b09453J. Am. Chem. Soc. 2018, 140, 1663−1673
1673