unfunded need $1.5 billion 7% of unfunded need (2019-45)
TRANSCRIPT
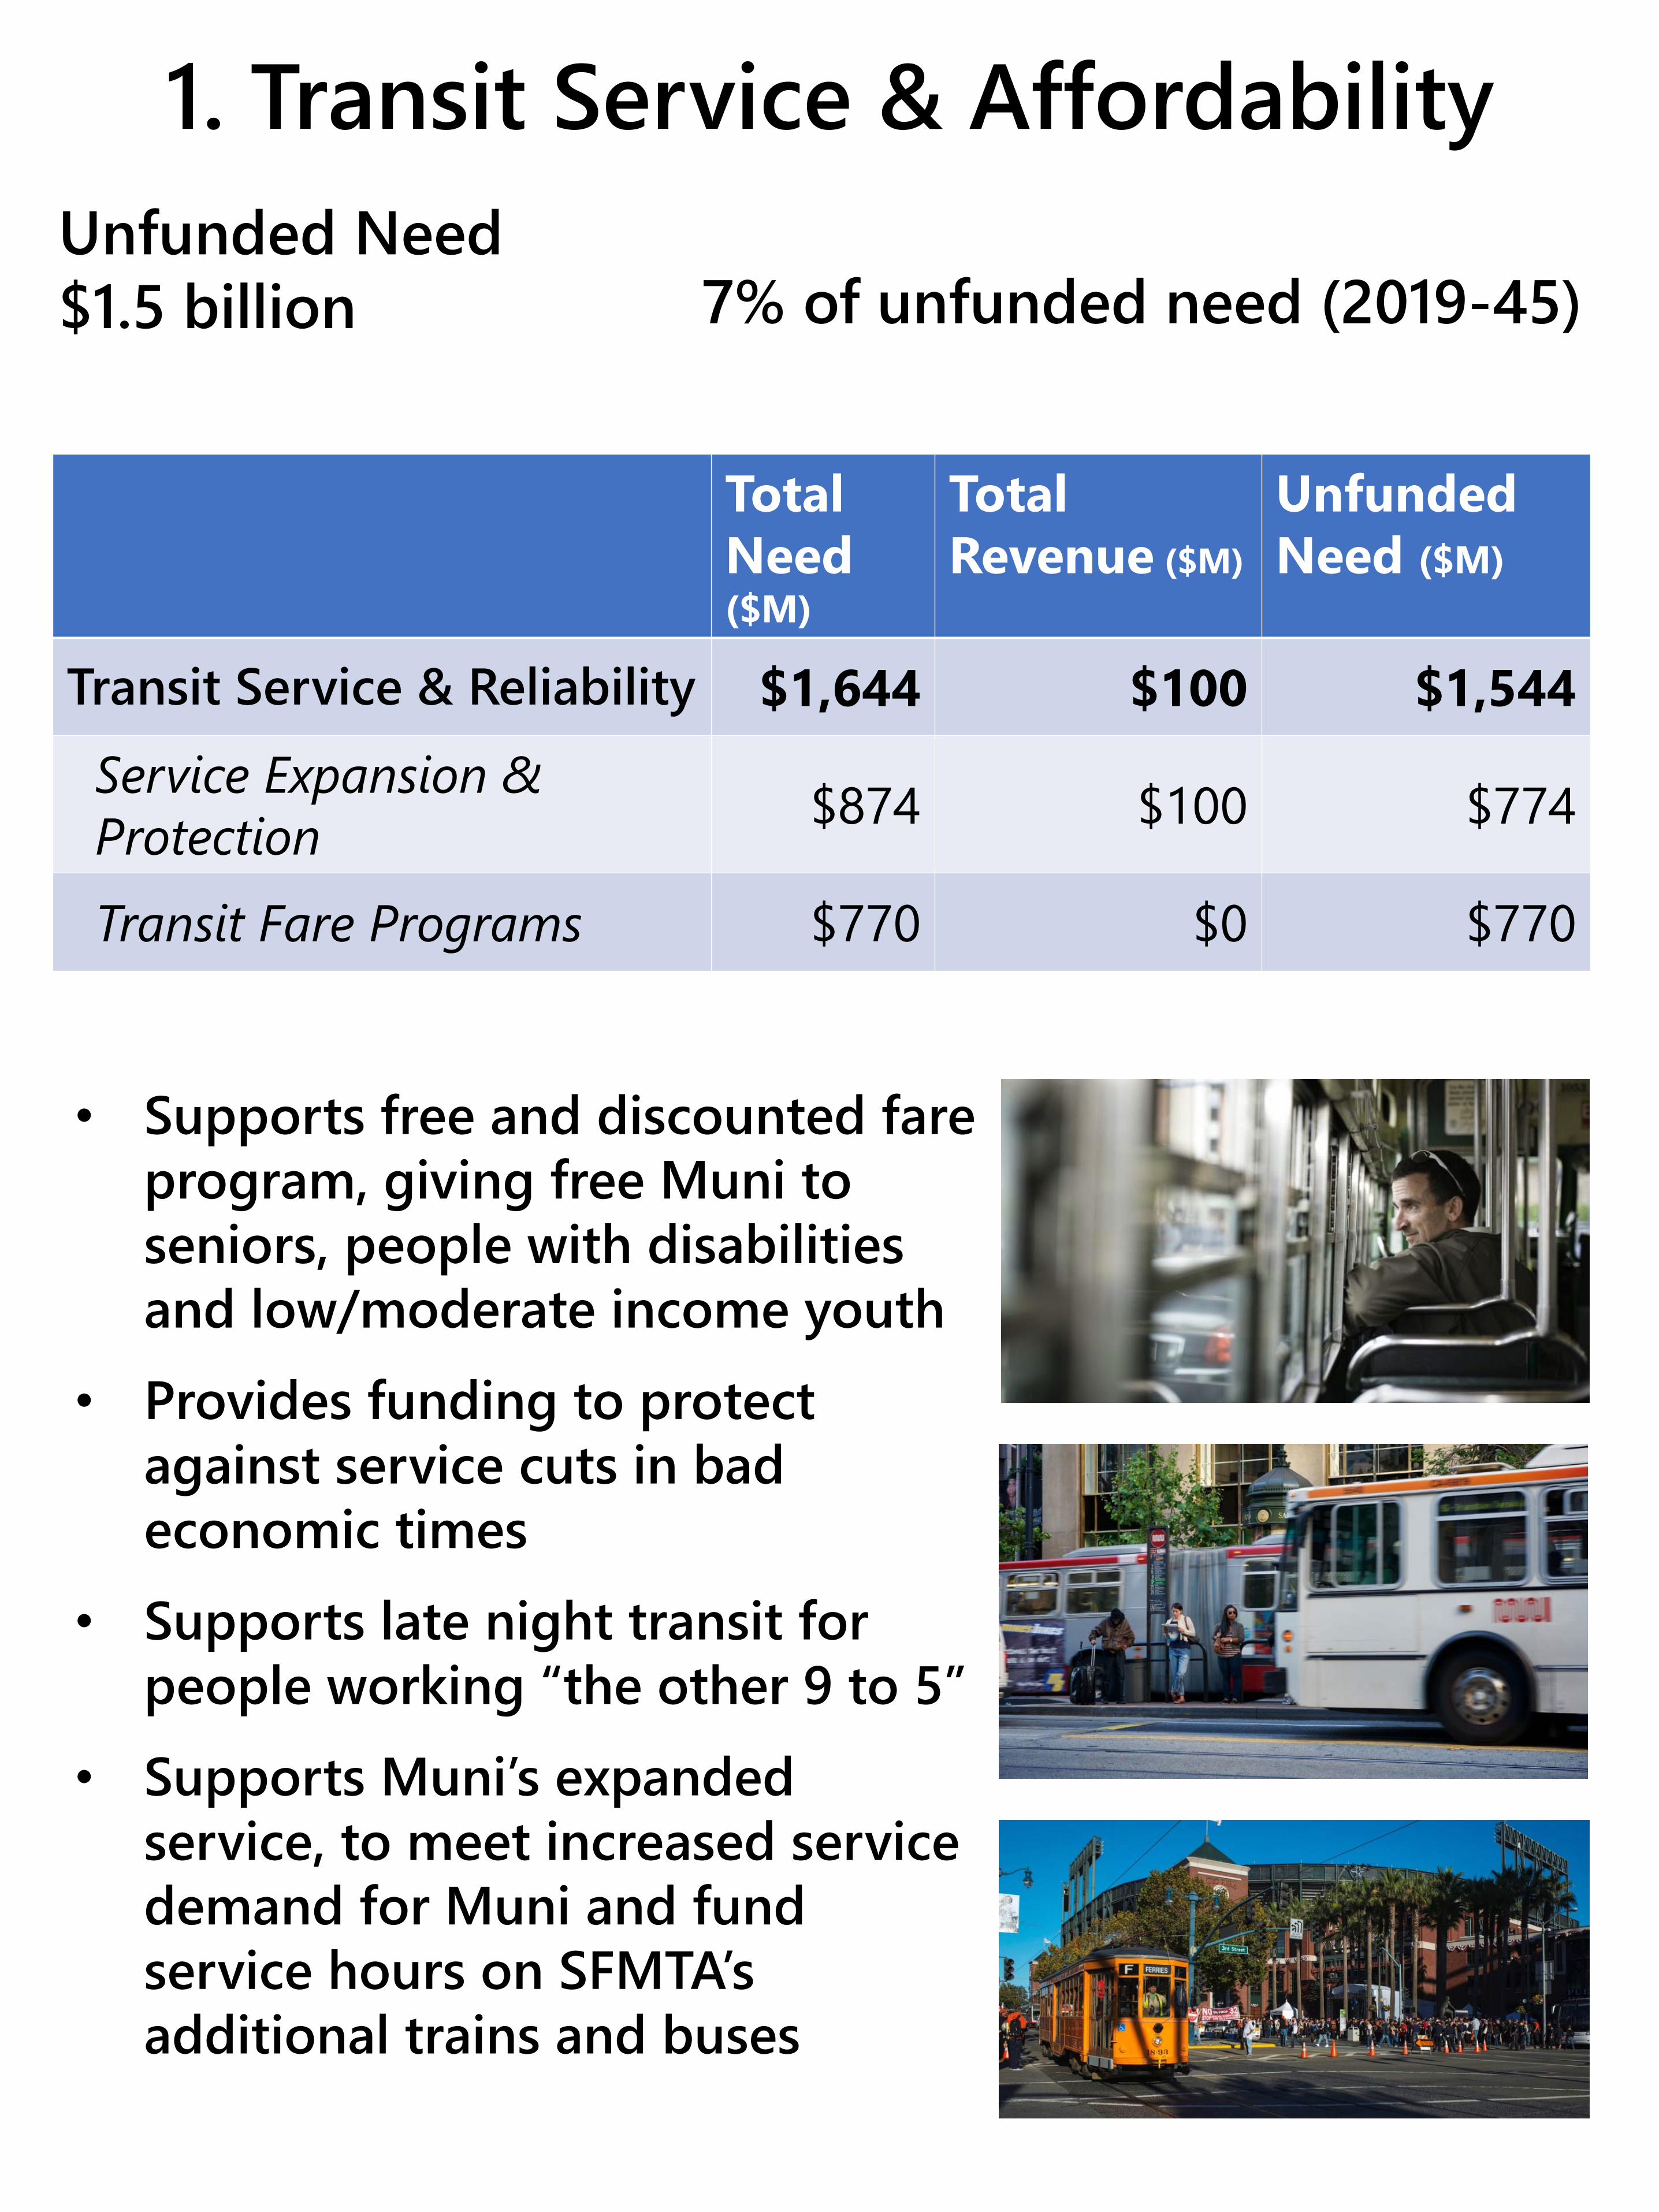
Unfunded Need $1.5 billion 7% of unfunded need (2019-45)
Total Need ($M)
Total Revenue ($M)
Unfunded Need ($M)
Transit Service & Reliability $1,644 $100 $1,544Service Expansion & Protection $874 $100 $774
Transit Fare Programs $770 $0 $770
• Supports free and discounted fare program, giving free Muni to seniors, people with disabilities and low/moderate income youth
• Provides funding to protect against service cuts in bad economic times
• Supports late night transit for people working “the other 9 to 5”
• Supports Muni’s expanded service, to meet increased service demand for Muni and fund service hours on SFMTA’s additional trains and buses
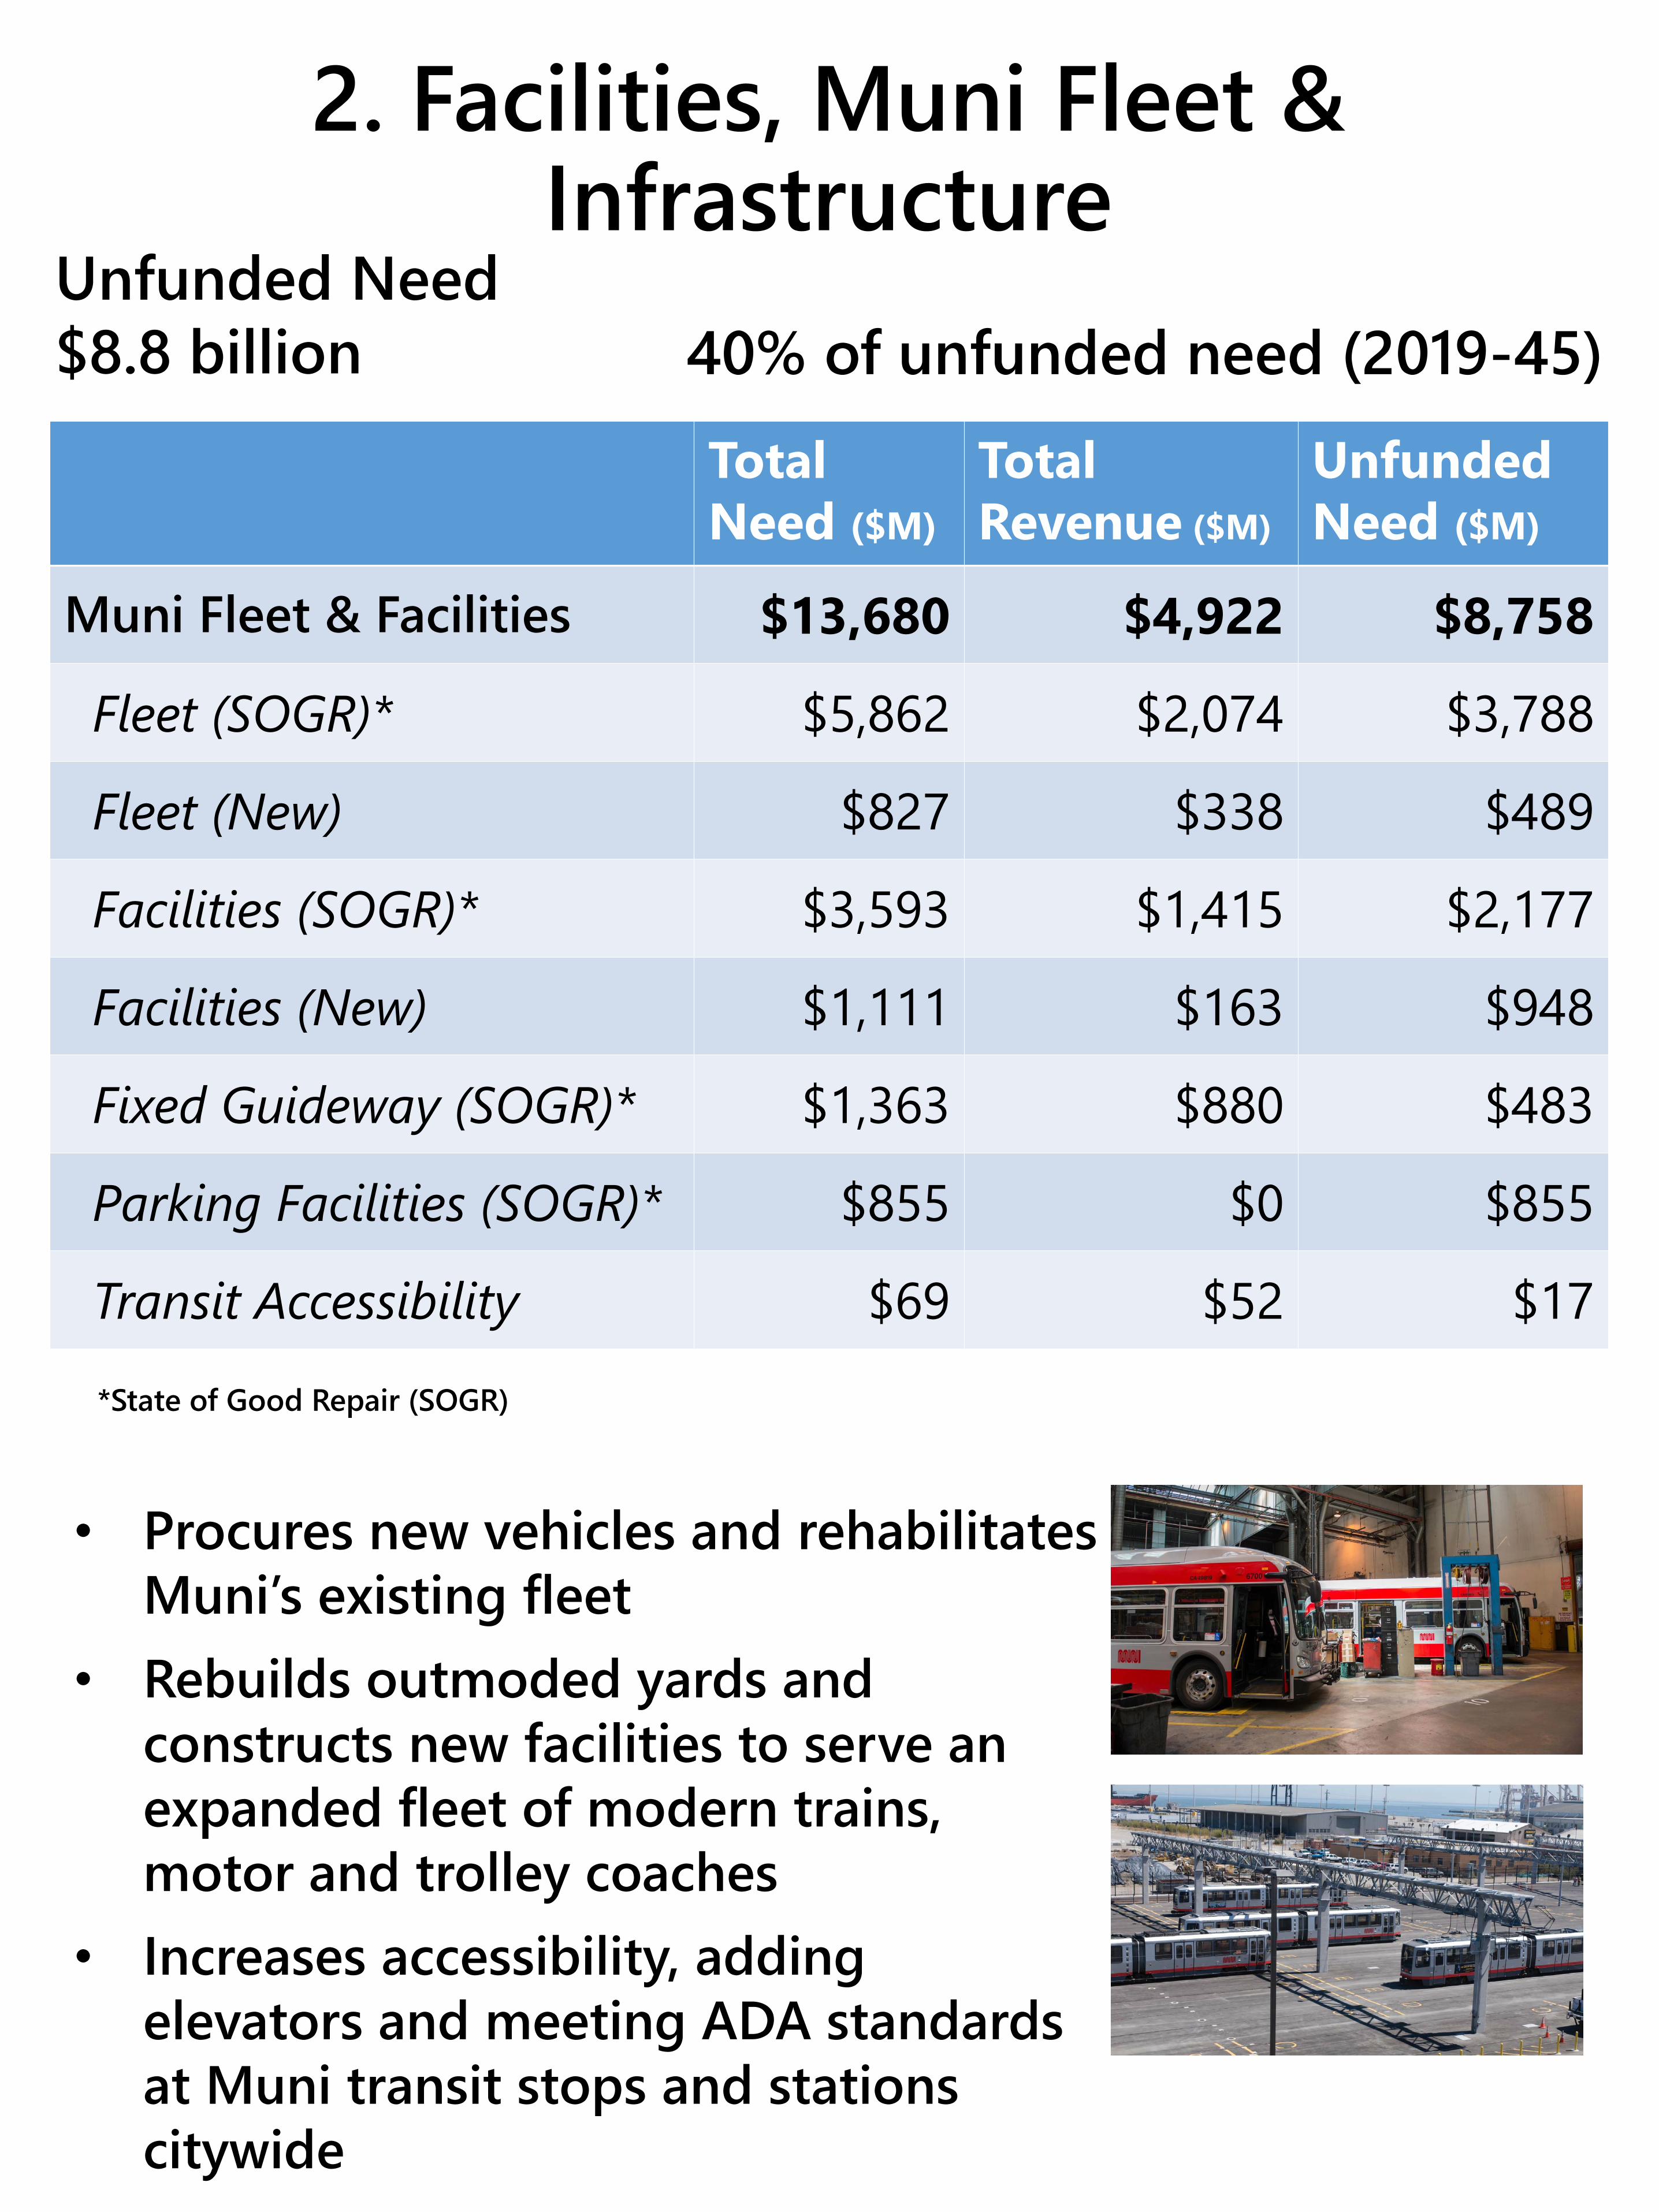
Unfunded Need $8.8 billion 40% of unfunded need (2019-45)
Total Need ($M)
Total Revenue ($M)
Unfunded Need ($M)
Muni Fleet & Facilities $13,680 $4,922 $8,758Fleet (SOGR)* $5,862 $2,074 $3,788Fleet (New) $827 $338 $489Facilities (SOGR)* $3,593 $1,415 $2,177Facilities (New) $1,111 $163 $948Fixed Guideway (SOGR)* $1,363 $880 $483Parking Facilities (SOGR)* $855 $0 $855Transit Accessibility $69 $52 $17
• Procures new vehicles and rehabilitates Muni’s existing fleet
• Rebuilds outmoded yards and constructs new facilities to serve an expanded fleet of modern trains, motor and trolley coaches
• Increases accessibility, adding elevators and meeting ADA standards at Muni transit stops and stations citywide
*State of Good Repair (SOGR)
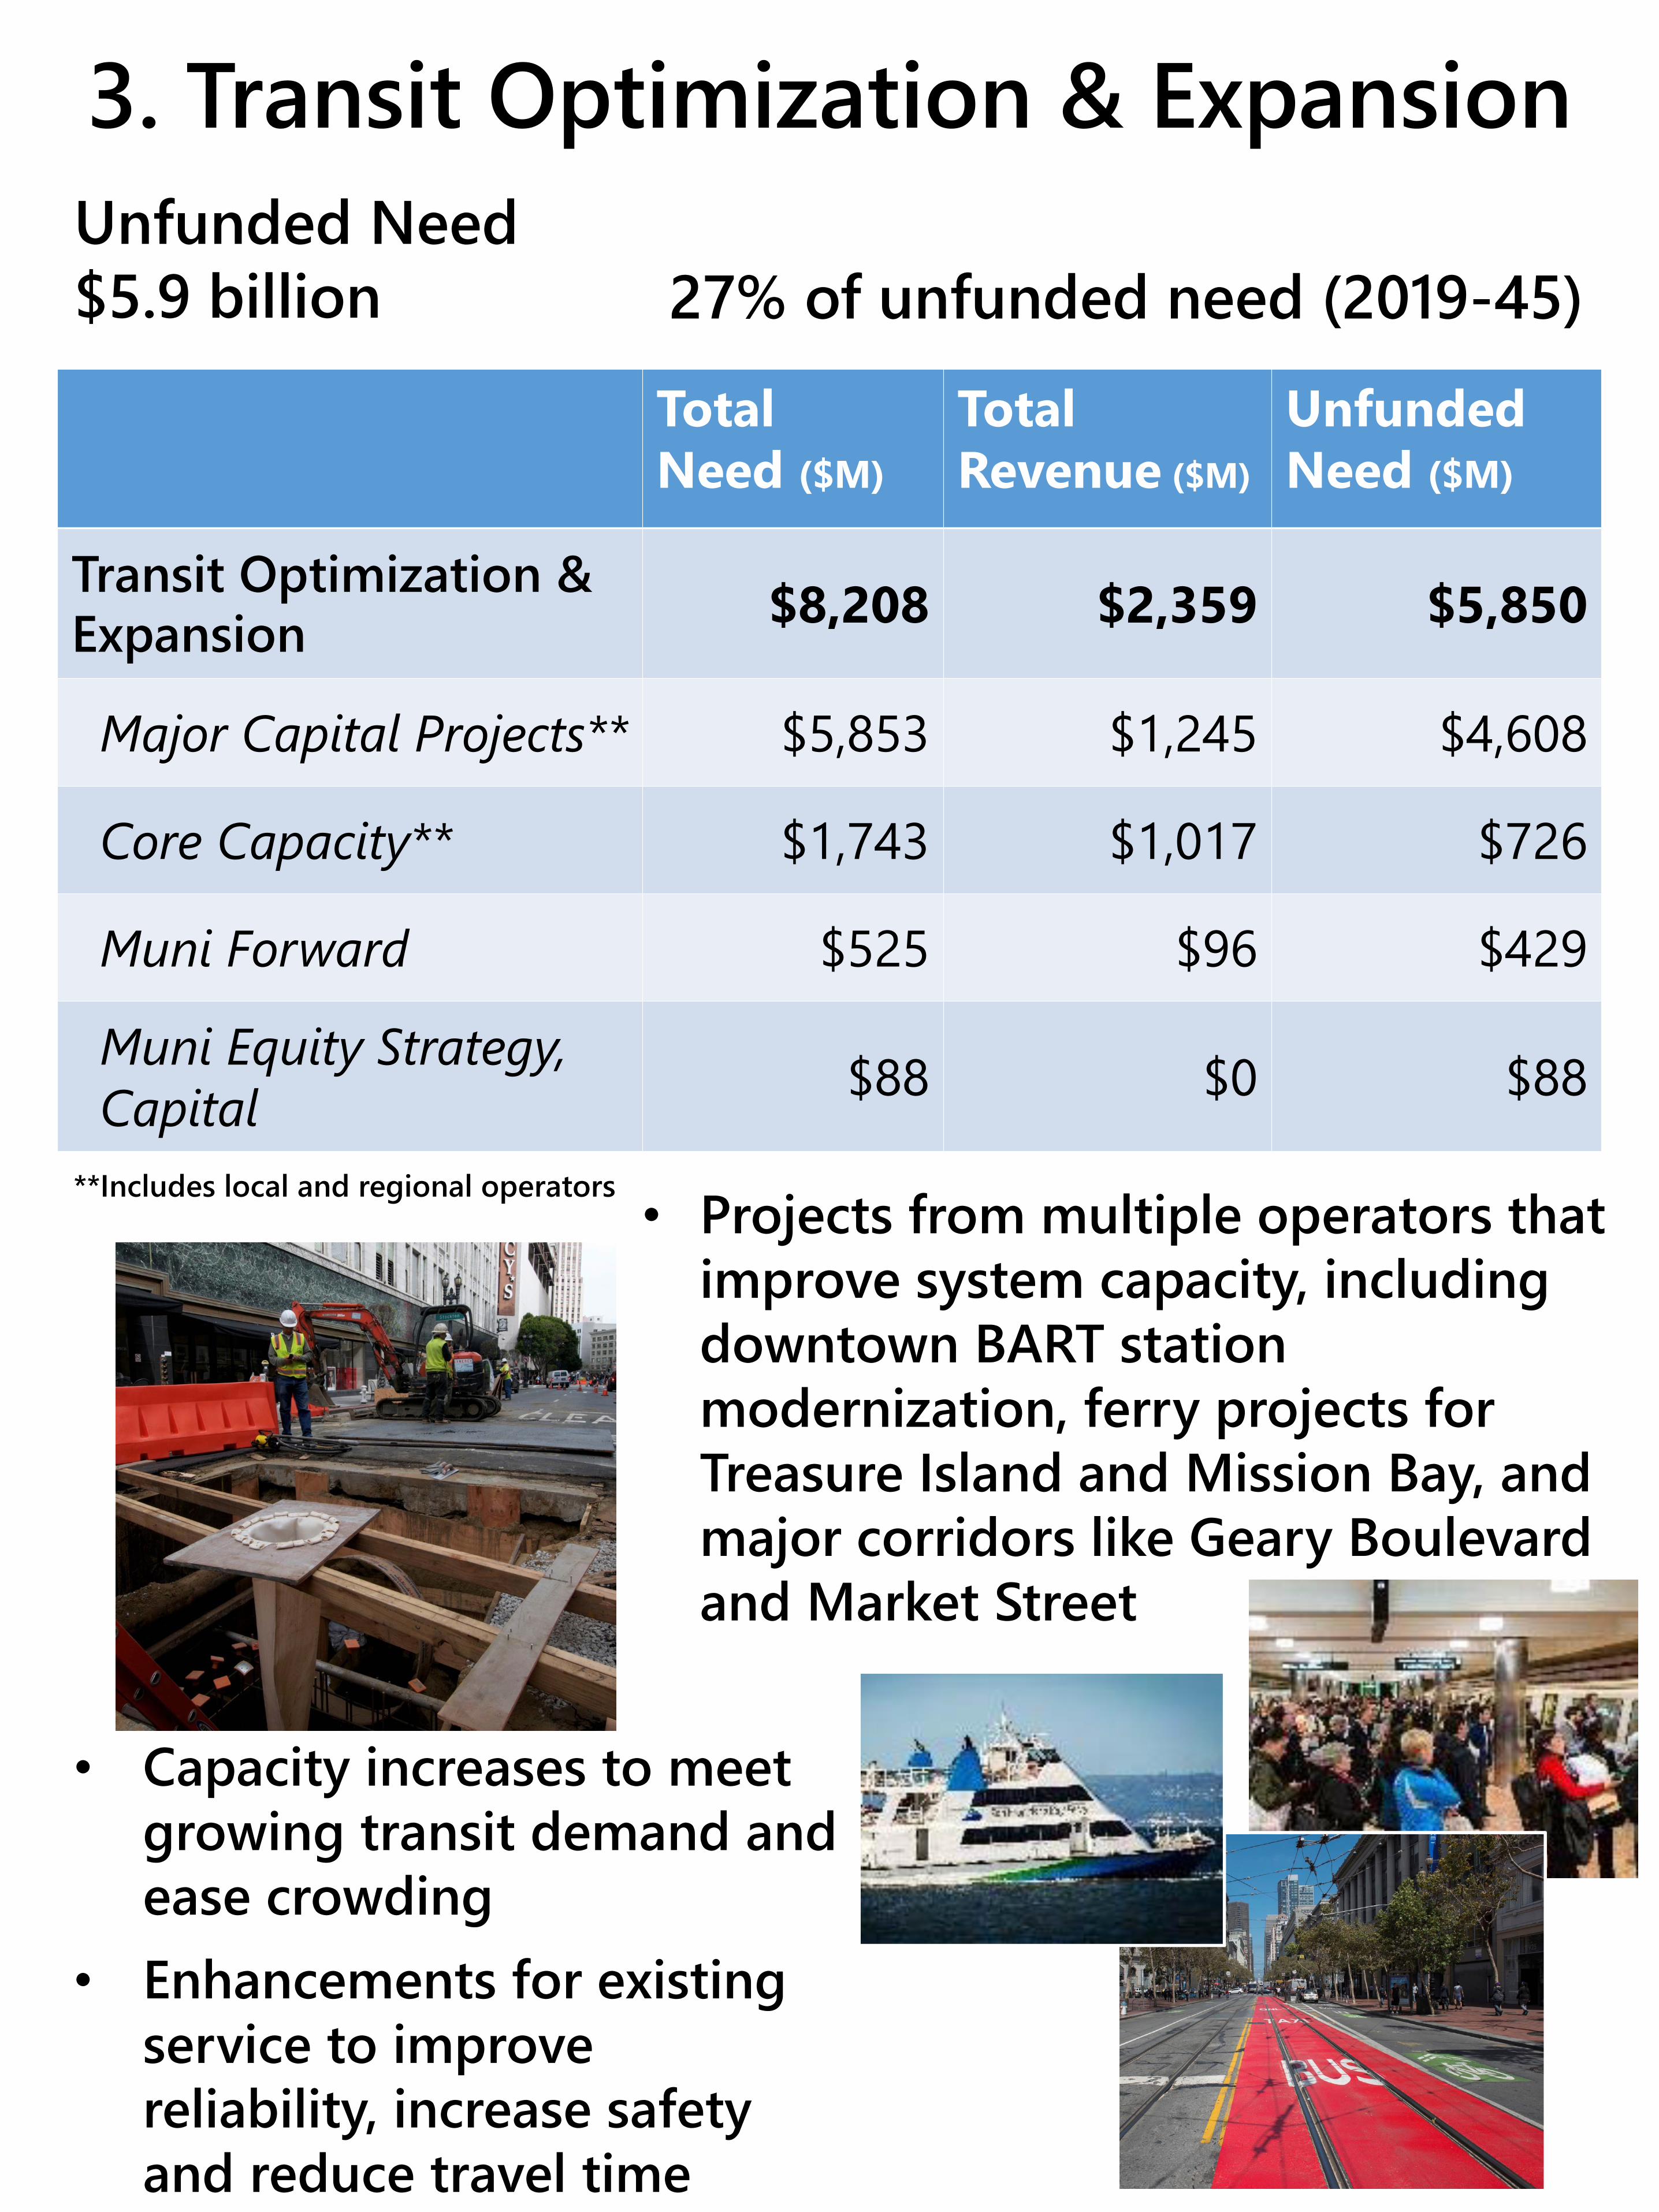
Unfunded Need $5.9 billion 27% of unfunded need (2019-45)
Total Need ($M)
Total Revenue ($M)
Unfunded Need ($M)
Transit Optimization & Expansion $8,208 $2,359 $5,850
Major Capital Projects** $5,853 $1,245 $4,608Core Capacity** $1,743 $1,017 $726Muni Forward $525 $96 $429Muni Equity Strategy, Capital $88 $0 $88
• Projects from multiple operators that improve system capacity, including downtown BART station modernization, ferry projects for Treasure Island and Mission Bay, and major corridors like Geary Boulevard and Market Street
• Capacity increases to meet growing transit demand and ease crowding
• Enhancements for existing service to improve reliability, increase safety and reduce travel time
**Includes local and regional operators
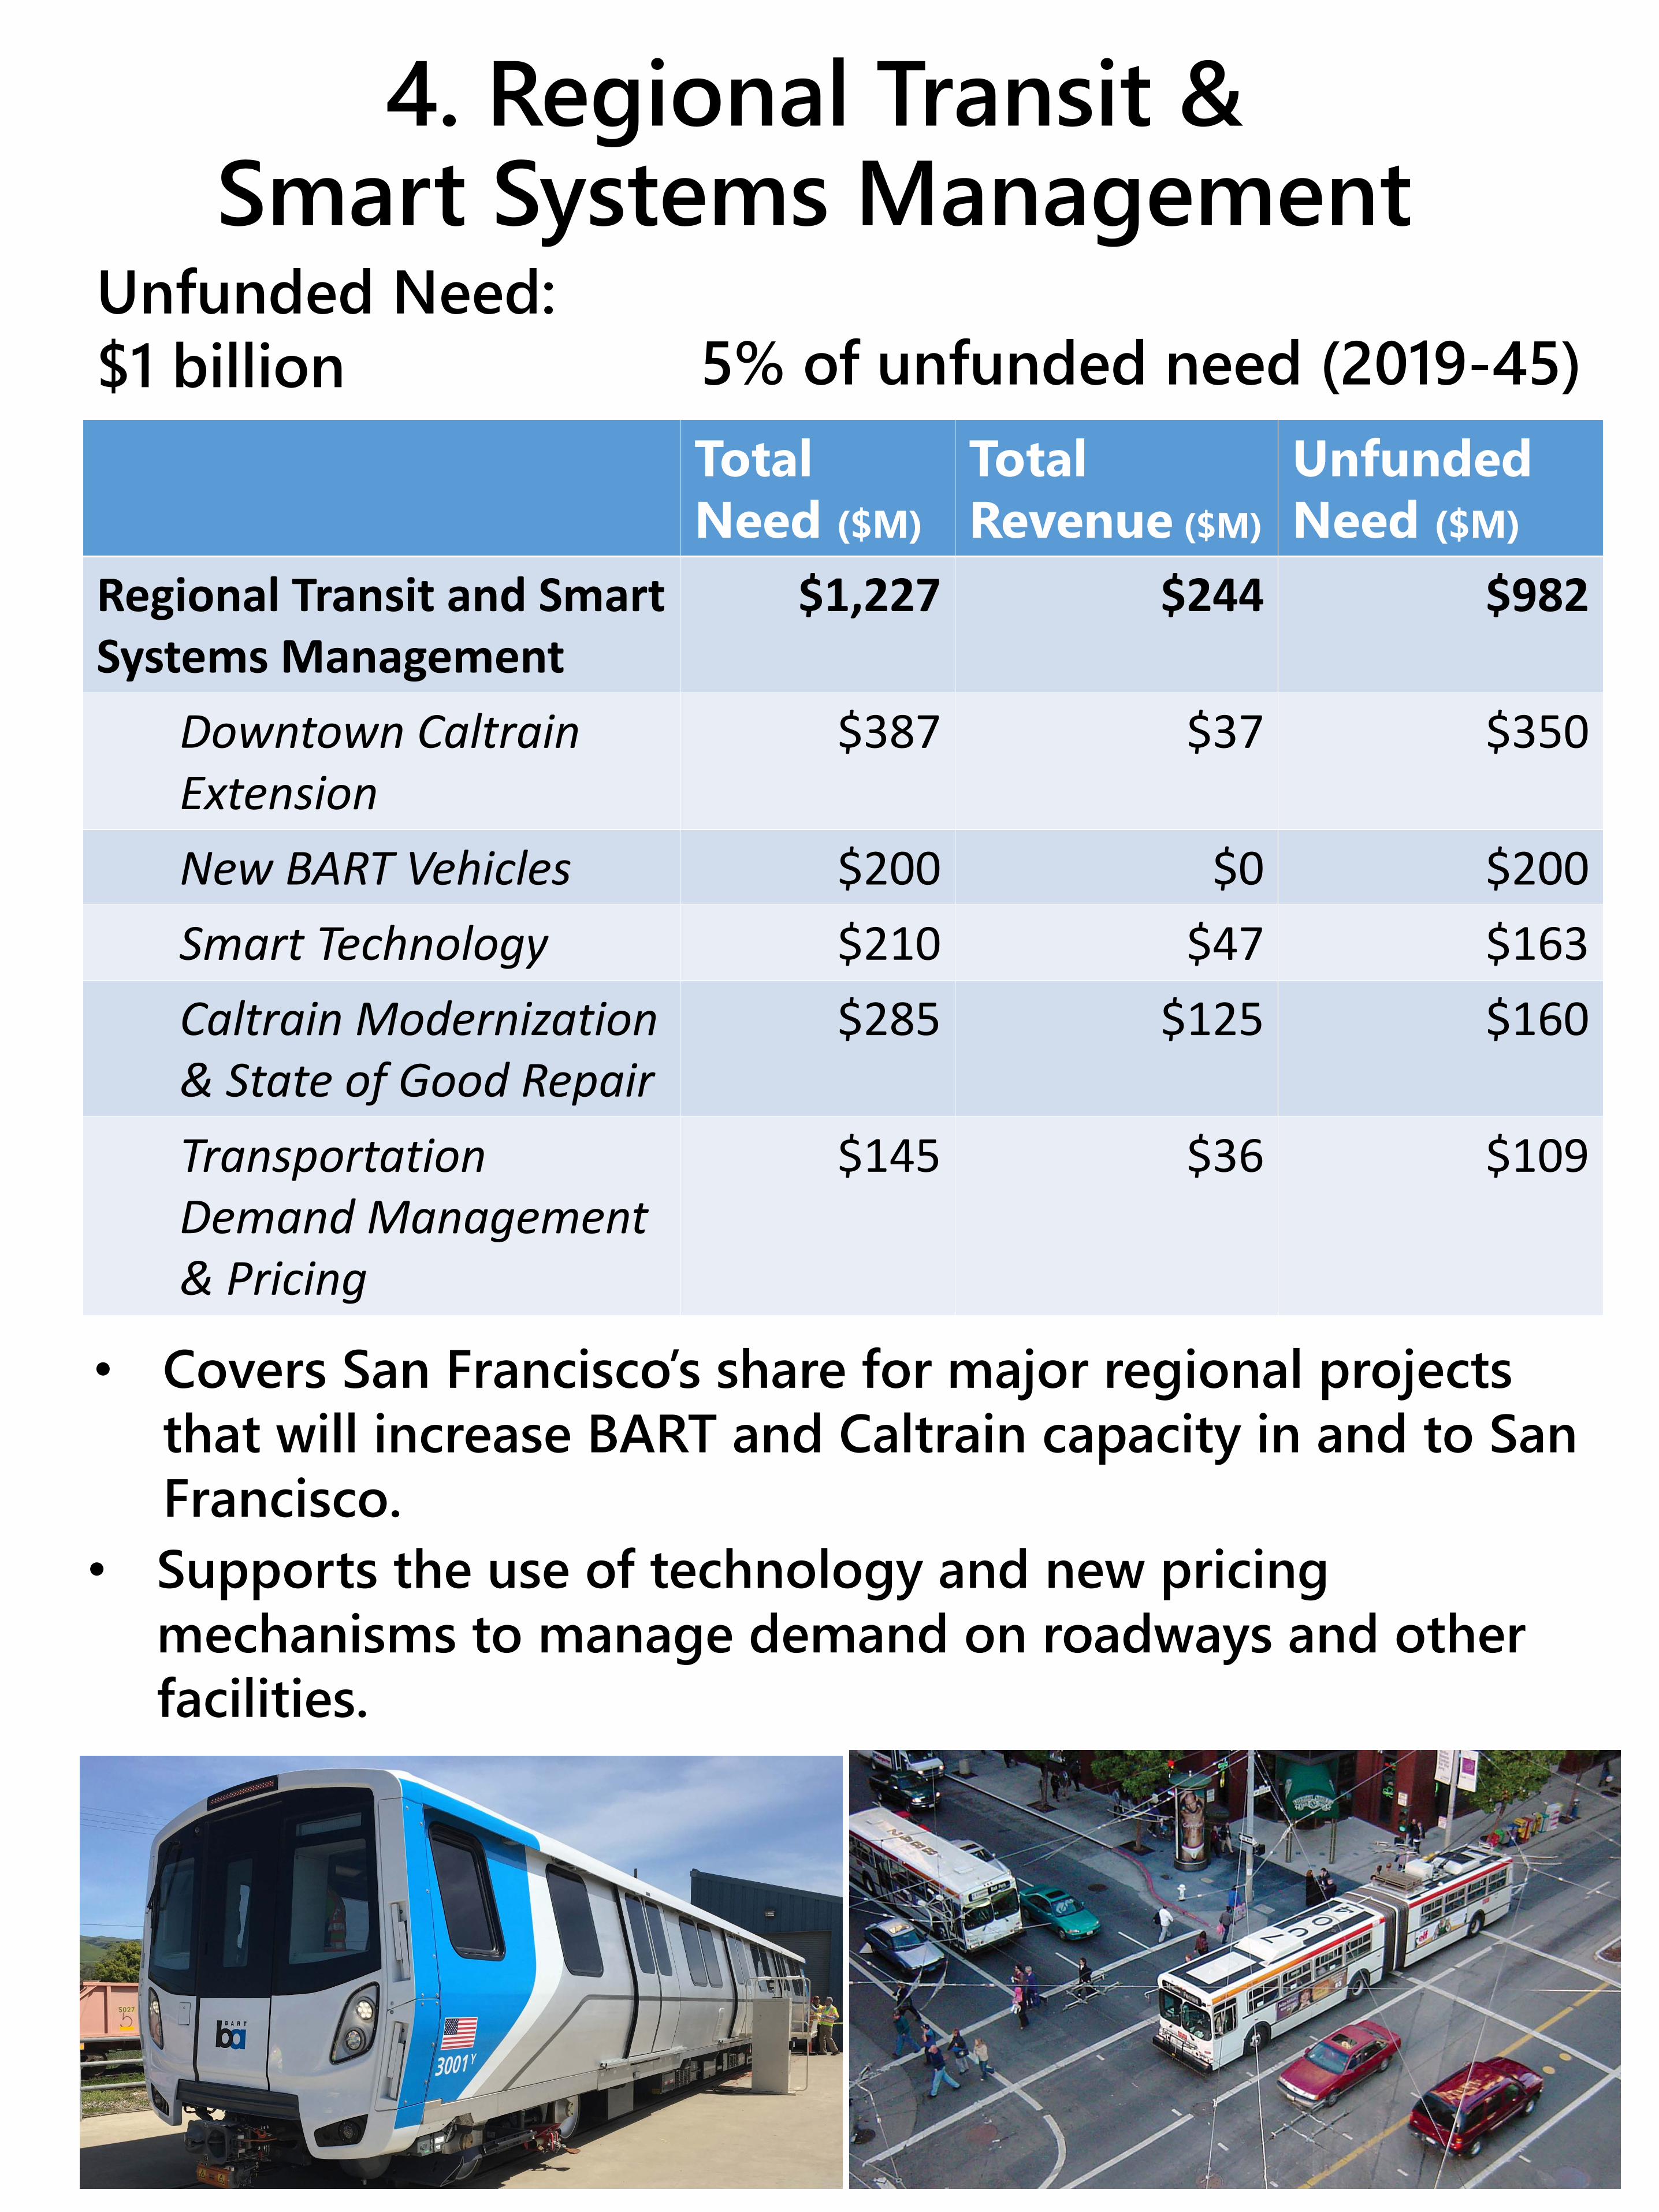
Unfunded Need: $1 billion 5% of unfunded need (2019-45)
Total Need ($M)
Total Revenue ($M)
Unfunded Need ($M)
Regional Transit and Smart Systems Management
$1,227 $244 $982
Downtown Caltrain Extension
$387 $37 $350
New BART Vehicles $200 $0 $200
Smart Technology $210 $47 $163
Caltrain Modernization & State of Good Repair
$285 $125 $160
Transportation Demand Management & Pricing
$145 $36 $109
• Covers San Francisco’s share for major regional projects that will increase BART and Caltrain capacity in and to San Francisco.
• Supports the use of technology and new pricing mechanisms to manage demand on roadways and other facilities.
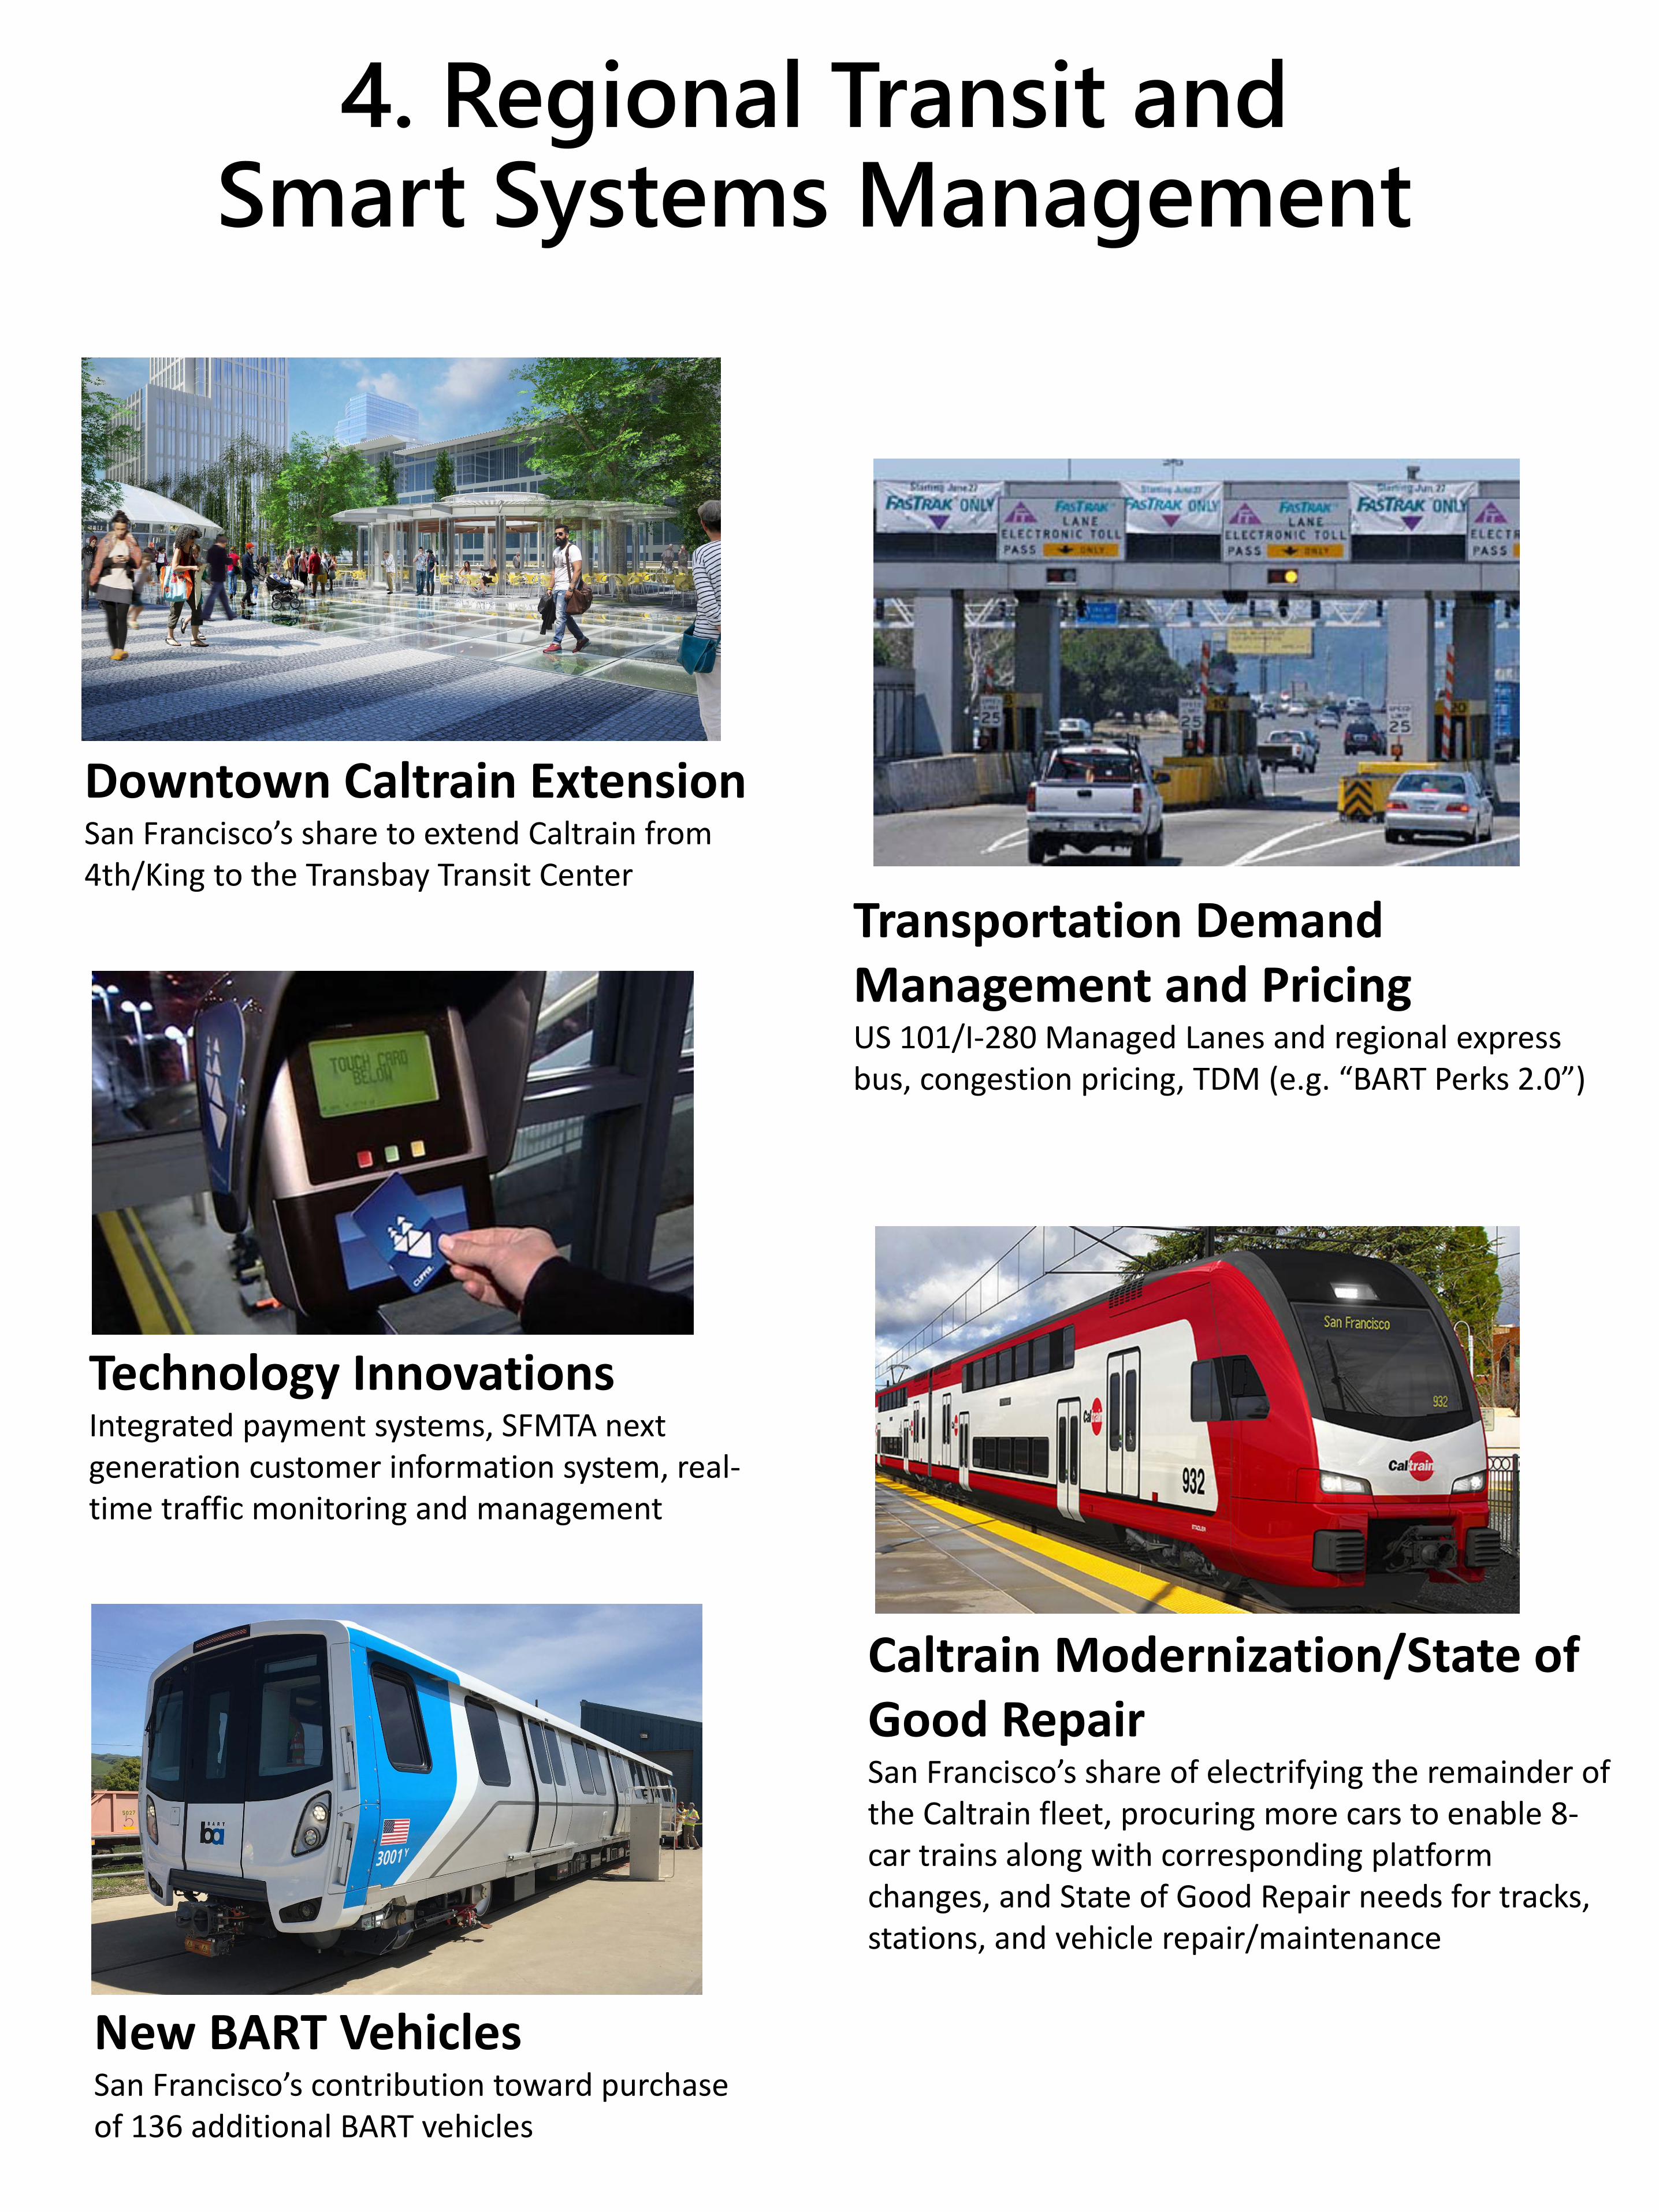
New BART Vehicles San Francisco’s contribution toward purchase of 136 additional BART vehicles
Downtown Caltrain ExtensionSan Francisco’s share to extend Caltrain from 4th/King to the Transbay Transit Center
Technology InnovationsIntegrated payment systems, SFMTA next generation customer information system, real‐time traffic monitoring and management
Transportation Demand Management and PricingUS 101/I‐280 Managed Lanes and regional express bus, congestion pricing, TDM (e.g. “BART Perks 2.0”)
Caltrain Modernization/State of Good RepairSan Francisco’s share of electrifying the remainder of the Caltrain fleet, procuring more cars to enable 8‐car trains along with corresponding platform changes, and State of Good Repair needs for tracks, stations, and vehicle repair/maintenance
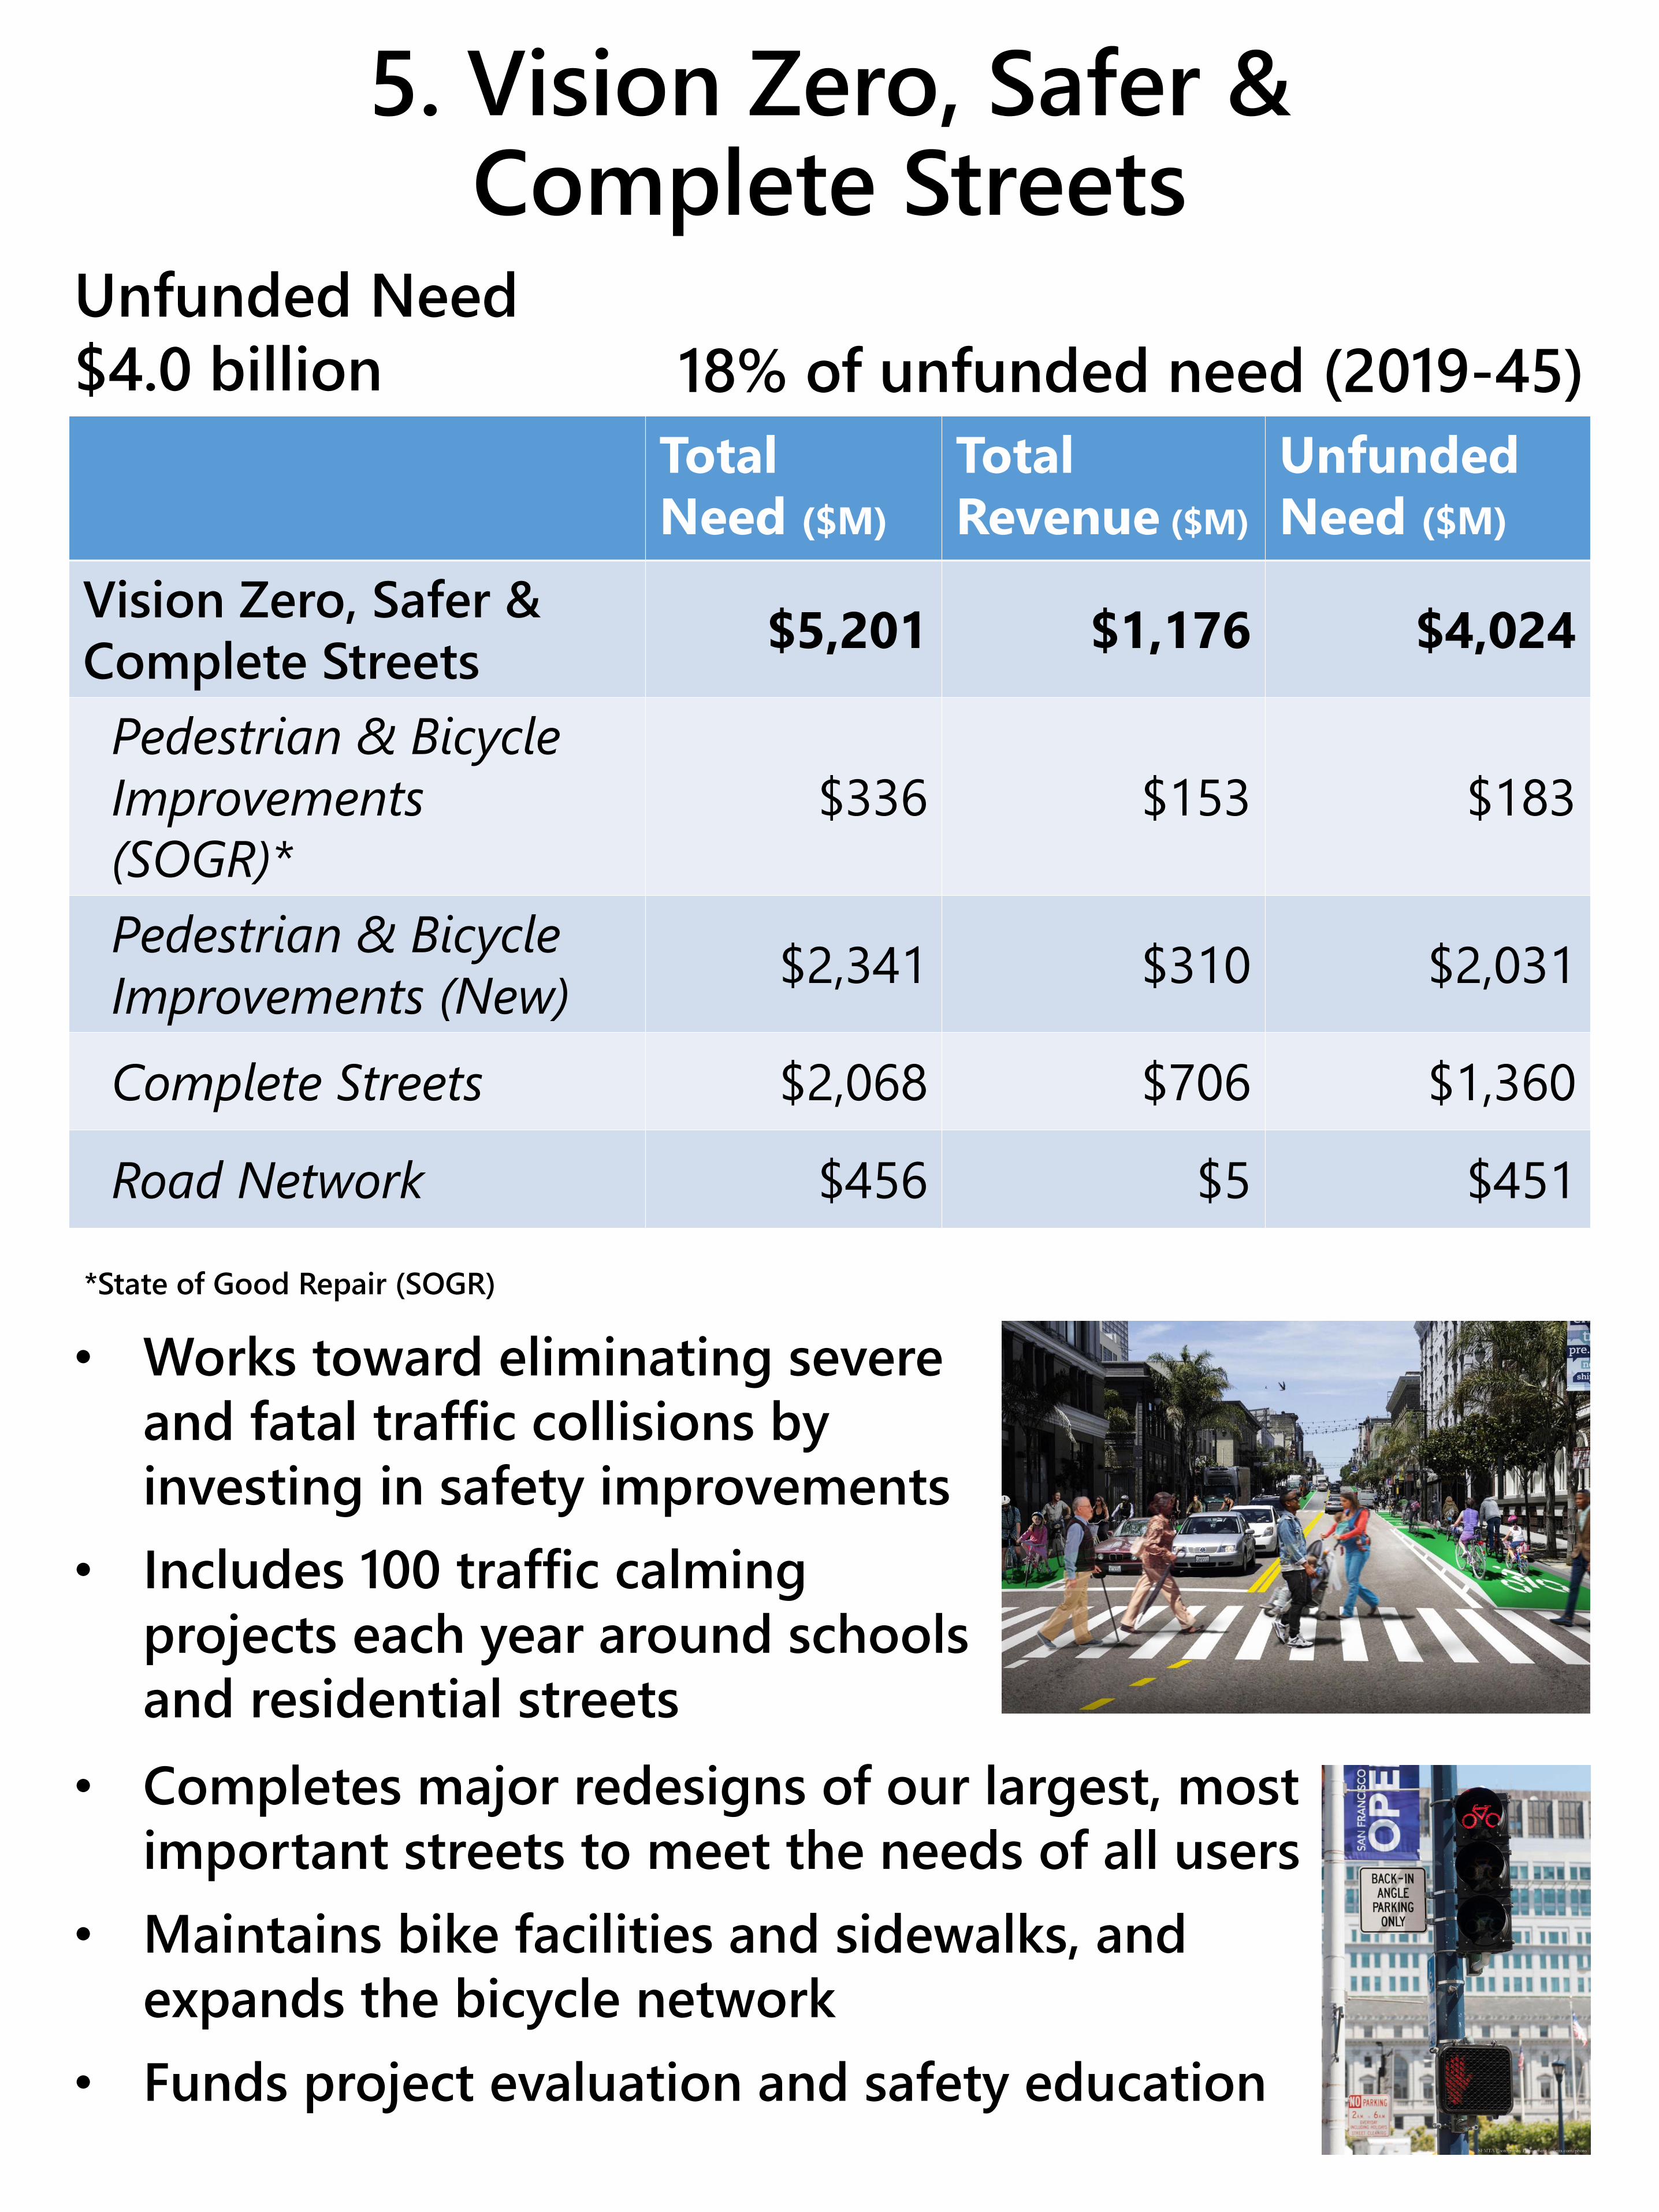
Unfunded Need $4.0 billion 18% of unfunded need (2019-45)
Total Need ($M)
Total Revenue ($M)
Unfunded Need ($M)
Vision Zero, Safer & Complete Streets $5,201 $1,176 $4,024Pedestrian & BicycleImprovements(SOGR)*
$336 $153 $183
Pedestrian & BicycleImprovements (New) $2,341 $310 $2,031
Complete Streets $2,068 $706 $1,360Road Network $456 $5 $451
• Works toward eliminating severe and fatal traffic collisions by investing in safety improvements
• Includes 100 traffic calming projects each year around schools and residential streets
• Completes major redesigns of our largest, most important streets to meet the needs of all users
• Maintains bike facilities and sidewalks, and expands the bicycle network
• Funds project evaluation and safety education
*State of Good Repair (SOGR)
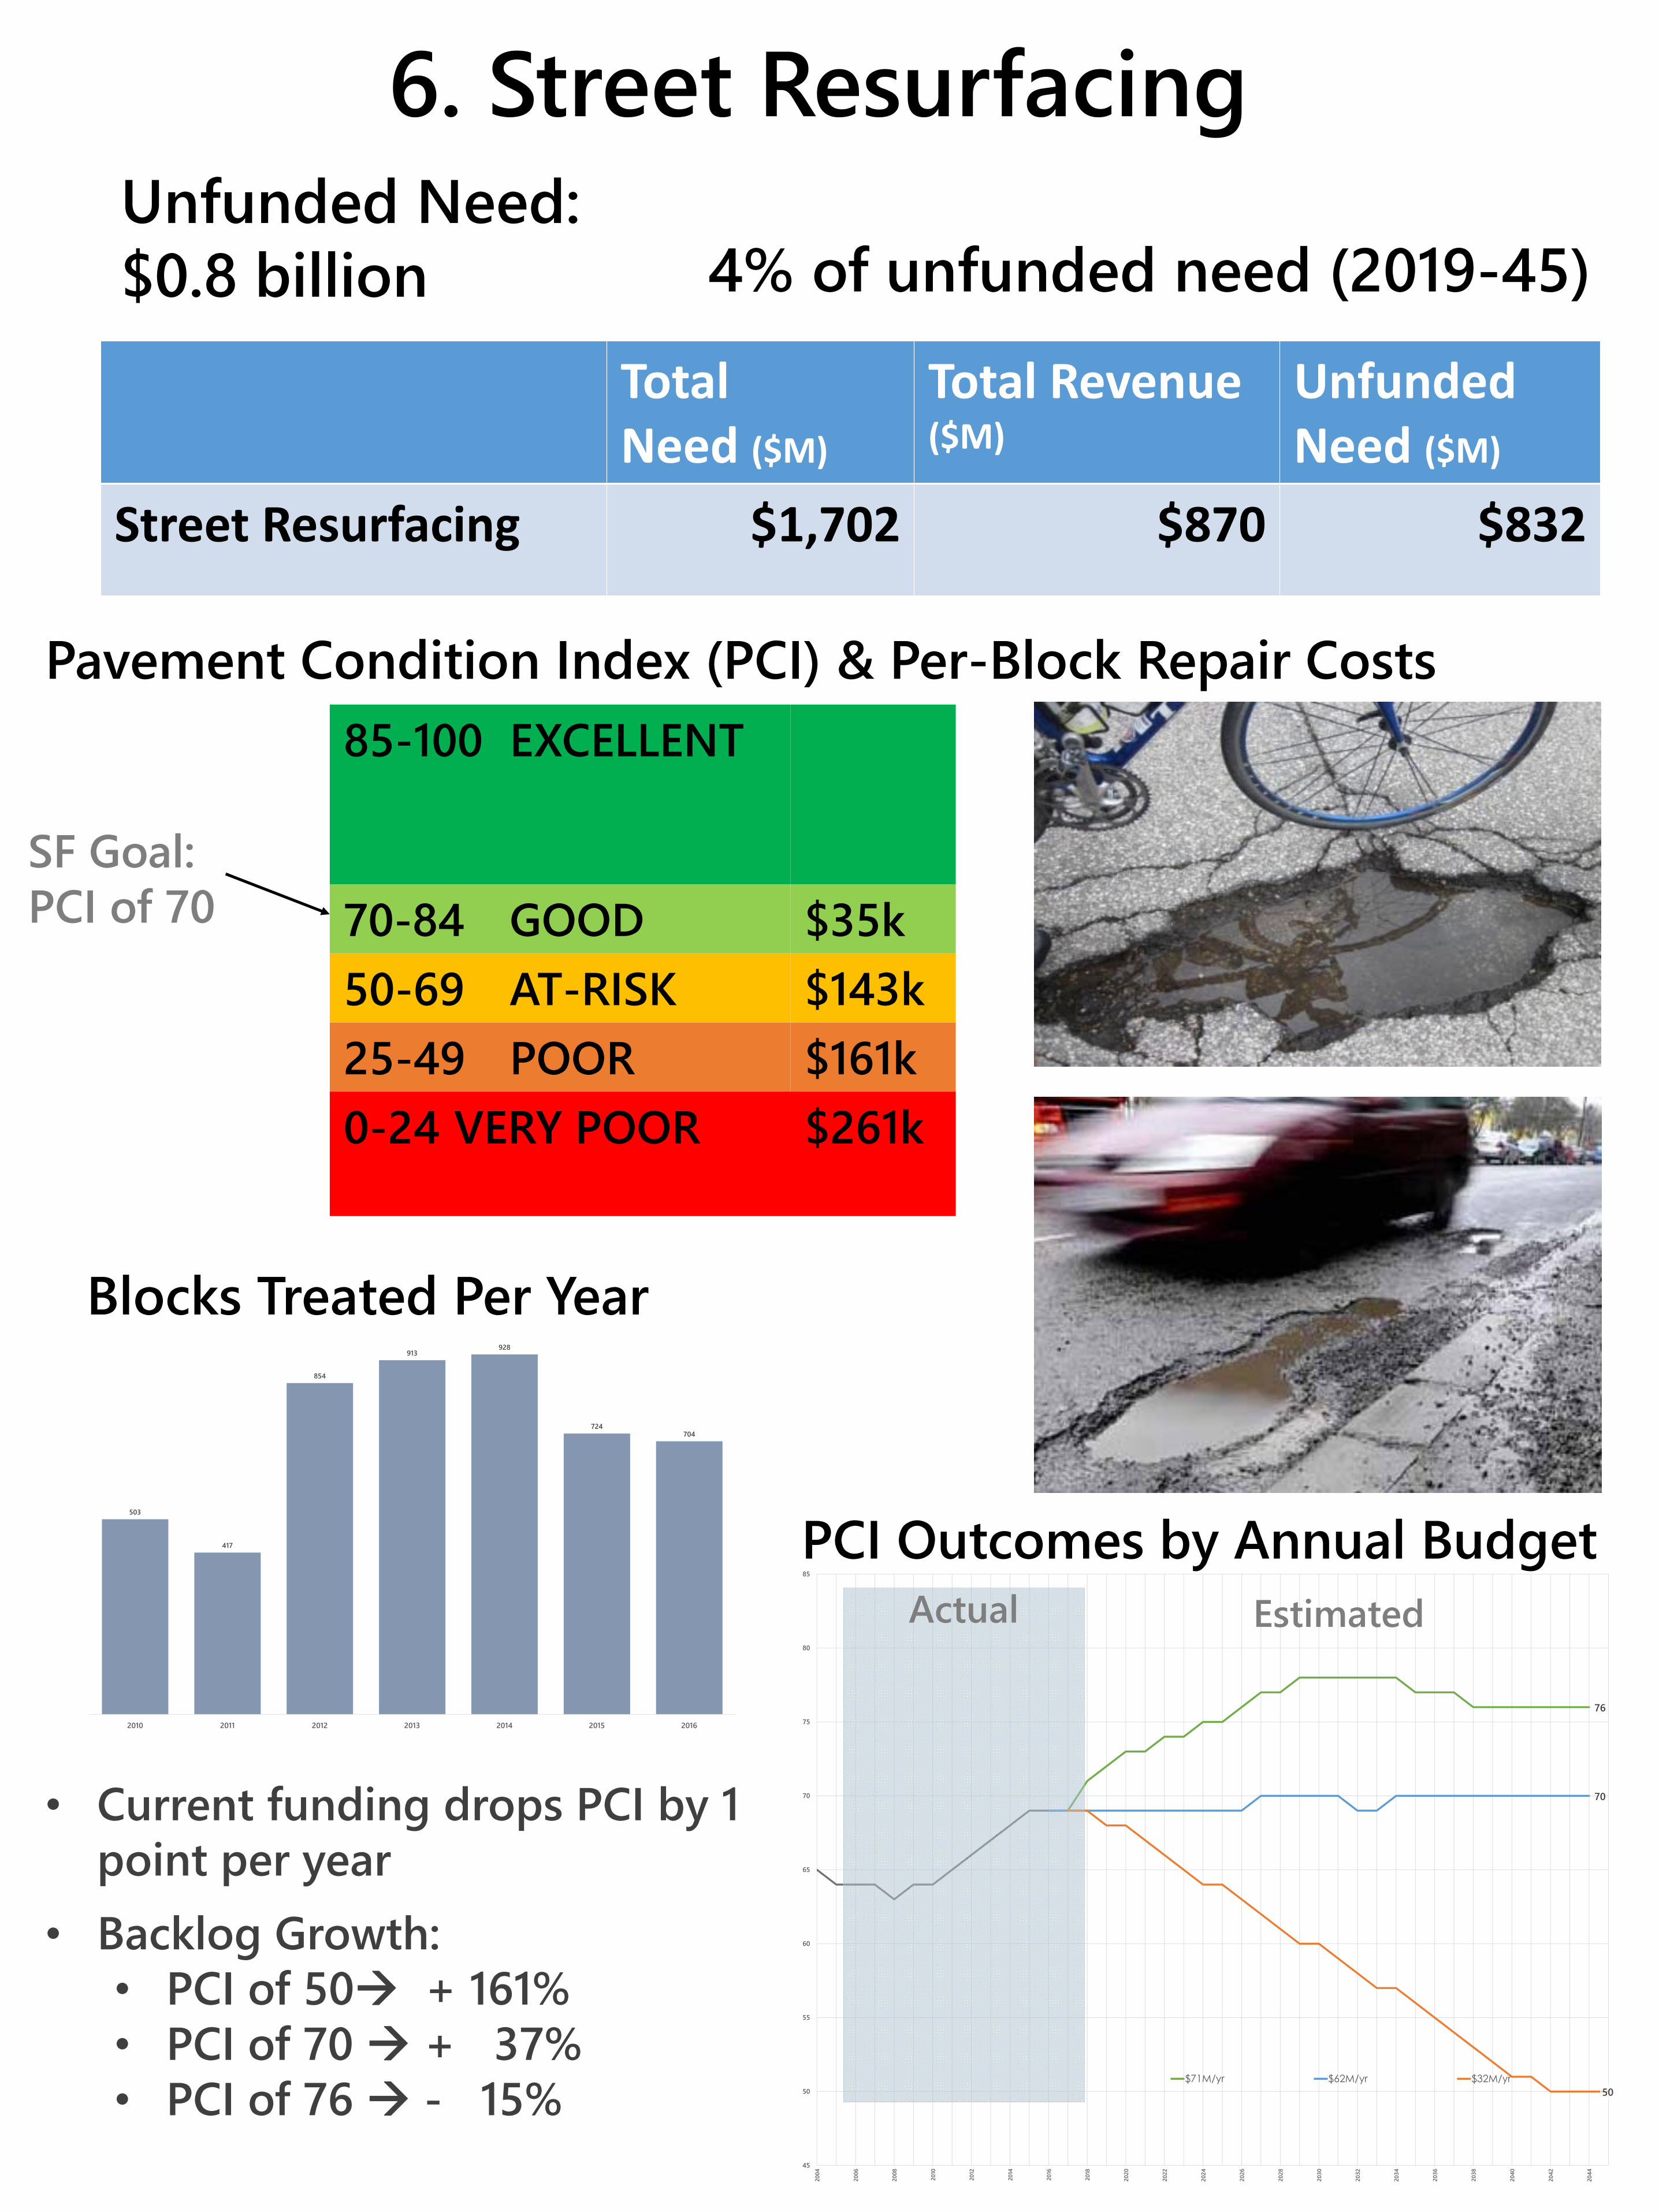
Unfunded Need: $0.8 billion 4% of unfunded need (2019-45)
Total Need ($M)
Total Revenue ($M)
Unfunded Need ($M)
Street Resurfacing $1,702 $870 $832
Pavement Condition Index (PCI) & Per-Block Repair Costs85-100 EXCELLENT
70-84 GOOD $35k50-69 AT-RISK $143k25-49 POOR $161k0-24 VERY POOR $261k
SF Goal: PCI of 70
76
70
50
45
50
55
60
65
70
75
80
85
2004
2006
2008
2010
2012
2014
2016
2018
2020
2022
2024
2026
2028
2030
2032
2034
2036
2038
2040
2042
2044
$71M/yr $62M/yr $32M/yr
PCI Outcomes by Annual BudgetActual Estimated
• Current funding drops PCI by 1 point per year
• Backlog Growth:• PCI of 50 + 161%• PCI of 70 + 37%• PCI of 76 - 15%
503
417
854
913 928
724704
2010 2011 2012 2013 2014 2015 2016
Blocks Treated Per Year
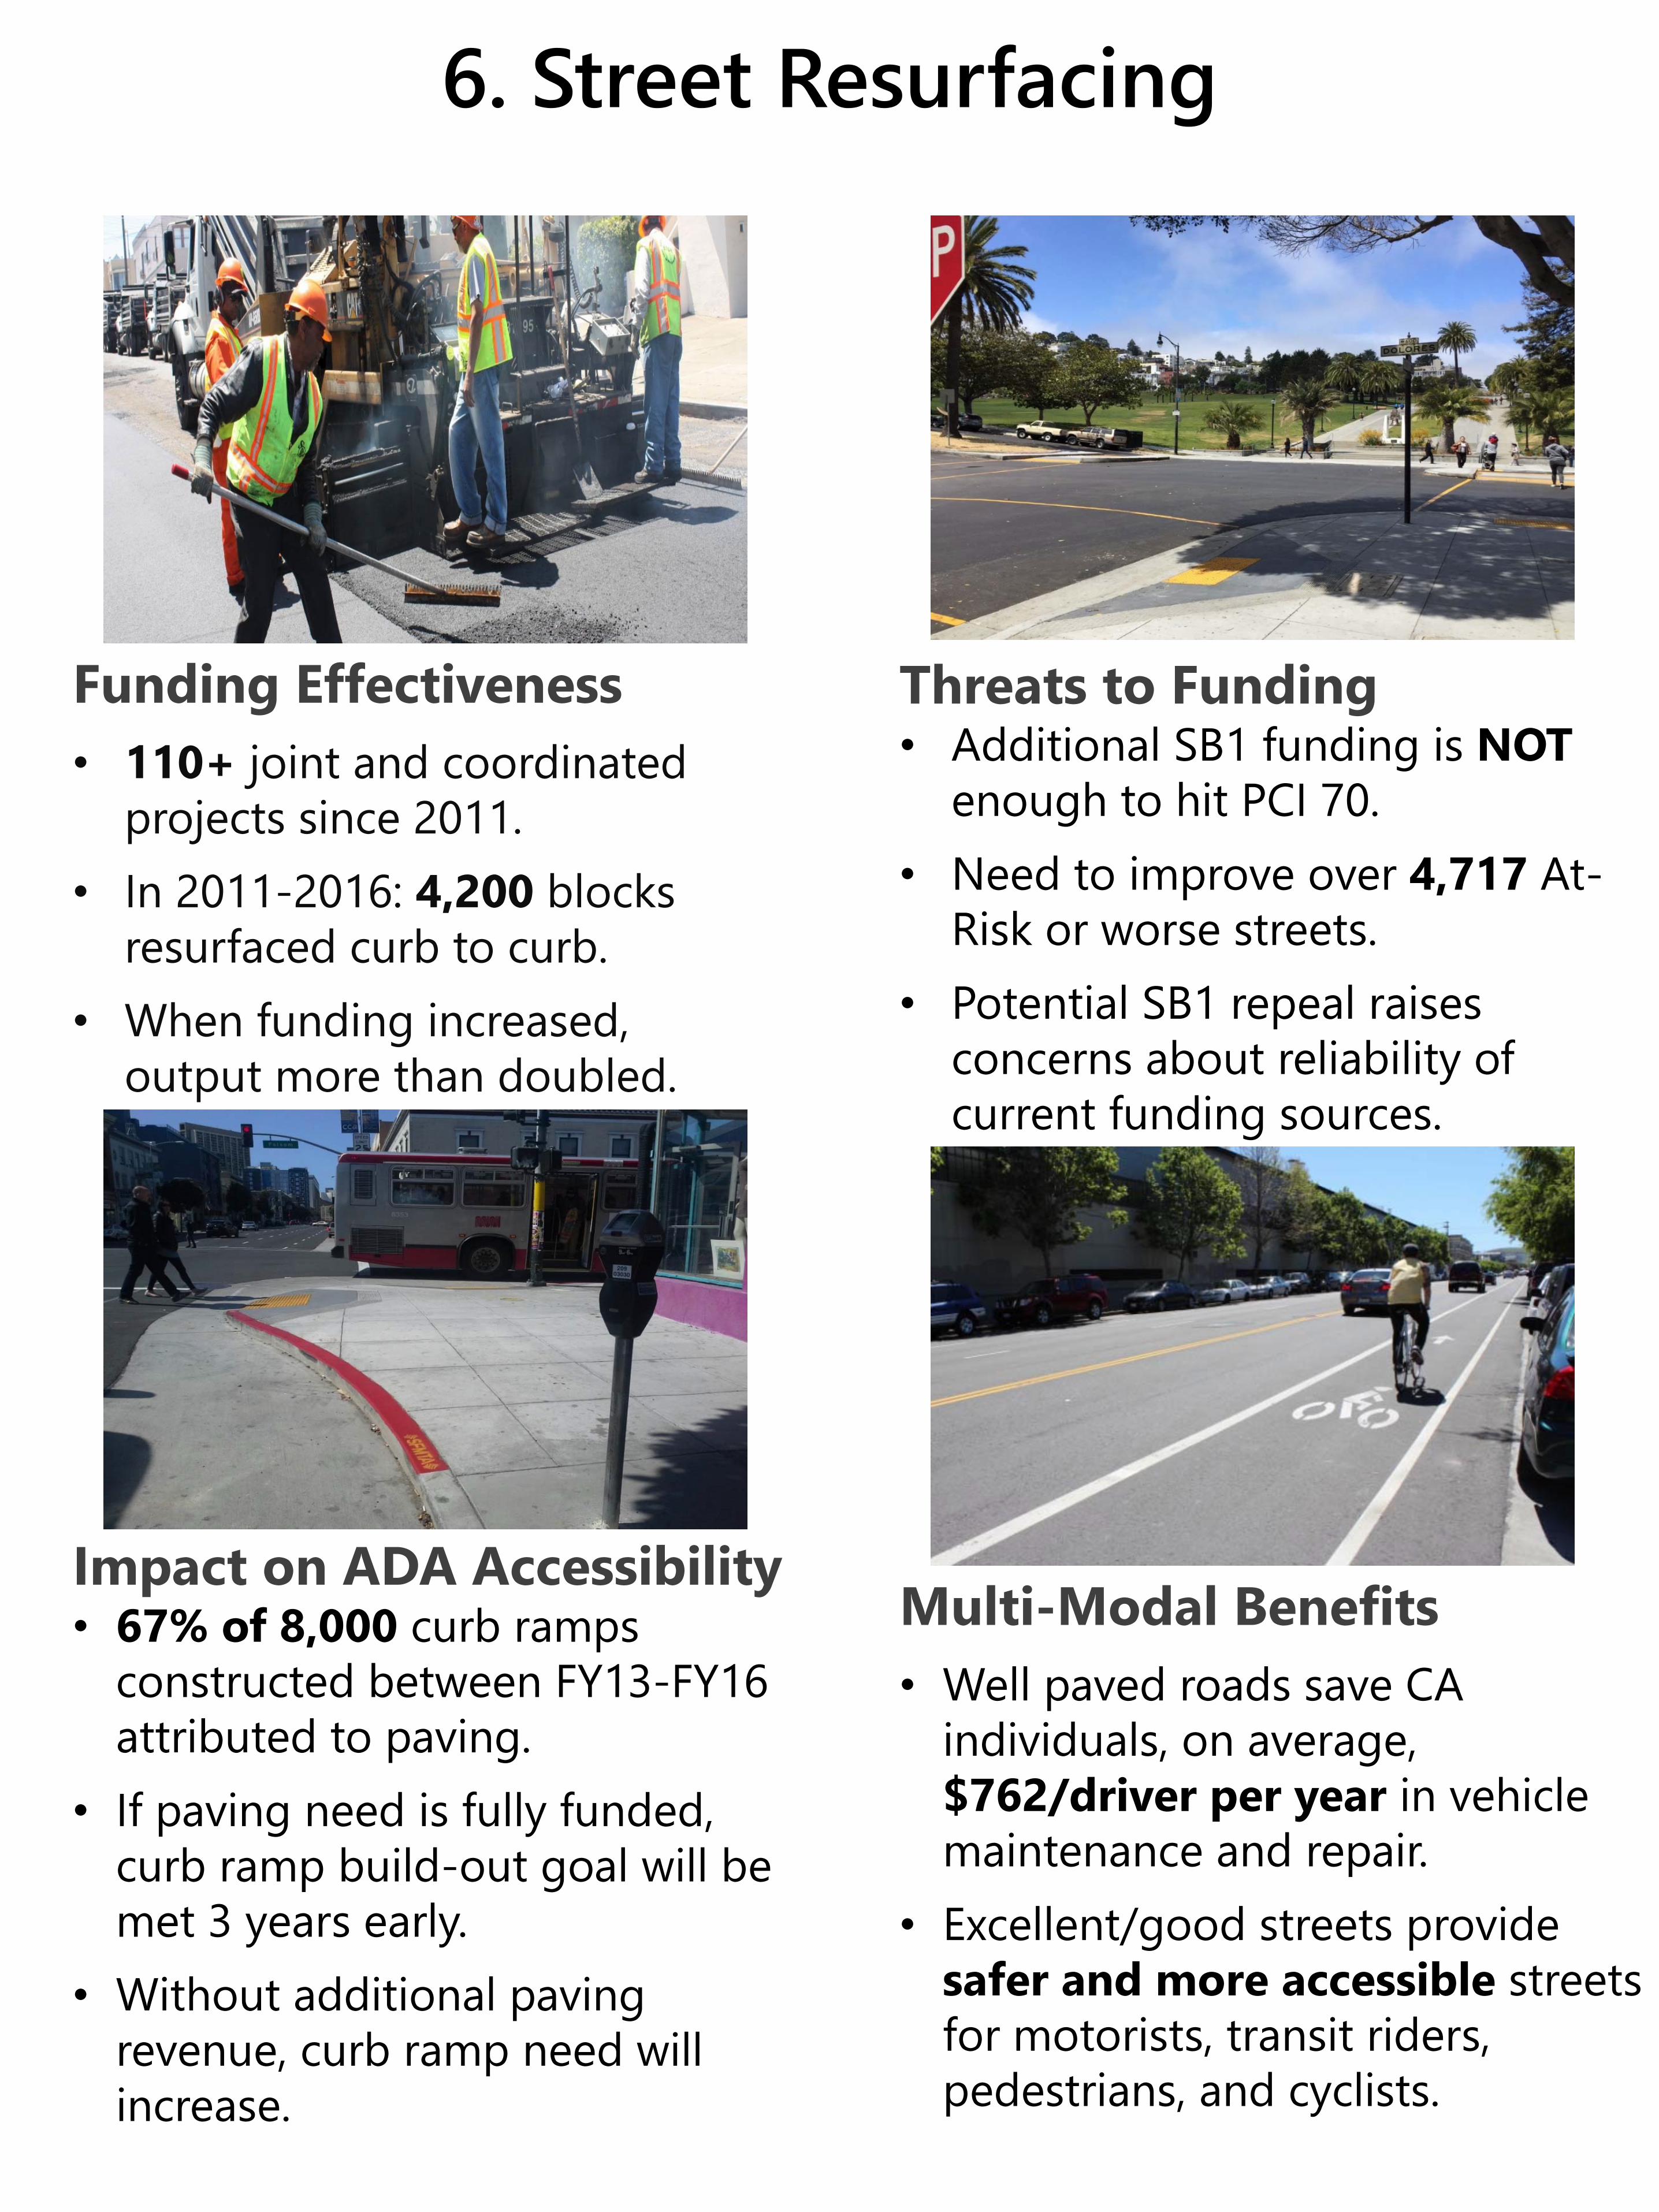
Impact on ADA Accessibility• 67% of 8,000 curb ramps
constructed between FY13-FY16 attributed to paving.
• If paving need is fully funded, curb ramp build-out goal will be met 3 years early.
• Without additional paving revenue, curb ramp need will increase.
Funding Effectiveness• 110+ joint and coordinated
projects since 2011.• In 2011-2016: 4,200 blocks
resurfaced curb to curb.• When funding increased,
output more than doubled.
Multi-Modal Benefits• Well paved roads save CA
individuals, on average, $762/driver per year in vehicle maintenance and repair.
• Excellent/good streets provide safer and more accessible streets for motorists, transit riders, pedestrians, and cyclists.
Threats to Funding • Additional SB1 funding is NOT
enough to hit PCI 70.• Need to improve over 4,717 At-
Risk or worse streets.• Potential SB1 repeal raises
concerns about reliability of current funding sources.