unibail-rodamco: innovative performance
TRANSCRIPT

2012ANNUAL ANd sUstAiNAbLe
deveLopmeNt report
Unibail-Rodamco: Innovative
performance

02 milestones 2012
CorporAte
The values which distinguish us08 interview with the Ceo and the Chairman of the management board 12 interview with the Chairman of the supervisory board14 Corporate governance and risk management16 Figures on the rise18 eprA performance measures20 shareholder’s report
strAtegy
Re-inventing the customer experience24 re-inventing the customer experience26 so ouest – a new generation shopping centre28 the 4 star shopping experiencel 30 projects in the pipeline
operAtioNs
Iconic Assets36 moments to remember42 iconic shopping centres48 our shopping centre managers50 offices52 Convention & exhibition
sUstAiNAbLe deveLopmeNt
Creating sustainable value everyday56 Unibail-rodamco’s sustainability journey58 A transparent governance for sustainability60 material issues to create sustainable value62 re-align our sustainability vision and priorities with the group’s strategy64 A motivated workforce empowered to deliver change 66 Creating opportunities for communities to prosper70 building resilience through innovation citizenship74 Unlock opportunities for tenants and customers to make sustainable decisions

34shoppiNg CeNtres
5shoppiNg CeNtres
9shoppiNg CeNtres
16shoppiNg CeNtres
8shoppiNg CeNtres
3shoppiNg CeNtres
82 shopping centres
in Europe*
France
Netherlands
Nordic countries
Central Europe*
Austria
7shoppiNg CeNtres
Germany*
Spain
MAJOR eUROpeAn cities from west to east which host Unibail-Rodamco assets: seviLLe / vALeNCiA / mAdrid / bArCeLoNA / bordeAUX / LyoN / NiCe / pAris / LiLLe / AmsterdAm / the hAgUe / CopeNhAgeN / stoCKhoLm / prAgUe / vieNNA / brAtisLAvA / WArsAW / heLsiNKi /
* including shopping centres consolidated under the equity menthod:• Central europe: Złote tarasy. • germany: mfi (6 standing managed assets: paunsdorf, gropius passagen, pasing Arcaden, höfe am brühl, gera, ruhr-park).
Offices and Convention
& Exhibition venues in Paris C&e oFFiCes

* Including shopping centres consolidated under the equity method.
SPLIT of ToTaL PoRTfoLIo SPLIT of ShoPPIng CenTRe PoRTfoLIo
PROFILe
ShoPPIng CenTReS offICeS ConvenTIon & exhIbITIon
SPaIn
146
fRanCe
364MILLIOn
vIsIts
MILLIOn vIsIts
noRdIC CoUnTRIeS The neTheRLandS
797
52
616,300585,7003,383,800*
35
aUSTRIa
54MILLIOn
vIsIts
MILLIOnvIsIts
aCRoSS The gRoUP’SShoPPIng CenTReS
MILLIOn vIsIts
CenTRaL eURoPe
110*MILLIOn
vIsIts
geRmany
36*MILLIOn
vIsIts
M2 GLAM2 GLAM2 GLA
MILLIOn vIsIts
CReAted In 1968
LIsted On the PARIs stOCk exChAnGe SInCe 1972, on The amSTeRdam SToCk exChange SInCe 1983. InCLUded In The CaC 40, aex 25 and eURo SToxx 50 IndICeS.
ReCOGnIsed In The dJSI (WoRLd and eURoPe), fTSe4good, SToxx gLobaL eSg LeadeRS IndICeS.
89% OF the GROuP’s shOPPInG CentRes WeLCome moRe Than 6 mILLIon vISITS PeR annUm.
stROnG bALAnCe SheeT WITh a LoW Loan-To-vaLUe (LTv) RaTIo of 37%.
“A” RAtInG fRom STandaRd & PooR’S and fITCh, The beST RaTIng In The IndUSTRy.
by aCTIvITy by RegIon
78%
13%
9%
Shopping centresfrance
The netherlands
austrianordic countries
Spain
Central europe
Convention & exhibition
offices
13%
10% 9%6%
51%
11%

Experience.
One word that sums up the driving force behind
Unibail-Rodamco: it represents an expertise in
property management, in-depth knowledge of
consumer trends, original and exclusive retail and
offi ce projects and the best services combined
with the most creative and spectacular events.
Unibail-Rodamco is Europe’s leading listed
commercial property company, a position that can
only be achieved through an innovative approach
capable of creating value for its customers
and stakeholders.
Unibail-Rodamco: innovative
performance

2012, a year of progress and value creation
MILESTONES 2012
April 2012
02 • 03
THE 4 STAR LABEL is Unibail-Rodamco’s initiative to deliver outstanding services for its retail assets. It is a unique strategy, which sets ambitious targets for improved quality at each stage of the customer’s shopping experience. To ensure the 4 Star label responds to customer expectations, the foundation of this strategy, a rigorous 571 point referential is externally audited and used to guide the Shopping Centre Manager towards 4 Star excellence.

June2012
UNIBAIL-RODAMCO ENTERS INTO A PARTNERSHIP WITH “MFI”
mfi is Germany’s second largest shopping centre operator, investor and developer. Its portfolio includes major assets such as Paunsdorf and Höfe am Brühl in Leipzig, Gropius Passagen in Berlin and Pasing Arcaden in Munich. In addition, the Group also acquired a 50% stake in Ruhr-Park in Bochum, managed by mfi and one of the largest shopping centres in Germany. Overall the transaction involves 9 standing and future shopping centres, as well as 20 malls managed for third parties.
OPENING OF CONFLUENCE IN LYON
Confl uence has a striking façade and a quilted roof made up of air cushions which fl ood the interior with natural light. Symbolising a new generation of shopping centres, it was awarded the 4 Star Label and refl ects the expertise of Unibail-Rodamco in selecting and implementing
innovative shopping concepts. It heralds the development of new services and boasts a unique design, providing customers with an exclusive shopping and leisure experience. In 2010, Confl uence received a BREEAM “Very Good” for its environmental qualifi cations, the fi rst mall to receive this score in France.
April 2012
02 • 03

MILESTONES 2012
September2012
OPENING OF EL FARO IN BADAJOZ, SPAIN where 100,000 visitors came to visit the mall on the opening week-end. El Faro hosts 97 shops across 66,000m² GLA, including the fi rst H&M, Media Markt and Primark stores in the region. Located 1km from the Portuguese border and 5 minutes by car from Badajoz city centre, El Faro is very well connected to all public transportation and major regional highways. It received a BREEAM “very good” for its environmental credentials.
DJSI
Unibail-Rodamco ranked among the
top 5% in the Dow Jones Sustainability
Index (DJSI) – this represents a score
increase of 46% since 2008.
July2012
THE DINING EXPERIENCE
A new initiative aimed at doubling the space dedicated to dining in Unibail-Rodamco’s shopping centres, the Dining Experience combines 3 key ingredients: a perfect mix of the best local restaurateurs and well established international concepts, an outstanding Dining Plaza, and an “Experience Theatre” with a dedicated programme of events and marketing activities. Launched in la Maquinista in July, the Group plans to deploy the strategy to 25 shopping centres over the coming years.
UR LAB
UR Lab’s role is to defi ne the Group’s vision for innovation, set long-term goals and equip the Group to achieve them cost-effi ciently. The Lab unites all of the Group’s innovation initiatives from across different departments under a single umbrella.
04 • 05

December2012
UNIBAIL-RODAMCO
CELEBRATES ITS 40 YEAR
LISTING ANNIVERSARY
ON THE PARIS STOCK
EXCHANGE
From December 1972 to
December 2012, the Group
a c h i e v e d a t o t a l
annualised s h a re h o l d e r
r e t u r n ( d i v i d e n d s
reinvested) of 16.4%.
OPENING OF SO OUEST, LEVALLOIS, PARIS REGION
Designed in the style of a Haussmannian apartment, So Ouest offers retailers and visitors alike an attractive mix of grand open spaces and cosy rest areas. The shopping centre’s richly decorated interiors feature marble fl oors, leather handrails and a variety of glass elements—the
perfect environment for premium retailers and top international brands, such as Hollister, LEGO and Marks & Spencer. The mall‘s appeal to customers was illustrated by the more than one million visits during the fi rst month of opening. So Ouest has a BREEAM “Excellent” rating for its environmental qualifi cations, a fi rst for a shopping centre in Europe.
October 2012
October 2012
RECORD LOW COST OF DEBT
Unibail-Rodamco successfully issued a €500 Mn bond with a 4.7 year maturity and a 1.625% coupon. This represents the lowest coupon ever paid by Unibail-Rodamco for a public Euro benchmark. Out of €4.6 Bn of medium to long term fi nancing raised in 2012, the Group raised €2.4 Bn on the bond market at an average 99 basis points over mid swaps. This issuance contributed to a decrease in the Group’s average cost of debt to 3.4%.
04 • 05

06 • 07
Confl uence by night.

CORPORATE
The valueswhich
distinguishus

CEO & CHAIRMAN OF THE MANAGEMENT BOARD
Interview with the Chief Executive Offi cer and Chairman of theManagement Board
GUILLAUME POITRINAL
08 • 09

CORPORATE
How was 2012 for Unibail-Rodamco?
I am pleased to report that the 2012 results have
surpassed expectations. Recurring earnings per
share grew by 6.7%, well above the 4% outlook;
this refl ects the fact that prime, centrally located
assets have weathered the storm very well,
despite a challenging economic climate across
Europe. For example, in Les Quatre Temps and
Donau Zentrum, iconic shopping centres in La
Défense and Vienna saw tenant sales increase by
7.7 and 8.3%, respectively.
In Spain, the Group has outperformed national
indices and continued to create value – Splau,
a 55,000 m2 mall in Barcelona, acquired by the
Group in October 2011, demonstrates the Group’s
strength in re-marketing and re-designing
assets to return them to growth. An important
renovation project received a favorable reaction
from customers, with footfall increasing by 13.5%
in 2012.
A central theme in 2012 was re-inventing the
customer experience, could you tell us more?
The Group has a relentless appetite for innovation
and differentiation, and has kept advancing from
ambition to achievement in 2012, especially in
its capacity to adapt and understand changing
consumer trends. It is the end of boring shopping.
Customers are more sophisticated and going
to a shopping centre is no longer an obligation.
In response, our shopping centre strategy is to
offer the best of culture, brands, emotions and
entertainment in a single space.
This refl ection led to the 4 Star strategy, a label
that enforces an unmatched level of comfort and
service in the Group’s shopping centres. Each
Shopping Centre Manager will implement this
quality control by basing themselves on a distinct
571 point referential,
Creating multi-sensory spaces with light,
smell and sound is researched and applied by UR
Lab–a creative think thank launched in 2012 and
responsible for defi ning the Group’s innovation
vision.
The same innovative vision is being applied to
the Group’s offi ce segment. With the constraints
of today’s work life, how can the Group better
these environments for workers, whilst optimising
the costs for tenants? Our offi ces have considered
these constraints by offering fl exible fl oor plates and
the highest standards in terms of design, services
and technology. Our new strategy, ‘The New Art of
Working’, launched in 2012, concretely responds to
these challenges.
Finally, digital initiatives have become integral
to improving the customer experience and
building direct relationships with customers.
2012 was a record year: now all of the Group’s
shopping centres have an iPhone and/or Android
application, contributing to an exponential increase
in the number of apps downloaded ( 1.3Mn as of
December 2012 vs. 0.2Mn as of December 2011 )
and a number of unique features such as product
search, movie trailers and gift ideas. The number of
Facebook fans of the Group’s shopping malls also
revealed exceptional results in 2012, with 2.6Mn fans
in December, compared to only 0.7M the year before.
“It is the end of boring shopping.”
08 • 09

CEO & CHAIRMAN OF THE MANAGEMENT BOARD
Does a happy customer also make a happy
tenant?
Unibail-Rodamco is a leader in the six regions
in which it operates, making the Group a reference
for premium and differentiating retailers to
expand across Europe. Notable tenants include
the fi rst Apple store in France at the Carrousel du
Louvre, or the fi rst Nespresso strore in a shopping
store in France and the Netherlands. 2012 was
another record year, with 139 new leases signed
with international premium retailers. Retailers
understand that we need to work together
to exceed customer expectations. Part of the
Group’s differentiating strategy is to encourage
the development of fl agship stores, with iconic
shopfronts. Unibail-Rodamco is a demanding
landlord and this is refl ected through an active
tenant rotation. To meet retailer demand, the
Group has delivered 7 new shopping centres
and renovated or extended many of its large
shopping centres since the merger between
Unibail and Rodamco in 2007. The Group aims to
have renovated or extended 75% of its portfolio by
year-end 2014. Retailers understand that they also
need to innovate and adapt to changing consumer
trends. These are win-win partnerships.
In 2012, the Group started a partnership
with mfi , a deal totalling nine standing and
development projects in Germany. Does the
Group seek to expand into new regions?
Perhaps outside of its traditional Europe?
Germany has remarkable potential, with real
prospects due to rising wages and consumer
spending. Unibail-Rodamco could not ignore
this market; the question was fi nding the right
opportunity at the right time. These standing and
future assets are well located in catchment areas
with a signifi cant growth outlook. The Group
does not ignore opportunities outside Europe;
however we believe our management expertise
is further strengthened by a geographical
proximity with assets.
The Group has one of the largest development
pipelines in the industry, how confi dent are you
for growth in the years to come?
The fl exible €7 billion development pipeline is
ambitious, and can only be pursued because of
the Group’s strong balance sheet and highly rated
debt structure. As of December 31, 2012, the seven
brownfi eld and greenfi eld projects to be delivered in
2013 were already 70% pre-let. Because sustainable
development principles are important to the Group
and its stakeholders they are fully integrated in
the Group’s operations and pipeline; the BREEAM
excellent ratings achieved by recent deliveries and
projects are a testimony to Unibail-Rodamco’s
commitment to sustainable development.
These are remarkable projects; however they
will now be under the supervision of Christophe
Cuvillier, who will succeed me on the 25th of April
2013, the date at which my mandate ends. I leave
this incredible adventure of 18 years, with a feeling
of a job well done. Christophe and I share the same
vision for the Group; this gives me great confi dence
that Unibail-Rodamco will continue making the
right decisions and continue to steer the path of
performance for the many years ahead.
“Germany has remarkable potential, with real prospects due to rising wages and consumer spending.”
10 • 11
CORPORATE
10 • 11
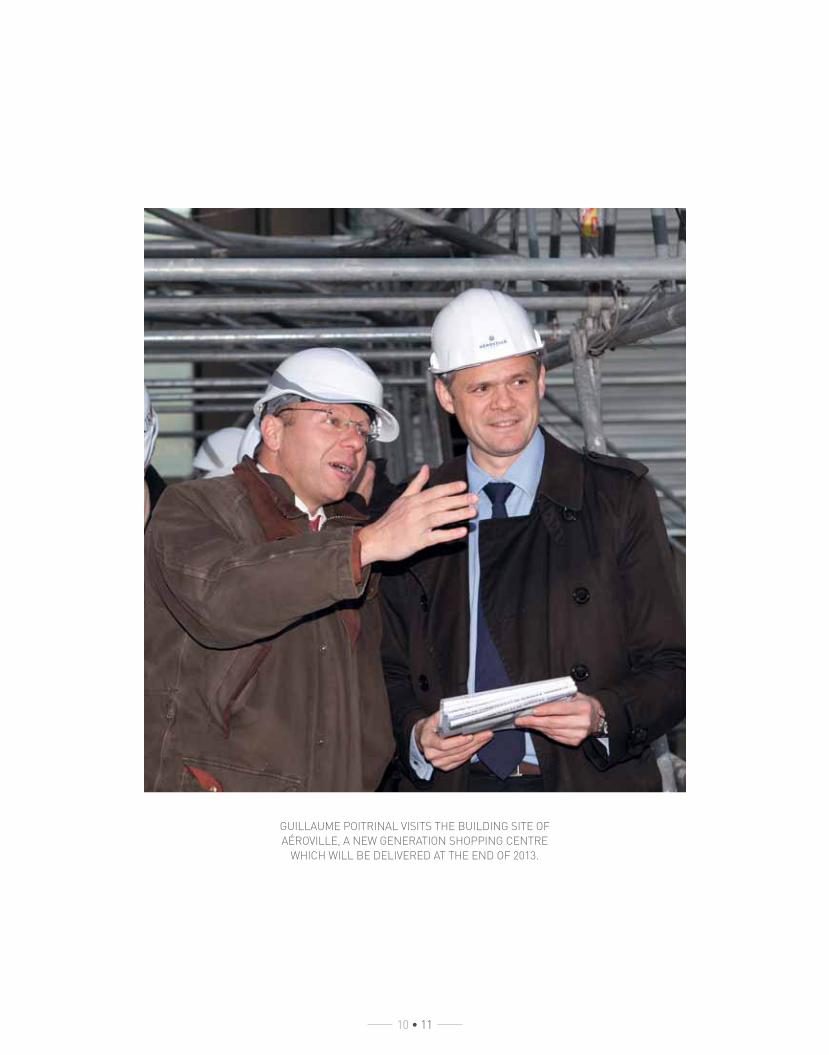
GUILLAUME POITRINAL VISITS THE BUILDING SITE OF
AÉROVILLE, A NEW GENERATION SHOPPING CENTRE
WHICH WILL BE DELIVERED AT THE END OF 2013.

HOW HAS THE SUPERVISORY BOARD PERFORMED DURING
YOUR FIRST YEAR AS ITS CHAIRMAN?
Under the inspiring leadership of my predecessor Robert van Oordt,
our board developed into a well-integrated and effective governing
body and it continues to perform very well.
All Supervisory Board members were actively involved in
2012 as evidenced by the 100% attendance rate at all board and
committee meetings, despite the various European residences
of board members. One of the meetings was combined with a visit
of the Group’s assets in Poland, providing board members with an
opportunity to meet with the regional team and visit a number of the
jumbo shopping centres. A full day was also dedicated to allowing
board members to become familiar with important business
initiatives undertaken by the Group.
HOW DID THE GROUP PERFORM?
The Group continued to perform well in 2012 despite the on-going
unpredictable economic climate and this is due to our strong and
dynamic management. The Group’s distinctive mark came to the fore
in 2012 with several new innovative programs, such as the 4 Star
policy, with all of them aimed at enhancing the Group’s services and
its appeal to tenants and visitors alike.
The Group also continued to relentlessly pursue high standards
of sustainability measures, and was awarded two gold stars by
EPRA with respect to its reporting and compliance with EPRA’s best
reporting standards.
WAS THERE ANY STRATEGIC INITIATIVE THAT STOOD OUT IN 2012?
The acquisition of a large stake in the major German shopping centre
investor, developer and manager, mfi , marks a solid entry into the
shopping centre business in Europe’s strongest economic region,
with promising opportunities for future expansion and value creation.
DO YOU HAVE ANY COMMENTS ON THE CHANGES IN
MANAGEMENT?
The Management Board underwent several changes during the
year. In particular, Jaap Tonckens, an existing Management
Board member, assumed the role of Chief Financial Offi cer in
addition to his responsibilities for the Group’s investment activities.
The Management Board will continue to
undergo change in 2013 with the departure
of the Group’s long standing Chief Executive
Offi cer, Guillaume Poitrinal and the internal
promotions of Christophe Cuvillier as the new
Chief Executive Offi cer, Jean-Marie Tritant as the
new Chief Operating Offi cer and Olivier Bossard
and Fabrice Mouchel as new members of the
Management Board in their capacities as Chief
Development Offi cer and Deputy Chief Financial
Offi cer respectively, on April 25, 2013. On behalf
of the Supervisory Board, I thank Guillaume
for his dedication and outstanding leadership
during the last 8 years. He has guided the Group
through both prosperous and challenging times
with enthusiasm and professionalism and his
contribution to the position the Group enjoys today
is immeasurable. I congratulate Christophe, Jean-
Marie, Olivier and Fabrice on their appointments,
which are testimony to the existing wealth of talent
and knowledge within the Group.
HOW DO YOU VIEW THE FUTURE?
Without underestimating the adverse economic
context, but looking at the Group’s achievements to
date as well as its creativity, ability to innovate and
its talented management which is supported by its
skillful and dedicated employees, the Supervisory
Board looks to 2013 and the years beyond with
confi dence.
SUPERVISORY BOARD
Interview with the Chairmanof the Supervisory
BoardROB TER HAAR
12 • 13

CORPORATE
12 • 13
MEMBERS OF UNIBAIL-RODAMCO’S SUPERVISORY BOARD
L to R: Jean-Louis Laurens; Rob ter Haar (Chairman of the Supervisory Board); Frans J.G. M. Cremers; François Jaclot (Vice-Chairman
of the Supervisory Board); Marella Moretti; Herbert Schimetschek; Mary Harris; Alec Pelmore; Yves Lyon-Caen; José Luis Duran.
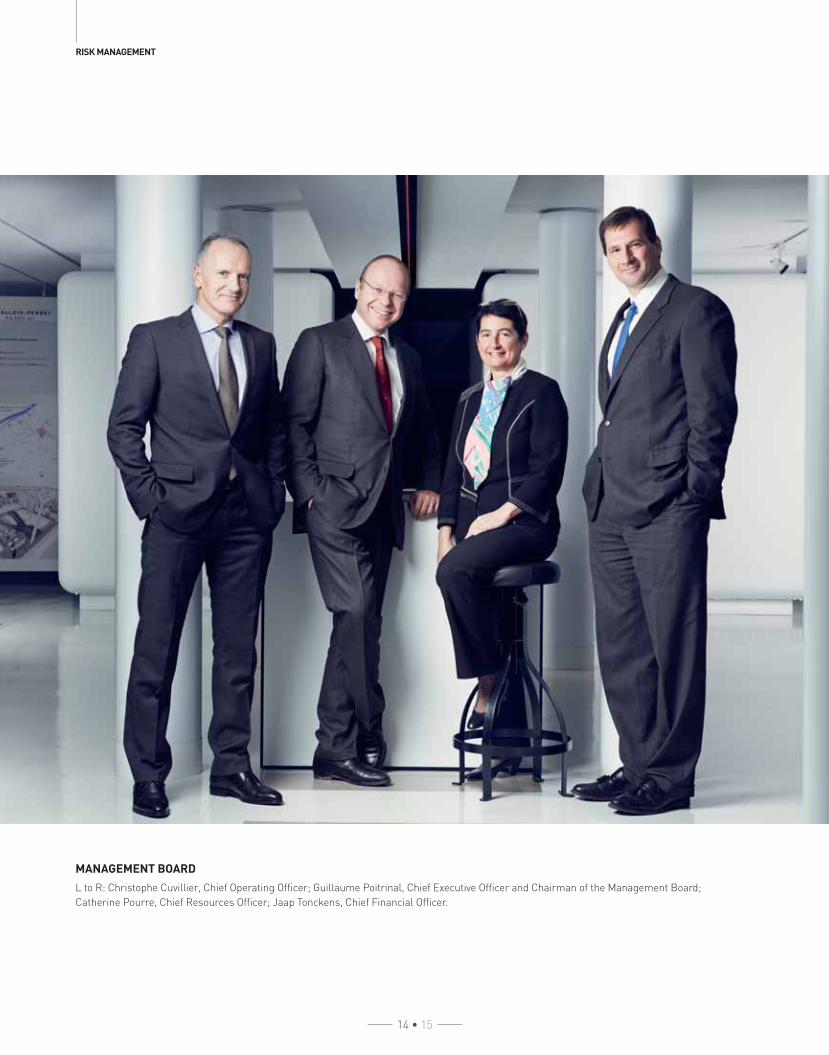
MANAGEMENT BOARD
L to R: Christophe Cuvillier, Chief Operating Offi cer; Guillaume Poitrinal, Chief Executive Offi cer and Chairman of the Management Board;
Catherine Pourre, Chief Resources Offi cer; Jaap Tonckens, Chief Financial Offi cer.
RISK MANAGEMENT
14 • 15

CORPORATE
14 • 15
Unibail-Rodamco operates a two-tier board structure, which ensures the right strategy is set, acceptable risks are taken and suitable fi nancial and human resources are mobilised
for sustainable economic growth.
Corporate Governance and Risk Management
SUPERVISORY BOARD
The Supervisory Board, chaired by Rob ter
Haar, exerts oversight and control over the
Management Board and the general affairs of the
Group. Supervisory Board members participate
in regular review sessions on subjects including
market and industry developments, fi nancial
and legal matters, sustainable development,
risk management, and governance. The Board
is assisted by two committees which focus on
specifi c aspects of its supervisory responsibilities:
the Audit Committee, and the Governance,
Nomination and Remuneration Committee.
As at 31/12/2012 all members are independent
according to criteria defi ned in the Supervisory
Board Charter, based on the AFEP-MEDEF
French Corporate Governance Code Criteria.
MANAGEMENT BOARD
The Management Board is chaired by
Mr. Guillaume Poitrinal and is responsible for
providing leadership for the Group four members
as at 31/12/2012. The Management Board’s duties
include developing and carrying out the Group’s
strategy within the approved risk profi le, effectively
structuring and staffi ng the organisation, applying
consistently the principles of sustainability to
operations and developments, and achieving and
properly reporting on fi nancial targets and results.
The Board operates under its own Charter and is
overseen by the Supervisory Board.
THE CODE OF ETHICS
The fundamental principles, values and standards
which govern the Group are described in Unibail-
Rodamco’s Code of Ethics. It sets out the Group’s
policy on respect for human dignity, respect
for employees’ work and non-discrimination,
on loyalty, integrity and confl icts of interest,
on ethical ways of doing business, and on the
treatment of confi dential information.
As a signatory of the UN Global Compact,
Unibail-Rodamco has undertaken to promote the
application of fundamental values with respect
to human rights, labour, the environment and
corruption.
RISK MANAGEMENT
The overall risk philosophy of the Group can be
described as conservative, with an emphasis on
accepting the risks which determine the nature
of the business, such as fl uctuations in the value
of assets, vacancies, volatility in market rents, or
risks associated with development activities. Key
risks are assessed using a standard, Group-wide
risk analysis framework and risk maps are used
to rank exposure on the basis of probability and
magnitude. Sensitivity analysis is also conducted
at Group level.
Unibail-Rodamco was ranked the 2nd best
company in the CAC40 in terms of Governance*.
Full details of the Group’s corporate governance structure and risk management approach are provided in the Report of the Chairman of the Supervisory Board and the Legal Information chapter.
* 2010 Study conducted by Proxinvest.
KEY FIGURES
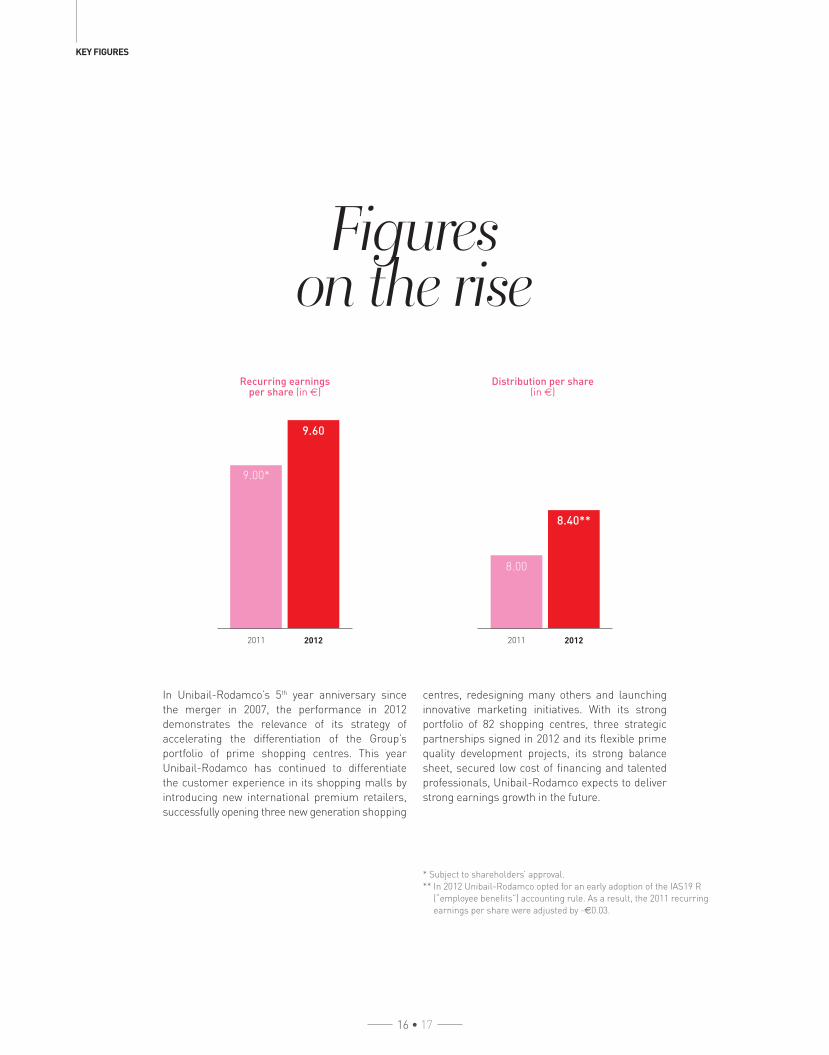
Figureson the rise
In Unibail-Rodamco’s 5th year anniversary since
the merger in 2007, the performance in 2012
demonstrates the relevance of its strategy of
accelerating the differentiation of the Group’s
portfolio of prime shopping centres. This year
Unibail-Rodamco has continued to differentiate
the customer experience in its shopping malls by
introducing new international premium retailers,
successfully opening three new generation shopping
centres, redesigning many others and launching
innovative marketing initiatives. With its strong
portfolio of 82 shopping centres, three strategic
partnerships signed in 2012 and its fl exible prime
quality development projects, its strong balance
sheet, secured low cost of fi nancing and talented
professionals, Unibail-Rodamco expects to deliver
strong earnings growth in the future.
Recurring earnings per share (in €)
Distribution per share (in €)
2011
9.00*
2011
8.00
2012
9.60
2012
8.40**
16 • 17
* Subject to shareholders’ approval.
** In 2012 Unibail-Rodamco opted for an early adoption of the IAS19 R
(“employee benefi ts”) accounting rule. As a result, the 2011 recurring
earnings per share were adjusted by -€0.03.

CORPORATE
16 • 17
NET RENTAL INCOME
€Mn 2012 2011 Growth %Growth %
like-for-like*
Shopping centres
France 537 499 7.5% 5.4%
Spain 141 129 9.4% 0.2%
Central Europe 108 101 6.8% 4.4%
Austria 102 90 13.8% 6.4%
Nordic countries 88 90 -2.7% 2.9%
The Netherlands 69 75 -7.8% 1.5%
Net Rental Income 1,044 984 6.1% 4.2%
Offices
France 146 155 -5.8% 8.2%
Other 26 29 -10.1% -0.9%
Net Rental Income 173 185 -6.5% 6.9%
Convention & Exhibition
Net Rental Income 101 93 7.7% 7.7%
Total
Net Rental Income 1,318 1,262 4.4% 4.8%
KEY CONSOLIDATED INDICATORS
€Mn 2012 2011 Growth %Growth %
like-for-like*
Net Rental Income 1,318 1,262 4.4% 4.8%
Valuation movements and gain on disposals 1,276 904
Net result (Group share) 1,459 1,325
Net recurring result (Group share)** 886 826 7.2%
Recurring earnings per share (in €)** 9.60 9.00 6.7%
Distribution per share (in €)*** 8.40 8.00 5.0%
NET ASSET VALUE (NAV)
in € per share Dec. 31, 2012 Dec. 31, 2011 Growth %
Going Concern NAV 151.10 143.10 5.6%
EPRA NNNAV 138.40 130.70 5.9%
* Like-for-like growth excluding acquisitions, divestments, transfers to and from pipeline (extensions, brownfi elds) and currency exchange
rate differences (computation based on the exchange rate used the previous fi scal year) in the periods analysed.
** 2011 results have been restated following the early adop tion of IAS19R, with an imp act of -€3.2 M n on EPRA Earnings and -0.03 €
on EPRA Earnings per share.
*** Subject to shareholders’ approval at the Annual General Meeting on April 25, 2013.

EPRA PERFORMANCE MEASURES
18 • 19
Unibail-Rodamco complies with the Best Practice Recommendations (BPR) established by EPRA, the representative body of the publicly listed
real estate industry in Europe. These recommendations, which focus on the key measures that are seen to be of the most relevance to investors, are intended to make the fi nancial statements of public real estate
companies clearer, more transparent and comparable across Europe.
EPRA performance measures
Defi nition
1.EPRA Earnings Recurring earnings from core operational activities
2.EPRA NAV Net Asset Value adjusted to include properties and other investment
interests at fair value and to exclude certain items not expected
to crystallise in a long-term investment property business model
3.EPRA NNNAV EPRA NAV adjusted to include the fair values of (i) fi nancial instruments,
(ii) debt and (iii) deferred taxes
4. i.EPRA Net Initial
Yield (NIY)
Annualised rental income based on the cash rents passing at the balance
sheet date, less non-recoverable property operating expenses, divided
by the market value of the property, increased with (estimated) purchasers’
costs
4. ii.EPRA ‘topped-up’
NIY
This measure incorporates an adjustment to the EPRA NIY in respect
of the expiration of rent-free periods (or other unexpired lease incentives
such as discounted rent periods and step rents)
5.EPRA Vacancy Rate Estimated Market Rental Value (ERV) of vacant space divided by ERV
of the whole portfolio

18 • 19
1.EPRA Earnings(in euros/share)
2.EPRA NET ASSET VALUE (NAV)
(in euros/share)
3.EPRA TRIPLE NET ASSET VALUE (NNNAV)
(in euros/share)
124.60
130.70
138.40
20
10
20
11
20
12
129.20
149.50
137.50
20
10
20
11
20
12
9.27
9.00*
9.602
01
0
20
11
20
12
4.i.EPRA Net Initial Yield (NIY) shopping centres
20
11
20
12
1.7%
2010 20102011 20112012 2012
1.9%
2.1% 7.1%7.3%
11.2%
4.i.EPRA Net Initial Yield (NIY) offi ces
20
11
20
12
4.ii.EPRA ‘topped-up’ NIY shopping centres
20
11
20
12
4.ii.EPRA ‘topped-up’ NIYoffi ces
20
11
20
12
5.EPRA Vacancy Rate shopping centres
5.EPRA Vacancy Rate offi ces
5.2%
5.0%
5.5%
5.4% 5.4%
5.2%
5.7%
6.0%
CORPORATE
* 2011 results have been restated following the early adop tion of IAS19R, with an imp act of -€3.2 M n on EPRA Earnings and -0.03 € on EPRA Earnings per share.
SHAREHOLDERS REPORT
20 • 21
Stock market performance and shareholding structure
Shareholdersreport
SHAREHOLDING STRUCTURE
Unibail-Rodamco has been listed on the Paris
Stock Exchange since 1972 and on the Amsterdam
Stock exchange since 1983. The Group is included
in the French CAC 40 index since June 18, 2007
and in the Dutch AEX 25 since June 22, 2007. On
February 8, 2010, Unibail-Rodamco entered the
Dow Jones Euro Stoxx 50 Index. On December
31, 2012, the Group had a market capitalisation of
€ 17.3 billion1.
1 Including 7,825 ORAs outstanding at December 31, 2012.
Unibail-Rodamco has a large and diverse
international shareholding base, which is mainly
composed of institutional investors based in the
United States, the Netherlands, France and the
United Kingdom. On January 1, 2013, none of
Unibail-Rodamco’s shareholders had declared
holdings of more than 10% of the issued share
capital. The main known shareholders, with
holdings of between 4% and 10%2, include APG
and Amundi.
2 Based on latest ownership threshold disclosures received.
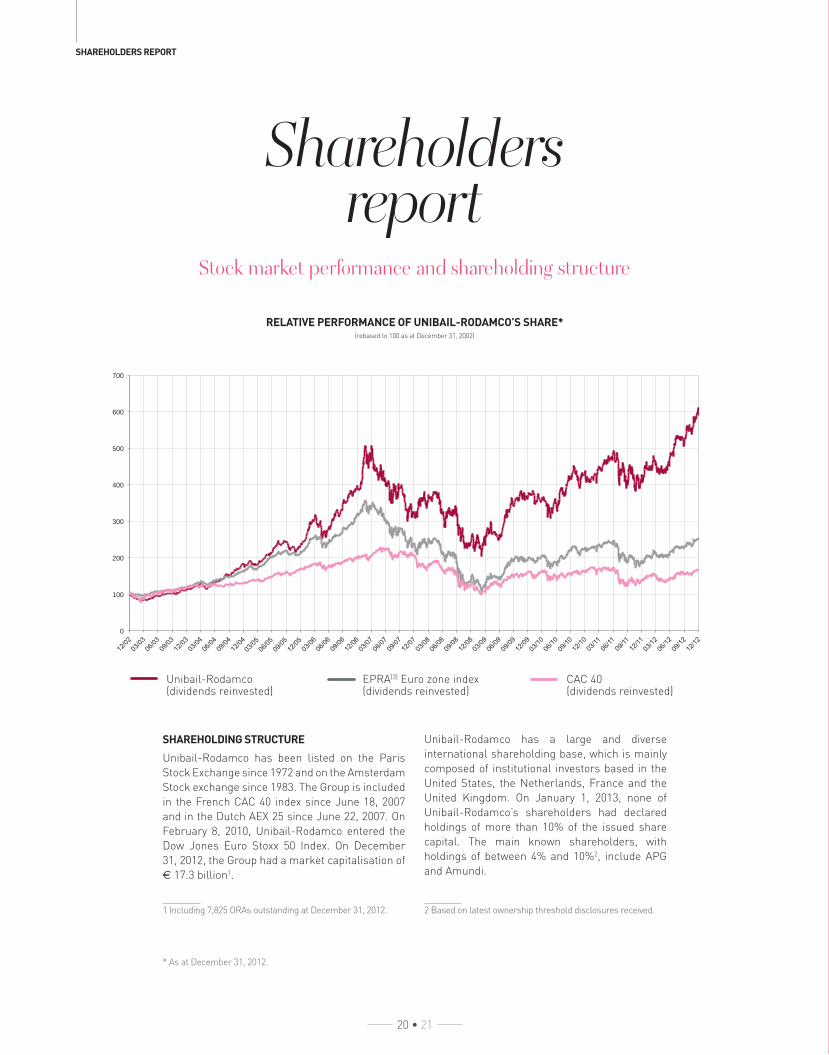
RELATIVE PERFORMANCE OF UNIBAIL-RODAMCO’S SHARE*(rebased to 100 as at December 31, 2002)
* As at December 31, 2012.
0
100
200
300
400
500
600
700
EPRA(3) Euro zone index(dividends reinvested)
Unibail-Rodamco(dividends reinvested)
CAC 40(dividends reinvested)
CORPORATE
20 • 21
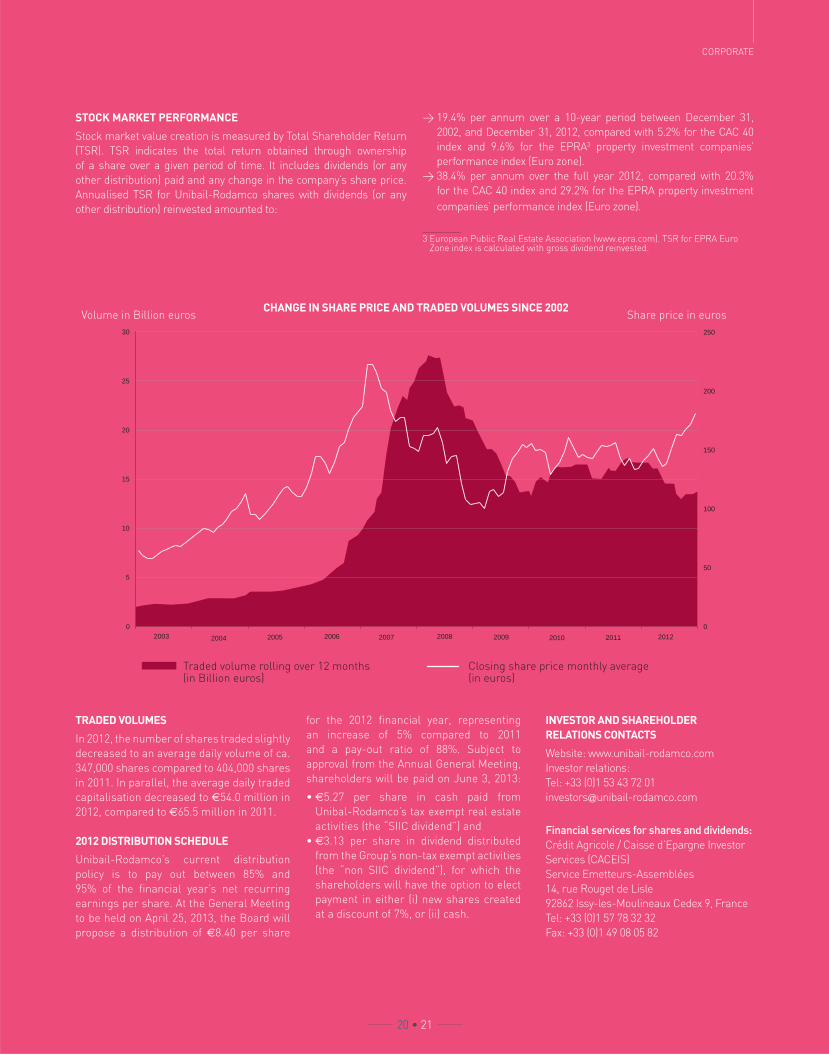
STOCK MARKET PERFORMANCE
Stock market value creation is measured by Total Shareholder Return
(TSR). TSR indicates the total return obtained through ownership
of a share over a given period of time. It includes dividends (or any
other distribution) paid and any change in the company’s share price.
Annualised TSR for Unibail-Rodamco shares with dividends (or any
other distribution) reinvested amounted to:
> 19.4% per annum over a 10-year period between December 31,
2002, and December 31, 2012, compared with 5.2% for the CAC 40
index and 9.6% for the EPRA3 property investment companies’
performance index (Euro zone).
> 38.4% per annum over the full year 2012, compared with 20.3%
for the CAC 40 index and 29.2% for the EPRA property investment
companies’ performance index (Euro zone).
3 European Public Real Estate Association (www.epra.com). TSR for EPRA Euro Zone index is calculated with gross dividend reinvested.
TRADED VOLUMES
In 2012, the number of shares traded slightly
decreased to an average daily volume of ca.
347,000 shares compared to 404,000 shares
in 2011. In parallel, the average daily traded
capitalisation decreased to €54.0 million in
2012, compared to €65.5 million in 2011.
2012 DISTRIBUTION SCHEDULE
Unibail-Rodamco’s current distribution
policy is to pay out between 85% and
95% of the fi nancial year’s net recurring
earnings per share. At the General Meeting
to be held on April 25, 2013, the Board will
propose a distribution of €8.40 per share
for the 2012 fi nancial year, representing
an increase of 5% compared to 2011
and a pay-out ratio of 88%. Subject to
approval from the Annual General Meeting,
shareholders will be paid on June 3, 2013:
• €5.27 per share in cash paid from
Unibal-Rodamco’s tax exempt real estate
activities (the “SIIC dividend”) and
• €3.13 per share in dividend distributed
from the Group’s non-tax exempt activities
(the “non SIIC dividend”), for which the
shareholders will have the option to elect
payment in either (i) new shares created
at a discount of 7%, or (ii) cash.
INVESTOR AND SHAREHOLDER
RELATIONS CONTACTS
Website: www.unibail-rodamco.com
Investor relations:
Tel: +33 (0)1 53 43 72 01
Financial services for shares and dividends:
Crédit Agricole / Caisse d’Epargne Investor
Services (CACEIS)
Service Emetteurs-Assemblées
14, rue Rouget de Lisle
92862 Issy-les-Moulineaux Cedex 9, France
Tel: +33 (0)1 57 78 32 32
Fax: +33 (0)1 49 08 05 82
Traded volume rolling over 12 months (in Billion euros)
Closing share price monthly average (in euros)
0
50
100
150
200
250
0
2005 2006 2007 2008 2009 2010 2011 2004 2003 2012
CHANGE IN SHARE PRICE AND TRADED VOLUMES SINCE 2002Volume in Billion euros Share price in euros
5
10
15
20
25
30

22 • 23
Nacka Forum, Stockholm (Sweden).

Re-inventing the customer experience
STRATEGY

24 • 25
THE UNIBAIL-RODAMCO DIFFERENCE
Re-inventing thecustomer experience
In 2012, the UR Lab launched a number of initiatives aimed at re-inventing the customer experience and further
strengthening the appeal of Unibail-Rodamco’s retail assets.
Digital initiatives
Dining experience
Iconic shopfronts
4 Star label
International premium retailers(1)
A NEW
STANDARDFOR
SHOPPING CENTRES
Apps downloaded
+ 525%
1.3 Mn2.6 Mn
33.3 Mn
0.7 Mn
0.2 Mn0.7 Mn
2011
2012
16 Mn 0.3 Mn
Facebook fans
+ 278%Website visits
+ 108%Loyalty cardholders
+ 124%
DIGITAL INITIATIVES
(1) A premium retailer is a retailer which has a strong and international brand recognition, with a differentiating store design and product approach and which may contribute to increase the appeal of the shopping centre.

STRATEGY
24 • 25
4 STAR LABEL
The 4 Star label for the Group’s shopping centres is a unique and pioneering approach which sets ambitious
targets for improved quality, at each stage of the customer’s shopping experience
9 centres labelled 4 Star in 2012
20 more shopping centres to be labelled 4 Star in 2013
A WIDE COLLECTION OF PREMIUM INTERNATIONAL RETAILERS
139 new leases signed with premium international retailers in 2012
34 % increase in number of leases signed with premium international retailers in 2012 vs 2011
55 new premium retailers since 2009,
including 28 introduced in the Group’s shopping centres for the fi rst time
From affordable to premium:
A premium partner in Europe:
ICONIC SHOP FRONTS
The iconic shop fronts project will make Unibail-Rodamco’s malls “the Home of the Flagships™ ”.
1st store in a shopping centre, in France and
in the Netherlands
1st store in a shopping centre,
in France
1st two stores in Sweden
1st four storesin France
1st two stores in Continental
Europe
By upgrading the overall height and quality of the Group’s
tenants’ shop fronts, this promotes variety, innovation
and design excellence in Unibail-Rodamco’s malls.
> 500+ units identifi ed in the portfolio
> Support material produced, for the uniform
application of the Group’s best practices.
The Dining Experience, a new strategy
launched in 2012, is Unibail-Rodamco’s answer
to the future of dining and leisure within its
portfolio of 4 Star shopping centres. It places
restaurants, socialising and relaxation at the
heart of the shopping centre experience, with
a mixture of the best local and international
restaurateurs, an exceptional design for its
Dining Plaza’s and a dedicated programme of
events and marketing. The Group will be rolling
out the Dining Experience in 25 of its shopping
centres between 2012 and 2015, doubling the
area dedicated to restaurants and gastronomy
for the Group’s shopping centres involved.
DINING EXPERIENCE

26 • 27
SO OUESTA NEW GENERATION SHOPPING CENTRE
So OuestA new generation shopping centre
With the opening of So Ouest on October 18, 2012, Unibail-Rodamco defi ned a new standard of shopping centre
in terms of design, customer experience, tenant mix and connectivity.
96%*CUSTOMER
SATISFACTION
59,569*FACEBOOK
FANS
90,371*APPS
DOWNLOADED
2.8 MnVISITS
in the fi rst three months of opening
Unique design and architectureDesigned in the style of
Haussmannian apartments
-
Use of noble materials, such as marble
and leather, in the interior design
-
Urban architecture in a
revitalised district * As of December 31, 2012.

STRATEGY
26 • 27
Polysensorial ExperienceMixing sounds, scents and spectacular views
Environmental excellence 1st mall BREEAM Excellent
certifi ed in Europe
74% OF CUSTOMERS
COME BY FOOT
OR PUBLIC
TRANSPORT
Central location
4 Star services Personal shopper
-
Shoe shining service
-
Valet parking for cars
and scooters
Upscale tenant mix 18 premium international
retailers
-
The 1st Dalloyau in a shopping
centre
-
The 2nd Uniqlo in France
in a shopping centre
-
The 1st Marks & Spencer in
a shopping centre in France
and the largest in continental
Europe
-
The 2nd Prêt à Manger store
in France in a shopping centre
(after Les Quatre Temps)
-
The 1st LEGO store in France
-
The 1st Claudie Pierlot and
Bel Air in a shopping centre
-
The largest hypermarket
in greater Paris

To respond to the increasingly h igh
expectat ions of customers, Unibail-
Rodamco consulted a large number of
customers in order to develop a pioneering
new strategy that would create even higher
targets for quality and service in its shopping
centres. To apply this new strategy, the
fi ndings of the surveys were used to develop
571 point referential, which each shopping
centre manager uses to guide them towards
4 Star excellence. The Group decided to
partner with SGS, the world leader in
service certifi cation to ensure independent
verifi cation and validation of compliance with
these demanding standards. SGS audits and
validates the candidacy of each shopping
centre through a complete audit and an
annual mystery visit, both conducted in the
presence of customers.
The 4 Star label translates into
accompanying and communicating with
the client at every stage of his visit through
various services, such as cloak rooms,
the development of Iphone and Android
applications, attractive rest areas equipped
with iPads and free and unlimited WIFI.
There are also “premium” services, which
include, valet parking for cars and scooters,
shoe shining, a personal shopper…
In 2012, Unibail-Rodamco launched the 4 Star label: a unique, pioneering approach which sets ambitious targets for improved quality
at each stage of the customer’s shopping experience.
4 STAR LABEL
28 • 29
26 MARCH
26 APRIL
10 MAY
MALLS LABELLED 4 STARIN 2012
The 4 Star shoppingexperience

STRATEGY
points in the quality referential
In partnership with SGS, the world leader in service certifi cation
20 more shopping centres to be labelled 4 Star in 2013
571
28 • 29
11 MAY
10 JULY
1ST OCTOBER
15 OCTOBER
16 NOVEMBER
27 NOVEMBER

PROJECTS IN THE PIPELINE
30 • 31
Unlocking value through a new generation of assets
Projectsin the pipeline
In a world of change, Unibail-Rodamco has adapted to shifting
consumer patterns by developing a new generation of shopping
centres and offi ces that offer spectacular architecture and interior
design, whilst creating value for stakeholders and respecting the
highest levels of environmental certifi cations.
The Group’s ability to conduct a countercyclical development
strategy is based on its robust balance sheet and fi nancial discipline.
With its “A” rating from S&P and Fitch Ratings, Unibail-Rodamco
fi nances its development projects through its active balance sheet
management and in the most cost effective manner.
As of 31 December 2012, Unibail-Rodamco’s development
pipeline amounted to €7.0 Bn and represented 1.4 Mn m2 GLA to be
re-developed or added to the standing portfolio.
Brownfi eld
shopping centres
€0.96 Bn
Offi ce & Others
€0.86 Bn
Shopping centres
extensions/renovations
€1.02 Bn
30%
36%
34%COMMITTED
DEVELOPMENTS BY CATEGORY
€2.85 Bn

STRATEGY
30 • 31
Centrum Cerny MostPRAGUE | H1 2013
—
Piloted by renowned inter-
national architectural fi rm
Benoy, this important exten-
sion and renovation project will
drastically improve the retail
offer, adding 44,000 m² GLA to
the existing mall and almost
doubling its size.
AérovillePARIS REGION | H2 2013
—
Located close to the Charles
de Gaulle airport, the 2nd most
important airport by traffi c
in Europe, this 85,000 m²
GLA state of the art shopping
centre designed by Philippe
Chiambaretta will be centred
around 5 themes, each paying
tribute to a particular region of
the world.
2013
AlmaRENNES | H2 2013
—
Inaugurated over 40 years
ago, Alma is the only shopping
centre of its kind in Brittany,
with a unique commercial offer,
including the only Printemps
department store in the
region and a 14,500 m² GLA
hypermarket. The renovation
and extension project will
double the space dedicated to
shopping, by adding 10,000 m²
GLA and 37 new shops. The
new design is inspired by the
surrounding region, with three
key themes: the Brocéliande
forest, the Channel and the
Atlantic.
Toison d’OrDIJON | H2 2013
—
Inaugurated in 1990, Toison
d’Or was the fi rst regional
shopping centre in Burgundy.
The ambitious renovation and
extension project will add
12,300 m² GLA and make Toison
d’Or the fi rst 4 Star shopping
destination in the region.

PROJECTS IN THE PIPELINE
32 • 33
Täby CentrumSTOCKHOLM | H2 2014
—
The project, directed by
the architectural fi rm
DunnetCraven, consists of two
major extensions, a thorough
refurbishment and a total
re-fi tting of the existing part
of the mall. In total, 28,000 m2
GLA will be added to Täby
Centrum and the number
of shops will increase from
160 to 230.
So Ouest Plaza PARIS REGION | H1 2015
—
The delivery of So Ouest
Plaza, located in Levallois,
Greater Paris, will offer
tenants a modern, effi cient
and sustainable location just
fi ve minutes away from the Arc
de Triomphe and the Champs
Elysées. With 40,000 m² of
offi ce space and impressive
leisure facilities, including
an 8-screen Pathé cinema,
So Ouest Plaza promises offi ce
users an ultimate comfort in
the workplace.
20152014
MajungaLA DÉFENSE | H1 2014
—
Designed by Jean-Paul Viguier,
this new generation offi ce
tower of 63,000 m² GLA will
offer unrivalled effi ciency in
terms of cost per workstation
(9.7 m2), comfort for offi ce
users and BREEAM “Excellent”
and HQE-BBC environmental
qualifi cations. Majunga is the
fi rst asset to launch ‘The
New Art of Working’ strategy.
Le Forum des HallesPARIS | H2 2014
—
This is a major renovation
project for one of the most
emblematic shopping
landmarks in Paris. The Forum
des Halles will be given a
new life when completed– an
impressive canopy designed
by Patrick Berger and Jacques
Anziutti will submerse the
shopping centre with natural
light and create a unique
atmosphere of leisure, culture
and retail.

STRATEGY
32 • 33
Mall of ScandinaviaSTOCKHOLM | H2 2015
—
Scheduled to open in
the autumn of 2015, the
100,000m² GLA project is the
most important retail project
in the region in terms of GLA
and investment and poised
to become northern Europe’s
next shopping and leisure
destination.
Polygone RivieraCAGNES-SUR-MER | H2 2015
—
Developed in collaboration
with Socri, Polygone Riveria is
a 71,000 m² GLA project in the
South of France and set to be-
come the fi rst open air centre
dedicated to leisure, culture
and art in France. Located in
an outstanding setting, it will
offer visitors the possibility
for a scenic stroll by the river
surrounded by works of art
and a vast retail offer ranging
from iconic brands to a luxury
district.
TrinityLA DÉFENSE | H1 2016
—
Imagined by the architectural
fi rm Crochon & Brullmann,
Trinity is a new generation
tower in La Défense which
will give its offi ce users a
unique sense of wellbeing in
the workplace, embodying
poly-sensorial features, a
high level of natural light and
opening windows, considered a
unique feature for a building of
this height. The 48,000 m² GLA
tower will also have panoramic
lifts and garden terraces with
exceptional views of the city.
Recklinghausen ArcadenRECKLINGHAUSEN | H1-2014
—
Mönchengladbach ArcadenMÖNCHENGLADBACH | H2 -2014
—
Osnabrück ArcadenOSNABRÜCK | H2-2016
—
> GERMANY
3 assets under development
Through a partnership with
mfi , Germany’s second largest
shopping centre operator,
investor and developer,
Unibail-Rodamco acquired
3 remarkable projects under
development.

34 • 35
So Ouest the day of the inauguration, October 18, 2012.

OPERATIONS
Iconic assets
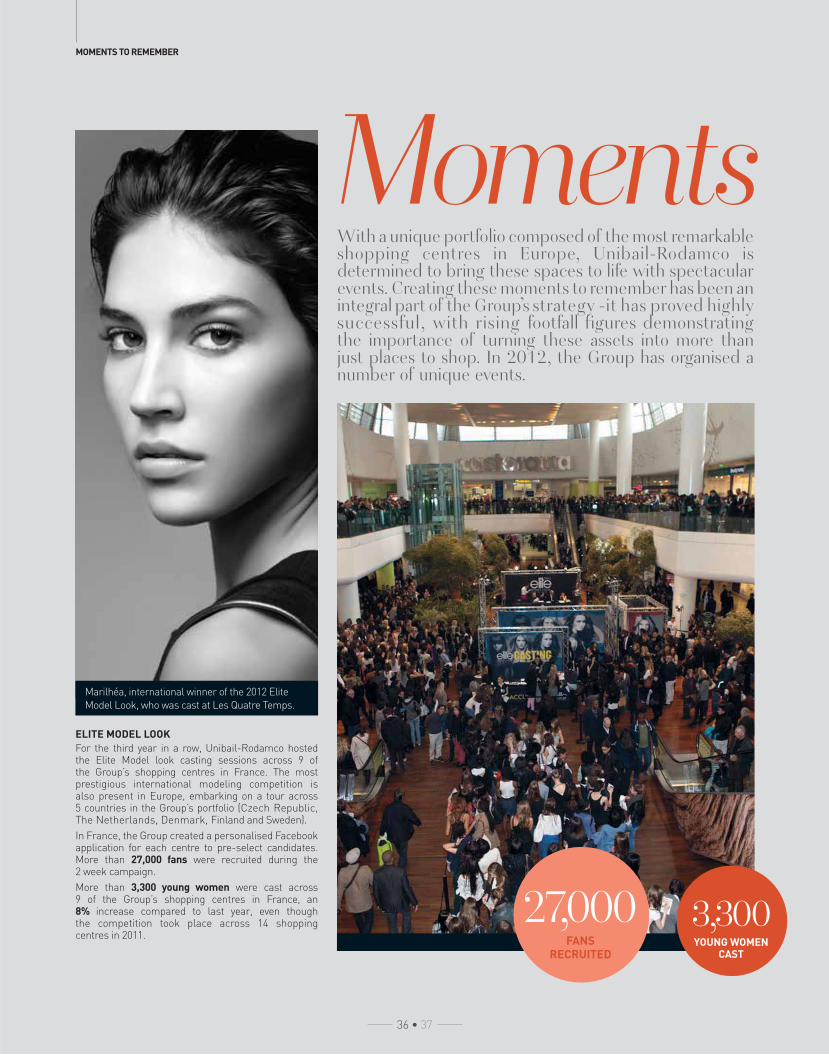
With a unique portfolio composed of the most remarkable shopping centres in Europe, Unibail-Rodamco is determined to bring these spaces to life with spectacular events. Creating these moments to remember has been an integral part of the Group’s strategy -it has proved highly successful, with rising footfall fi gures demonstrating the importance of turning these assets into more than just places to shop. In 2012, the Group has organised a number of unique events.
ELITE MODEL LOOK
For the third year in a row, Unibail-Rodamco hosted the Elite Model look casting sessions across 9 of the Group’s shopping centres in France. The most prestigious international modeling competition is also present in Europe, embarking on a tour across 5 countries in the Group’s portfolio (Czech Republic, The Netherlands, Denmark, Finland and Sweden).
In France, the Group created a personalised Facebook application for each centre to pre-select candidates. More than 27,000 fans were recruited during the 2 week campaign.
More than 3,300 young women were cast across 9 of the Group’s shopping centres in France, an 8% increase compared to last year, even though the competition took place across 14 shopping centres in 2011.
MOMENTS TO REMEMBER
36 • 37
Moments
27,000FANS
RECRUITED
3,300YOUNG WOMEN
CAST
Marilhéa, international winner of the 2012 Elite
Model Look, who was cast at Les Quatre Temps.

OPERATIONS
36 • 37
to rememberART BATTLES
In 2012, a partnership was created with Art Battles, a unique concept from New York, where artists from the big apple compete with local artists to produce live art. The animated artistic event went on a European tour across the Group’s assets in Warsaw, Amsterdam and Paris – the winners of this tour met for the Grand fi nale in the Forum des Halles in Paris.
+11.8%*
+9.3%*
+7.3%*
Compared to the previous year, footfall increased
IN ARKADIA
IN ALMERE
IN THE FORUM DES HALLES
* Compared to the same period the previous year.

MOMENTS TO REMEMBER
38 • 39
LONDON SHOPPING
In sync with the festivities that surrounded the Olympic Games, the spirit of London crossed the Channel to create a unique event in the Group’s shopping centres. London Shopping took place over ten days in Paris, Lyon, Lille and Calais. The event was a chance for guests to enjoy a range of British animations, such as a photo call, tea time, English lessons, horse guards and bobbies. There was also the opportunity to enjoy a taxi service in London’s famous black cab, or enjoy unique British products, from food to culture.
MORE THAN
2.2 millionVISITORS CAME TO LONDON SHOPPING
MORE THAN
23,000PARTICIPANTS ANIMATED THE EVENT

OPERATIONS
* Compared to the same period the previous year.
38 • 39
A DINOSAUR WORLD
Dinosaur World was a remarkable event for children, jogging their imaginations as large prehistoric animals were brought to life at Rosny 2. The event included a range of exciting workshops, such as the chance for children to take a ride on a mini dinosaur, play the role of an explorer by digging for fossils or participate in the many educational workshops about dinosaurs.
+11.2%*INCREASE IN FOOTFALL,
COMPARED TO THE PREVIOUS YEAR.
17,000CHILDREN
ATTENDED TO THE EVENT

MOMENTS TO REMEMBER
40 • 41
LAZY TOWN
Lazy Town is a hugely popular children’s television show that aims to teach healthy habits on eating and exercise. The show has taken the world by storm and was aired in over 100 countries. Based on this popularity and determined to spread these important messages to a wider audience, Lazy Town was involved in a full Spanish tour across 16 of the Group’s shopping centres – the event included workshops and activities where children learned healthy eating habits with the full 45 minute show in each shopping centre.
173,000MORE THAN
PEOPLE ATTENDED THE EVENT

OPERATIONS
40 • 41
LAUNCH OF THE DINING EXPERIENCE AT LA MAQUINISTA
An extraordinary dining experience, on a 50-metre platform with spectacular views of Barcelona! “Dinner in the Sky” offered selected winners an opportunity to enjoy a complimentary lunch or dinner at one of the six new restaurants in la Maquinista or to take part in a cooking workshop. On the ground, the event continued and included a number of animated gastronomy workshops.
220PEOPLE ATTENDING
“DINNER IN THE SKY”
16,352POSTS ON FACEBOOK
RELATED TO THE EVENT
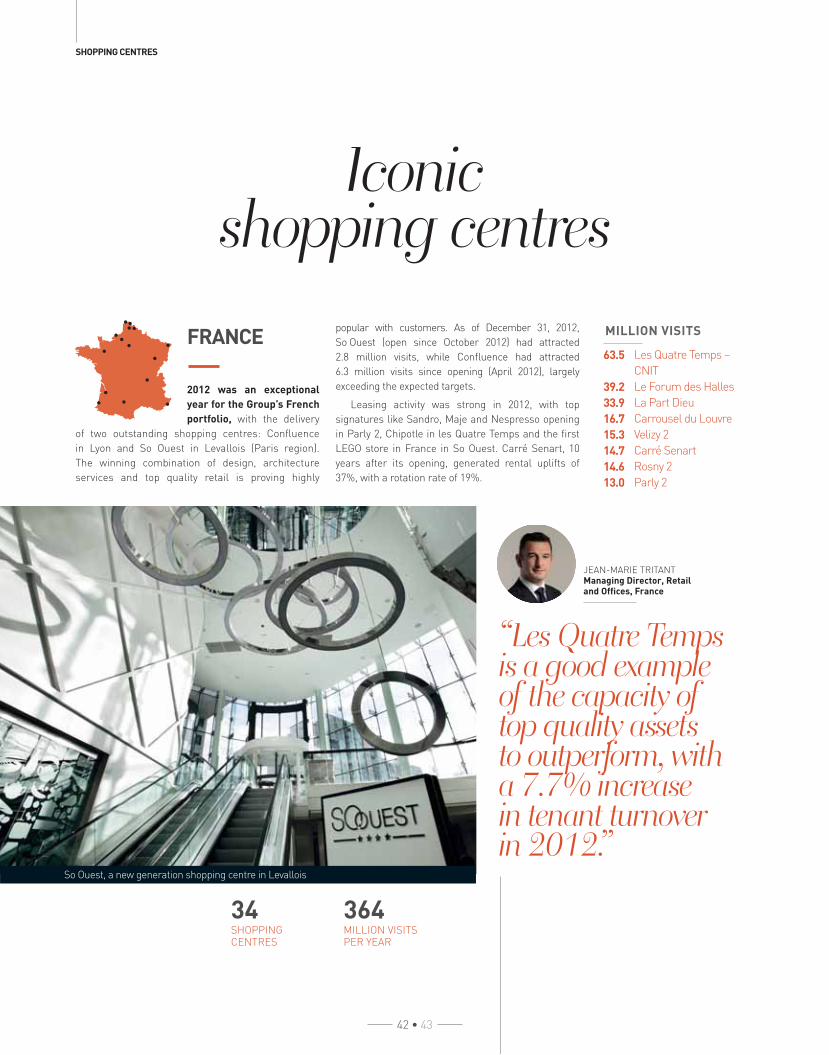
FRANCE
2012 was an exceptional
year for the Group’s French
portfolio, with the delivery
of two outstanding shopping centres: Confl uence
in Lyon and So Ouest in Levallois (Paris region).
The winning combination of design, architecture
services and top quality retail is proving highly
popular with customers. As of December 31, 2012,
So Ouest (open since October 2012) had attracted
2.8 million visits, while Confl uence had attracted
6.3 million visits since opening (April 2012), largely
exceeding the expected targets.
Leasing activity was strong in 2012, with top
signatures like Sandro, Maje and Nespresso opening
in Parly 2, Chipotle in les Quatre Temps and the fi rst
LEGO store in France in So Ouest. Carré Senart, 10
years after its opening, generated rental uplifts of
37%, with a rotation rate of 19%.
SHOPPING CENTRES
Iconic shopping centres
42 • 43
So Ouest, a new generation shopping centre in Levallois
“Les Quatre Temps is a good example of the capacity of top quality assets to outperform, with a 7.7% increase in tenant turnover in 2012.”
JEAN-MARIE TRITANTManaging Director, Retail and Offi ces, France
34SHOPPING CENTRES
364MILLION VISITS PER YEAR
Les Quatre Temps –
CNIT
Le Forum des Halles
La Part Dieu
Carrousel du Louvre
Velizy 2
Carré Senart
Rosny 2
Parly 2
63.5
39.2
33.9
16.7
15.3
14.7
14.6
13.0
MILLION VISITS
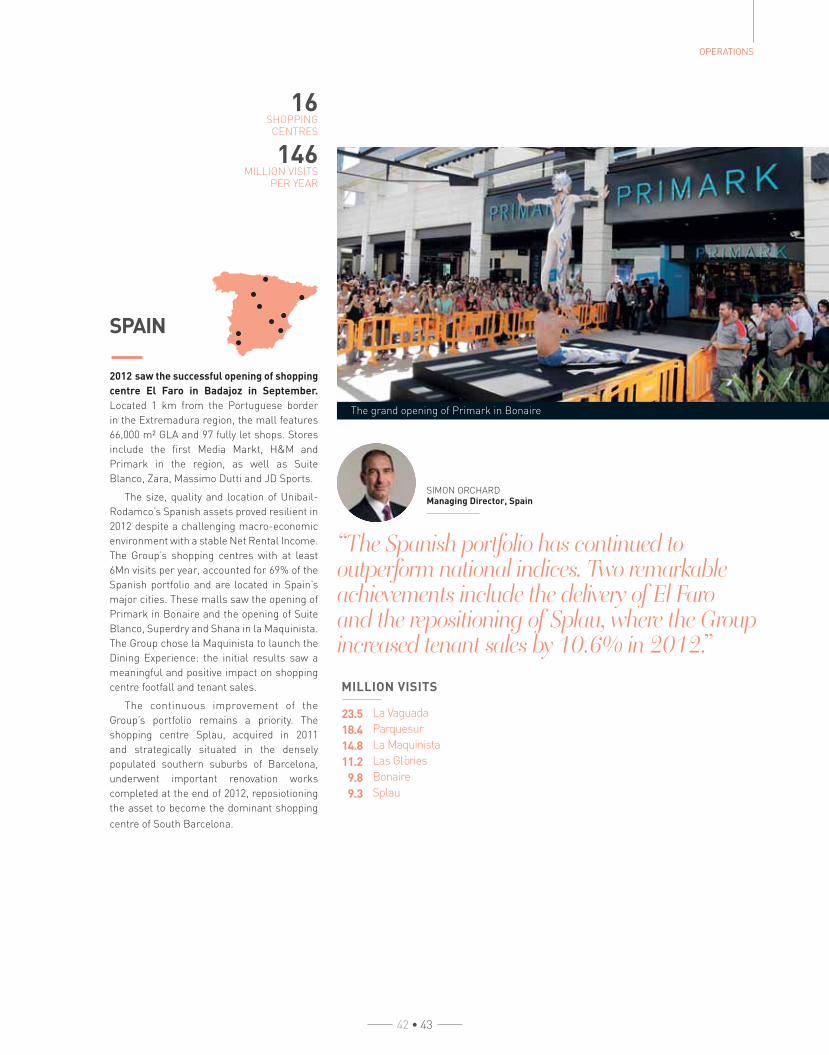
The grand opening of Primark in Bonaire
42 • 43
16SHOPPING CENTRES
146MILLION VISITS
PER YEAR
SPAIN
2012 saw the successful opening of shopping
centre El Faro in Badajoz in September.
Located 1 km from the Portuguese border
in the Extremadura region, the mall features
66,000 m² GLA and 97 fully let shops. Stores
include the fi rst Media Markt, H&M and
Primark in the region, as well as Suite
Blanco, Zara, Massimo Dutti and JD Sports.
The size, quality and location of Unibail-
Rodamco’s Spanish assets proved resilient in
2012 despite a challenging macro-economic
environment with a stable Net Rental Income.
The Group’s shopping centres with at least
6Mn visits per year, accounted for 69% of the
Spanish portfolio and are located in Spain’s
major cities. These malls saw the opening of
Primark in Bonaire and the opening of Suite
Blanco, Superdry and Shana in la Maquinista.
The Group chose la Maquinista to launch the
Dining Experience: the initial results saw a
meaningful and positive impact on shopping
centre footfall and tenant sales.
The continuous improvement of the
Group’s portfolio remains a priority. The
shopping centre Splau, acquired in 2011
and strategically situated in the densely
populated southern suburbs of Barcelona,
underwent important renovation works
completed at the end of 2012, reposiotioning
the asset to become the dominant shopping
centre of South Barcelona.
OPERATIONS
“The Spanish portfolio has continued to outperform national indices. Two remarkable achievements include the delivery of El Faro and the repositioning of Splau, where the Group increased tenant sales by 10.6% in 2012.”
SIMON ORCHARDManaging Director, Spain
La Vaguada
Parquesur
La Maquinista
Las Glòries
Bonaire
Splau
23.5
18.4
14.8
11.2
9.8
9.3
MILLION VISITS

SHOPPING CENTRES
44 • 45
A skateboarding event for the opening of Vans at Centrum Chodov.
American Eagle Outfi tter’s fi rst store in Continental Europe, in Arkadia.
“The quality of the Group’s Central European portfolio combined with pro-active
management has continued to off er unique destinations
in the region. The delivery in 2013 of the major renovation
and extension project at Centrum Cerný Most will only
increase this appeal.”
CENTRAL EUROPE**
A very strong leasing activity for 2012, which led to
an NRI like-for-like growth of +4.4%. Some highlights
of this vibrant re-tenanting include the opening of
Victoria’s Secret, a Hugo Boss fl agship store and
the fi rst Hollister and Michael Kors in the country in
Galeria Mokotow. American Eagle Outfi tters opened
in Arkadia, its fi rst store in Continental Europe;
Centrum Chodov welcomed the fi rst Desigual and
Swarovski White in the Czech Republic. Other tenants
introduced in 2012 included TM Lewin, Inglot, Vans
and North Face in Centrum Chodov.
8*SHOPPING CENTRES
110*MILLION VISITS
PER YEAR
ARNAUD BURLINManaging Director, Central Europe
The 44,000 m² GLA major extension and renovation
project at Centrum Cerný Most in Prague, will open
in March 2013, doubling the size of the existing mall,
establishing it as a leading supra-regional shopping
centre of more than 81,000 m2 GLA.
The Group has not ceased exploring opportunities
to further improve the quality of its portfolio in the
region. A plot of land was acquired in 2012 in Wroclaw,
a historical city and the largest in the West of Poland
with some 632,000 inhabitants.
* Including Złote Tarasy equity consolidated.** Excluding Germany.
Arkadia
Złote Tarasy
Wilenska
Galeria Mokotów
Centrum Chodov
Cerný Most
21.2
20.6
16.4
12.8
12.9
7.8
MILLION VISITS (MAIN ASSETS)
n

OPERATIONS
44 • 45
The largest retail project in the region – Mall of Scandinavia, which will open in 2015.
The fi rst Apple store in Sweden at Täby Centrum.
“Interest for the Group’s Nordic assets went from strength to strength in 2012. This bodes well for the launch of Mall of Scandinavia, the most important retail project in the region and the important extension-renovation works at Täby Centrum, voted Stockholm’s favourite shopping centre since 2003.”
NORDIC COUNTRIES
The Nordic region features a number
of development projects aimed at improving the customer
experience. Works for the future 100,000 m² GLA Mall of
Scandinavia started in 2012, for a delivery expected in 2015.
A complete refurbishment of Täby Centrum was delivered
in November 2012, with the second phase, a 28,000 m² GLA
extension, to be delivered in 2014. Fisketorvet also underwent
an ambitious renovation and restructuring programme which
was delivered at the end of November 2012; changes included
double height shop fronts and a new aisle design. In parallel to
these redevelopments, the Group continued its rationalisation
of the Nordic portfolio with the disposal of Halmstad in August.
Leasing activity was strong in 2012, with the opening of the
fi rst Apple store and the fi rst Sephora store in Sweden at Täby
Centrum, Hamley’s also opened their fi rst store in Sweden at
Nacka Forum. Leasing for the Mall of Scandinavia also started
in 2012 and has already captured the attention of premium and
cross border retailers.
9SHOPPING
CENTRES
52MILLION VISITS
PER YEAR
OLIVIER COUTINManaging Director, Nordic Countries
Jumbo
Täby Centrum
Fisketorvet
Solna Centrum
Nacka Forum
10.8
10.2
6.8
6.7
6.4
MILLION VISITS

SHOPPING CENTRES
Donau Plex, underwent a complete renovation delivered in 2012.
46 • 47
“2012 was a record year for the Group’s Austrian assets, for instance, tenant sales at Donau Zentrum soared by 8.3 %.”
3SHOPPING CENTRES
54MILLION VISITS PER YEAR
MARKUS PICHLERManaging Director, Austria
Shopping City Süd
Donau Zentrum
Aupark
23.2
18.0
12.5
MILLION VISITS
AUSTRIA
2012 represented another
exceptional year of leasing activity for the Austrian portfolio:
Donau Zentrum welcomed the fi rst Aldo and Inglot store in
Austria. Thomas Sabo opened in Aupark and Pull & Bear
opened its fi rst Austrian store in Shopping City Süd.
The majority of a major renovation program at Shopping
City Süd was completed at the end of 2012. A €79 million
extension-renovation was initiated at Aupark with an
expected delivery in 2015. A complete refurbishment of
Donau Plex, Donau Zentrum’s entertainment and leisure
complex with shops and state of the art cinemas, was
completed at the end of 2012 – these major works included
everything from the façade, the interior design, a new tenant
mix, the refurbishment of the existing 13 cinema screens
and the introduction of IMAX®-technology.

OPERATIONS
46 • 47
An opportunity to taste a wide variety of exciting blends at Amstelveen’s Nespresso store.
“The Group focused on improving the inherent qualities of the existing portfolio in 2012. Major extension and renovation projects at Leidsenhage and Amstelveen will further increase the appeal of these assets for international premium retailers to expand in the Netherlands.”
THE NETHERLANDS
After successfully streamlining its activities in
the Netherlands through an ambitious disposal
program, the Group focused in 2012 on developing
and building the existing strengths of its core assets.
Signifi cant renovation projects are being developed
for both Leidsenhage and Amstelveen in close
cooperation with municipal authorities.
The success of differentiating premium brands
continued to prove highly successful in 2012. At
Amstelveen, this re-tenanting activity included the
opening of the country’s fi rst Nespresso store in a
shopping centre and the opening of a Bose experience
centre, also the fi rst in the Netherlands. Primark, the
hugely successful and affordable fashion brand, will
be an important anchor enhancing footfall when it
opens in Zoetermeer in 2013. Vapiano will also be
opening at Rotterdam Plaza in 2013.
5SHOPPING CENTRES
35MILLION VISITS PER YEAR
JOHN VAN HAARENManaging Director, The Netherlands
Citymall Almere
Stadshart Amstelveen
Zoetermeer
Vier Meren
10.3
9.6
8.9
6.1
MILLION VISITS

SHOPPING CENTRE MANAGERS
48 • 49
Our shopping centre managers
Rennes AlmaGaëlle AUBREE
RivétoileÉlisabeth LAPEYRE
La Part DieuJean-Philippe PELOU
Villeneuve 2Jonathan TOULEMONDE
Usine Mode & MaisonÉléonore BALOUD
Place d’ArcMaxence LELLOUCHE
Les boutiques du PalaisPascal REUNGOAT
Docks 76 and Saint SeverPhilippe VARIN
MériadeckThierry DUSSAUZE
Bab2Stéphane BRIOSNE
Carré SénartVéronique MARGERIE
Vélizy 2Frédéric SALETES
Côté SeineMartine ESCRIVANT
Carrousel du Louvreand Galerie GaitéAlexandra CADET
NicetoileSébastien MERCIER
Ulis 2Côme SIMPHAL
AuparkRudolf KUCIAK
Cité Europe et UCOSBertrand GAILLARD
Bay1 and Bay2Olivier DELAMARRE
Parly 2Dusan MILUTINOVIC
Donau ZentrumMichael MALE
Toison d’OrMatthieu GAILLY
Labège 2Olivier ADER
So OuestNelly PAIS
Docks VaubanKarl TAILLEUX
Forum des HallesAlexis VERON
Shopping City SüdAnton CECH
ConfluenceJérémy DESPRETS
Rosny 2Anne-Laure DURY
Quatre temps – CNITNicolas KOZUBEK

OPERATIONS
48 • 49
Nacka ForumLouise BERGQVIST
EquinoccioFernando GARCIO
Bahià SurErnesto PARDO
Täby CentrumChristoffer LIND
BarnasudAlexandra GODIA
Los ArcosAlvaro GUERRERO
SplauKatherine CORWITH
La VaguadaSebastián HERRERO
El FaroIago DIAZ
BonaireGermán LÓPEZ
Las GlóriesJoaquín FERNÁNDEZ
FisketorvetJacob BANNOR
La MaquinistaVictor GARCIA
HabanerasSofia OLAVARRIA
ParquesurEnrique BAYON
Sevilla FactoryMartin BURGO
AlbacenterImmaculada CASAPONSA
Nova LundMattias STOCK
FRANCE NORDIC COUNTRIES SPAIN THE NETHERLANDS AUSTRIA CENTRAL EUROPE
Arninge Centrum,Eurostop OrebroMalin LINDE
Solna CentrumCaroline REDMAN
VallsurNoemi PASCUAL
GarberaNuria VEGAS
Vier MerenDoris SLEGTENHORST
Zoetermeer andLeidsenhageMonique VAN GEEMERT
Citymall AlmereAllard STEENBEEK
AmstelveenBen VERHEIJEN
Centrum Cerný MostZdenka JAKSIC
Arkadia & WilenskaAnthony VESIN
Galeria MokotówPawel KLIMCZAK
Centrum ChodovMarcela HRDLICKOVA

OFFICES
Offi cesUnibail-Rodamco’s offi ce segment, representing 13% of the Group’s value, focuses on prime assets in the best locations
in the Central Business District of Paris and La Défense. The Group systematically invests in assets that demonstrate
excellence in architecture, design and environmental certifi cations.
50 • 51
Unibail-Rodamco is not a long term
owner of offi ces. Instead it aims to
develop, let and sell the asset once it
reaches maturity.
In 2012, the Group sold Tour Oxygene
to Crédit Agricole Assurances and
Caisse des Dépôts at a net initial yield
of 5.9%.
Some key signings for 2012 include
Société Générale in Les Villages and
Louis Vuitton Malletier in 34-36 Louvre.
Unibail-Rodamco has made a
concerted effort to understand the
challenges posed by in our modern
day work life in order to offer spaces
that are innovative and unique –
allowing companies to be faster, more
connected and to work in a more
collaborative manner. The Group’s
offi ce strategy systematically places
the end users at the heart of the
Group’s offi ce development.
Capital 8, located in Paris’ golden triangle, next to Parc Monceau.
14369,414GLA FOR THE FRENCH
PORTFOLIO
14ASSETS
IN FRANCE
JEAN-MARIE TRITANTManaging Director, Retail and Offi ces, France

A restful arrival, due to the availability of
perfect information on how to best navigate
to the building, its different accesses and
a traffi c synopsis.
A lobby designed like a luxury hotel,
corporate and zen at the same time, aiming
to create a break with the outside world.
Open, multi-purpose, poly sensorial spaces
designed for the ultimate well-being and
cooperation between co-workers.
A complete set of innovative and
personalised services for each employee.
Integrating innovation for individuals
inside and outside the building.
50 • 51
OPERATIONS
The challenge
To better the well-being of employees in order to:
> Decrease work related stress
> Enable greater communication amongst
co-workers and the different services, without
compromising the building’s effi ciency.
Unibail-Rodamco’s approach
Systematically study the different points
of contact the employee and visitor
will have with the building in order to
eliminate the daily stress associated
with modern day work life.
The New Art of Working
A pioneering approach centred around the offi ce user
1
2
3
4
5

CONVENTION & EXHIBITION
Convention & ExhibitionVIPARIS, Unibail-Rodamco’s convention and exhibition division, benefi ts from world-class
positioning, size, scale and fl exibility.
52 • 53
International congresses continued
their strong performance, with a 30%
increase in turnover since 2008 (creation
of VIPARIS), by way of events such as
the EAU congress1 and the ERA-EDTA
congress2.
2012 was a record year for shows,
with activity largely driven by landmark
events, such as: the Paris Motor show,
the largest show in the world in terms
of visits counting 1.23 million visitors,
in 2012 and the Foire de Paris which
attracted 681,200 visitors in 2012
representing a 4% increase compared to
the year before.
2012 was the triennial year for the
Intermat show; the world’s third largest
show dedicated to equipment and
techniques used in the building and civil
engineering sectors. It was held at Paris
Nord Villepinte and attracted 200,000
visitors and 1,350 exhibitors – a record
year for the show. The Paris Motor Show is the largest show in the world in terms of visits.
1. European Association of Urology.2. European Renal Association – European Dialysis and Transplant Association.
RENAUD HAMAIDEManaging Director Convention & Exhibition France

52 • 53
OPERATIONS
130CONGRESSES
305SHOWS
463CORPORATE EVENTS
Foire de Paris, is the largest show of its kind in Europe – centred around the home, the environment, recreation, well-being and world cultures.
In just three months, 250,000 visitors came to
the Tutankhamun show at the Porte de Versailles,
showing the popularity of new and differentiating
shows.
VIPARIS applies the same strategy as the
Group, investing in its assets and building on
their inherent qualities. The Palais des Congrès
benefi ted from a new interior design and a vibrant
exterior light show, inspired by the renowned light
show found on the Eiffel Tower.
* As of December 31, 2012.
898EVENTS IN 2012
31NEW SHOWS
+10% vs 2011
87%*PRE-BOOKED
FOR 2013
10VENUES
Live surgery at the EAU congress.

54 • 55
Sustainable development is strongly embedded in the Group’s strategy. The Majunga tower in la Défense near Paris, planned for delivery in 2014, is the fi rst offi ce tower
building in Europe to be certifi ed HQE “BBC”(1) and BREEAM “Excellent”. (1) BBC: low energy consumption building.

SUSTAINABLE DEVELOPMENT
Creating sustainable value
everyday
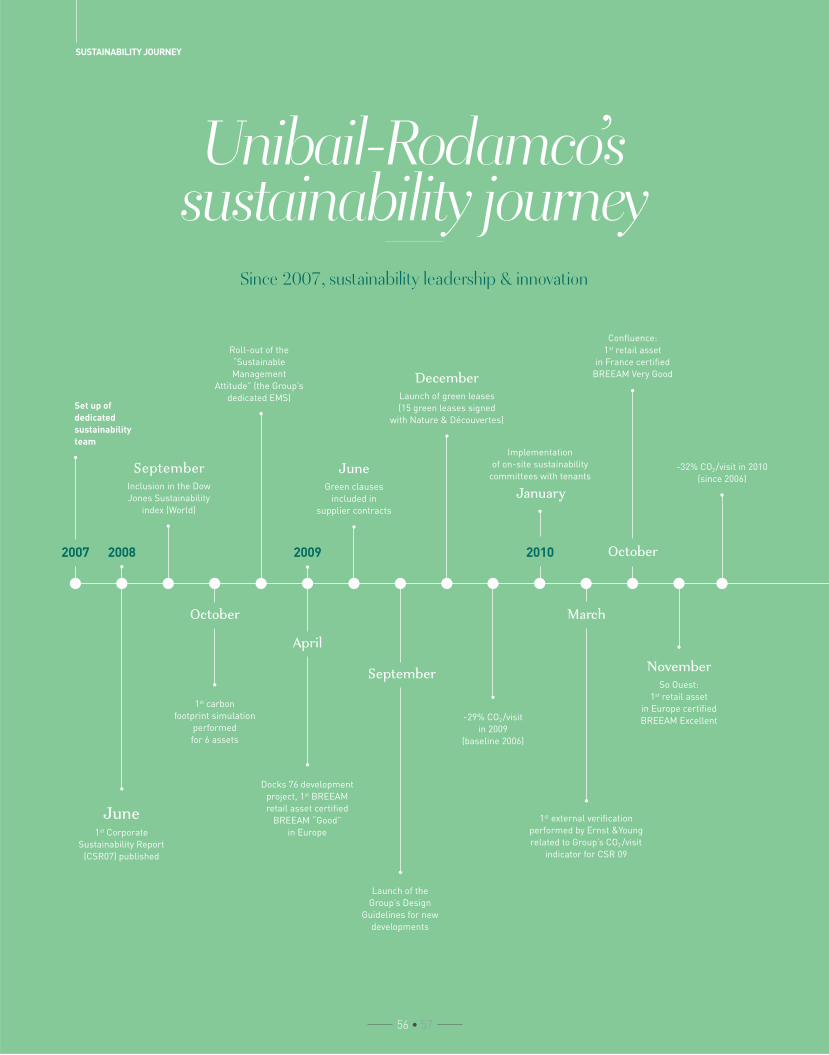
SUSTAINABILITY JOURNEY
Since 2007, sustainability leadership & innovation
56 • 57
Set up of
dedicated
sustainability
team
1st carbon
footprint simulation
performed
for 6 assets
Roll-out of the
“Sustainable
Management
Attitude” (the Group’s
dedicated EMS)
Docks 76 development
project, 1st BREEAM
retail asset certifi ed
BREEAM “Good”
in Europe
Launch of the
Group’s Design
Guidelines for new
developments
-29% CO2 /visit
in 2009
(baseline 2006)
Implementation
of on-site sustainability
committees with tenants
1st external verifi cation
performed by Ernst &Young
related to Group’s CO2 /visit
indicator for CSR 09
Confl uence:
1st retail asset
in France certifi ed
BREEAM Very Good
-32% CO2/visit in 2010
(since 2006)
Unibail-Rodamco’s sustainability journey
JuneGreen clauses
included in
supplier contracts
2008 2009 2010
June1st Corporate
Sustainability Report
(CSR07) published
SeptemberInclusion in the Dow
Jones Sustainability
index (World)
January
MarchOctober
April
DecemberLaunch of green leases
(15 green leases signed
with Nature & Découvertes)
September
October
NovemberSo Ouest:
1st retail asset
in Europe certifi ed
BREEAM Excellent
2007

SUSTAINABLE DEVELOPMENT
56 • 57
2012
100%of suppliers assessed
(maintenance, cleaning and security)
35% of total consolidated retail GLA
certifi ed BREEAM In-Use
93%of managed assets
undertook an annual health
& safety assessment
-24%kWh/visit in 2012
(since 2006)
50% of the Group’s active leases
are green
-58% CO2/visit in 2012
(since 2006)
-52% CO2/visit
in 2010
(since 2006)
AprilGRI CRESS B+ obtained for
2011 annual and sustainable
development report
SeptemberMateriality survey
and new sustainability strategy approved by the CSC
November
OctoberGroup’s
carbon footprint performed
(Grenellel II – article 75)
December4 managed shopping
centres certifi ed
under BREEAM
In-Use
December
SeptemberInclusion in the Dow
Jones Sustainability
index (Europe)
Deployment throughout the
Group of the Psycho-social
risk training course
Launch of the Group’s
Diversity Policy
MarchLaunch of Women@UR
2011
FebruaryMajunga development
project, 1st BREEAM
offi ce tower certifi ed
BREEAM “Excellent”
(highest score
in Europe)
Annual and
corporate
sustainability
reports
combined
March
Launch of
the Group’s
Health
& Safety
policy
2012 KEY
ACHIEVEMENTS

GOVERNANCE
A transparent governance
58 • 59
The Corporate Sustainability Committee (CSC) develops the
Group’s sustainability strategy, sets ambitious social and
environmental targets, and monitors results. The committee is
chaired by Catherine Pourre, the member of the Management
Board responsible for Unibail-Rodamco’s environmental and
social sustainability strategy and activities, all but one of the
members of the CSC report directly to the CEO. The CSC approved
the conclusions revealed by a materiality study, conducted in
September and performed by a third party which allows the
Group to reconsider its sustainability strategy by 2020.
Corporate Sustainability Committee1 Environmental Performance Committee
Stakeholdersand shareolders
Employmentand diversity
EnvironmentalResponsibility
Chaired by CATHERINE POURRE
Management Board member
managed by FRANÇOIS CANTIN
Group Sustainability Director
Supervisory Board Regions
INVESTMENT DEVELOPMENT LEASING OPERATING MARKETING
Vision | Policy | Target
who isin charge of sustainability Implement | Stimulate
Share | Report
(1) Christophe Cuvillier, member of the Management Board, Chief Operating Offi cer / Olivier Bossard, Group Director of Development / Simon Orchard, Managing Director of Spain / Pablo Nakhlé-Cerruti Group Director of Communications and Institutional Relations / François Cantin, Group Director of PMPS (Property Maintenance, Purchasing & Sustainability).
58 • 59
SUSTAINABLE DEVELOPMENT
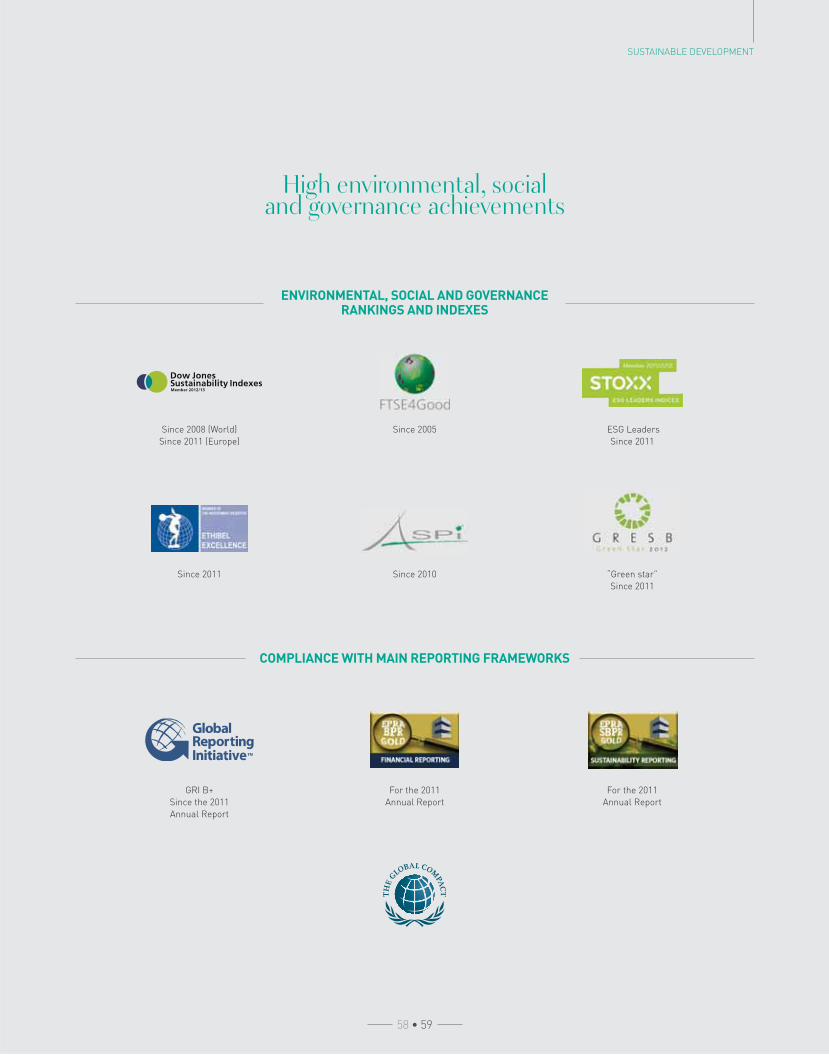
ENVIRONMENTAL, SOCIAL AND GOVERNANCE RANKINGS AND INDEXES
COMPLIANCE WITH MAIN REPORTING FRAMEWORKS
Since 2005
GRI B+
Since the 2011
Annual Report
“Green star”
Since 2011
Since 2008 (World)
Since 2011 (Europe)
For the 2011
Annual Report
Since 2011
ESG Leaders
Since 2011
For the 2011
Annual Report
Since 2010
High environmental, social and governance achievements

60 • 61
Material issues to create
sustainable value Since 2007, Unibail-Rodamco has developed a comprehensive and ambitious
sustainability strategy, with tangible achievements that demonstrate its
capacity to thrive in all sustainability fi elds. The Group has surpassed the
initial long term targets set for the 2006 to 2016 period. In 2012, the Group
decided that it was the right time to reconsider its sustainability vision and
commissioned Jones Lang LaSalle to perform a materiality review of its
sustainability strategy. The materiality study allowed the Group to:
> Understand and prioritise its sustainability impacts, risks and opportunities
> Develop a sustainability vision for 2020 (this timeframe is aligned with the
European Union’s new legislation)
> Create a hierarchy for material issues – defi ning long-term objectives and
short-term targets
> Develop a sustainability strategy which focuses on the most important topics
for the real estate sector and for Unibail-Rodamco’s business model, activities
and portfolio spread
> Enable Unibail-Rodamco staff to clearly articulate its sustainability vision
and priorities to external stakeholders
The conclusion of this study led to a new prioritisation of the Group’s issues
detailed in the matrix to the right. The new targets announced in the 2012
Financial Report (page 96) refl ect the results of the materiality analysis.
MATERIALITY

Top material issues to create sustainable value (1)
ISSUES TO BE FURTHER MONITOREDISSUES TO MAINTAIN UNDER CONTROL
IMP
AC
T O
N T
HE
GR
OU
P’S
VA
LU
E
Tenan
ts
Hum
an
rights
Crim
e
& S
afety
Was
te
Wat
er
Enhance
ment
of Public
Real
m
Climat
e
chan
ge
Labour
conditi
ons
in s
upply c
hain Lan
d degra
datio
n
& p
ollutio
n
Bio
divers
ity
conse
rvat
ion
Sustai
nable
procu
rem
ent
Product
Lebelli
ng
Emplo
yees
Energy &
Car
bon
Heal
th
& S
afety
Bribery
and c
orruptio
nCom
munity
Wellb
eing
Tran
sport
Connect
ivity
& T
ransp
ort
Local E
conom
ic
Dev
elopm
ent Custom
ers &
Vis
itors
TOP 8 MATERIAL ISSUES IDENTIFIED
LO
WM
IDD
LE
HIG
H
represent the biggest opportunities for creating value.(1) The top 8 issues which, given the current business strategy and activities,
60 • 61

62 • 63
Unibail-Rodamco’s new sustainability journey is structured around
the conclusions of the materiality survey, revealing a number of
business benefi ts and objectives in four strategic domains.
The Group’s ambitions have been reviewed to redefi ne the
relevant targets from 2012 (new baseline):
> Energy and carbon: Reduce carbon intensity (CO2/visit) at
managed shopping centres by 30% in 2020, relative to 2012
> Product labelling: Obtain a BREEAM In-Use certifi cation for
at least 80% of the retail portfolio’s consolidated GLA with a
minimum of ‘Very Good’ for ‘building’ and ‘management’ scores
by 2016
> Tenants: Exceed 90% of green leases for the total retail and offi ce
portfolio by 2016
> Community well-being: Cooperate with local authorities to
launch specifi c environmental or social initiatives in each
managed shopping centre by 2016
> Local economic development: Develop a methodology to
measure the economic and social impact of the Group’s assets
> Employees: deploy new actions to develop women’s leadership
across the Group
Re-align our sustainability vision and priorities with the Group’s strategy
MATERIALITY

SUSTAINABLE DEVELOPMENT
Our sustainable building blocks
EMPLOYEES
PRODUCT LABELLING
ENERGY AND CARBON
CONNECTIVITY AND
TRANSPORT
COMMUNITY WELL-BEING
LOCAL
ECONOMIC DEVELOPMENT
CUSTOMERS
TENANTS
-BUILDING
RESILIENCE
THROUGH
INNOVATION
-
-A MOTIVATED
WORKFORCE
EMPOWERED TO
DELIVER CHANGE
-
-UNLOCK
OPPORTUNITIES
FOR TENANTS AND
CUSTOMERS TO
MAKE SUSTAINABLE
DECISIONS
-
-CREATING
OPPORTUNITIES
FOR COMMUNITIES
TO PROSPER
-
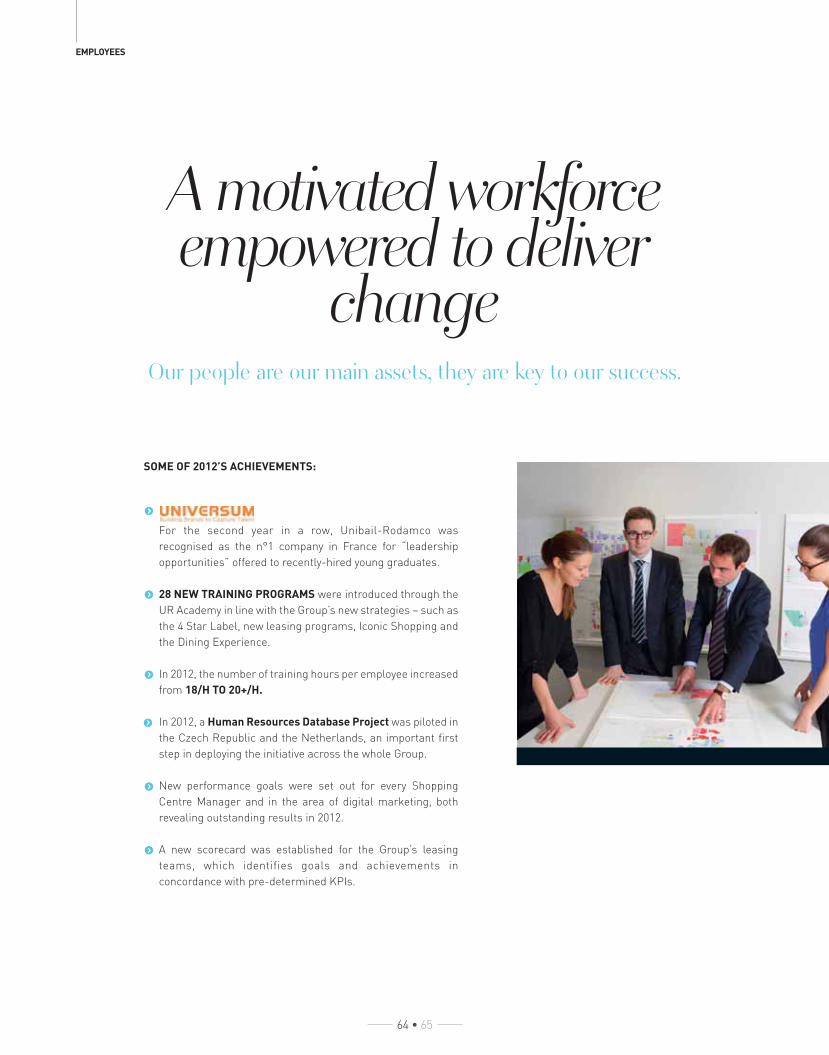
SOME OF 2012’S ACHIEVEMENTS:
For the second year in a row, Unibail-Rodamco was
recognised as the n°1 company in France for “leadership
opportunities” offered to recently-hired young graduates.
28 NEW TRAINING PROGRAMS were introduced through the
UR Academy in line with the Group’s new strategies – such as
the 4 Star Label, new leasing programs, Iconic Shopping and
the Dining Experience.
In 2012, the number of training hours per employee increased
from 18/H TO 20+/H.
In 2012, a Human Resources Database Project was piloted in
the Czech Republic and the Netherlands, an important fi rst
step in deploying the initiative across the whole Group.
New performance goals were set out for every Shopping
Centre Manager and in the area of digital marketing, both
revealing outstanding results in 2012.
A new scorecard was established for the Group’s leasing
teams, which identifies goals and achievements in
concordance with pre-determined KPIs.
A motivated workforce empowered to deliver
changeOur people are our main assets, they are key to our success.
EMPLOYEES
64 • 65

SUSTAINABLE DEVELOPMENT
women@UR
“Peer networking is an increasingly popular way to support the career advancement of female employees within companies”, states Delphine Merle, president of the network.
Initiatives to further help the integration of
young graduates in the European Graduate
Program (EGP) have been implemented in
2012 – all graduates are now assigned a
mentor and it is now the third year in a row that
all EGPs go through an induction program,
which includes team building activities such
as a football tournament and numerous case
studies.
In 2012, Women@UR was launched – a woman’s
network which aims to empower women to
take leadership positions, and where women
in senior positions mentor women in junior
roles. A dedicated leadership program was
created and delivered in collaboration with
Mckinsey.
64 • 65

LOCAL ECONOMIC DEVELOPMENT
66 • 67
CREATING VALUE FOR OUR ASSETS IS VALUE FOR OUR COMMUNITY
With €7 billion in the current pipeline and a managed
portfolio valued at €29.3 billion, Unibail-Rodamco is a
leader on the real estate market and acts as a key local
actor. Every Unibail-Rodamco asset plays an important
role for local economic and social development:
> Economic driver: direct employment through construction
and operations spending, indirect employment by tenant’s
sales and activities, supplier activity and local taxes.
> Urban planner: high connectivity, iconic architecture
and brownfi eld requalifi cation,
> Social integrator: services offered to visitors,
philanthropy, partnerships with local communities
and places that offer a unique experience (events,
entertainment, shopping).
Creating opportunities for communities to prosper
Parquesur, Spain.
Local economic development
Relaxing at Täby Centrum.

SUSTAINABLE DEVELOPMENT
66 • 67
Our occupiers*: tenants and suppliers through their business activities.
** Full Time Employees (FTE).
OPENING DATE
August 282002
-TOTAL INVESTMENT
COST (€ million)
162-
TOTAL GLA (m²)
118,600 m²-
NUMBER OF SHOPS
137 + multiplex
cinema-
CATCHMENT AREA (million inhabitants
0-30 min)
2.1-
NUMBER OF VISITS
2012 (million)
14.7-
SUSTAINABILITY
1st
shopping mall BREEAM In-Use double
Very Good certifi edin Europe
CARRE SÉNART: a 10-year contribution to the local economy
SPENDING WITH OUR SUPPLIERS
€42.5 millionTotal of recurring service charges and capex plan for property maintenance (cumulated from 2002 to 2012)
DIRECT JOBS SUPPORTED
2,069*
Through tenant’s indirect employment (1,997), opex spending with suppliers (66) ** and direct Unibail-Rodamco shopping centre employees (6)** (2012)
LOCAL TAX CONTRIBUTION
€11.6 millionTotal of local property taxes paid(cumulated 2002 to 2012)
TOTAL CONSUMER SPENDING
€3.6 billion Total of tenant’s sales(cumulated 2002 to 2012)
Carre Sénart, France.

68 • 69
COMMUNITY WELLBEING
OF MANAGED ASSETS EXTERNALLY
AUDITED IN 2012
93%
SO OUEST, active engagement with suppliers and local authoritiesSECURITY STAFF
15 agentsTotal of security agents(Full Time Employees – 2012)
WELCOME TRAINING
931 hours Total hours of training provided to our supplier’s staff to welcome visitors (security, cleaning and maintance)
CCTV CAMERAS
127 unitsNumber of CCTV cameras installedin the common areas and connected to the security room
Community wellbeing
CRIME AND SAFETY: A DAILY VIGILANCE
FOR WELCOMING PLACES
The high level of footfall across the Group’s assets requires
a dedicated commitment to ensure secure and welcoming
places for the best customer experience. This is achieved by:
> Specifi c training delivered to the staff
> Use of the highest safety devices and technologies
> Strong partnerships with local authorities
HEALTH & SAFETY MANAGEMENT: A STRONG FOCUS
FOR EVERYBODY’S WELLBEING
Unibail-Rodamco takes the health and safety of its customers,
tenants, suppliers, contractors and local communities very
seriously.
The Group has drawn-up an extensive in-house risk
management policy to ensure that risks are mitigated and
managed. In 2012, an independent, third-party health and
safety inspector was appointed in each country where the
Group operates. Each asset undergoes an annual assessment
of health and safety risk: a customised action plan is
implemented to continuously improve the quality of risk
management.
The annual risk assessment focuses on the
fol lowing topics: a ir management, water
management, legionella, technical facilities which
are potentially hazardous and asbestos.

SUSTAINABLE DEVELOPMENT
68 • 69
Philantropy
4,183,285€donated in cash and in kind in 2012
+44%donated in cash compared to 2011
397 local charity fundraising and awareness events
Entrepreneurship
EducationSocial
SCHOOL OF THE SECOND
CHANCE (E2C)
FRATELI
ENFANTS DE MAJUNGA
ARCHITECTURE CONFERENCES
with leading architects
(Jean Nouvel, Ricardo Bofi ll…)
VIPARIS’ ORIGINALITY PRIZE
GRAND PRIZE FOR YOUNG RETAIL ENTREPRENEURS:
€1.35 million distributed to the top three winners
SOME OF THE GROUP’S PARTNERS:
A partnership was signed with E2C and the shopping centre Carré Sénart to provide 18-25 year olds, with little or no qualifi cations, an internship with the mall’s 136 different retailers.

70 • 71
Building resilience through innovation
The Group’s development strategy is
strongly focused on value creation and
sustainability in the long term by delivering
assets that are attractive, effi cient and easy
to access. As well as ensuring that each
project provides the appropriate fi nancial
returns, Unibail-Rodamco integrates
the highest environmental standards
(recognised though obtained BREEAM
certifi cation scores). Comfort and design
is becoming increasingly important to
users. Unibail-Rodamco is responding by
developing a new generation of shopping
centres and offi ce buildings that offer
spectacular architecture and interior
design, a wide range of services and a
welcoming environnent.
Product labelling
PRODUCT LABELLING
Transport connectivity
Smart parking Iconic architecture
Materialselection
Building fl exibility
Energy effi ciency
Polysensoriality
Renewable energy
ComfortSound design
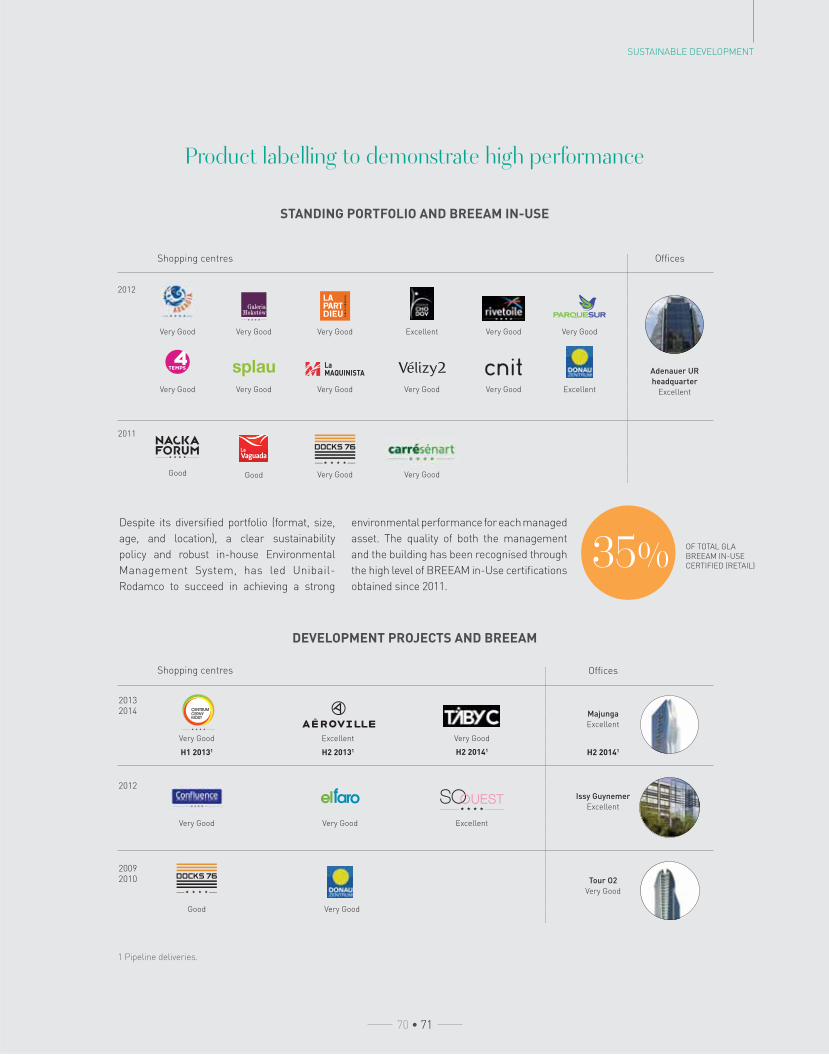
SUSTAINABLE DEVELOPMENT
70 • 71
Product labelling to demonstrate high performance
Despite its diversifi ed portfolio (format, size,
age, and location), a clear sustainability
policy and robust in-house Environmental
Management System, has led Unibail-
Rodamco to succeed in achieving a strong
environmental performance for each managed
asset. The quality of both the management
and the building has been recognised through
the high level of BREEAM in-Use certifi cations
obtained since 2011.
STANDING PORTFOLIO AND BREEAM IN-USE
DEVELOPMENT PROJECTS AND BREEAM
1 Pipeline deliveries.
Offi ces
Offi ces
Shopping centres
Shopping centres
2011
2012
20092010
2012
20132014
Tour O2
Very Good
Adenauer UR
headquarter
Excellent
Issy Guynemer
Excellent
Majunga
Excellent
H1 20131 H2 20131 H2 20141 H2 20141
Very Good
Good
Good Good
Very Good
Very Good
Very Good Very Good
Very Good Very Good Very Good Very Good
Very GoodVery GoodVery GoodVery GoodVery Good
Very Good
Excellent
Excellent
Excellent
OF TOTAL GLA
BREEAM IN-USE
CERTIFIED (RETAIL)35%
Very GoodVery Good Excellent

Carbon tracking to manage climate change mitigation
The Group achieved a 58% cut in CO2 emissions, cumulated like-for-like since 2006
(scope of calculation restricted to emissions related to the energy consumptions of
managed assets).
To enhance the Group’s carbon strategy, carbon tracking offers a better mode of
measurement for the entire scope of emissions and their associated responsibility. In
2012, the Group’s full carbon footprint assessment was performed in order to establish
the relevant perimeter and scope breakdown for the real estate sector. Unibail-Rodamco’s
full carbon footprint includes: • Portfolio of assets (100% of managed shopping centres
and offi ces); • Group’s headquarter activities and employees (100% of headquarter
activities); • Development projects delivered during the year 2012.
SCOPE 2
SCOPE 3 MANAGED
SCOPE 3 RELATED
SCOPE 3 EXTENDED
Unibail-Rodamco operational control
Stakeholders responsability
excluded of the Group’s carbon footprint
SCOPE 1 1%
8%
19%
71%
ENERGY AND CARBON
CO2/VISIT
SINCE 2006
-58%
72 • 73
SCOPE 1
direct emissions from
on-site combustion (gas
and fuel consumptions) and
fugitive emissions (leaks of
refrigerant gas)
SCOPE 2
indirect emissions from
imported energy consumed
(electricity consumption in
common areas, common
heating and cooling
purchases through district
networks)
SCOPE 3
other indirect emissions
splited in 3 subdivisions:
SCOPE 3 MANAGED
part of the scope 3 related
to Unibail-Rodamco’s
operationnal control
SCOPE 3 RELATED
part of the scope 3
related to Stakeholders
responsibility
SCOPE 3 EXTENDED
part of the scope 3 excluded
from the Group’s carbon
footprint perimeter
GROUP’S CARBON
FOOTPRINT BREAKDOWN
To portray the Group’s business activities
in the most accurate manner, including the
interactions between the company and its
stakeholders, scope 3 has been defi ned with 3
subdivisions:
1. Scope 3 managed, Unibail-Rodamco’s
operational control.
2. Scope 3 related, Stakeholders’ responsibility.
3. Scope 3 extended, excluded from the
Group’s carbon footprint perimeter.

SUSTAINABLE DEVELOPMENT
Carbon zoom at Centrum Chodov shopping centre
15%Electricity consumption in common areas
13%Common heating and cooling purchases imported through a district network
Production, distribution, use, and disposal of products and services sold in the Group’s shopping centres
2%Energy-related activities not included in scope 1&2 emissions (extraction, production and transport of fuels, electricity, steam, heating and cooling): Upstream transportation and distribution of energy consumed by common parts
2%Waste management, treatment mode
43% Clients and visitor transportation
21% Tenants’ electricity consumption (production, transportation and distribution)
3%Site’s employees commuting (tenants ‘employees transportation)
SCOPE 1 SCOPE 2 SCOPE 3 MANAGED SCOPE 3 RELATED SCOPE 3 EXTENDED
0%Gas and fuel combustion on-site
1%Refrigerant gas leakages
The results of Unibail-Rodamco’s carbon footprint confi rms the relevancy of the
Group’s strategy since 2007:
• assets located in major cities with high connectivity
• continuous optimisation of energy consumption
• enhancement of footfall and occupancy rate (the intensity of use of assets)
• switch to low carbon emissive energies
• green lease roll-out
OPENING DATE
November 9,2005
-TOTAL GLA (m²)
58,500 m²-
NUMBER OF SHOPS
213-
NUMBER OF VISITS 2012 (million)
12.9
SCOPE 2
SCOPE 3 MANAGED
SCOPE 3 RELATED
SCOPE 3 EXTENDED
Unibail-Rodamco operational control
Stakeholders responsability
excluded of the Group’s carbon footprint
SCOPE 1
43%
21%
3%
2% 2%
13%
1%
0%
15%
72 • 73
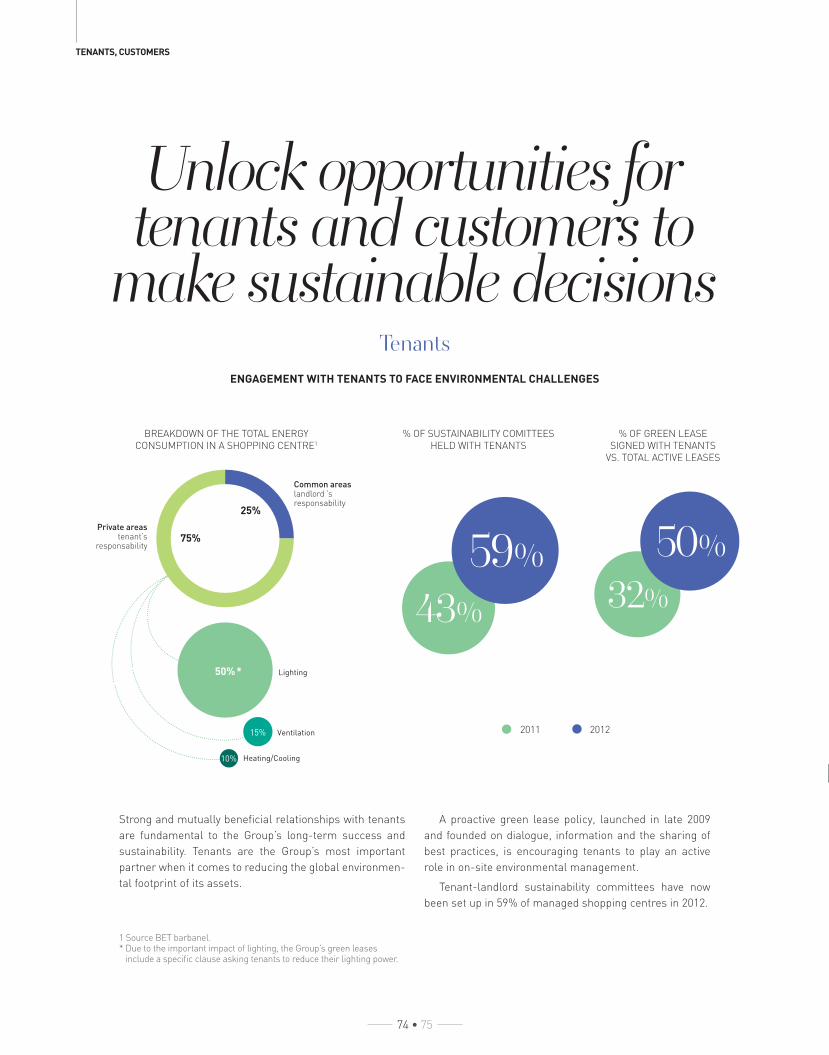
Unlock opportunities for tenants and customers to
make sustainable decisions
Strong and mutually benefi cial relationships with tenants
are fundamental to the Group’s long-term success and
sustainability. Tenants are the Group’s most important
partner when it comes to reducing the global environmen-
tal footprint of its assets.
A proactive green lease policy, launched in late 2009
and founded on dialogue, information and the sharing of
best practices, is encouraging tenants to play an active
role in on-site environmental management.
Tenant-landlord sustainability committees have now
been set up in 59% of managed shopping centres in 2012.
ENGAGEMENT WITH TENANTS TO FACE ENVIRONMENTAL CHALLENGES
Lighting
Ventilation
Heating/Cooling
BREAKDOWN OF THE TOTAL ENERGY
CONSUMPTION IN A SHOPPING CENTRE1
1 Source BET barbanel.* Due to the important impact of lighting, the Group’s green leases
include a specifi c clause asking tenants to reduce their lighting power.
Private areas tenant’s
responsability75%
Common areas landlord ’s responsability
TENANTS, CUSTOMERS
32%
% OF SUSTAINABILITY COMITTEES
HELD WITH TENANTS
43%
59% 50%
% OF GREEN LEASE
SIGNED WITH TENANTS
VS. TOTAL ACTIVE LEASES
2011 2012
50% *
15%
10%
Tenants
74 • 75
25%

SUSTAINABLE DEVELOPMENT
The quality of the customer experience is
central to the economic sustainability of
Unibail-Rodamco’s business as it attracts
visitors and encourages loyalty. It is the result
of intensive work in subjects as diverse as
leasing, maintenance for comfort, health and
safety, marketing and customer research.
The Group continuously improves the 4 Star
Welcome Attitude, its customer service
strategy for retail assets. Facebook sites
and websites for individual shopping centres
contribute to the Group’s ongoing dialogue
and loyalty with its customers.
FOOTFALL EVOLUTION
2012/2011
OF VISITORS TRAVELLED
BY SUSTAINABLE
TRANSPORT MODES
IN 2012
1.3%
57%
DIALOGUE FOR CUSTOMERS’ SATISFACTION/TRANSPORT
Customers
CUSTOMER SATISFACTION
Customer satisfaction surveys were
conducted in 57 assets in 2012. 95% of
customers surveyed were reported being
very or rather satisfi ed. Unibail-Rodamco
is committed to maintain the score above
8/10 for the managed retail portfolio.
Internal quality audits were used to
assess 301 services and comfort criteria.
These audits help to ensure that the
Group’s assets maintain their prime
position on the market.
27,068CUSTOMERS INTERVIEWED IN THE CUSTOMER SATISFACTION SURVEY
7.6/102012 AVERAGE SCORE ACROSS THE GROUP
TOP 5DOMAINS OBTAINING THE BEST SATISFACTION SCORES:
> CLEANLINESS OF THE MALL
AND PARKING
> SECURITY AND SAFETY
> MALL FACILITIES (SIGNAGE FOR
BETTER NAVIGATION)
> INTERIOR DESIGN
> WELCOMING STAFF
74 • 75
Tramway station at Lyon Confl uence, France.

Design and production: Aristophane
Photo credits: Thomas Laisné; Yves Forestier; Vincent Baillais; Takuji Shimmura; In mfi’s photobank; Sergio Flores; Armando Romero; Philipe Servant; Lars Clason; Miroslaw Pietruszynski; Laurent Juilland/ Contextes; Nicolas Gallon/ Contextes; Gregory Matter; JF Lange; Michel Claus; Mixmanstudio.net; L’autre image/ Saguez/ P. Chiambaretta; François CERIA (Agence FCERIA Architecte); L’autre image/ JP Viguier; Benoy/ L’autre image; Crochman & Brullman/ L’autre image; Bonjana Tatarska; Marthe Sobczak; Piotr Deszkiewicz; Nil Hoppenot; Yves Forestier; GOTAestudio; Angell Carbonell; Marco Soria; Jaroslaw Nogal; Susanne Hallmann; Nadine Bargad; Nils van Houts; Fabrice Rambert; AMC promotion; Marco Vellinga; Philipe Servant; Renaud Araud; images in Unibail-Rodamco’s image bank.
Credits

2012 Financial RepoRt
Solid results

I. Portfolio 2II. Business Review and 2012 Results 16III. Corporate sustainability 50IV. Consolidated fi nancial statements 114V. Legal information 178VI. Report of the Chairman of the Supervisory Board 224
Contents

CONSOLIDATED FINANCIAL STATEMENTS
CORPORATE SUSTAINABILITY
BUSINESS REVIEW AND 2012 RESULTS
PORTFOLIO
UNIBAIL-RODAMCO - FINANCIAL REPORT 2012
France: Shopping Centres 3France: Shopping Centres 4France: Convention-Exhibition 6France: Offi ces 7Spain: Shopping Centres 8Central Europe: Shopping Centres 9Central Europe: Offi ces 10Nordics: Shopping Centres 11Nordics: Offi ces 11Austria: Shopping Centres 12Austria: Offi ces 12Netherlands: Shopping Centres 13Netherlands: Offi ces 14
Portfolio
2 • 3

REPORT OF THE CHAIRMAN OF THE SUPERVISORY BOARD
LEGAL INFORMATION
FINANCIAL REPORT 2012 - UNIBAIL-RODAMCO 2 • 3
France:Shopping CentresPortfolio as at 31/12/2012
GL
A o
f th
e w
ho
le c
om
ple
x
(m² )
Ca
r p
ark
s
Ca
tch
me
nt
are
a(m
illi
on
s o
f p
eo
ple
)
Nu
mb
er
of
visit
s (
mil
lio
ns)
Yea
r o
f a
cqu
isit
ion
Co
nst
ruct
ion
(C
)R
efu
rbis
hm
en
t (R
) d
ate
GL
A o
f th
e p
rop
ert
y o
wn
ing
co
mp
an
ies (
m² )
% U
nib
ail
-Ro
da
mco
’s
sh
are
s
% o
f co
nso
lid
ati
on
Tota
l sp
ace
acc
ord
ing
to
co
nso
lid
ati
on
(m
² )
Shopping centres in the Paris Region
Les Quatre Temps (La Défense)Auchan, Castorama, C&A, 25 MSU,205 shops and a cinema
139,400 6,500(1) 6.8 45.7 1992/951999/2011
1981R 2006/08
134,700 53,3% 100% 134,700
Carré Sénart (Lieusaint)Carrefour, Apple, 1 shopping park, 15 MSU, 120 shops and a cinema
118,600 5,865 2.1 14.7 1994/99 2002C 2006/07
C 2012
94,600 100% 100% 94,600
Rosny 2 (Rosny-sous-Bois)Carrefour, Galeries Lafayette, FNAC, C&A, 19 MSU, 155 shops and a cinema
111,600 5,950 8.4 14.6 19942001/2010
1973R 1997C 2011
32,200 23,000
26%100%
26%100%
8,400 23,000
Parly 2 (Le Chesnay)Printemps, BHV, Simply Market, Habitat, Fnac, Decathlon, C&A, Toys’R’Us, Monoprix, 11 MSU, 157 shops and a cinema
107,200 5,050 6.0 13.0 20042012
1969/87R 2011
81,800 50% 50% 40,900
Vélizy 2 (Vélizy-Villacoublay)Auchan, C&A, FNAC, Le Printempsand 12 MSU, 158 shops and a cinema
104,000 6,915 6.1 15.3 19942007
R 2005/07 66,100 100% 100% 66,100
Bay 1 Bay 2 (Torcy)Carrefour, Leroy Merlin, Conforama, Toys R Us6 MSU, 116 shops and a cinema
96,300 4,870 4.2 7.6 2010 2003/04 7,90021,000
100%100%
100%100%
7,90021,000
Le Forum des Halles (Paris 1er)FNAC, H&M, Go Sport, 13 MSU, 109 shops, 1 UGC Ciné Cité and 1 UGC Orient Express
64,000 951 6.7 39.2 19942010
1979/86R(2) 1996
64,000 65% 100% 64,000
Ulis 2 (Les Ulis)Carrefour, 8 MSU, 92 shops and a cinema
51,100 3,200(1) 2.5 6.2 1994 1973R 1998/99
22,400 100% 100% 22,400
So Ouest (Levallois-Perret)Leclerc, H&M, Marks & Spencer, 7 MSU, 86 shops
48,500 1,750(1) 8.5 2.2(3) 20062010
2012 48,500 100% 100% 48,500
Coté Seine (Argenteuil)Géant Casino, 7 MSU, 48 shops
28,900 1,350(1) 6.3 5.8 2003 2002 14,500 100% 100% 14,500
Bobigny 2 (Bobigny)Auchan, 53 shops o/w 6 MSU and a cinema
26,900 1,100 4.0 n.a. 2004 1974 7,900 100% 100% 7,900
CNIT (La Défense)FNAC, Decathlon, Monoprix, Habitat, 24 shops and a restaurant area
25,800 4,800(4) 6.8 17.8 1999 1989R 2009
25,800 100% 100% 25,800
L’Usine Mode et Maison (Vélizy-Villacoublay)1 MSU, 112 shops (Gerard Darel, Ventilo, Quicksilver...)
20,600 1,270 14.3 1.2 2005 1986R 2011
20,600 100% 100% 20,600
Boutiques Palais des Congrès (Paris 17th)Galerie Gourmande, Les Editions du Palais, Palais Maillot, 4 MSU, 56 shops and a cinema
18,900 1,663(1) 6.7 8.7 2008 18,900 50% 100% 18,900
Galerie Gaîté (Paris 14th)Darty, 3 MSU, 14 shops
14,300 1,992(5) 6.6 3.3 1998 1976R 2000/01
13,000 100% 100% 13,000
Carrousel du Louvre (Paris 1st)Apple, 1 MSU, 34 shops and a food court
11,500 700(1),(6) 6.7 16.7 1999 1993/R 2009
11,500 100% 100% 11,500
Sub-total Shopping centres in the Paris Region 643,700
Catchment area : less than 30 minutes from the Shopping Centre (except for factory outlet with 90 minutes).MSU : Medium Size Units.(1) Car parks not owned by Unibail-Rodamco.(2) Forum des Halles currently under renovation.(3) Footfall since the opening (October 18).(4) Car parks are owned by CNIT C&E and are shared between Cnit C&E, Cnit Offi ces and Cnit Retail.(5) Gaîté Montparnasse car parks are shared between Pullman hotel, Gaîté shopping gallery and offi ce.(6) The Carrousel du Louvre car park is shared between the shopping centre and the exhibition spaces.
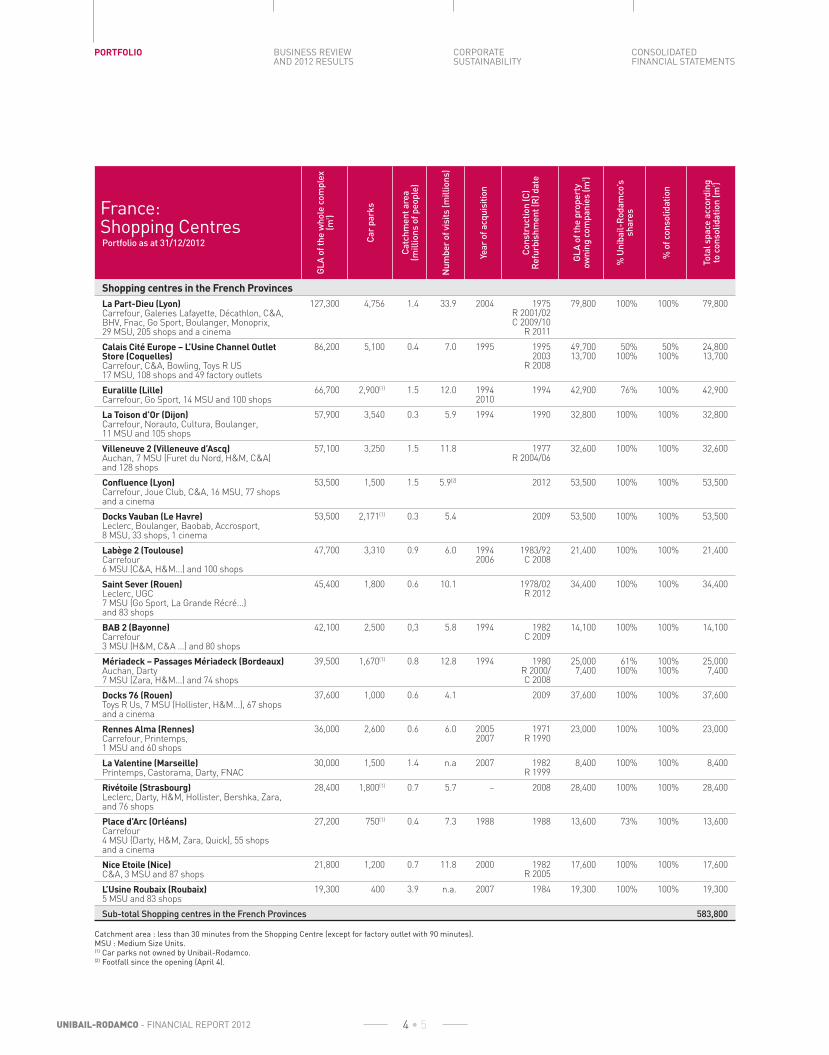
CONSOLIDATED FINANCIAL STATEMENTS
CORPORATE SUSTAINABILITY
BUSINESS REVIEW AND 2012 RESULTS
PORTFOLIO
UNIBAIL-RODAMCO - FINANCIAL REPORT 2012 4 • 5
France:Shopping CentresPortfolio as at 31/12/2012
GL
A o
f th
e w
ho
le c
om
ple
x
(m² )
Ca
r p
ark
s
Ca
tch
me
nt
are
a(m
illi
on
s o
f p
eo
ple
)
Nu
mb
er
of
visit
s (
mil
lio
ns)
Yea
r o
f a
cqu
isit
ion
Co
nst
ruct
ion
(C
)R
efu
rbis
hm
en
t (R
) d
ate
GL
A o
f th
e p
rop
ert
y o
wn
ing
co
mp
an
ies (
m² )
% U
nib
ail
-Ro
da
mco
’s
sh
are
s
% o
f co
nso
lid
ati
on
Tota
l sp
ace
acc
ord
ing
to
co
nso
lid
ati
on
(m
² )
Shopping centres in the French Provinces
La Part-Dieu (Lyon)Carrefour, Galeries Lafayette, Décathlon, C&A, BHV, Fnac, Go Sport, Boulanger, Monoprix, 29 MSU, 205 shops and a cinema
127,300 4,756 1.4 33.9 2004 1975R 2001/02C 2009/10
R 2011
79,800 100% 100% 79,800
Calais Cité Europe – L’Usine Channel Outlet Store (Coquelles)Carrefour, C&A, Bowling, Toys R US17 MSU, 108 shops and 49 factory outlets
86,200 5,100 0.4 7.0 1995 19952003
R 2008
49,70013,700
50%100%
50%100%
24,80013,700
Euralille (Lille)Carrefour, Go Sport, 14 MSU and 100 shops
66,700 2,900(1) 1.5 12.0 19942010
1994 42,900 76% 100% 42,900
La Toison d’Or (Dijon)Carrefour, Norauto, Cultura, Boulanger, 11 MSU and 105 shops
57,900 3,540 0.3 5.9 1994 1990 32,800 100% 100% 32,800
Villeneuve 2 (Villeneuve d’Ascq)Auchan, 7 MSU (Furet du Nord, H&M, C&A) and 128 shops
57,100 3,250 1.5 11.8 1977R 2004/06
32,600 100% 100% 32,600
Confl uence (Lyon)Carrefour, Joue Club, C&A, 16 MSU, 77 shops and a cinema
53,500 1,500 1.5 5.9(2) 2012 53,500 100% 100% 53,500
Docks Vauban (Le Havre)Leclerc, Boulanger, Baobab, Accrosport, 8 MSU, 33 shops, 1 cinema
53,500 2,171(1) 0.3 5.4 2009 53,500 100% 100% 53,500
Labège 2 (Toulouse)Carrefour6 MSU (C&A, H&M...) and 100 shops
47,700 3,310 0.9 6.0 19942006
1983/92C 2008
21,400 100% 100% 21,400
Saint Sever (Rouen)Leclerc, UGC7 MSU (Go Sport, La Grande Récré...) and 83 shops
45,400 1,800 0.6 10.1 1978/02R 2012
34,400 100% 100% 34,400
BAB 2 (Bayonne)Carrefour3 MSU (H&M, C&A …) and 80 shops
42,100 2,500 0,3 5.8 1994 1982C 2009
14,100 100% 100% 14,100
Mériadeck – Passages Mériadeck (Bordeaux)Auchan, Darty7 MSU (Zara, H&M...) and 74 shops
39,500 1,670(1) 0.8 12.8 1994 1980R 2000/C 2008
25,0007,400
61%100%
100%100%
25,0007,400
Docks 76 (Rouen)Toys R Us, 7 MSU (Hollister, H&M...), 67 shops and a cinema
37,600 1,000 0.6 4.1 2009 37,600 100% 100% 37,600
Rennes Alma (Rennes)Carrefour, Printemps,1 MSU and 60 shops
36,000 2,600 0.6 6.0 20052007
1971R 1990
23,000 100% 100% 23,000
La Valentine (Marseille)Printemps, Castorama, Darty, FNAC
30,000 1,500 1.4 n.a 2007 1982R 1999
8,400 100% 100% 8,400
Rivétoile (Strasbourg)Leclerc, Darty, H&M, Hollister, Bershka, Zara, and 76 shops
28,400 1,800(1) 0.7 5.7 – 2008 28,400 100% 100% 28,400
Place d’Arc (Orléans)Carrefour4 MSU (Darty, H&M, Zara, Quick), 55 shops and a cinema
27,200 750(1) 0.4 7.3 1988 1988 13,600 73% 100% 13,600
Nice Etoile (Nice)C&A, 3 MSU and 87 shops
21,800 1,200 0.7 11.8 2000 1982R 2005
17,600 100% 100% 17,600
L’Usine Roubaix (Roubaix)5 MSU and 83 shops
19,300 400 3.9 n.a. 2007 1984 19,300 100% 100% 19,300
Sub-total Shopping centres in the French Provinces 583,800
Catchment area : less than 30 minutes from the Shopping Centre (except for factory outlet with 90 minutes).MSU : Medium Size Units.(1) Car parks not owned by Unibail-Rodamco.(2) Footfall since the opening (April 4).

REPORT OF THE CHAIRMAN OF THE SUPERVISORY BOARD
LEGAL INFORMATION
FINANCIAL REPORT 2012 - UNIBAIL-RODAMCO 4 • 5
France:Shopping CentresPortfolio as at 31/12/2012
GL
A o
f th
e w
ho
le c
om
ple
x
(m² )
Ca
r p
ark
s
Ca
tch
me
nt
are
a(m
illi
on
s o
f p
eo
ple
)
Nu
mb
er
of
visit
s (
mil
lio
ns)
Yea
r o
f a
cqu
isit
ion
Co
nst
ruct
ion
(C
)R
efu
rbis
hm
en
t (R
) d
ate
GL
A o
f th
e p
rop
ert
y o
wn
ing
co
mp
an
ies (
m² )
% U
nib
ail
-Ro
da
mco
’s
sh
are
s
% o
f co
nso
lid
ati
on
Tota
l sp
ace
acc
ord
ing
to
co
nso
lid
ati
on
(m
² )
Other holdings
Bel Est (Bagnolet)Auchan61 shops
48,800 2,000 3.8 n.a. 2010 1992 5,500 35.2% 35.2% 2,300
Aquaboulevard (Paris)Decathlon, Water park, Fitness center, Gaumont CinemaEvent areas, 1 «food court», 3 shops
38,400 1,000 n.a. n.a. 20062008
1990 32,400 100% 100% 32,400
Maine Montparnasse (Paris)1 shop Naf Naf
35,500 1,900(1) n.a. n.a. 2007 200 100% 100% 200
VillabéCarrefour 6 MSU, 56 shops
34,100 2,900 1.3 n.a. 2010 1992 5,6002,300
15%100%
15% 8002,300
Boissy 2 (Boissy)Casino, 32 shops
23,000 900(1) 0.2 n.a. 2004 1976 700 100% 100% 700
23, boulevard de Courcelles (Paris 8th)Renault car dealer
12,900 n.a. n.a. 1999 R 1989 12,900 100% 100% 12,900
40 ter, avenue de Suffren (Paris 15th)Volkswagen car dealer
11,200 n.a. n.a. 1999 R 1982 11,200 100% 100% 11,200
Grigny 2 (Grigny)Casino, 1 MSU, 18 shops
10,700 1,200 n.a. n.a. 2004 1973R 2000
1,600 100% 100% 1,600
Go Sport (Marseille Grand Littoral,Evreux, Saintes, Valentine)
8,900 n.a. n.a. 2007 8,900 100% 100% 8,900
PlaisirBoulanger
5,200 100 n.a. n.a. 2001 5,200 100% 100% 5,200
Sub-total Other holdings 78,500
Total (according to the scope of consolidation) 1,306,000
Catchment area : less than 30 minutes from the Shopping Centre (except for factory outlet with 90 minutes).MSU : Medium Size Units.(1) Car parks not owned by Unibail-Rodamco.

CONSOLIDATED FINANCIAL STATEMENTS
CORPORATE SUSTAINABILITY
BUSINESS REVIEW AND 2012 RESULTS
PORTFOLIO
UNIBAIL-RODAMCO - FINANCIAL REPORT 2012 6 • 7
France:Convention-ExhibitionPortfolio as at 31/12/2012 Ye
ar
of
acq
uis
itio
n
Co
nst
ruct
ion
(C
)R
efu
rbis
hm
en
t (R
) d
ate
Ca
r p
ark
s
Tota
l fl
oo
r sp
ace
of
the
a
sse
t (m
² )
% U
nib
ail
-Ro
da
mco
’s
sh
are
% o
f co
nso
lid
ati
on
Tota
l sp
ace
acc
ord
ing
to
co
nso
lid
ati
on
(m
² )
De
scr
ipti
on
PARIS AND REGION PARISIENNE
Property and operation
Paris Porte de Versailles (Paris 15th)
2000 Hall 5 in 2003
5,500 226,000 50% 100% 226,000 8 exhibition halls (from 5,000 to 70,000 m2), 32 conference rooms of which 3 auditoriums
Paris Nord Villepinte 2008 Hall 7 in 2010
13,000 245,000 50% 100% 245,000 9 exhibitions halls, 45 conference rooms of which 3 auditoriums
Cnit (La Défense) 1999 R 2007 4,800(1) 24,000 100% 100% 24,000 Exhibition and convention space
Espace Grande Arche (La Défense)
2001 R 2003 5,000 50% 100% 5,000 Flexible space covering 5,000 m2
Espace Champerret (Paris 17th)
1989/1995 R 2008 1,100(2) 9,100 50% 100% 9,100 Exhibition space (Trade shows)
Le Palais des Congrès de Paris
2008 1993 1,500(2) 32,000 50% 100% 32,000 92 conferences rooms of which 4 auditoriums
Carrousel du Louvre – Expos (Paris 1st)
1999 1993 4,300(2) 7,100 100% 100% 7,100 Exhibition space (Trade and fashion shows, corporate events)
Palais des Sports – (Paris 15th)
2002 1960 n.a. 50% 50% n.a. Flexible entertainment or convention room from 2,000 to 4,200 seats
Hilton Cnit (La Défense)
1999 R 2008 10,700 100% 100% 10,700 Hotel
Pullman Paris-Montparnasse Hotel (Paris 14th)
1998 1974 1,992(3) 57,400 100% 100% 57,400 Hotel, conference centre and private parking lot(2)
Operation
Paris Le Bourget 2008 1952/2005 12,000(2) 80,000 50% 100% 0 5 exhibitions halls, 7 conferences rooms of which 1 auditorium
Palais des Congrès de Versailles
2008 1964 4,300(2) 3,200 45% 100% 0 11 conferences rooms of which 1 auditorium
Palais des Congrès d’Issy-les-Moulineaux
2009 R 2007 3,000 48% 100% 0 14 conferences rooms of which 1 auditorium
Total (according to the scope of consolidation) 616,300
(1) Car parks are owned by CNIT C&E and shared between CNIT C&E, CNIT Offi ces and CNIT retail.(2) This parking lot does not belong to the Group.(3) Car parks not owned by the Group.

REPORT OF THE CHAIRMAN OF THE SUPERVISORY BOARD
LEGAL INFORMATION
FINANCIAL REPORT 2012 - UNIBAIL-RODAMCO 6 • 7
France:Offi ces*
Portfolio as at 31/12/2012
Yea
r o
f a
cqu
isit
ion
Co
nst
ruct
ion
(C
)R
efu
rbis
hm
en
t (R
) d
ate
Tota
l fl
oo
r sp
ace
(m
² )
Ca
r p
ark
s
% o
wn
ers
hip
an
d %
co
nso
lid
ati
on
Tota
l fl
oo
r sp
ace
a
cco
rdin
g t
o c
on
so
lid
ati
on
(m
² )
Ma
in t
en
an
ts (
in t
erm
s o
f re
nta
l in
com
e)
Paris CBD, Paris and western Paris outskirts
Paris 1st
34-36, rue du Louvre 1976 R 2012 4,019 – 100% 4,019 Caisse d’Épargne, Louis Vuitton Malettier
Paris 8th
Capital 8 (Monceau/Murat) 2001 R 2006 45,280 373 100% 45,280 Gaz de France, Eurazeo, Dechert, SAP, Marionnaud, Arsene, Nixon
Paris 15th
Le Sextant, 2 bis-2 ter, rue Louis-Armand
2009 1998 13,404 147 100% 13,404 Securitas, Direct Énergie, La Poste
Paris 16th
7, place du Chancelier Adenauer 1999 R 2008 12,066 150 100% 12,066 Unibail-Rodamco’s headquarters
Sub-total “Paris CBD” 74,769 74,769
92 Paris-La Défense
Espace 21 (Les Villages) 1999 R 2006 42,092 1,541 100% 42,092 Genegis, Concorde Management Company, Louvre Hôtels
Tour Ariane 1999 R 2008(1) 63,489 212 100% 63,489 Marsh, British Telecom France, Société Générale, Completel, Ciments Français, Arkea, Mercer, Network Appliance, Regus, Vanco, Air Liquide, IMS Health
Cnit (Offi ces) 1999 R 2008 37,089 4,800(2) 100% 37,089 Sncf, Essec, Apec, Select TT
Michelet-Galilée 1999 R 2010 32,662 127 100% 32,662 Alstom
70-80, avenue Wilson 1999 R 2012 23,069 543 100% 23,069 Comexposium, Bouchara Recordati, Gefco, Cofely
Sub-total “Paris-La Défense” 198,401 198,401
92 Neuilly-sur-Seine
2, rue Ancelle 1996 R 2000- R2013(3)
16,041 173 100% 16,041
92 Issy-les-Moulineaux
34-38, rue Guynemer “Nouvel Air” 1999 R 2012 47,048 861 100% 47,048 Carlson, Aldata, Accor
Sub-total “Neuilly-Levallois-Issy” 63,089 63,089
Other offi ce buildings in Paris (Paris 14th)
Gaîté-Montparnasse (Offi ces) 1998 C 1974 9,865 1,992(4) 100% 9,865 Le Point, CRAF
Other offi ce buildings in Western Paris region (Nanterre)
29, rue du Port 2010 C 1989 10,342 94 100% 10,342 Xylem France
Sub-total of other offi ce assets in Paris 20,207 20,207
Sub-total Paris CBD, Paris and Western Paris outskirts
356,466 356,466
Outside Paris
Lyon
Tour Crédit Lyonnais 1996/ 2007
C 1977 12,948 60 100% 12,948 France Telecom, DHL, CAF de Lyon
Sub-total Outside Paris 12,948 12,948
Total (according to the scope of consolidation) 369,414 369,414
(*) And related : shops in offi ce buildings, light-industrial space, appartments.(1) Refurbishment from 2004 to 2008.(2) Car parks are owned by CNIT C&E and shared between CNIT C&E, CNIT Offi ces and CNIT retail.(3) Currently under refurbishment.(4) Car parks are shared between Meridien hotel, Gaîté shopping gallery and offi ce.

CONSOLIDATED FINANCIAL STATEMENTS
CORPORATE SUSTAINABILITY
BUSINESS REVIEW AND 2012 RESULTS
PORTFOLIO
UNIBAIL-RODAMCO - FINANCIAL REPORT 2012 8 • 9
Spain:Shopping CentresPortfolio as at 31/12/2012
GL
A o
f th
e w
ho
le
com
ple
x (
m² )
Ca
r p
ark
s
Ca
tch
me
nt
are
a(m
illi
on
s o
f p
eo
ple
)
Nu
mb
er
of
visit
s
(mil
lio
ns)
Yea
r o
f a
cqu
isit
ion
Co
nst
ruct
ion
(C
)R
efu
rbis
hm
en
t (R
) d
ate
GL
A o
f th
e p
rop
ert
y o
wn
ing
co
mp
an
ies (
m² )
% U
nib
ail
-Ro
da
mco
’s
sh
are
% o
f co
nso
lid
ati
on
Tota
l sp
ace
acc
ord
ing
to
co
nso
lid
ati
on
(m
² )
Shopping Centres
Parquesur (Madrid)216 units
151,200 5,800 5.7 18.4 1994 C 1989/ C 2005
94,700 100% 100% 94,700
Bonaire (Valencia)163 units Retail Park
135,000 5,700 1.8 9.8 2001 C 2001/ R 2003/ R 2012
48,200 100% 100% 48,200
La Maquinista (Barcelona)216 units and a hypermarket
94,500 5,000 4.0 14.8 2008 C 2000/ C 2010/ R 2012
79,100 51.1% 100% 79,100
La Vaguada “Madrid 2” (Madrid)241 units
85,500 3,600 5.9 23.5 1995 C 1983/ R 2003
21,400 100% 100% 21,400
El Faro (Badajoz)98 units
66,300 2,602 0.6 2.0(1) 2012 C 2012 43,300 100% 100% 43,300
Bahía Sur (Cádiz)96 units
59,000 2,737 0.7 7.4 1994 C 1992/ R 2005
24,400 100% 100% 24,400
Las Glorias (Barcelona)170 units
56,300 2,804(2) 4.5 11.2 1998 C 1995/ R 2001
30,300 100% 100% 30,300
Splau (Barcelona)Supermarket, cinema complex and 147 stores
55,100 2,800 3.4 9.3 2011 C 2010 55,000 100% 100% 55,000
Barnasud (Barcelona)79 units Retail Park
43,700 2,450 3.5 4.1 2001 C 1995/ R 2002/ R 2006
33,400 100% 100% 33,400
Los Arcos (Seville)108 units
43,400 1,800 1.5 5.9 1995 C 1992/ R 2002
17,000 100% 100% 17,000
Equinoccio (Madrid)52 units Retail Park
36,800 1,408 5.3 3.3 1998 C 1998/ R 2000/ R 2008/ C 2012
35,400 100% 100% 35,400
Garbera (San Sebastian)83 units
36,000 2,784 0.6 4.8 2002 C 1997/ R 2002
25,600 100% 100% 25,600
Vallsur (Valladolid)95 units
35,000 2,250 0.4 6.1 2002 C 1998/R 2004/C 2011
34,500 100% 100% 34,500
Albacenter (Albecete)61 units
28,000 1,223 0.2 4.0 2002 C 1996/R 2002/R 2005/R 2008/R 2009
15,200 100% 100% 15,200
Habaneras (Torrevieja)67 units
24,100 850 0.4 4.5 2008 C 2005 24,100 52.8% 100% 24,100
Dos Hermanas FOC (Seville)61 units
16,000 1,200 1.2 1.9 2002 C 1999/R 2000
16,000 100% 100% 16,000
Sub-total Shopping centres in Spain 597,600
Other holdings
Sant Cugat (Barcelona)One hypermarket
42,500 2,700 3.8 15.0 2012 C 1996/ R 2002
22,400 100% 100% 22,400
Sub-total Other holdings 22,400
Total (according to the scope of consolidation) 620,000
Catchment area: less than 30 minutes from the Shopping Centre.(1) Footfall since the opening (September 13).(2) Car parks partly owned by Unibail-Rodamco.

REPORT OF THE CHAIRMAN OF THE SUPERVISORY BOARD
LEGAL INFORMATION
FINANCIAL REPORT 2012 - UNIBAIL-RODAMCO 8 • 9
Central Europe:Shopping CentresPortfolio as at 31/12/2012
GL
A o
f th
e w
ho
le c
om
ple
x
(m² )
Ca
r p
ark
s
Ca
tch
me
nt
are
a(m
illi
on
s o
f p
eo
ple
)
Nu
mb
er
of
visit
s (
mil
lio
ns)
Yea
r o
f a
cqu
isit
ion
Co
nst
ruct
ion
(C
)R
efu
rbis
hm
en
t (R
) d
ate
GL
A o
f th
e p
rop
ert
y o
wn
ing
co
mp
an
ies (
m² )
% U
nib
ail
-Ro
da
mco
’s
sh
are
s
% o
f co
nso
lid
ati
on
Tota
l sp
ace
acc
ord
ing
to
co
nso
lid
ati
on
(m
² )
Czech Republic
Centrum Chodov (Prague)207 units
58,500 2,400(1) 1.4 12.9 2005 2005 58,500 100% 100% 58,500
Centrum Cerny Most (Prague)77 units and a cinema complex
51,800 1,988 1.6 7.8 2000 1997 51,800 100% 100% 51,800
Centrum Pankrac (Prague)120 units
40,300 1,100 1.2 11.3 2005 2008 40,300 75% 75% 30,300
Sub-total Shopping centres in Czech Republic 140,600
Poland
Arkadia (Warsaw)236 units and a cinema complex
111,900 4,300 1.7 21.2 2010 2004 73,700 100% 100% 73,700
Zlote Tarasy (Warsaw)(2)
207 units and a cinema complex66,200 1,600 1.9 20.6 2007/
20122007 66,200 76,9% E.M.(2) n.a.
Galeria Mokotow (Warsaw)242 units and a cinema complex
59,500 2,600 1.6 12.8 2003/ 2011
C 2000/C 2002/C 2006/C 2012/
59,500 100% 100% 59,500
Wilenska (Warsaw)98 units
40,000 1,253 1.8 16.4 2010 2002 18,300 100% 100% 18,300
Sub-total Shopping centres in Poland 151,500
Hungary
Europark (Budapest)71 units
25,100 950 0.8 7.0 1999 1997 25,100 100% 100% 25,100
Sub-total Shopping centres in Hungary 25,100
Germany
Ring-Center 1 (Berlin)62 retail units and a cinema complex
20,600 1,000(3) 1.3 5.3 1996 1997 20,600 66.7% 66.7% 13,700
Ruhr-Park (Bochum)(2)
108 retail units110,200 4,750 3.5 n.a. 2012 C 1964/
R 2012101,500 50.0% E.M.(2) n.a.
Paunsdorf Center (Leipzig)(2)
180 retail units, offi ces109,500 7,300 0.7 n. a. 2012 C 1994/
R 2012109,500 23.3% E.M.(2) n.a.
Gropius Passagen (Berlin)(2)
180 retail units, offi ces, cinema93,900 2,100 2.7 13.5 2012 C 1969/
200293,900 9.3% E.M.(2) n.a.
Hofe am Brühl (Leipzig)(2)
143 retail units55,700 820 0.7 4.1(*) 2012 C 2012 55,700 46.5% E.M.(2) n.a.
Gera Arcaden (Gera)(2)
85 retail units, offi ces38,900 1,309 0.2 6.1(**) 2012 C 1998/
R 200938,900 46.5% E.M.(2) n.a.
Pasing Arcaden (Munich)(2)
94 retail units, offi ces, appartment, leisure32,200 653 1.8 6.5 2012 C 2011 32,200 46.5% E.M.(2) n.a.
Sub-total Shopping centres in Germany 13,700
Total (according to the scope of consolidation) 330,900
(*) Since opening in September 2012.(**) Since February 2012.Catchment area: less than 30 minutes from the Shopping Centre.(1) Car parks partly owned by Unibail-Rodamco.(2) Consolidated under Equity Method.(3) Car parks not owned by Unibail-Rodamco.
Total shopping centres space including GLA of assets currently under equity method at UR’s shares is 525,700 m².

CONSOLIDATED FINANCIAL STATEMENTS
CORPORATE SUSTAINABILITY
BUSINESS REVIEW AND 2012 RESULTS
PORTFOLIO
UNIBAIL-RODAMCO - FINANCIAL REPORT 2012 10 • 11
Central Europe:Offi cesPortfolio as at 31/12/2012
GL
A o
f th
e w
ho
le c
om
ple
x
(m² )
Ca
r p
ark
s
Ca
tch
me
nt
are
a(m
illi
on
s o
f p
eo
ple
)
Nu
mb
er
of
visit
s (
mil
lio
ns)
Yea
r o
f a
cqu
isit
ion
Co
nst
ruct
ion
(C
)R
efu
rbis
hm
en
t (R
) d
ate
GL
A o
f th
e p
rop
ert
y o
wn
ing
co
mp
an
ies (
m²)
% U
nib
ail
-Ro
da
mco
’s
sh
are
s
% o
f co
nso
lid
ati
on
Tota
l sp
ace
acc
ord
ing
to
co
nso
lid
ati
on
(m
² )
Zlote Tarasy Lumen (Warsaw)(1) 23,800 – n.a. n.a. 2007/2012 2007 23,800 76.9% E.M.(1) n.a.
Zlote Tarasy Skylight (Warsaw)(1) 21,700 – n.a. n.a. 2012 2007 21,700 76.9% E.M.(1) n.a.
Wilenska Offi ces (Warsaw) 13,400 – n.a. n.a. 2010 2002 4,800 100% 100% 4,800
Total (according to the scope of consolidation) 4,800
(1) Consolidated under Equity Method.
Total Offi ce space including GLA of assets currently under equity method at UR’s shares is 39 800 m².

REPORT OF THE CHAIRMAN OF THE SUPERVISORY BOARD
LEGAL INFORMATION
FINANCIAL REPORT 2012 - UNIBAIL-RODAMCO 10 • 11
Nordics:Shopping CentresPortfolio as at 31/12/2012
GL
A o
f th
e w
ho
le
com
ple
x (
m² )
Ca
r p
ark
s
Ca
tch
me
nt
are
a(m
illi
on
s o
f p
eo
ple
)
Nu
mb
er
of
visit
s
(mil
lio
ns)
Yea
r o
f a
cqu
isit
ion
Co
nst
ruct
ion
/ E
xte
nsio
n
da
te
GL
A o
f th
e p
rop
ert
yo
wn
ing
co
mp
an
ies (
m²)
% U
nib
ail
-Ro
da
mco
’s
sh
are
% o
f co
nso
lid
ati
on
Tota
l sp
ace
acc
ord
ing
to
co
nso
lid
ati
on
(m
²)
Sweden
Täby Centrum (Greater Stockholm170 units and a cinema complex)
60,800 2,400 1.3 10.2 1997 1968/19691975/1992
60,800 100% 100% 60,800
Forum Nacka (Greater Stockholm)150 units
54,200 1,900 1.6 6.4 1996 1990/1997/ 2008
54,200 100% 100% 54,200
Solna Centrum (Greater Stockholm)124 units
48,500 1,265 1.8 6.7 1985 1962/1965/ 1992
48,500 100% 100% 48,500
Eurostop Arlandastad (Greater Stockholm)30 units
30,300 1,600 1.1 1.7 1996 1992 30,300 100% 100% 30,300
Nova Lund (1, 2 & 3) (Lund)73 units
26,000 1,483 0.6 2.6 2002/2005
2002/2006 26,000 100% 100% 26,000
Arninge Centrum (Greater Stockholm)25 units
20,200 500 1.3 3.1 2001 1983/1990 20,200 100% 100% 20,200
Eurostop Örebro (Örebro)7 units
15,500 900 0.2 3.3 1996 1991/1996/ 2007
15,500 100% 100% 15,500
Sub-total Shopping centre in Sweden 255,500
Denmark
Fisketorvet (Copenhagen)122 shops, a cinema complex and a gym
59,900 1,600 1.6 6.8 2000 2000 59,900 100% 100% 59,900
Sub-total Shopping centre in Denmark 59,900
Finland
Jumbo (Helsinki)122 units
85,100 4,600 1.2 10.8 2005 1999/2005 85,100 35% 35% 29,800
Sub-total Shopping centre in Finland 29,800
Total (according to the scope of consolidation) 345,200
Catchment area: less than 30 minutes from the Shopping Centre.
Nordics:Offi cesPortfolio as at 31/12/2012
GL
A o
f th
e w
ho
le
com
ple
x (
m² )
Ca
r p
ark
s
Ca
tch
me
nt
are
a
(mil
lio
ns o
f p
eo
ple
)
Nu
mb
er
of
visit
s
(mil
lio
ns)
Yea
r o
f a
cqu
isit
ion
Co
nst
ruct
ion
/Ex
ten
sio
n
da
te
GL
A o
f th
e p
rop
ert
yo
wn
ing
co
mp
an
ies (
m²)
% U
nib
ail
-Ro
da
mco
’s
sh
are
s
% o
f co
nso
lid
ati
on
Tota
l sp
ace
acc
ord
ing
to
co
nso
lid
ati
on
(m
²)
Sweden
Solna Centrum (Greater Stockholm)75 offi ce units, 108 apartments
29,200 n.a. n.a. n.a. 1985 1962/1965/ 1992
29,200 100% 100% 29,200
Täby Centrum (Greater Stockholm)49 offi ce units
18,000 n.a. n.a. n.a. 1997 1968/19691975/1992
18,000 100% 100% 18,000
Forum Nacka (Greater Stockholm)80 offi ce units
13,800 n.a. n.a. n.a. 1996 1990/1997/ 2008
13,800 100% 100% 13,800
Eurostop Arlandastad (Greater Stockholm)1 Hotel, 222 rooms
10,100 n.a. n.a. n.a. 1996 1992 10,100 100% 100% 10,100
Eurostop Örebro (Örebro)1 hotel, 111 rooms
4,700 n.a. n.a. n.a. 1996 1991/1996/ 2007
4,700 100% 100% 4,700
Total (according to the scope of consolidation) 75,800

CONSOLIDATED FINANCIAL STATEMENTS
CORPORATE SUSTAINABILITY
BUSINESS REVIEW AND 2012 RESULTS
PORTFOLIO
UNIBAIL-RODAMCO - FINANCIAL REPORT 2012 12 • 13
Austria:Shopping CentresPortfolio as at 31/12/2012
GL
A o
f th
e w
ho
le c
om
ple
x
(m² )
Ca
r p
ark
s
Ca
tch
me
nt
are
a(m
illi
on
s o
f p
eo
ple
)
Nu
mb
er
of
visit
s (
mil
lio
ns)
Yea
r o
f a
cqu
isit
ion
Co
nst
ruct
ion
(C
)R
efu
rbis
hm
en
t (R
) d
ate
GL
A o
f th
e p
rop
ert
y o
wn
ing
co
mp
an
ies (
m² )
% U
nib
ail
-Ro
da
mco
’s
sh
are
% o
f co
nso
lid
ati
on
Tota
l sp
ace
acc
ord
ing
to
co
nso
lid
ati
on
(m
² )
Austria
Shopping City Süd (SCS) (Vienna)309 units
190,300 10,000 2.7 23.2 2008 C 1976/2002/2012/ R 2013 (1)
129,500 100% 100% 129,500
Donauzentrum (Vienna)257 units, cinema complex and a hotel
122,800 3,000 1.9 18.1 2003 C 1975/ 2000/2006/2008/2010/
R 2012
122,800 100% 100% 122,800
Sub-total Shopping centres in Austria 252,300
Slovak Republic
Aupark (Bratislava)251 units and a cinema complex
57,500 1,657 0.8 12.5 2006/2011 C 2001/R 2013 52,700 100% 100% 52,700
Sub-total Shopping centres in Slovak Republic 52,700
Total (according to the scope of consolidation) 305,000
(1) Currently under refurbishment.Catchment area: less than 30 minutes from the Shopping Centre (except for SCS 60 min).
Austria:Offi cesPortfolio as at 31/12/2012
GL
A o
f th
e w
ho
le c
om
ple
x
(m² )
Ca
r p
ark
s
Ca
tch
me
nt
are
a(m
illi
on
s o
f p
eo
ple
)
Nu
mb
er
of
visit
s (
mil
lio
ns)
Yea
r o
f a
cqu
isit
ion
Co
nst
ruct
ion
(C
)R
efu
rbis
hm
en
t (R
) d
ate
GL
A o
f th
e p
rop
ert
y o
wn
ing
co
mp
an
ies (
m²)
% U
nib
ail
-Ro
da
mco
’s
sh
are
% o
f co
nso
lid
ati
on
Tota
l sp
ace
acc
ord
ing
to
co
nso
lid
ati
on
(m
² )
Donauzentrum (Vienna)2 buildings
10,900 n.a n.a. n.a. 2003 1975/1985 10,900 100% 100% 10,900
Shopping City Süd (SCS) (Vienna) 9,400 n.a n.a. n.a. 2008 1989 9,400 100% 100% 9,400
Total (according to the scope of consolidation) 20,300

REPORT OF THE CHAIRMAN OF THE SUPERVISORY BOARD
LEGAL INFORMATION
FINANCIAL REPORT 2012 - UNIBAIL-RODAMCO 12 • 13
Netherlands:Shopping CentresPortfolio as at 31/12/2012
GL
A o
f th
e w
ho
le c
om
ple
x
(m² )
Ca
r p
ark
s
Ca
tch
me
nt
are
a(m
illi
on
s o
f p
eo
ple
)
Nu
mb
er
of
visit
s(m
illi
on
s)
Yea
r o
f a
cqu
isit
ion
Co
nst
ruct
ion
(C
)R
efu
rbis
hm
en
t (R
) d
ate
GL
A o
f th
e p
rop
ert
y o
wn
ing
co
mp
an
ies (
m² )
% U
nib
ail
-Ro
da
mco
’s
sh
are
% o
f co
nso
lid
ati
on
Tota
l sp
ace
acc
ord
ing
to
co
nso
lid
ati
on
(m
² )
Shopping Centres
Stadshart Almere (Almere)Media Markt, Albert Heijn XL, Hema, V&D, H&M, Zara, C&A, Cinema Utopolis with 8 screens, 104 shops, 19 MSU
89,500 1,807(1) 0.6 10.3 2002 C 2002/R 2008
85,100 100% 100% 85,100
Stadshart Amstelveen (Amstelveen)De Bijenkorf, H&M, Albert Heijn, Zara120 shops, 17 MSU
81,300 2,775 1.7 9.6 2005 C 1960/R 1998
51,900 100% 100% 51,900
Stadshart Zoetermeer (Zoetermeer)Albert Heijn XL, H&M, C&A, Hema, Media Markt 81 shops, 16 MSU
75,500 3,340(2) 1.9 8.9 1983 C 1983/R 2005
50,700 100% 100% 50,700
Leidsenhage (Leidschendam)Albert Heijn, H&M, Jumbo, Kruidvat74 shops, 6 MSU
74,600 3,000(2) 2.1 n.a. 1990 C 1971/R 2000
28,000 100% 100% 28,000
Vier Meren/Dik Tromplein (Hoofddorp)Albert Heijn XL, Saturn, C&A, V&D40 shops, 10 MSU
74,000 1,900(2) 1.6 6.1 2004 C 2004 31,600 100% 100% 31,600
Kerkstraat (Hilversum)1 unit: V&D
12,200 72 n.a. n.a. 1993 n.a. 11,500 100% 100% 11,500
In den Vijfhoek (Oldenzaal)32 shops and 3 MSU (Albert Heijn)
8,100 340(1) n.a. n.a. 1980 C 1980 7,700 100% 100% 7,700
Zoetelaarpassage (Almere)17 shops and 3 MSU (Lidl)
4,900 – n.a. n.a. 1983 C 1983 4,900 100% 100% 4,900
Rotterdam Plaza (Rotterdam)18 units and 2 MSU
3,800 487 n.a. n.a. 1992 R 2012 3,800 100% 100% 3,800
K.Doormanstraat/J. Banckertsplaats (Rotterdam)3 shops
2,700 n.a. n.a. n.a. 1996 C 1957 900 100% 100% 900
Carleijspassage 10 (Venlo)1 shop and 2 MSU
1,900 n.a. n.a. n.a. 1993 C 1951 1,900 100% 100% 1,900
Coolsingel (Rotterdam)7 shops and 1 MSU
1,600 n.a. n.a. n.a. 1961 C 1957 1,600 100% 100% 1,600
De Els (Waalwijk)11 shops
14,500 500(1) n.a. n.a. 1990 C 1975/R 1990
1,200 100% 100% 1,200
Oosterdijk (Sneek)1 shop and 1 MSU
1,500 n.a. n.a. n.a. 1988 n.a. 900 100% 100% 900
Pieter Lastmanweg 2-6 (Amstelveen)3 shops
78,200 n.a. n.a. n.a. n.a. n.a. 200 100% 100% 200
Total (according to the scope of consolidation) 281,900
Catchment area: less than 30 minutes from the Shopping Centre.(1) Car parks not owned by Unibail-Rodamco.(2) Car parks partly owned by Unibail-Rodamco.

CONSOLIDATED FINANCIAL STATEMENTS
CORPORATE SUSTAINABILITY
BUSINESS REVIEW AND 2012 RESULTS
PORTFOLIO
UNIBAIL-RODAMCO - FINANCIAL REPORT 2012 14 • 15
Netherlands:Offi cesPortfolio as at 31/12/2012
GL
A o
f th
e w
ho
le c
om
ple
x
(m² )
Ca
r p
ark
s
Ca
tch
me
nt
are
a(m
illi
on
s o
f p
eo
ple
)
Nu
mb
er
of
visit
s (
mil
lio
ns)
Yea
r o
f a
cqu
isit
ion
Co
nst
ruct
ion
(C
)R
efu
rbis
hm
en
t (R
) d
ate
GL
A o
f th
e p
rop
ert
y o
wn
ing
co
mp
an
ies (
m²)
% U
nib
ail
-Ro
da
mco
’s
sh
are
% o
f co
nso
lid
ati
on
Tota
l sp
ace
acc
ord
ing
to
co
nso
lid
ati
on
(m
² )
Offi ces
Rotterdam Plaza (Rotterdam) 29,700 487 n.a. n.a. 1989 R 2012 29,700 100% 100% 29,700
Leidsenhage (Leidschendam) 25,300 3,000 n.a. n.a. 2007 C 1971/R 2000 25,300 100% 100% 25,300
Stadshart Zoetermeer (Zoetermeer) 16,900 3,340 n.a. n.a. 1983/2005 C 1983/R 2005 16,900 100% 100% 16,900
Zoetelaarpassage (Almere) 9,200 – n.a. n.a. 1983 n.a. 9,200 100% 100% 9,200
Coolsingel (Rotterdam) 9,200 28 n.a. n.a. n.a. C 1961 9,200 100% 100% 9,200
Oude Boteringestraat (Groningen) 7,300 – n.a. n.a. 1992 C 1992 7,300 100% 100% 7,300
De Polderlanden (Hoofddorp) 3,700 1,037 n.a. n.a. 1996 R 2008 3,700 100% 100% 3,700
Kalfjeslaan 2 (Delft) 4,200 71 n.a. n.a. 1999 n.a. 4,200 100% 100% 4,200
Hofplein 33 (Rotterdam) 3,500 – n.a. n.a. 1984 R 1987 3,500 100% 100% 3,500
Stadshart Amstelveen (Amstelveen) 2,500 2,775 n.a. n.a. 2005 C 1960/R 1998 2,200 100% 100% 2,200
Dik Tromplein (Hoofddorp) 2,100 – n.a. n.a. 1999 C 1999 2,100 100% 100% 2,100
Stadshart Almere (Almere) 2,100 1,807 n.a. n.a. 2002 n.a. 2,100 100% 100% 2,100
Total (according to the scope of consolidation)
115,400

REPORT OF THE CHAIRMAN OF THE SUPERVISORY BOARD
LEGAL INFORMATION
FINANCIAL REPORT 2012 - UNIBAIL-RODAMCO 14 • 15

CONSOLIDATED FINANCIAL STATEMENTS
CORPORATE SUSTAINABILITY
BUSINESS REVIEW AND 2012 RESULTS
PORTFOLIO
UNIBAIL-RODAMCO - FINANCIAL REPORT 2012
1. Business Review 171. Accounting principles and scope of consolidation 172. Business review by segment 183. Sustainability 264. 2012 Results 275. Post-closing events 286. Dividend 297. Outlook 29
2. Development projects as at december 31, 2012 301. Development project portfolio evolution 302. Development projects overview 303. A secured and fl exible development pipeline 314. Projects added to the development pipeline in 2012 315. Investments in 2012 326. Delivered projects in 2012 327. Deliveries expected in 2013 328. Projects overview 32
3. Net Asset Value as at December 31, 2012 341. Property portfolio 342. EPRA Triple Net Asset Value calculation 41
4. Financial Resources 451. Debt structure as at December 31, 2012 452. Ratings 473. Market risk management 474. Financial structure 48
Business Review and 2012 Results
16 • 17

REPORT OF THE CHAIRMAN OF THE SUPERVISORY BOARD
LEGAL INFORMATION
FINANCIAL REPORT 2012 - UNIBAIL-RODAMCO 16 • 17
Business Review1. ACCOUNTING PRINCIPLES AND SCOPE
OF CONSOLIDATION
1.1. Accounting principles
Unibail-Rodamco’s consolidated fi nancial statements as
at December 31, 2012 have been prepared in accordance
with International Financial Reporting Standards (“IFRS”) as
applicable in the European Union as at December 31, 2012.
Unibail-Rodamco has adopted IAS 19, revised 2011, “Employee
benefi ts” in its fi nancial statements as at December 31, 2012.
The fi nancial statements as at December 31, 2011 have been
restated accordingly, with an impact of -€3.2 million on the “Net
result-owners of the parent”.
No other changes were made to the accounting principles
with those applied for the year ended December 31, 2011.
The fi nancial statements are compliant with the best
practice recommendations published by the European Public
Real estate Association (EPRA)(1). Key EPRA performance
indicators are reported in a separate chapter at the end of
this Appendix.
1.2. Scope of consolidation
The principal changes in the scope of consolidation since
December 31, 2011 were:
• the acquisition, in August 2012, of a 51% stake in a holding
company which now owns 91.15% of mfi AG (Germany’s
second largest shopping centre operator, investor and
developer), consolidated under the equity method(2);
• the acquisition, in August 2012, of a 50% stake in the
company which owns the Ruhr-Park shopping centre,
consolidated under the equity method(2);
• the indirect investment, in March 2012, in the Zlote Tarasy
complex, comprising a shopping centre, a parking and two
offi ces in Warsaw, consolidated under the equity method(3);
• following the creation of a 50-50 joint venture combining
Unibail-Rodamco’s and Abu Dhabi Investment Authority
(“ADIA”)’s interests in Parly 2 shopping centre (Paris
region), the combined entity is now consolidated under
the proportional method since July 2012 (instead of full
consolidation method of Unibail-Rodamco’s part as at
June 30, 2012);
• the acquisition of a part in Sant Cugat shopping centre in
Barcelona, in January 2012, fully consolidated.
As at December 31, 2012, 260 companies have been
fully consolidated, 32 companies have been consolidated
proportionally and 12 companies have been accounted for
under the equity method(4).
1.3. Operational reporting
The Unibail-Rodamco Group is operationally organised
in six geographical regions: France, Spain, Central Europe,
Austria, the Nordics and The Netherlands. As France
has substantial representation of all 3 business-lines of
the Group, this region is itself divided in three segments:
Shopping Centres, Offi ces and Convention & Exhibition. The
other regions operate mainly in the shopping centre segment.
The table below shows the split of asset value (Gross
Market Value) per region as at December 31, 2012.
Netherlands
Nordic
Austria
Central
Europe
Spain
France
C&E
France Offices
France
Retail
41%
12%
9%
9%5%
10%
7%
7%
(1) EPRA Best Practices Recommendations are available on EPRA website: www.epra.com.(2) Based on the analysis of the governance.(3) Refer to paragraph 1.5.(4) Mainly the Comexposium subsidiaries (trade show organisation business), the Zlote Tarasy complex in Poland, mfi AG and the Ruhr-Park shopping centre in Germany.

CONSOLIDATED FINANCIAL STATEMENTS
CORPORATE SUSTAINABILITY
BUSINESS REVIEW AND 2012 RESULTS
PORTFOLIO
UNIBAIL-RODAMCO - FINANCIAL REPORT 2012 18 • 19
2. BUSINESS REVIEW BY SEGMENT
2.1. Shopping centres
2.1.1. Shopping centre market in 2012
The economic environment remained uncertain in 2012,
with further weakening in the second half of the year. New
austerity measures in the European Union and the continued
increase in unemployment fi gures weighed on market
conditions and households’ purchasing power.
The environment was particularly diffi cult in Spain and in
the Czech Republic with negative GDP(5) growth estimated
at -1.4% and -1.3%, respectively, while in France and in
The Netherlands the GDP growth for 2012 is expected to have
been broadly fl at. Poland, Slovakia and Sweden, on the other
hand, are expected to show GDP growth of +2.4%, +2.6% and
+1.1%, respectively.
Despite this challenging macro-economic backdrop,
Unibail-Rodamco demonstrated the strength of its business
model: large shopping centres located in wealthy and densely
populated catchment areas in large European metropolitan
areas, offering visitors a unique experience thanks to a
critical mass of premium(6) international retailers, frequent
introduction of new and differentiating tenants, impressive
design, high quality services and marketing.
Footfall in the Group’s shopping centres increased by
+1.3% in 2012 and tenant sales(7) by +2.0%, despite a slightly
negative performance in December 2012 vs. December 2011.
Through November 2012, tenant sales(7) were up by +2.5%,
outperforming national sales indices by +350 bps(8). This
outperformance was evident across the regions and was
primarily driven by large shopping centres(9). Through this
period, tenant sales grew by +4.1% in France (e.g., +8.1%
and +14.0% in Les Quatre Temps and Carré Sénart, Paris
region), outperforming the national sales index by +440 bps.
In Austria(10), tenant sales grew by +7.8% (e.g., +10.2% in Donau
Zentrum, Vienna), outperforming the national sales indices
by +590 bps. In Central Europe, tenant sales grew by +2.0%
(e.g., +3.3% in Arkadia, Warsaw), outperforming the national
sales indices by +230 bps. In Spain, despite a -1.6% decline in
sales, tenants in the Group’s shopping centres outperformed
the national sales index by +530 bps. This performance was
driven primarily by the largest shopping centres such as
La Maquinista (+2.4%) and Parquesur (+5.7%), which account
for 69% of the Group’s Spanish portfolio. In these centres,
tenant sales through November 2012 were up by +0.2%(7) and
MGR uplift was +15.3%. Splau, a 55,100 m² GLA shopping
centre in Barcelona acquired in October 2011 and refurbished
by Unibail-Rodamco, saw its footfall increase by +13.5% and
tenant sales by +10.6% in 2012.
In the Nordics, the analysis excludes Täby, Fisketorvet and
Solna due to on-going extension and refurbishment works.
The rest of the region saw tenant sales decline by -3.2%,
mainly due to the departure of an anchor tenant in Örebrö.
On average, tenant sales in Unibail-Rodamco’s shopping
centres have outperformed the relative national sales indices
by +180 bps per year since 2006, with a marked acceleration
since 2009.
This strong performance of Unibail-Rodamco’s portfolio
refl ects the Group’s superior asset quality and pro-active
management. Continuous improvement is ever more
important to offer customers the differentiated experience
the internet cannot replicate.
2012 was an exceptional year in terms of innovation with
a number of projects launched by UR Lab, an initiative aimed
at strengthening the Group’s leadership position in terms of
customer services and differentiation:
• digital marketing: all of the Group’s shopping centres now
have an iPhone and/or Android app, contributing to an
exponential increase in the number of apps downloaded
(5) Source: Eurostat, January 2013.(6) Retailer that has strong and international brand recognition, with a differentiating store design and product approach, which may increase the appeal of the shopping centres.(7) Tenant sales performance in Unibail-Rodamco’s shopping centres (excluding the Netherlands) on portfolio of shopping centres in operation including extensions of existing assets and excluding deliveries of new brownfi eld projects, acquisition of new assets and assets under heavy refurbishment. Including Apple store sales estimated on the basis of available public information from Apple Inc. (2011 10-K published October 26, 2011, pages 20 and 30; 2012 10-K published October 31, 2012, pages 30 and 34).(8) Based on latest national indices available (year-on-year evolution) as of November 2012: France: Institut Français du Libre-Service; Spain: Instituto Nacional de Estadistica; Central Europe: Česky statisticky urad (Czech Republic), Polska Rada Centrow Handlowych (Poland); Austria: Eurostat (Austria and Slovakia); Nordic: HUI Research (Sweden), Denmarks Statistik (Denmark), Statistikcentralen (Finland).(9) Shopping centres with more than 6 million visits per annum.(10) Includes Slovakia.

REPORT OF THE CHAIRMAN OF THE SUPERVISORY BOARD
LEGAL INFORMATION
FINANCIAL REPORT 2012 - UNIBAIL-RODAMCO 18 • 19
(1.3 million as of December 2012 vs. 0.2 million as of
December 2011). New features were also introduced, such
as product search, movie trailers, gift fi nder and the indoor
geo-location. The number of Facebook fans of the Group’s
shopping malls grew strongly in 2012 with 2.6 million
fans as of December 2012, compared to 0.7 million as of
December 31, 2011;
• the “4 Star label”(11), the Group’s new quality referential, was
awarded to nine shopping centres in 2012. With Carré Sénart
(Paris region), Confl uence (Lyon), Arkadia (Warsaw) and
Galeria Mokotow (Warsaw) labelled in H1-2012, shopping
centres Docks 76 (Rouen), Rivétoile (Strasbourg), So Ouest
(Paris region), Nacka Forum (Stockholm) and Amstelveen
(Amsterdam) were awarded the “4 Star label” in H2-2012,
following a comprehensive quality audit performed by SGS,
the worldwide leader in service certifi cation. The labelling
process will continue in 2013 and 2014;
• the Dining Experience: a new initiative aimed at doubling the
space dedicated to dining in Unibail-Rodamco’s shopping
centres, the creation of a new outstanding “Dining Plaza”,
the introduction of differentiating food concepts, the offer of
unique gastronomy events and services. This new concept
was launched in July 2012 in La Maquinista in Barcelona
and now has 19 restaurants on 5,582 m² GLA, including
1,743 m² of newly created GLA. Since the launch of this
concept, La Maquinista footfall grew +7.4% compared to the
same period last year, including +14.1% on evenings and
+23.6% on Sundays (days on which only restaurants and the
cinema are opened) and tenant sales grew +5.4%. Following
this successful opening, the Dining Experience concept will
be deployed in 25 of the Group’s shopping centres in the
next few years;
• the Iconic shop fronts concept: to become “the Home of the
fl agshipsTM” by upgrading the overall height and quality of
our tenants’ shop fronts, thus promoting variety, innovation
and design excellence in the Group’s shopping centres.
Leasing activity was strong in 2012 with 1,418 leases
signed with a minimum guaranteed rental uplift of +21.4%
on renewals and relettings, and with a continued focus on
differentiating and exclusive retail concepts, generating
traffi c and customer preference. The Group’s rotation
rate(12) stood at 13.2% in 2012, a signifi cant increase over
2011 at 11.3%. 139 leases were signed with international
premium(13) retailers, compared to 104 in 2011. In addition to
the continued development throughout the Group’s portfolio
of brands such as Apple (opening its fi rst store in Scandinavia
in Täby Centrum) and Hollister, Nespresso opened its fi rst
store in a shopping centre in France in Parly 2 and in The
Netherlands in Amstelveen. Michael Kors, American Eagle
Outfi tters and Victoria’s Secret choose Unibail-Rodamco’s
shopping centres to open their fi rst stores in Poland, and Vans
and The North Face opened their fi rst stores in the Czech
Republic in Centrum Chodov.
Retailers are becoming more selective in deciding on where
they will open stores, giving preference to shopping centres
with high footfall and a critical mass of premium retailers. To
meet this demand, the Group has delivered 7 new shopping
centres and renovated or extended many of its large shopping
centres since the merger in 2007. The Group aims to have
renovated or extended 75% of its portfolio by year-end 2014(14).
Extension and renovation works are on-going in France
at the Forum des Halles (Paris), Alma (Rennes) and Toison
d’Or (Dijon) as well as in the other regions at Shopping City
Süd (Vienna), Täby (Stockholm), Fisketorvet (Copenhagen),
Centrum Cerny Most (Prague) and Galeria Mokotow (Warsaw).
These projects will strengthen the regional leadership of these
malls and offer customers a unique shopping experience and
provide retailers the opportunity to introduce their fl agship
stores in high footfall shopping centres.
The successful openings of Confl uence (Lyon), El Faro
(Badajoz, Spain) and So Ouest (Paris region) refl ect the relevance
of the Group’s strategy of accelerating product differentiation.
So Ouest, opened October 18, 2012, was exceptionally
well received by the press, tenants and visitors with over
2.8 million visits since its opening (as of January 31, 2013).
The mall clearly sets a new standard for shopping centres in
Continental Europe in terms of design, choice of materials and
poly-sensorial experience. Thanks to its superior quality and
services, So Ouest was awarded Unibail-Rodamco’s exclusive
4 Star label. Its tenant mix includes brands opening their fi rst
stores in France or in the mall’s catchment area: Hollister,
France’s fi rst Lego store, Continental Europe’s largest
Marks & Spencer, and for the fi rst time in shopping centres,
contemporary brands such as Ann Tuil and Claudie Pierlot.
(11) The “4 Star label” for a shopping centre is based on a 571-point quality referential and audited by SGS, the world leader in service certifi cation.(12) Rotation rate = (number of re-lettings + number of assignments + number of renewals with new concepts) / number of stores.(13) Retailer that has strong and international brand recognition, with a differentiating store design and product approach, which may increase the appeal of the shopping centres.(14) Based on Gross Market Value of standing shopping centres with more than 6 million visits per annum as at December 31, 2012.

CONSOLIDATED FINANCIAL STATEMENTS
CORPORATE SUSTAINABILITY
BUSINESS REVIEW AND 2012 RESULTS
PORTFOLIO
UNIBAIL-RODAMCO - FINANCIAL REPORT 2012 20 • 21
2.1.2. Net Rental Income from Unibail-Rodamco
shopping centres
The Group owns 103 retail assets, including 82 shopping
centres out of which 57 host more than 6 million visits per
annum. These 57 centres represent 89% of the Group’s retail
portfolio in Gross Market Value.
Total consolidated Net Rental Income (NRI) of the shopping
centre portfolio amounted to €1,044.4 million in 2012.
Region
Net Rental Income (€Mn)
2012 2011 %
France 536.7 499.3 7.5%
Spain 140.7 128.7 9.4%
Central Europe 108.2 101.3 6.8%
Austria 101.9 89.6 13.8%
Nordic 87.8 90.2 -2.7%
Netherlands 69.2 75.0 -7.8%
Total NRI 1,044.4 984.1 6.1%
The total net growth in NRI amounted to +€60.3 million
(+6.1%) compared to 2011 and broke down as follows:
• +€30.3 million from acquisitions:
• acquisition of Splau in October 2011, a 55,100 m²
shopping centre in Barcelona-Spain and a part of the
Sant Cugat shopping centre in Barcelona in January 2012
(+€10.1 million),
• acquisition of the remaining 50% of Galeria Mokotow in
Warsaw-Poland in July 2011 (+€9.0 million)(15),
• acquisition of the remaining 50% of Aupark in Bratislava
in October 2011 (+€8.8 million)(15),
• acquisition of additional units in existing shopping centres
in Spain, The Netherlands and in France (+€2.4 million);
• +€17.8 million from delivery of shopping centres, mainly in
France with Confl uence in Lyon which opened in April 2012
and with So Ouest in the Paris region which opened in
October 2012, and in Spain with the September opening of
El Faro in Badajoz;
• -€24.6 million due to disposals of smaller assets:
• -€7.4 million in The Netherlands further to the
divestments of retail assets mainly in Almere, Eindhoven
and Breda in 2011 and Brink in 2012,
• -€6.4 million in France, due to the disposal of
Bonneveine-Marseille, Saint-Genis 2 near Lyon, Shopping
Etrembières-Annemasse, Évry 2 in the Paris region,
Boisseuil in Limoges and Croix-Dampierre in Châlons-
en-Champagne, mainly in the fi rst half of 2011 and of
Wasquehal in July 2012,
• -€5.8 million due the disposal of the Group’s share in
Arkad in Budapest in February 2011 and Allee-Center in
Magdeburg in October 2011,
• -€3.9 million in Sweden due to the disposal of retail
assets in Haninge, Tyresö, Bälsta, Helsingborg, and Väsby
in H1-2011 and Halmstad in August 2012,
• And -€1.1 million in Austria due to the disposal of Südpark
in Klagenfurt in July 2011;
• +€1.1 million coming from other minor effects, including
currency translation, assets under renovation or extension
and one-off items;
• the like-for-like NRI(16) growth amounted to +€35.7 million,
representing a +4.2% growth compared to 2011, of which
+2.2% (€18.8 million) was due to indexation.
Region
Net Rental Income (€Mn) Like-for-like
2012 2011 %
France 457.2 433.9 5.4%
Spain 115.8 115.6 0.2%
Central Europe 93.4 89.4 4.4%
Austria 90.9 85.4 6.4%
Nordic 59.9 58.2 2.9%
Netherlands 67.3 66.3 1.5%
Total NRI Lfl 884.5 848.8 4.2%
Region
Net Rental Income like-for-like evolution (%)
Indexation
Renewals, relettings net of departure Other Total
France 2.2% 2.4% 0.8% 5.4%
Spain 2.5% 0.0% -2.3% 0.2%
Central Europe 2.1% 2.7% -0.4% 4.4%
Austria 2.1% 5.0% -0.7% 6.4%
Nordic 2.0% -0.5% 1.4% 2.9%
Netherlands 2.6% -1.4% 0.3% 1.5%
Total 2.2% 1.9% 0.1% 4.2%
Net of indexation and on a like-for-like basis, the average
NRI growth rate was +2.0%. The best performing regions were
Austria (+4.3%), France (+3.2%) and Central Europe (+2.3%).
The Nordics were positively impacted by lower expenses
(e.g. a warm winter required less snow clearing). Spain was
negatively impacted by a decrease in other income (including
Sales Based Rents and key money) and an increase in doubtful
debtors, whereas The Netherlands was adversely affected by
a number of bankruptcies and vacancies in non-core assets.
(15) Cha nge from proportional consolidation to full consolidation as at December 31, 2011.(16) Like-for-like NRI: Net Rental Income excluding acquisitions, divestments, transfers to and from pipeline (extensions, brownfi elds) and currency exchange rate differences in the periods analysed (computation based on exchange rates used the previous fi scal year).
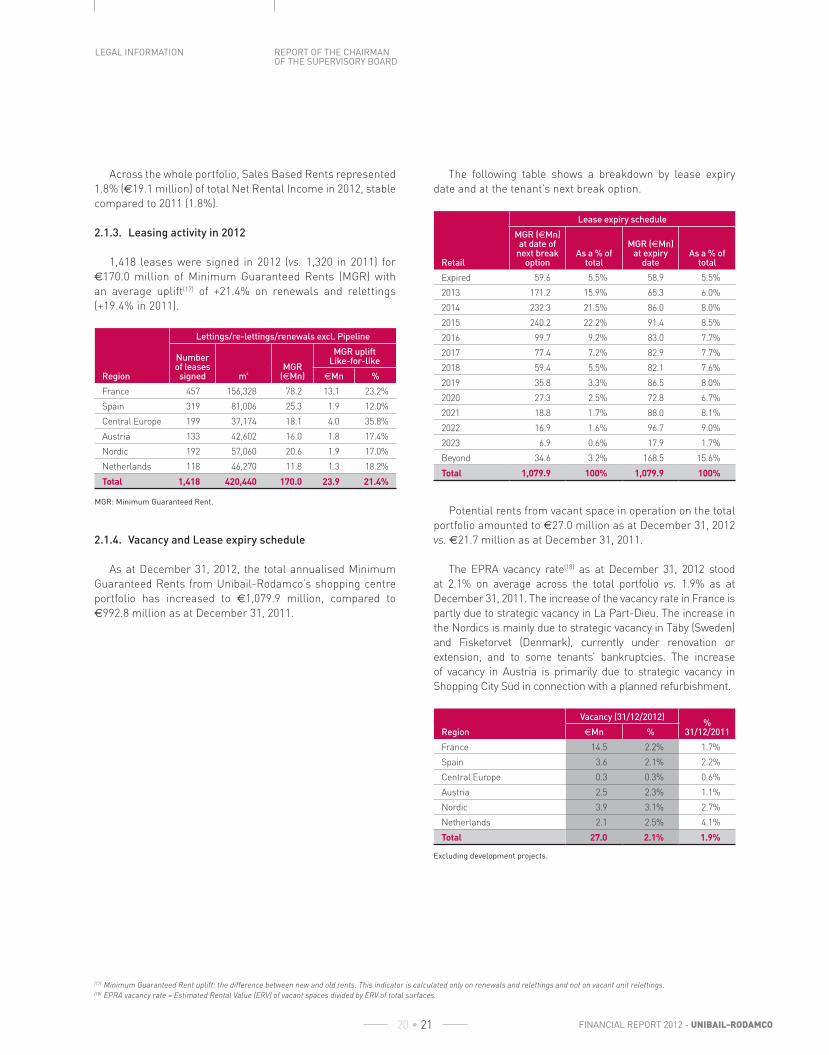
REPORT OF THE CHAIRMAN OF THE SUPERVISORY BOARD
LEGAL INFORMATION
FINANCIAL REPORT 2012 - UNIBAIL-RODAMCO 20 • 21
Across the whole portfolio, Sales Based Rents represented
1.8% (€19.1 million) of total Net Rental Income in 2012, stable
compared to 2011 (1.8%).
2.1.3. Leasing activity in 2012
1,418 leases were signed in 2012 (vs. 1,320 in 2011) for
€170.0 million of Minimum Guaranteed Rents (MGR) with
an average uplift(17) of +21.4% on renewals and relettings
(+19.4% in 2011).
Region
Lettings/re-lettings/renewals excl. Pipeline
Number of leases
signed m²MGR
(€Mn)
MGR uplift Like-for-like
€Mn %
France 457 156,328 78.2 13.1 23.2%
Spain 319 81,006 25.3 1.9 12.0%
Central Europe 199 37,174 18.1 4.0 35.8%
Austria 133 42,602 16.0 1.8 17.4%
Nordic 192 57,060 20.6 1.9 17.0%
Netherlands 118 46,270 11.8 1.3 18.2%
Total 1,418 420,440 170.0 23.9 21.4%
MGR: Minimum Guaranteed Rent.
2.1.4. Vacancy and Lease expiry schedule
As at December 31, 2012, the total annualised Minimum
Guaranteed Rents from Unibail-Rodamco’s shopping centre
portfolio has increased to €1,079.9 million, compared to
€992.8 million as at December 31, 2011.
The following table shows a breakdown by lease expiry
date and at the tenant’s next break option.
Retail
Lease expiry schedule
MGR (€Mn) at date of
next break option
As a % of total
MGR (€Mn) at expiry
dateAs a % of
total
Expired 59.6 5.5% 58.9 5.5%
2013 171.2 15.9% 65.3 6.0%
2014 232.3 21.5% 86.0 8.0%
2015 240.2 22.2% 91.4 8.5%
2016 99.7 9.2% 83.0 7.7%
2017 77.4 7.2% 82.9 7.7%
2018 59.4 5.5% 82.1 7.6%
2019 35.8 3.3% 86.5 8.0%
2020 27.3 2.5% 72.8 6.7%
2021 18.8 1.7% 88.0 8.1%
2022 16.9 1.6% 96.7 9.0%
2023 6.9 0.6% 17.9 1.7%
Beyond 34.6 3.2% 168.5 15.6%
Total 1,079.9 100% 1,079.9 100%
Potential rents from vacant space in operation on the total
portfolio amounted to €27.0 million as at December 31, 2012
vs. €21.7 million as at December 31, 2011.
The EPRA vacancy rate(18) as a t December 31, 2012 stood
at 2.1% on average across the total portfolio vs. 1.9% as at
December 31, 2011. The increase of the vacancy rate in France is
partly due to strategic vacancy in La Part-Dieu. The increase in
the Nordics is mainly due to strategic vacancy in Täby (Sweden)
and Fisketorvet (Denmark), currently under renovation or
extension, and to some tenants’ bankruptcies. The increase
of vacancy in Austria is primarily due to strategic vacancy in
Shopping City Süd in connection with a planned refurbishment.
Region
Vacancy (31/12/2012)%
31/12/2011€Mn %
France 14.5 2.2% 1.7%
Spain 3.6 2.1% 2.2%
Central Europe 0.3 0.3% 0.6%
Austria 2.5 2.3% 1.1%
Nordic 3.9 3.1% 2.7%
Netherlands 2.1 2.5% 4.1%
Total 27.0 2.1% 1.9%
Excluding development projects.
(17) Minimum Guaranteed Rent uplift: the difference between new and old rents. This indicator is calculated only on renewals and relettings and not on vacant unit relettings.(18) EPRA vacancy rate = Estimated Rental Value (ERV) of vacant spaces divided by ERV of total surfaces.
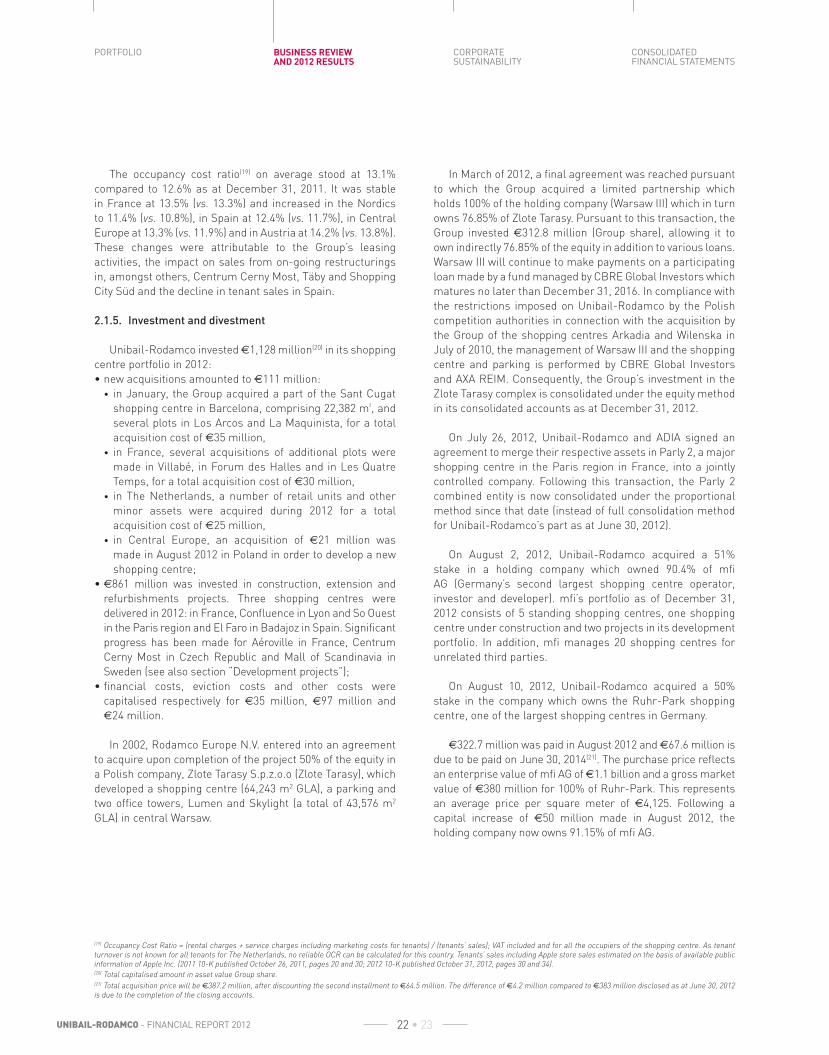
CONSOLIDATED FINANCIAL STATEMENTS
CORPORATE SUSTAINABILITY
BUSINESS REVIEW AND 2012 RESULTS
PORTFOLIO
UNIBAIL-RODAMCO - FINANCIAL REPORT 2012 22 • 23
The occupancy cost ratio(19) on average stood at 13.1%
compared to 12.6% as at December 31, 2011. It was stable
in France at 13.5% (vs. 13.3%) and increased in the Nordics
to 11.4% (vs. 10.8%), in Spain at 12.4% (vs. 11.7%), in Central
Europe at 13.3% (vs. 11.9%) and in Austria at 14.2% (vs. 13.8%).
These changes were attributable to the Group’s leasing
activities, the impact on sales from on-going restructurings
in, amongst others, Centrum Cerny Most, Täby and Shopping
City Süd and the decline in tenant sales in Spain.
2.1.5. Investment and divestment
Unibail-Rodamco invested €1,128 million(20) in its shopping
centre portfolio in 2012:
• new acquisitions amounted to €111 million:
• in January, the Group acquired a part of the Sant Cugat
shopping centre in Barcelona, comprising 22,382 m², and
several plots in Los Arcos and La Maquinista, for a total
acquisition cost of €35 million,
• in France, several acquisitions of additional plots were
made in Villabé, in Forum des Halles and in Les Quatre
Temps, for a total acquisition cost of €30 million,
• in The Netherlands, a number of retail units and other
minor assets were acquired during 2012 for a total
acquisition cost of €25 million,
• in Central Europe, an acquisition of €21 million was
made in August 2012 in Poland in order to develop a new
shopping centre;
• €861 million was invested in construction, extension and
refurbishments projects. Three shopping centres were
delivered in 2012: in France, Confl uence in Lyon and So Ouest
in the Paris region and El Faro in Badajoz in Spain. Signifi cant
progress has been made for Aéroville in France, Centrum
Cerny Most in Czech Republic and Mall of Scandinavia in
Sweden (see also section “Development projects”);
• fi nancial costs, eviction costs and other costs were
capitalised respectively for €35 million, €97 million and
€24 million.
In 2002, Rodamco Europe N.V. entered into an agreement
to acquire upon completion of the project 50% of the equity in
a Polish company, Zlote Tarasy S.p.z.o.o (Zlote Tarasy), which
developed a shopping centre (64,243 m2 GLA), a parking and
two offi ce towers, Lumen and Skylight (a total of 43,576 m2
GLA) in central Warsaw.
In March of 2012, a fi nal agreement was reached pursuant
to which the Group acquired a limited partnership which
holds 100% of the holding company (Warsaw III) which in turn
owns 76.85% of Zlote Tarasy. Pursuant to this transaction, the
Group invested €312.8 million (Group share), allowing it to
own indirectly 76.85% of the equity in addition to various loans.
Warsaw III will continue to make payments on a participating
loan made by a fund managed by CBRE Global Investors which
matures no later than December 31, 2016. In compliance with
the restrictions imposed on Unibail-Rodamco by the Polish
competition authorities in connection with the acquisition by
the Group of the shopping centres Arkadia and Wilenska in
July of 2010, the management of Warsaw III and the shopping
centre and parking is performed by CBRE Global Investors
and AXA REIM. Consequently, the Group’s investment in the
Zlote Tarasy complex is consolidated under the equity method
in its consolidated accounts as at December 31, 2012.
On July 26, 2012, Unibail-Rodamco and ADIA signed an
agreement to merge their respective assets in Parly 2, a major
shopping centre in the Paris region in France, into a jointly
controlled company. Following this transaction, the Parly 2
combined entity is now consolidated under the proportional
method since that date (instead of full consolidation method
for Unibail-Rodamco’s part as at June 30, 2012).
On August 2, 2012, Unibail-Rodamco acquired a 51%
stake in a holding company which owned 90.4% of mfi
AG (Germany’s second largest shopping centre operator,
investor and developer). mfi ’s portfolio as of December 31,
2012 consists of 5 standing shopping centres, one shopping
centre under construction and two projects in its development
portfolio. In addition, mfi manages 20 shopping centres for
unrelated third parties.
On August 10, 2012, Unibail-Rodamco acquired a 50%
stake in the company which owns the Ruhr-Park shopping
centre, one of the largest shopping centres in Germany.
€322.7 million was paid in August 2012 and €67.6 million is
due to be paid on June 30, 2014(21). The purchase price refl ects
an enterprise value of mfi AG of €1.1 billion and a gross market
value of €380 million for 100% of Ruhr-Park. This represents
an average price per square meter of €4,125. Following a
capital increase of €50 million made in August 2012, the
holding company now owns 91.15% of mfi AG.
(19) Occupancy Cost Ratio = (rental charges + service charges including marketing costs for tenants) / (tenants’ sales); VAT included and for all the occupiers of the shopping centre. As tenant turnover is not known for all tenants for The Netherlands, no reliable OCR can be calculated for this country. Tenants’ sales including Apple store sales estimated on the basis of available public information of Apple Inc. (2011 10-K published October 26, 2011, pages 20 and 30; 2012 10-K published October 31, 2012, pages 30 and 34).(20) Total capitalised amount in asset value Group share.(21) Total acquisition price will be €387.2 million, after discounting the second installment to €64.5 million. The difference of €4.2 million compared to €383 million disclosed as at June 30, 2012 is due to the completion of the closing accounts.

REPORT OF THE CHAIRMAN OF THE SUPERVISORY BOARD
LEGAL INFORMATION
FINANCIAL REPORT 2012 - UNIBAIL-RODAMCO 22 • 23
As Unibail-Rodamco does not control the acquired
companies based on the current governance, they have been
consolidated under the equity method in its consolidated
fi nancial statements as at December 31, 2012.
While the major part of the Group’s divestment plan has
been completed during 2011 and the prior years, the Group
sold a few non-core assets in France, Sweden and The
Netherlands in 2012 for a total net disposal price of almost
€98 million (excluding the Parly 2 transaction).
The Group continues its disciplined approach to asset rotation
and disposals and will continue to critically evaluate opportunities.
2.2. Offi ces
2.2.1. Offi ce property market in 2012(22)
Take-up
Paris offi ce take-up(23) was 2,380,600 m² in 2012,
representing a 3% decline compared to 2011.
The offi ce market large segment (deals over 5,000 m²)
boosted take-up with 68 large transactions(24) in 2012
(compared to 71 transactions in 2011), for a total of 0.9 million
square meters let (i.e. -11% vs. 2011). The biggest transactions
recorded were: Thalès for 49,000 m² in Vélizy(25); Allianz for
35,175 m² on Athéna Tower (La Défense) and Yves Rocher –
turnkey project of 22,759 m² in Issy-les-Moulineaux.
With 716,900 m² let in 2012(26), the activity inside Paris
declined by 24% compared to last year, which is mainly due
to the lack of quality supply. Nevertheless, Paris represents a
signifi cant part of total take-up (26) (32% in 2012), followed by
the Western Crescent (23%).
Leasing activity in La Défense reached 108,900 m² in 2012
(-7% vs. 2011), excluding the Ministry of Environment transaction.
Because the economic outlook remains highly uncertain
and many prospective tenants are reluctant to make
signifi cant and long-term commitments for new offi ce space,
the Group believes the near-term outlook for the offi ce market
will remain challenging.
Rents(27)
Rental values in the Paris region for new, redeveloped or
renovated space decreased slightly in 2012, but with some
noticeable geographical variations.
Prime rents in Paris CBD went from 748 euros/m² in 2011
to 771 euros/m² due to three transactions(28) over 800 euros/
m² recorded in 2012. The principal transactions recorded in
H2-2012 were: the law fi rm SJ Berwin on Ozone (92 avenue
des Champs-Élysées, Paris 8) for 3,500 m² and Goldman
Sachs on 5 avenue Kléber (Paris 16) for 2,700 m².
In La Défense, prime rents decreased to 441 euros/m² at
the end of 2012 (compared to 494 euros/m² last year), with only
2 deals over 500 euros/m² recorded in 2012 in La Défense: the
RTE deal on Coeur Défense for 14,144 m² (530 euros/m²) and
the additional square meters taken by EDF in the Tour EDF for
5,782 m² (530 euros/m²).
Limited new supply(29)
Immediate supply in the Paris Region has remained stable
since 2009 at around 3.6 million m², as did the vacancy rate(25)
at 6.5% albeit with large variations from area to area: 10.8%
for the Western Crescent, 6.6% for La Défense, 8.8% for the
Paris Inner Rim and 5.2% for Paris CBD.
Beyond these differences in terms of location, the situation
differs between new and modern buildings and the rest of
the market which suffers from obsolescence of the offer.
New and redeveloped supply continued to be absorbed. As a
consequence, the share of new or refurbished offi ce space in
immediate supply fell to 19% vs. 23% in 2011.
(22) Sources: Immostat, BNP Paribas Real Estate, CBRE, DTZ, JLL.(23) Source: Immostat, January, 2013.(24) Source: CBRE, Market view Bureaux Île-de-France Q4-2012. Excluding two transactions with Ministry of Defense and Ministry of Environment.(25) Source: DTZ, Property Times Île-de-France, Q3-2012.(26) Source: Immostat, January 2013, excluding the transaction with Ministry of Defense.(27) Source: CBRE, Market view Île-de-France Q4-2012.(28) Source: BNP Paribas Real Estate.(29) Source: Immostat and CBRE.

CONSOLIDATED FINANCIAL STATEMENTS
CORPORATE SUSTAINABILITY
BUSINESS REVIEW AND 2012 RESULTS
PORTFOLIO
UNIBAIL-RODAMCO - FINANCIAL REPORT 2012 24 • 25
In 2013, companies are expected to continue cutting
costs and optimizing their offi ces areas. With its prime
quality portfolio and differentiated approach to develop new
generation offi ces, Unibail-Rodamco provides desirable
assets designed to meet companies’ needs.
Investment market
Investments in offi ces(30) during 2012 in the Paris region
market accounted for €10.9 billion, representing an 8%
decrease vs. 2011 (€11.9 billion).
2012 was characterized by large portfolio deals, mostly
concluded by sovereign wealth funds. Qatar Investment
Authority bought an offi ce portfolio from KanAm for more than
€600 million(31) (Neo, 26,000 m² in Paris 9 and Cité du Retiro,
21,000 m² in Paris 8) and a trophy asset from Groupama for
more than €500 million (52-60 avenue des Champs-Elysées
in Paris 8). Another foreign fund advised by JP Morgan Asset
Management acquired a €508 million portfolio from Eurosic
(52 avenue Hoche, 11,000 m² in Paris 8 and 50-60 avenue
Pierre Mendès France, 43,000 m² in Paris 13). In Q4-2012,
ADIA purchased the 90 Boulevard Pasteur in Paris 15 from
AMUNDI for €250 million.
Yields show an increasing differentiation between prime
and non-prime assets and a compression in prime offi ce
assets in Paris CBD. Prime yields(32) in Paris CBD stood around
4.25% at the end of 2012 and around 6.25% in La Défense.
2.2.2. Offi ce division 2012 activity
Unibail-Rodamco’s consolidated Net Rental Income (NRI)
from the offi ces portfolio came to €172.6 million in 2012
Region
Net Rental Income (€Mn)
2012 2011 %
France 146.2 155.2 -5.8%
Nordic 14.5 15.0 -3.3%
Netherlands 8.7 11.5 -24.0%
Other countries 3.2 2.9 9.8%
Total NRI 172.6 184.5 -6.5%
The decrease of -€11.9 million from 2011 to 2012 is
explained as follows:
• -€6.3 million due to buildings currently under refurbishment
(mainly 2-8 Ancelle and 34-36 Louvre in France and Plaza
in The Netherlands);
• -€6.2 million due to disposals:
• 3-5 Malesherbes in Paris sold in July 2011,
• various small assets sold in 2011 in Sweden and The
Netherlands;
• -€4.6 million mainly due to the one-off impact in 2011 of a
reversal of provision for litigation and currency effects;
• -€3.9 million from buildings delivered in January 2012
in France and not yet fully let (Nouvel Air, formerly “Issy-
Guynemer”) Paris and 80 Wilson La Défense, both renovated
buildings) for which the Group had rental income in 2011;
• like-for-like NRI(33) increased by €9.1 million, a +6.9%
increase, of which +8.2% growth for France, i.e. €9.2 million
(including a €4.1 million impact of indexation) and
-€0.1 million decrease in other countries, mainly due to
The Netherlands as shown below.
Region
Net Rental Income (€Mn) Like-for-like
2012 2011 %
France 122.1 112.9 8.2%
Nordic 9.7 9.4 3.3%
Netherlands 6.0 6.9 -12.4%
Other countries 3.2 2.9 12.7%
Total NRI Lfl 141.1 132.0 6.9%
75 leases were signed in the offi ce sector in 2012 covering
55,736 m², including 31,375 m² for France. Leases were signed
on 34-36 Louvre (with Louis Vuitton Malletier) in Paris, on
Tour Ariane and 70-80 Wilson in La Défense as well as on
Le Sextant, Capital 8 and Nouvel Air in Paris.
2-8 Ancelle, a 16,600 m² offi ce building in Neuilly currently
undergoing restructuring was pre-let in January 2013 to
CMS-Bureau Francis Lefebvre, a leading French law fi rm,
illustrating the demand for modern assets in central locations.
(30) Source: Immostat, January 2013.(31) Source: Le Figaro Immobilier, June 25, 2012.(32) Source: CBRE, Market view Bureaux Île-de-France, Q4-2012.(33) Like-for-like NRI: Net Rental Income excluding acquisitions, divestments, transfers to and from pipeline (extensions, brownfi elds) and currency exchange rate differences in the periods analysed (computation based on exchange rates used the previous fi scal year).

REPORT OF THE CHAIRMAN OF THE SUPERVISORY BOARD
LEGAL INFORMATION
FINANCIAL REPORT 2012 - UNIBAIL-RODAMCO 24 • 25
The expiry schedule of the leases of the offi ce portfolio
(termination option and expiry date) is shown in the
following table.
Offi ce
Lease expiry schedule
MGR (€Mn) at date of
next break option
As a % of total
MGR (€Mn) at expiry
dateAs a % of
total
Expired 2.6 1.3% 2.6 1.3%
2013 23.3 12.1% 10.8 5.6%
2014 26.3 13.7% 8.0 4.1%
2015 35.5 18.5% 27.7 14.4%
2016 30.6 15.9% 21.4 11.1%
2017 4.3 2.2% 18.5 9.6%
2018 25.1 13.1% 21.5 11.2%
2019 32.6 17.0% 56.9 29.6%
2020 5.4 2.8% 8.2 4.2%
2021 2.1 1.1% 8.6 4.5%
2022 0.2 0.1% 1.1 0.5%
2023 3.0 1.5% 3.0 1.5%
Beyond 1.2 0.6% 4.0 2.1%
Total 192.1 100% 192.1 100%
Potential annualised rents from vacant offi ce space in
operation amounted to €21.6 million as at December 31, 2012,
corresponding to fi nancial vacancy(34) of 11.2% on the whole
portfolio (7.3% as at year-end 2011).
Estimated rental value of vacant spaces in France
stood at €16.6 million, mainly in Nouvel Air in Paris, 70-80
Wilson and the CNIT in La Défense and Le Sextant in Paris,
corresponding to a fi nancial vacancy rate of 10.4% vs. 6.5%
as at December 31, 2011. This evolution is primarily due to
Nouvel Air and 80 Wilson which were delivered in 2012 and
are not yet fully let.
2.2.3. Investment and divestment
Unibail-Rodamco invested €173 million(35) in its offi ce
portfolio in 2012.
• €144 million were invested for works, mainly in France
for Majunga tower in La Défense, So Ouest building
and renovation schemes for various buildings (see also
section “Development Projects”) and €3 million for minor
acquisitions related to projects;
• fi nancial costs and other costs capitalised amounted to
€26 million.
On December 21, 2012, Unibail-Rodamco sold Tour
Oxygène in Lyon to Caisse des Dépôts and Crédit Agricole
Assurances at book value as at June 30, 2012, at a Net initial
yield(36) of 5.9% and with a development gain of €9.9 million.
In total, net proceeds of divestments of offi ce assets
in 2012 amounted to €132 million.
2.3. Convention & Exhibition
This activity is exclusively located in France and consists
of a real estate venues rental and services company (Viparis)
and a trade show organiser (Comexposium).
Both organisations are owned with the Paris Chamber of
Commerce and Industry (CCIP). Viparis is fully consolidated by
Unibail-Rodamco and Comexposium is accounted for under
the equity method. The Convention and Exhibition business
has a seasonal results pattern, with annual, biennial and
triennial shows, and an uneven distribution of shows during
the year.
While the average fl oor space rented for a typical show has
come down as a result of the global economic crisis, 2012
was a record year in terms of new shows with 31 new shows
created, compared to 29 in 2011 and 15 in 2010. In addition,
new concepts were developed with success. For instance,
the exceptional Toutankhamun exhibition at the Parc des
Expositions in Porte de Versailles attracted more than 250,000
visits in 3 months in 2012.
With more constrained marketing budgets, shows remain
one of the most effective media for exhibitors. To control
advertising and gain new orders, companies maintain their
presence on shows. The most important shows have seen
little impact of the crisis, as they remain landmark events for
the public.
The 2012 activity level was largely driven by large shows:
• annual shows: the successful “Agriculture Show” (SIA),
attracting 681,200 visits, one of the best editions of the past
ten years. The 2012 edition of the “Foire de Paris” attracted
4% more participants than the previous edition, ranking it
as one of the biggest global European fairs;
• biennial shows: the “Motor show”, taking place in H2-2012,
was greatly successful in terms of visits (1,230,000),
exhibitors and orders. In addition, “SIAL”, the largest food
exhibition in the world, attracted 150,200 professional
visitors, an increase of 10% compared to the previous
edition in 2010;
• triennial shows: “Intermat”, the international construction
show, leader in its market, had a record year with more than
200,000 visitors and 1,350 exhibitors, of which 67% were
international exhibitors.
(34) EPRA Vacancy rate = Estimated Rental Value (ERV) of vacant spaces divided by ERV of total surfaces.(35) Total capitalised amount in asset value Group share.(36) Calculation based on Net Rental Income for the next 12 months divided by total acquisition cost.

CONSOLIDATED FINANCIAL STATEMENTS
CORPORATE SUSTAINABILITY
BUSINESS REVIEW AND 2012 RESULTS
PORTFOLIO
UNIBAIL-RODAMCO - FINANCIAL REPORT 2012 26 • 27
The Congress activity was dynamic in 2012 with the strong
development of international congresses at the Palais des
Congrès de Paris, like the ERA-EDTA Congress and the
European Association of Urology Congress.
In total, 898 events were held in all Viparis venues, of which
305 shows, 130 congresses and 463 corporate events.
As a result of its seasonal activity and despite the
challenging external environment, Viparis EBITDA(37) reached
€137.6 million, an increase of +€15.6 million (+13%) vs. 2011
and +€17.5 million (+15%) vs. 2010. Excluding the triennial
show Intermat, EBITDA increased by 8% compared to 2010.
At the end of 2012, completed events and pre-booking
levels for the year 2013 in Viparis venues amounted to 87%, in
line with usual levels of 85-90%.
On July 12, 2011, the Paris City Council decided to launch a
consultation with a view to modernise the Porte de Versailles
site and to increase its appeal. The City of Paris launched on
June 19, 2012 a call for tender. The objective for the selected
operator will be to realise substantial investments in exchange
for a new long term lease contract awarded by the City in
connection with the site. No decision on the termination of
the concession contract expiring in 2026 has been made to
date and the operating conditions remain unchanged. Viparis
is currently participating in this tender.
The NRI from hotels amounted to €9.5 million for 2012
compared to €8.6 million for 2011, an increase of €0.9 million
mainly due to Pullman Montparnasse hotel and to the opening
of Confl uence hotel in Lyon.
In 2012, Comexposium contributed for €19.6 million to
the Group’s recurring result versus €10.8 million in 2011 and
€15.3 million in 2010 (comparable year in term of seasonality).
3. SUSTAINABILITY
Sustainable thinking is closely integrated into Unibail-
Rodamco’s day-to-day operating, development and
investment activities. Since 2007, the Group has developed
a comprehensive and ambitious sustainability strategy,
based on environmental best practice, social fairness and
transparent governance, which is designed to return reliable,
quantifi able improvements in economic performance over the
long term.
Unibail-Rodamco has two main long-term environmental
targets for its shopping centre portfolio: reduction in CO2
emissions per visit and energy consumption per visit.
Performance against these targets is measured and is
annually externally audited by Ernst &Young since 2009.
In 2012(38), the energy consumption in kWh per visit
decreased by -7% on a like-for-like basis (for the shopping
centre managed portfolio), which leads to a cumulative
-24% decrease between 2006 and 2012, exceeding the -20%
reduction target set for this period, and in line with the -30%
target set for the period 2006 to 2016.
In 2012, CO2 emissions reductions amounted to -12%,
leading to a cumulative -58% decrease since 2006, and
exceeding the 50% target set for the 2006-2016 period.
These excellent results were achieved thanks to the strong
commitment of on-site teams, targeted measures of energy
savings, carbon emissions reductions achieved by energy
suppliers and new ‘green’ electricity contracts entered into
in the year.
In 2012, the Group put in place a unique extensive and
comprehensive in-house risk management system (RMS)
across its entire portfolio in order to mitigate and better
manage health and safety risks. Each managed asset now
undergoes an annual risk assessment carried out by an
independent third-party, leading to a customized improvement
action plan. Ahead of local applicable regulations, the Group’s
RMS includes minimum requirements for a large scope of
subjects including air quality, water quality, asbestos, ground
and air pollution, legionella, electromagnetic radiation,
technical equipment and fi re security.
The Group’s continued inclusion in the main Environmental,
Social and Governance indices (FTSE4Good, Dow Jones
Sustainability Index (“DJSI”) World, DJSI Europe and STOXX
Global ESG(39) leaders) in 2012. With a score of 76% for the
DJSI in 2012 (vs. 75% in 2011), the Group ranked among the
top 5% of property companies and well ahead of the global
industry average score of 43%.
In addition to the EPRA Sustainability Gold Award
received for its compliance with the EPRA Best Practice
Recommendations for Sustainability Reporting, the Group’s
compliance with the GRI-CRESS (Global Reporting Initiative
- Construction & Real Estate Sector Supplement) framework
was awarded a B+ Application Level.
(37) EBITDA=”Net rental income” and “On site property services net income” of Viparis venues.(38) Figures audited by Ernst & Young.(39) Environmental / Social / Governance.

REPORT OF THE CHAIRMAN OF THE SUPERVISORY BOARD
LEGAL INFORMATION
FINANCIAL REPORT 2012 - UNIBAIL-RODAMCO 26 • 27
In order to ensure alignment with its retail and offi ce tenants
in terms of environmental objectives, the Group introduced
‘green leases’ for the fi rst time in 2009. At the end of 2012, 50%
of the Group’s active lease portfolio includes ‘green clauses’
compared to 32% as of December 31, 2011.
In 2012 the Group accelerated the progress towards
sustainable certifi cations for its entire portfolio and
development projects.
At the end of 2012, 43% of the Group’s standing shopping
centre portfolio(40) were “BREEAM In-Use” certifi ed,
corresponding to 16 shopping malls and over 1.1 million m²
GLA, vs. only four malls as of December 31, 2011. 88% of the
BREEAM In-Use certifi cates delivered to the Group’s assets
reached at least the “Very Good” level(41), compared to only 32%
for the European real estate market, demonstrating the superior
environmental performance of the Group’s assets despite the
diversity of its portfolio in terms of size, age and location.
For development projects, the Group obtained three
additional BREEAM certifi cations in 2012: two “Very Good”
scores for shopping centres El Faro in Badajoz and the
extension of Centrum Cerny Most in Prague, and one
“Excellent” score for the offi ce building Nouvel Air in Paris.
4. 2012 RESULTS
Other property services net operating result
(€22.7 million) came from property services companies in
France, Spain and Central Europe, an increase of €5.4 million
compared to 2011 due to the growth of leasing activity and the
increased size of the portfolio managed.
Other income (€7.1 million) was mainly composed of the
dividend paid by SFL (Société Foncière Lyonnaise) in April and
November 2012 on the 7.25% stake acquired by Unibail-
Rodamco in March 2011.
General expenses as a percentage of NRI decreased
to 7.5% in 2012 compared to 7.7% in 2011 (€91.8 million in
2012 compared to €89.6 million in 2011, after restatement of
+€3.3 million related to IAS19R). Excluding costs relating to
acquisitions, the -1.7% decrease of expenses to €85.2 million
in 2012 from €86.7 million in 2011 refl ects the results of
the Group’s cost effi ciency project initiated in 2010 and the
portfolio rationalisation.
Development expenses incurred for feasibility studies of
projects and non-completed deals amounted to €4.5 million
in 2012 (€5.2 million in 2011).
Recurring fi nancial result totalled €383.5 million,
including capitalised fi nancial expenses of €54.9 million
allocated to projects under construction. Net borrowing
expenses recorded in the recurring net result came to
€328.6 million in 2012, the €27.5 million increase compared
to 2011 resulting mainly from the increase of the debt.
The Group’s average cost of fi nancing came to 3.4% for
2012 (3.6% for 2011). Unibail-Rodamco’s refi nancing policy is
described in section “Financial Resources”.
Non-recurring fi nancial result amounted to
-€449.3 million in 2012, which breaks down as follows:
• -€214.3 million mark-to-market of derivatives, in
accordance with the option adopted by Unibail-Rodamco
for hedge accounting to recognise directly in the income
statement the change in value of caps and swaps;
• -€179.4 million mark-to-market of the ORNANE(42) issued
in 2009 until its repayment at the end of 2012;
• -€51.0 million mark-to-market of the ORNANE issued in
2012;
• -€7.2 million for amortisation of Rodamco debt marked to
market at the time of the merger;
• +€2.6 million of other minor items.
(40) In terms of gross market value, as of December 31, 2012.(41) For the “Management” score.(42) Net share settled bonds convertible into new and/or existing shares.

CONSOLIDATED FINANCIAL STATEMENTS
CORPORATE SUSTAINABILITY
BUSINESS REVIEW AND 2012 RESULTS
PORTFOLIO
UNIBAIL-RODAMCO - FINANCIAL REPORT 2012 28 • 29
Almost all the ORNANE(43) convertible bonds issued in
April 2009 were converted as at December 31, 2012, and
created 2,013,012 new shares and an increase of shareholders’
equity of €362.1 million.
Most of the ORAs(44) issued in 2007 have been converted.
Only 7,825 ORAs(45) were still in issue as at December 31, 2012.
The income tax expenses came from countries where
specifi c tax regimes for property companies(46) do not exist
and from activities in France which are not eligible for the
SIIC regime, mainly in the Convention & Exhibition business.
The income tax expenses amount takes into account the
impact of the recent changes in the tax environment in the
various regions where the Group operates, including the new
“Royal decree” in Spain related to deductibility of interest
expenses, which had no signifi cant impact on the Group’s tax
expenses in 2012.
Total income tax allocated to the recurring net result
amounted to -€16.7 million.
Corporate income tax allocated to valuation result and
disposals was a charge of -€119.3 million due mainly to the
variation of deferred taxes on assets’ fair value.
Non-controlling interests in the consolidated recurring
net result after tax amounted to €97.7 million (€90.8 million in
2011). Minority interests related mainly to CCIP’s share in Viparis
(€39.2 million) and to shopping centres in France (€57.9 million,
mainly Les Quatre Temps and Forum des Halles).
Net result-owners of the parent was a profi t of
€1,458.6 million in 2012. This fi gure breaks down as follows:
• €886.3 million of recurring net result (vs. €826.4 million in
2011, after restatement due to the early adoption of IAS 19R
with a negative impact of -€3.2 million on 2011 fi gures);
• €572.3 million of non-recurring result(47) (vs. €498.2 million
in 2011);
• 3,085,091 new shares were issued in 2012, further to stock
options exercised, ORNANE and ORA conversions and the
employees’ saving scheme.
The average number of shares and ORAs(48) in issue during
this period was 92,368,457.
Recurring Earnings per Share (recurring EPS) came to
€9.60 in 2012, representing an increase of +6.7% compared
to 2011.
These results refl ect good like-for-like operating performance
in all business activities, the successful delivery of a number of
prime development projects, decreasing average cost of debt
and continued cost controls.
5. POST-CLOSING EVENTS
On January 10, 2013, Unibail-Rodamco acquired a 50.01%
majority stake in the development project “Polygone Riviera”
(a shopping centre of 71,474 m² GLA with an expected delivery
in H2-2015) in Cagnes-sur-Mer (Nice region, France).
Unibail-Rodamco obtained a call option to acquire 29.99%
additional share (to be exercised from two years after opening
of Polygone Riviera) and granted Socri a put option for 29.99%
(exercisable up to two years after opening).
The expected total investment cost is €386 million
(including Unibail-Rodamco’s acquisition of the 50.01%
stake) and the target yield on cost on this project is 8%.
On January 21, 2013, the Group obtained the approval
from the French Anti-trust authority to control jointly the
mfi AG and Ruhr-Park companies. This approval had already
been obtained on December 18, 2012 from the German Anti-
trust authority.
(43) 2,766 remaining ORNANE have been reimbursed on January 2, 2013 at their nominal value.(44) ORA: “Obligations Remboursables en Actions” = bonds redeemable for shares.(45) Convertible into 9,781 shares.(46) In France: SIIC (Société d’Investissements Immobiliers Cotée).(47) Include valuation movements, disposals, mark-to-market of fi nancial instruments, impairment of goodwill or reversal of badwill and other non-recurring items.(48) It has been assumed here that the ORAs have a 100% equity component.

REPORT OF THE CHAIRMAN OF THE SUPERVISORY BOARD
LEGAL INFORMATION
FINANCIAL REPORT 2012 - UNIBAIL-RODAMCO 28 • 29
6. DIVIDEND(49)
The Group will propose to the Annual General Meeting
(AGM) to declare a dividend with respect to the year 2012 of
€8.40 per share, representing an increase of 5% compared to
2011 and a pay-out ratio of 88% of the recurring net result per
share and comparable to the one in 2011.
Subject to the approval from the AGM, the Group’s
shareholders will receive on June 3, 2013 the following
amounts per Unibail-Rodamco share:
i) €5.27 in cash paid from Unibail-Rodamco’s tax exempt
real estate activities (the “SIIC dividend”). Such dividend,
which corresponds to the distribution obligation under the
SIIC regime, will not be subject to the new additional 3% tax
payable by the company upon dividend distribution, but will
bear French withholding tax for both French and foreign
mutual funds (“OPCVM”) and will not benefi t from the 40%
allowance for French individual shareholders; and
ii) €3.13 per share in dividend distributed from Unibail-
Rodamco’s non-tax exempt activities (the “non SIIC
dividend”), for which the shareholders will have the
option to elect payment in either (i) new shares created
at a discount of 7%, or (ii) cash. When paid in shares , this
dividend will not be subject to the new additional 3% tax
payable by the company upon payment of the dividend. When
paid in cash, this dividend will generate a 3% tax expense
payable directly by the company upon dividend distribution.
Whether paid in cash or in shares, the “non SIIC dividend”
will not bear French withholding tax for either French or
foreign mutual funds (“OPCVM”) and may benefi t from the
40% allowance for French individual shareholders.
For investors which are not “OPCVM” or French individuals,
withholding tax may apply as usual, regardless of the tax
exempt or non-tax exempt origin of the distribution.
7. OUTLOOK
For 2013, the Group remains positive in its expectations
on rental income growth. In addition to the impact of new
deliveries from extensions and brownfi eld projects, this
growth should be driven by on-going strong fundamentals,
such as outperforming tenant sales, low vacancy, sustainable
occupancy cost ratios and good rental uplifts. The cost of
debt is also expected to be contained at low levels. In light of
the strong fundamentals outlined above, the Group sets a
recurring EPS growth target of at least 5% for 2013.
For the longer term, the Group expects to reach recurring
earnings per share of €14 by 2017. This objective, based on
the Group’s current 5-year plan, assumes (i) the successful
execution of the projects in Unibail-Rodamco’s development
pipeline, (ii) no major evolution of the Group’s current capital
structure, (iii) no signifi cant change in the macro-economic
conditions in Europe, (iv) no adverse tax law changes, (v)
maintaining the Group’s current pay-out ratio, and (vi) the
payment by the Group of the annual dividends in cash with
respect to the fi nancial years 2013 through 2016.
(49) The tax elements included in this section are not intended to constitute tax advice and shareholders should consult their own tax advisors.

CONSOLIDATED FINANCIAL STATEMENTS
CORPORATE SUSTAINABILITY
BUSINESS REVIEW AND 2012 RESULTS
PORTFOLIO
UNIBAIL-RODAMCO - FINANCIAL REPORT 2012 30 • 31
Development projects as at December 31, 2012Unibail-Rodamco’s development project pipeline amounted to €7.0 billion
as at December 31, 2012, corresponding to a total of 1.4 million m² Gross Lettable Area (GLA), to be re-developed or added to the standing assets portfolio. This amount is in line with the €6.9 billion development
pipeline as at December 31, 2011. A number of prime projects (including So Ouest, Confl uence and El Faro) were successfully delivered in 2012. Three large new projects representing circa 170,000 m² of GLA were
added to the pipeline in 2012. The Group retains signifi cant fl exibility on its development portfolio (56% of the total investment cost).
1. DEVELOPMENT PROJECT PORTFOLIO EVOLUTION
With the successful openings in 2012 of Confl uence,
El Faro and So Ouest shopping centres, Unibail-Rodamco
demonstrated its capacity to deliver a new generation of
large and attractive shopping centres offering to retailers and
visitors a unique retail experience.
Those openings will be followed in 2013 by, among others,
the Centrum Cerny Most extension and the Aéroville openings,
both with a “4 Star label”, differentiating concepts and new
offers of leisure and restaurants (the “Dining Experience”).
The extensions of Alma in Rennes and Toison d’Or in Dijon
are also expected in 2013.
These deliveries and other extensions, renovations and
restructurings demonstrate the Group’s ability to generate
profi table growth from its development projects.
In 2012, Unibail-Rodamco sourced additional promising
new projects to generate future value creation and growth.
Finally, construction works on “committed” projects are
progressing on schedule.
2. DEVELOPMENT PROJECTS OVERVIEW
The estimated total investment cost of the development
pipeline as at December 31, 2012 amounts to €7.0 billion(50).
This is stable in comparison with December 31, 2011
(€6.9 billion), as a result of the (i) new projects added to the
pipeline in H2-2012 and (ii) delivery of several projects.
The pipeline categories are as follows:
Brownfield Retail
Extension/Renovation
Office & Others
Extension/Renovation
Retail
Brownfield Office
& Others2,306 €Mn/
33%
1,986 €Mn/
28%
2,268 €Mn/
32%
484 €Mn/
7%
(50) Excluding mfi development projects, the company being consolidated under equity method by the Group as at December 31, 2012.

REPORT OF THE CHAIRMAN OF THE SUPERVISORY BOARD
LEGAL INFORMATION
FINANCIAL REPORT 2012 - UNIBAIL-RODAMCO 30 • 31
The €4.3 billion retail pipeline is split into brownfi eld
projects, which represent 53% of the retail pipeline, and
extensions and renovations, which make up the remaining
47%. This corresponds to the creation of 810,398 m² of GLA
and the redevelopment of 106,589 m² of GLA.
Development projects in the Offi ces & Other sector
amount to €2.8 billion. Brownfi eld projects, corresponding
to some 352,101 m2 of new GLA, represent 83% of this
investment. The remainder will be invested in redevelopment
or refurbishment of 137,274 m2 of existing assets(51).
3. A SECURED AND FLEXIBLE DEVELOPMENT PIPELINE
“Committed(52)” projects as at December 31, 2012
amount to €2.9 billion (vs. €2.9 billion December 31, 2011),
“Controlled”(53) projects represent €3.3 billion (vs. €2.7 billion
as at December 31, 2011) and “Secured Exclusivity”(54) projects
€0.9 billion (vs. €1.3 billion as at December 31, 2011).
Nine projects were transferred from the “controlled” to the
“committed” category following the start of works. It mainly
includes Toison d’Or and Alma (France) and Shopping City
Süd (Vienna) extension and refurbishment projects as well as
two offi ce projects (2-8 Ancelle and So Ouest Plaza (formerly
“Courcellor 1”), both in the Paris region.
“Controlled”
Projects
“Secured exclusivity” Projects
“Committed”
Projects
2,852 €Mn/
40%
902 €Mn/
13%
3,289 €Mn/
47%
Figures may not add up due to rounding
Of the €2.9 billion “committed” development pipeline,
€1.3 billion has been spent, with €1.5 billion still to be
invested over the next 3 years. Of this amount, €1.1 billion
has already been contracted.
Retail accounts for 70% of the “committed” pipeline. The
remaining 30% is primarily concentrated in the Offi ces in the
Paris region for an amount of €0.9 billion of which €0.4 billion
remains to be spent.
The “controlled” and “secured exclusivity” development
pipeline represents options to create signifi cant value for the
Group at a time when obtaining fi nancing for new construction
projects is challenging.
Pre-letting levels on “committed” projects in retail ensure
income visibility. The aggregate MGR pre-letting(55) of the retail
projects to be opened in the next six months is 83%, and 70%
for the retail projects to be delivered in the next 12 months,
including:
• Centrum Cerny Most extension to be delivered in
March 2013: 98%;
• Aéroville, to be opened in October 2013: 67%.
4. PROJECTS ADDED TO THE DEVELOPMENT
PIPELINE IN 2012
In the course of 2012, three large projects with a total
investment cost of ca. €748 million were added to the
development pipeline, including:
• Polygone Riviera, a 71,474 m² shopping centre project in
Cagnes-sur-Mer, near Nice in France in a partnership with
Socri and in which the Group holds a controlling stake.
The expected total investment cost is €386 million, including
Unibail-Rodamco’s acquisition of the 50.01% stake;
• a 73,979 m² GLA shopping centre in the centre of Wroclaw,
Poland’s 4th largest city with more than 600,000 inhabitants,
for which the land plot was bought. The expected total
investment cost is €216 million;
• a 25,810 m² extension in Carré Sénart, Paris region, for a
total expected investment cost of €146 million, following
the delivery in 2012 of Carré Sénart Shopping Park.
(51) m2 fi gures may not add up due to rounding.
(52) “Committed” projects: projects currently under construction, for which Unibail-Rodamco owns the land or building rights and has obtained all necessary administrative authorizations and permits.
(53) “Controlled” projects: projects in an advanced stage of studies, for which Unibail-Rodamco controls the land or building rights, but where not all administrative authorizations have been obtained yet.(54) “Secured exclusivity” projects: projects for which Unibail-Rodamco has the exclusivity but where negotiations for building rights or project defi nition are still underway.(55) Including signed Heads of Terms.

CONSOLIDATED FINANCIAL STATEMENTS
CORPORATE SUSTAINABILITY
BUSINESS REVIEW AND 2012 RESULTS
PORTFOLIO
UNIBAIL-RODAMCO - FINANCIAL REPORT 2012 32 • 33
5. INVESTMENTS IN 2012
See sections 2.1.5 and 2.2.3 of the “Business Review by
segment” for shopping centres and offi ces respectively.
6. DELIVERED PROJECTS IN 2012
Eleven projects, either brownfi eld projects or renovations/
extensions of existing assets, were delivered during 2012.
Three major shopping centres projects were successfully
delivered:
• the shopping centre Confl uence (53,288 m²), in Lyon, opened
in April 2012 and has welcomed more than 6.3 million visits
since opening (at the end of January 2013). The Confl uence
hotel in Lyon was delivered in March 2012;
• El Faro (43,286 m²(56)), in Badajoz, Spain, opened in
September 2012, with 3.4 million visits since its opening (at
the end of January 2013);
• the shopping centre So Ouest, 48,434 m², (Paris region)
opened in October 2012 (2.8 million visits since opening at
the end of January 2013).
The Carré Sénart Shopping Park (13,637 m²) was delivered
during the same period, further reinforcing the Carré Sénart
shopping centre, which already attracts circa 15 million visits
per year.
In addition, various renovation projects in several shopping
centres were delivered during 2012. These include projects in
Bonaire in Valencia (introduction of Primark), in Equinoccio in
Madrid, in La Maquinista in Barcelona with the creation of a
food and leisure offer and in Donauzentrum, in Vienna, with
the renovation of the entertainment centre.
Finally, the Group completed the redevelopment/
refurbishment of offi ces at Nouvel Air and 80 Wilson in the
Paris region, both delivered in 2012.
7. DELIVERIES EXPECTED IN 2013
Several projects are expected to be delivered at the
beginning of 2013, notably:
• the extension (2,138 m²) and renovation in Solna in
Stockholm;
• the renovation of Fisketorvet in Copenhagen;
• in Rotterdam, the renovation of Plaza offi ce areas and the
light refurbishment of retail and parking areas;
• So Ouest offi ce building (33,253 m² GLA), above the So Ouest
shopping centre in the Paris region.
Later in 2013, the following major deliveries are expected:
• the extension of Centrum Cerny Most in Prague, a 43,595 m²
GLA project (March 2013);
• Aéroville, a brownfi eld project with 84,640 m² GLA in the
Paris region (H2-2013);
• the extension of Alma (10,005 m² GLA) in Rennes and
La Toison d’Or (12,284 m² GLA) in Dijon (H2-2013);
• the renovation of Shopping City Süd in Vienna (H2-2013).
Finally, the refurbishment of the 34-36 Louvre building
in Paris, already 100% pre-let to Louis Vuitton Malletier, is
expected in Q1-2013.
8. PROJECTS OVERVIEW
(See table next page)
Apart from the mechanical effects of infl ation and
discounting or currency exchange effects, notably affecting
the projects denominated in SEK, estimated costs of
the outstanding projects have slightly increased since
December 31, 2011.
This is mainly due to some changes in scope, including
the Aupark renovation with an increase of 17,593 m² GLA in
the size of the project and modifi cations in the renovation
programme of Shopping City Süd.
(56) Unibail-Rodamco part; total complex GLA is 66,286 m².

REPORT OF THE CHAIRMAN OF THE SUPERVISORY BOARD
LEGAL INFORMATION
FINANCIAL REPORT 2012 - UNIBAIL-RODAMCO 32 • 33
Development projects – December 31, 2012
Developement projects(1) Business Country City Type
Total Complex GLA (m²)
GLA U-R scope of consolidation
(m²)
Cost to date(2)
U-R scope of consolidation
(€Mn)
Expected cost(3)
U-R scope of consolidation
(€Mn)
Expected Opening date(4)
U-R Yield on cost (%)
Project Valuation
Solna Renovation Shopping Centre Sweden Solna Extension/Renovation 2,138 m² 2,138 m² 32 32 H1 2013 Fair value
Fisketorvet Renovation
Shopping Centre Denmark Copenhagen Extension/Renovation237 m² 237 m² 30 36 H1 2013 Fair value
Rotterdam PlazaOffi ce & others Netherlands Rotterdam Redevelopment/
Refurbishment 16,025 m² 16,025 m² 12 20 H1 2013 Fair value
So Ouest Offi ces Offi ce & others France Paris Region Greenfi eld/Brownfi eld 33,253 m² 33,253 m² 174 205 H1 2013 Fair value
Centrum Cerny Most Extension
Shopping Centre Czech Rep. Prague Extension/Renovation43,595 m² 43,595 m² 105 150 H1 2013 Fair value
Alma Extension Shopping Centre France Rennes Extension/Renovation 10,005 m² 10,005 m² 43 96 H2 2013 Fair value
La Toison d’Or Shopping Centre France Dijon Extension/Renovation 12,284 m² 12,284 m² 29 85 H2 2013 Fair value
SCS Renovation Shopping Centre Austria Vienna Extension/Renovation 3,483 m² 3,483 m² 46 113 H2 2013 Fair value
Aéroville (5) Shopping Centre France Paris Region Greenfi eld/Brownfi eld 84,640 m² 84,640 m² 171 349 H2 2013 Fair value
Majunga Offi ce & others France Paris Region Greenfi eld/Brownfi eld 63,035 m² 63,035 m² 223 379 H1 2014 At cost
2-8 AncelleOffi ce & others France Paris Region Redevelopment/
Refurbishment 16,600 m² 16,600 m² 8 71 H1 2014 Fair value
Forum des Halles Rénovation
Shopping Centre France Paris Extension/Renovation15,069 m² 15,069 m² 3 133 H2 2014 Fair value
Taby Centrum Extension
Shopping Centre Sweden Täby Extension/Renovation28,427 m² 28,427 m² 196 319 H2 2014 Fair value
So Ouest PlazaOffi ce & others France Paris Region Redevelopment/
Refurbishment 40,182 m² 40,182 m² 32 181 H1 2015 At cost
Mall of Scandinavia
Shopping Centre Sweden Stockholm Greenfi eld/Brownfi eld100,438 m² 100,438 m² 181 614 H2 2015 At cost
Others 5,361 m² 5,361 m² 35 68
“Committed“ Projects 474,771 m² 474,771 m² 1,321 2,852 7.9%
Parly 2 Extension Shopping Centre France Paris Region Extension/Renovation 7,600 m² 3,800 m² 5 54 H2 2014 At cost
Polygone Riviera Shopping Centre France Cagnes-sur-Mer Greenfi eld/Brownfi eld 71,474 m² 71,474 m² 37 386 H2 2015 At cost
Aupark Extension-Renovation
Shopping Centre Slovakia Bratislava Extension/Renovation
17,593 m² 17,593 m² 0 79 H2 2015 At cost
Carré Sénart Extension
Shopping Centre France Paris Region Greenfi eld/Brownfi eld25,810 m² 25,810 m² 4 146 H2 2015 At cost
Trinity Offi ce & others France Paris Greenfi eld/Brownfi eld 47,750 m² 47,750 m² 6 293 H1 2016 At cost
Val Tolosa Shopping Centre France Toulouse Greenfi eld/Brownfi eld 85,731 m² 25,552 m² 10 114 H2 2016 At cost
Chodov Extension Shopping Centre Czech Rep. Prague Extension/Renovation 38,183 m² 38,183 m² 9 126 H2 2016 At cost
Oceania Shopping Centre Spain Valencia Greenfi eld/Brownfi eld 96,488 m² 96,488 m² 2 251 H1 2017 At cost
Wroclaw Shopping Centre Poland Wrocław Greenfi eld/Brownfi eld 73,979 m² 73,979 m² 21 216 H2 2017 At cost
Maquinext Shopping Centre Spain Barcelona Extension/Renovation 35,281 m² 35,281 m² 59 107 H2 2017 At cost
Triangle Offi ce & others France Paris Greenfi eld/Brownfi eld 83,532 m² 83,532 m² 9 516 Post 2017 At cost
Benidorm Shopping Centre Spain Benidorm Greenfi eld/Brownfi eld 53,939 m² 26,969 m² 38 76 Post 2017 At cost
Phare Offi ce & others France Paris Greenfi eld/Brownfi eld 124,531 m² 124,531 m² 54 914 Post 2017 At cost
Others 2,500 m² 2,500 m² 5 13
“Controlled” Projects 764,390 m² 673,441 m² 259 3,289 8% target
Bubny Shopping Centre Czech Rep. Prague Greenfi eld/Brownfi eld 59,823 m² 35,894 m² 1 116 Post 2017 At cost
Others 276,929 m² 222,256 m² 6 786
“Secured Exclusivity” Projects 336,752 m² 258,150 m² 7 902 8% target
Unibail-Rodamco’s Total Pipeline 1,575,913 m² 1,406,362 m² 1,588 7,044 8% target
Of which additional area 1,162,498 m²
Of which redeveloped area 243,863 m²
(1) Figures subject to change according to the maturity of projects.(2) Excluding fi nancial costs and internal costs capitalised.(3) Excluding fi nancial costs and internal costs capitalised. The costs are discounted as at December 31, 2012.(4) In the case of staged phases in a project, the date corresponds to the opening of the fi rst phase.(5) Aéroville cost to date and expected cost does not include the leasehold amounts paid after the opening of the shopping centre.

CONSOLIDATED FINANCIAL STATEMENTS
CORPORATE SUSTAINABILITY
BUSINESS REVIEW AND 2012 RESULTS
PORTFOLIO
UNIBAIL-RODAMCO - FINANCIAL REPORT 2012 34 • 35
Net Asset Value as at December 31, 2012Unibail-Rodamco’s EPRA triple Net Asset Value (NNNAV)(57) amounted
to €138.40 per share as at December 31, 2012, up by 5.9% from December 31, 2011. The increase in the NNNAV is the result of:
(i) an increase of €13.05 per share due to the revaluation of property and intangible assets, (ii) the contribution of €9.60 per share from the
Recurring Earnings Per Share of 2012 and (iii) the positive eff ect of other items of €0.32 per share, off set by: (i) the distribution of €8.00 per share in May 2012, (ii) the mark-to-market of debt and fi nancial instruments
of -€5.92 per share and (iii) the eff ect of the increase of the fully diluted number of shares of -€1.35.
The going concern NAV(58) (GMV based), measuring the fair value on a long term, on-going basis, came to €151.10 per share
as at December 31, 2012, up by 5.6% compared to €143.10 as at December 31, 2011.
(57) EPRA NNNAV (triple net net asset value): corresponds to the Going concern NAV per share less the estimated transfer taxes and capital gain taxes.(58) Going Concern NAV: the amount of equity per share needed to replicate the Group’s portfolio with its current fi nancial structure.
1. PROPERTY PORTFOLIO
Despite the evolving economic crisis, the European
commercial real estate investment market continued to
demonstrate liquidity. The 2012 investment volume of ca.
€112 billion(59) matched 2011 volumes, confi rming the sector’s
appeal for investors looking for secure cash-fl ows and yield.
The trend of diverging performance of prime and all other
asset classes has continued during 2012 for both offi ces and
retail assets. Regarding shopping centres, this trend is fuelled
by the economic outlook and austerity measures announced
in various countries, which is prompting consumers to be
more cautious. Retailers are responding to the pressure
on the consumer and the opportunity brought about by the
internet by continuing to be highly selective in the locations of
their key points of sale and fl agship stores. They continue to
favour the larger schemes characterized by high footfall and
high sales per square meter.
Consequently, the prime asset class characterised by secure
income with a solid risk premium over risk-free rates remains on
top of the shopping lists of active investors. Many investors are
actively looking for stable and secure yields and have signifi cant
amounts of equity allocated to European prime commercial real
estate, despite the continuing shortfall in supply of this product
category.
In parallel, bank fi nancing remains restricted especially for
non-prime assets, which combined with limited interest from
equity investors and deteriorating performance, negatively
affects non-prime valuations.
Unibail-Rodamco’s appraisers have scrutinized and
benchmarked the Group’s assets’ productivity and performance
trends (lease agreements signed, tenant sales, footfall, rental
uplift, occupancy cost ratio, etc.) to determine individual assets’
outlook. They have taken into account proven ability of these
assets to outperform national sales indices and their resilience
in the face of generally adverse economic trends in 2012.
The Group’s valuation refl ects broadly stable yields in some
core European markets whereas some regions saw yield
compression, for example in Central Europe, the Nordics and,
(59) Source: DTZ research.

REPORT OF THE CHAIRMAN OF THE SUPERVISORY BOARD
LEGAL INFORMATION
FINANCIAL REPORT 2012 - UNIBAIL-RODAMCO 34 • 35
to a limited extent, in Austria. In these regions, slight yield
compression observed was supported by solid rental growth,
cash-fl ow visibility and transactional activity.
The positive revaluation of the Unibail-Rodamco’s retail
assets results from strong fundamentals driving rental
growth in the portfolio, underpinned by the fact that most of
the Group’s retail standing assets consist of large schemes
with signifi cant footfall (more than 6 million visits per
year). The Group’s Minimum Guaranteed Rental uplift(60) of
+21.4% during 2012 compared to +19.4% in 2011 confi rms
continued strong retailer demand for top locations that offer
the best sales and footfall performance. The Group also
added signifi cant value in the non-like-for-like segment,
which includes the projects delivered in 2012 as well as the
investment properties under construction, through active
management and booking early successes in pre-letting in
the part of the pipeline valued at fair value.
In offi ces, a further moderate yield correction on top of the
one witnessed in June 2012 has led to a further but limited
negative revaluation.
The Convention and Exhibition portfolio valuation is stable
with a moderate positive revaluation on the basis of operating
performance and stable cash fl ow outlook.
Unibail-Rodamco’s asset portfolio including transfer
taxes grew from €25,924 million as at December 31, 2011
to €29,292 million as at December 31, 2012. On a like-for-
like basis, the value of the Group’s portfolio increased by
€1,014 million net of investments, i.e. +4.8% compared with
December 31, 2011.
(60) Minimum Guaranteed Rent uplift: the difference between new and old rents. This indicator is calculated only on renewals and relettings and not on vacant units relettings.
Asset portfolio valuation of Unibail-Rodamco (including transfer taxes) (a)
31/12/2011 31/12/2012Like-for-like change net of
investment – full year 2012 (b)
€Mn % €Mn % €Mn %
Shopping centres 19,803 76% 22,987 78% 982 6.0%
Offi ces 3,853 15% 3,892 13% (74) -2,.7%
Convention-Exhibition centres 1,901 7% 1,966 7% 26 1.4%
Services 367 1% 448 2% 80 21.8%
Total 25,924 100% 29,292 100% 1,014 4.8%
Figures may not add up due to rounding.(a) based on a full scope of consolidation, including transfer taxes and transaction costs (see §1.5 for Group share fi gures);The portfolio valuation includes:
• the appraised or at cost value of the entire property portfolio (100% when fully consolidated, Group share when consolidated under the proportional method);• the market value of Comexposium, a trade show organisation business, and of Unibail-Rodamco’s share investments in mfi and Ruhr-Park (Germany) and Zlote Tarasy complex in
Poland consolidated under the equity method.The valuations take into account the negative cash fl ows related to rents paid on concessions or leaseholds, which are accounted for as fi nancial debt in the consolidated balance sheet.The portfolio does not include shares of Société Foncière Lyonnaise and a €60 million bond issued by the owner of a shopping centre in France.(b) excluding currency effect and changes in the scope (acquisitions, disposals, set-up of joint-ventures and deliveries of new projects) during the full-year 2012 (computation based on exchange rates used the previous fi scal year), mainly related to:
• acquisitions of shopping centres: part of Sant Cugat (Barcelona/Spain), share investments in mfi , Ruhr-Park and Zlote Tarasy;• acquisitions of plots or units in Les Quatre Temps, Forum des Halles and Villabé in France, acquisitions of units in The Netherlands and a plot in Wroclaw (Poland);• disposals of retail assets: Wasquehal in France, Brink 100 in The Netherlands, Halmstad in Sweden;• disposal of plots in Alma in Rennes;• disposal of Tour Oxygène (Lyon);• Parly 2 shopping centre, due to the joint venture agreement signed with ADIA;• assets delivered in 2012, including mainly: Confl uence in Lyon (hotel and shopping centre), El Faro in Badajoz, Carré Sénart Shopping Park and So Ouest in Paris region.
The like-for-like change in portfolio valuation is calculated excluding changes above mentioned.

CONSOLIDATED FINANCIAL STATEMENTS
CORPORATE SUSTAINABILITY
BUSINESS REVIEW AND 2012 RESULTS
PORTFOLIO
UNIBAIL-RODAMCO - FINANCIAL REPORT 2012 36 • 37
Appraisers
Two international and qualifi ed appraisers, Jones Lang
LaSalle and DTZ, assess the retail and offi ce properties of the
Group. The appraisers have been appointed in 2010 as part
of Unibail-Rodamco’s policy of rotating appraisers once every
fi ve years.
The valuation process has a centralised approach, which
ensures that, on the Group’s internationally diversifi ed
portfolio, pan-European capital market views are taken into
account. Unibail-Rodamco has allocated properties across the
two appraisers, while ensuring that large regions are assessed
by both companies for comparison and benchmarking
purposes. The appraiser of Convention and Exhibition as well
as Services activities is PricewaterhouseCoopers. Assets
are appraised twice a year (in June and December), except
service companies, appraised yearly.
Appraiser Property location% of total portfolio
DTZ France/Netherlands/Nordic/Spain/Central Europe 49%
JLL France/Nordic /Spain/Central Europe/Austria 38%
PWC France 7%
At cost, under sale agreement or appraised by a third party 5%
100%
Figures may not add up due to rounding.
Fees paid to appraisers are determined prior to the
valuation campaign and are independent from the value of
properties appraised.
A detailed report, dated and signed, is produced for each
appraised property.
None of the appraisers has received fees from the Group
representing more than 10% of their turnover.
Valuation methodology
The valuation principles adopted are based on a multi-
criteria approach. The independent appraisers determine
the fair market value based on the results of two methods:
the discounted cash fl ow methodology as well as the yield
methodology. Furthermore, the resulting valuations are
cross-checked against the initial yield, value per square
meter and the fair market values established through actual
market transactions.
Appraisers have been given access to all information
relevant for valuations, such as the Group’s rent rolls,
including information on vacancy, break options, expiry
dates and lease incentives, performance indicators (e.g.,
footfall and sales where available), letting evidence and
the Group’s cash fl ow forecasts from annually updated
detailed asset business plans. Appraisers make their
independent assessments of current and forward looking
cash fl ow profi les and usually refl ect risk either in the cash
fl ow forecasts (e.g. future rental levels, growth, investment
requirements, void periods, incentives) or in the applied
required returns or discount rates.
Valuation scope
As at December 31, 2012, Unibail-Rodamco has given a
mandate to independent appraisers for the valuation of 95%
of the portfolio.
Investment Properties Under Construction (IPUC) for
which a value could be reliably determined, are required
to be accounted for at fair value and were assessed by
external appraisers.
IPUC are taken at fair value once management considers
that a substantial part of the project’s uncertainty has been
eliminated, such that a reliable fair value can be established.
Unibail-Rodamco uses generic guidelines to establish the
remaining level of risk, focusing notably on uncertainty
remaining in construction and leasing.
IPUC were valued using a discounted cash fl ow or yield
method approach (in accordance with RICS and IVSC
standards(61)) as deemed appropriate by the independent
appraiser. In some cases, both methods were combined to
validate and cross-check critical valuation parameters.
The following assets under construction continued to be
assessed at fair value as at December 31, 2012:
• So Ouest Offi ce (Paris region);
• Aéroville (Paris region);
• Centrum Cerny Most extension (Prague).
The Toison d’Or extension project is now also assessed at
fair value as at December 31, 2012.
Alma (Rennes) extension continued to be assessed at
their value and to be considered as part of the corresponding
standing asset.
(61) RICS: Royal Institution of Chartered Surveyors; IVSC: International Valuation Standards Council.
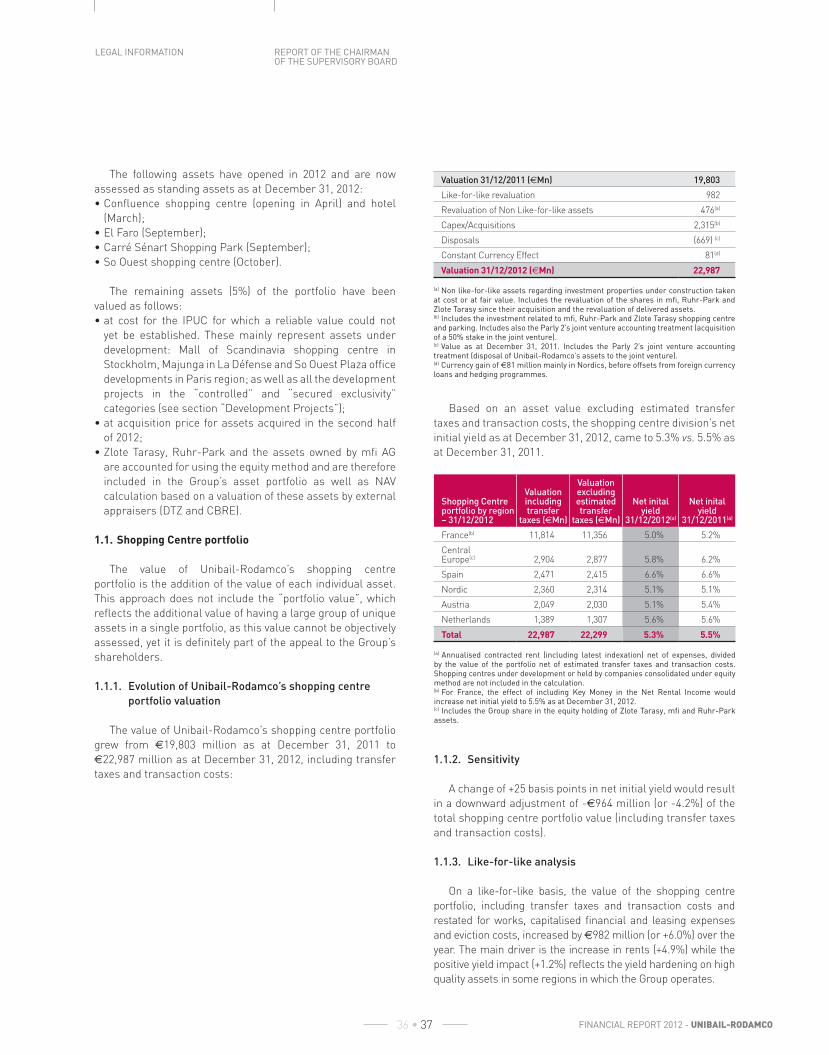
REPORT OF THE CHAIRMAN OF THE SUPERVISORY BOARD
LEGAL INFORMATION
FINANCIAL REPORT 2012 - UNIBAIL-RODAMCO 36 • 37
The following assets have opened in 2012 and are now
assessed as standing assets as at December 31, 2012:
• Confl uence shopping centre (opening in April) and hotel
(March);
• El Faro (September);
• Carré Sénart Shopping Park (September);
• So Ouest shopping centre (October).
The remaining assets (5%) of the portfolio have been
valued as follows:
• at cost for the IPUC for which a reliable value could not
yet be established. These mainly represent assets under
development: Mall of Scandinavia shopping centre in
Stockholm, Majunga in La Défense and So Ouest Plaza offi ce
developments in Paris region; as well as all the development
projects in the “controlled” and “secured exclusivity”
categories (see section “Development Projects”);
• at acquisition price for assets acquired in the second half
of 2012;
• Zlote Tarasy, Ruhr-Park and the assets owned by mfi AG
are accounted for using the equity method and are therefore
included in the Group’s asset portfolio as well as NAV
calculation based on a valuation of these assets by external
appraisers (DTZ and CBRE).
1.1. Shopping Centre portfolio
The value of Unibail-Rodamco’s shopping centre
portfolio is the addition of the value of each individual asset.
This approach does not include the “portfolio value”, which
refl ects the additional value of having a large group of unique
assets in a single portfolio, as this value cannot be objectively
assessed, yet it is defi nitely part of the appeal to the Group’s
shareholders.
1.1.1. Evolution of Unibail-Rodamco’s shopping centre
portfolio valuation
The value of Unibail-Rodamco’s shopping centre portfolio
grew from €19,803 million as at December 31, 2011 to
€22,987 million as at December 31, 2012, including transfer
taxes and transaction costs:
Valuation 31/12/2011 (€Mn) 19,803
Like-for-like revaluation 982
Revaluation of Non Like-for-like assets 476(a)
Capex/Acquisitions 2,315(b)
Disposals (669) (c)
Constant Currency Effect 81(d)
Valuation 31/12/2012 (€Mn) 22,987
(a) Non like-for-like assets regarding investment properties under construction taken at cost or at fair value. Includes the revaluation of the shares in mfi , Ruhr-Park and Zlote Tarasy since their acquisition and the revaluation of delivered assets.(b) Includes the investment related to mfi , Ruhr-Park and Zlote Tarasy shopping centre and parking. Includes also the Parly 2’s joint venture accounting treatment (acquisition of a 50% stake in the joint venture).(c) Value as at December 31, 2011. Includes the Parly 2’s joint venture accounting treatment (disposal of Unibail-Rodamco’s assets to the joint venture).(d) Currency gain of €81 million mainly in Nordics, before offsets from foreign currency loans and hedging programmes.
Based on an asset value excluding estimated transfer
taxes and transaction costs, the shopping centre division’s net
initial yield as at December 31, 2012, came to 5.3% vs. 5.5% as
at December 31, 2011.
Shopping Centre portfolio by region – 31/12/2012
Valuation including transfer
taxes (€Mn)
Valuation excluding estimated transfer
taxes (€Mn)
Net inital yield
31/12/2012(a)
Net inital yield
31/12/2011(a)
France(b) 11,814 11,356 5.0% 5.2%
Central Europe(c) 2,904 2,877 5.8% 6.2%
Spain 2,471 2,415 6.6% 6.6%
Nordic 2,360 2,314 5.1% 5.1%
Austria 2,049 2,030 5.1% 5.4%
Netherlands 1,389 1,307 5.6% 5.6%
Total 22,987 22,299 5.3% 5.5%
(a) Annualised contracted rent (including latest indexation) net of expenses, divided by the value of the portfolio net of estimated transfer taxes and transaction costs. Shopping centres under development or held by companies consolidated under equity method are not included in the calculation.(b) For France, the effect of including Key Money in the Net Rental Income would increase net initial yield to 5.5% as at December 31, 2012.(c) Includes the Group share in the equity holding of Zlote Tarasy, mfi and Ruhr-Park assets.
1.1.2. Sensitivity
A change of +25 basis points in net initial yield would result
in a downward adjustment of -€964 million (or -4.2%) of the
total shopping centre portfolio value (including transfer taxes
and transaction costs).
1.1.3. Like-for-like analysis
On a like-for-like basis, the value of the shopping centre
portfolio, including transfer taxes and transaction costs and
restated for works, capitalised fi nancial and leasing expenses
and eviction costs, increased by €982 million (or +6.0%) over the
year. The main driver is the increase in rents (+4.9%) while the
positive yield impact (+1.2%) refl ects the yield hardening on high
quality assets in some regions in which the Group operates.

CONSOLIDATED FINANCIAL STATEMENTS
CORPORATE SUSTAINABILITY
BUSINESS REVIEW AND 2012 RESULTS
PORTFOLIO
UNIBAIL-RODAMCO - FINANCIAL REPORT 2012 38 • 39
Shopping Centre – Like-for-like (LxL) change (a)
Full year 2012 €Mn % Rent impact Yield impact (b)
France 523 6.6% 5.9% 0.7%
Spain (57) -2.5% 0.7% -3.2%
Nordic 82 6.3% 4.3% 2.0%
Central Europe 247 13.9% 6.6% 7.3%
Netherlands 43 3.8% 3.4% 0.4%
Austria 143 7.8% 6.7% 1.1%
Total 982 6.0% 4.9% 1.2%
(a) Like-for-like change net of investments from December 31, 2011 to December 31, 2012.(b) Yield impact calculated using the change in potential yields (to neutralise changes in vacancy rates) and taking into account Key Money.
Like-for-like revaluations show an increasing
differentiation between assets above 6 million visits per year
(+6.7% over 2012) and those ones with less than 6 million
visits (+1.0% over 2012), in view of their increasingly divergent
operating performance.
1.2. Offi ce portfolio
1.2.1. Evolution of Unibail-Rodamco’s offi ce
portfolio valuation
The value of the offi ce portfolio increased to €3,892 million as
at December 31, 2012 from €3,853 million as at December 31,
2011, including transfer taxes and transaction costs:
Valuation 31/12/2011 (€Mn) 3,853
Like-for-like revaluation (74)
Revaluation of Non Like-for-like assets (24) (a)
Capex/Acquisitions 266 (b)
Disposals (138)
Constant Currency Effect 10 (c)
Valuation 31/12/2012 (€Mn) 3,892
(a) Includes: (i) investment properties under construction taken at cost or at fair value, (ii) assets recently delivered (Nouvel Air, 80 Wilson), (iii) the 7 Adenauer building in own use by the Group and (iv) the revaluation of the shares in Zlote Tarasy offi ces.(b) Includes the investment related to shares in the companies holding Zlote Tarasy offi ces.(c) Currency gain of €10 million in the Nordics, before offsets from foreign currency loans and hedging programmes.
The split by region of the total offi ce portfolio is the following:
Valuation of offi ce portfolio – 31/12/2012
Valuation(including transfer taxes)
€ %
France 3,374 87%
Nordic 207 5%
Netherlands 157 4%
Austria 40 1%
Central Europe 113 3%
Total 3,892 100%
For occupied offi ces and based on an asset value excluding
estimated transfer taxes and transaction costs, the Offi ce
division’s net initial yield as at December 31, 2012 increased
to 6.9%.
Valuation of occupied offi ce space – 31/12/2012
Valuation including transfer
taxes (€Mn) (a)
Valuation excluding estimated transfer
taxes (€Mn)
Net inital yield
31/12/2012 (b)
Net inital yield
31/12/2011 (b)
France 2,445 2,371 6.8% 6.4%
Nordic 188 184 7.2% 7.5%
Netherlands 120 113 8.3% 9.8%
Austria 40 39 6.6% 6.6%
Central Europe (c) 8 8 8.3% 8.1%
Total 2,801 2 716 6.9% 6.6%
(a) Valuation of occupied offi ce space as at December 31, 2012, based on the appraiser’s allocation of value between occupied / vacant space.(b) Annualised contracted rents (including latest indexation) net of expenses, divided by the value of occupied space net of estimated transfer taxes and transaction costs.(c) The investment in Zlote Tarasy offi ces is not included in this table.
1.2.2. Sensitivity
A change of +25 basis points in net initial yield would
result in a downward adjustment of -€119 million (or -3.1%)
of the total offi ce portfolio value (occupied and vacant spaces,
including transfer taxes and transaction costs).
1.2.3. Like-for-like analysis
The value of Unibail-Rodamco’s offi ce portfolio, including
transfer taxes and transaction costs, and after accounting
for the impact of works and capitalised fi nancial and leasing
expenses, decreased on a like-for-like basis by -€74 million
(or -2.7%) over the full-year 2012. This breaks down into a
+2.1% positive impact from rents and lettings and a negative
-4.8% due to changes in yields.
Offi ces – Like-for-like (LxL) change(a)
Full year 2012 €Mn % Rent impactYield
impact(b)
France (79) -3.3% 1.9% -5.3%
Nordic 7 3.5% 5.9% -2.4%
Netherlands (3) -2.2% 0.3% -2.5%
Austria 2 5.4% 5.3% 0.1%
Central Europe (0) -1.1% 0.8% -1.9%
Total (74) -2.7% 2.1% -4.8%
(a) Like-for-like change net of investments from December 31, 2011 to December 31, 2012.(b) Yield impact calculated using the change in potential yields (to neutralise changes in vacancy rates).

REPORT OF THE CHAIRMAN OF THE SUPERVISORY BOARD
LEGAL INFORMATION
FINANCIAL REPORT 2012 - UNIBAIL-RODAMCO 38 • 39
1.2.4. French Offi ce Portfolio
Unibail-Rodamco’s French offi ce portfolio split by sector
is the following:
French Offi ce portfolio by sector – 31/12/2012
Valuation (including transfer taxes)
€Mn %
Paris CBD 793 24%
Neuilly-Levallois-Issy 751 22%
La Défense 1,711 51%
Other 120 4%
Total 3,374 100%
For occupied offi ces and based on an asset value excluding
estimated transfer taxes and transaction costs, the French
Offi ce division’s yield as at December 31, 2012 came to 6.8%
refl ecting a 40 bps widening in yields during 2012.
Valuation of French occupied offi ce space – 31/12/2012
Valuation including transfer
taxes (€Mn) (a)
Valuation excluding estimated transfer
taxes (€Mn)
Net inital yield
31/12/2012(b)
Average price (€/
m2)(c)
Paris CBD 790 771 6.1% 13,659
Neuilly-Levallois-Issy 229 228 6.8% 5,788
La Défense 1,315 1,265 7.0% 7,055
Other 111 107 8.3% 2,454
Total 2,445 2,371 6.8% 7,633
(a) Valuation of occupied offi ce space as at December 31, 2012, as based on the appraiser’s allocation of value between occupied and vacant spaces.(b) Annualised contracted rent (including latest indexation) net of expenses, divided by the value of occupied space net of estimated transfer taxes and transaction costs.(c) Average price, excluding estimated transfer taxes, per square meter for occupied offi ce space as based on the appraiser’s allocation of value between occupied and vacant spaces. Average prices were restated for parking spaces with a basis of €30,000 per space for Paris CBD and Neuilly-Levallois-Issy and 15,000 euros for other areas.
1.3. Convention-Exhibition Portfolio
The value of Unibail-Rodamco’s convention-exhibition
centre portfolio is derived from the combination of the value
of each individual asset.
1.3.1. Valuation methodology
The valuation methodology adopted by Pricewaterhouse-
Coopers for the venues is mainly based on a discounted cash
fl ow model applied to total net income projected over the life
of the concession or leasehold (net of the amounts paid for
the concession or leasehold) if it exists, or otherwise over a
10-year period, with an estimate of the asset’s value at the
end of the given time period, based either on the residual
contractual value for concessions(62) or on capitalised cash
fl ows over the last year.
The discounted cash fl ow methodology has been adopted
for the Pullman-Montparnasse hotel asset and the Cnit-
Hilton hotel (both operated under an operational lease
agreement) and the Lyon Confl uence hotel (operated under a
management contract) as at December 31, 2012.
1.3.2. Evolution of the Convention-Exhibition
Centres valuation
The value of Convention-Exhibition centres and hotels,
including transfer taxes and transaction costs, grew to
€1,966 million(63) as at December 31, 2012:
Valuation 31/12/2011 (€Mn) 1,901(a)
Like-for-like revaluation 26
Revaluation of Non Like-for-like assets 1
Capex 38
Valuation 31/12/2012 (€Mn) 1,966(b)
(a) Of which €1,630 million for Viparis and €271 million for hotels.(b) Of which €1,691 million for Viparis and €275 million for hotels.
On a like-for-like basis, net of investments, the value
of Convention and Exhibition properties and hotels is up
€26 million, +1.4% compared with December 31, 2011.
Convention-Exhibition – Like-for-like change net of investment
Full year 2012
€Mn %
Viparis and others(a) 38 2.4%
Hotels (13) -5.1%
Total 26 1.4%
(a) Viparis and others includes all of the Group’s Convention-Exhibition centres (of which 50% of Palais des Sports).
Based on these valuations, the average EBITDA yield
on Viparis (and others) as at December 31, 2012 (Unibail-
Rodamco’s recurring operating profi t divided by the value
of Unibail-Rodamco’s assets, excluding estimated transfer
taxes) was 8.6% and increased by 85 basis points vs.
December 31, 2011. This is mainly explained by the seasonal
results pattern of the activity.
Confl uence Hotel in Lyon, previously assessed as an IPUC
at fair value, was delivered in the fi rst half-year of 2012 and
became a standing asset.
(62) For Porte de Versailles asset valuation, the expert has taken into account a probability of renewal of the concession of 22.5%.(63) Based on a full scope of consolidation, including transfer taxes and transaction costs (see §1.5 for Group share fi gures).

CONSOLIDATED FINANCIAL STATEMENTS
CORPORATE SUSTAINABILITY
BUSINESS REVIEW AND 2012 RESULTS
PORTFOLIO
UNIBAIL-RODAMCO - FINANCIAL REPORT 2012 40 • 41
1.4. Services
The services portfolio is composed of:
• Comexposium, a trade show organisation business;
• Espace Expansion, a property service company.
The services portfolio is appraised in order to include
at their market value all signifi cant intangible assets in the
portfolio and in the calculation of Unibail-Rodamco’s NAV.
Intangible assets are not revalued but maintained at cost or at
amortised cost on Unibail-Rodamco’s consolidated statement
of fi nancial position (subject to impairment test).
Comexposium was valued at €281 million (Group share)
as at December 31, 2012 by PricewaterhouseCoopers.
The value net of investment increased by +16.2% or
€39 million compared to December 31, 2011, refl ecting the
impact of minor acquisitions and the improved performance
of the company.
Espace Expansion and Rodamco Gestion have merged
effective January 1, 2012 and were valued at €167 million
as at December 31, 2012, following the appraisal conducted
by PricewaterhouseCoopers. This represents an increase
of €41 million or +32.5% compared to year-end 2011 due
to the increased cash fl ows of the company and size of the
portfolio managed.
1.5. Group share fi gures for the Property Portfolio
The fi gures above are based on a full scope of consolidation.
The following tables also provide the Group share level (in
gross market value):
Full scope consolidation Group share
Asset portfolio valuation – 31/12/2011 €Mn % €Mn %
Shopping centres 19,803 76% 18,299 77%
Offi ces 3,853 15% 3,850 16%
Convention-Exhibition centres 1,901 7% 1,167 5%
Services 367 1% 367 2%
Total 25,924 100% 23,684 100%
Asset portfolio valuation – 31/12/2012 €Mn % €Mn %
Shopping centres 22,987 78% 21,309 79%
Offi ces 3,892 13% 3,888 14%
Convention-Exhibition centres 1,966 7% 1,209 5%
Services 448 2% 448 2%
Total 29,292 100% 26,854 100%
Like-for-like change – net of investments - Full year 2012 €Mn % €Mn %
Shopping centres 982 6.0% 894 5.9%
Offi ces (74) -2.7% (74) -2.7%
Convention-Exhibition centres 26 1.4% 13 1.2%
Services 80 21.8% 80 21.8%
Total 1,014 4.8% 913 4.7%
Like-for-like change – net of investments – Full year 2012 – Split rent/yield impact
Rent impact %
Yield impact %
Rent impact %
Yield impact %
Shopping centres 4.9% 1.2% 4.8% 1.2%
Offi ces 2.1% -4.8% 2.1% -4.8%
Net Initial Yield 31/12/2012 31/12/2011 31/12/2012 31/12/2011
Shopping centres 5.3% 5.5% 5.4% 5.5%
Offi ces – occupied space 6.9% 6.6% 6.9% 6.6%

REPORT OF THE CHAIRMAN OF THE SUPERVISORY BOARD
LEGAL INFORMATION
FINANCIAL REPORT 2012 - UNIBAIL-RODAMCO 40 • 41
2. EPRA TRIPLE NET ASSET VALUE CALCULATION
The EPRA triple net Net Asset Value (NNNAV) is calculated
by adding to the consolidated shareholders’ equity (Owners of
the parent), as shown on the consolidated statement of fi nancial
position (under IFRS) several items as described hereafter.
2.1. Consolidated shareholders’ equity
As at December 31, 2012, consolidated shareholders’
equity (Owners of the parent) came to €12,903 million.
Shareholders’ equity (Owners of the parent) incorporated
net recurring profi t of €886.3 million, and a positive impact
of €572.3 million of fair value adjustments on property
assets and fi nancial instruments, as well as capital gain on
sales of properties.
2.2. Impact of rights giving access to share capital
Dilution from securities giving access to share capital was
computed when such instruments came in the money as at
December 31, 2012.
The debt component of the ORAs(64), recognised in the
fi nancial statements (€0.2 million) was added to shareholders’
equity for the calculation of the NNNAV. At the same time, all
ORAs were treated as shares of common stock.
In accordance with IFRS rules, fi nancial instruments
and the ORNANE(65) were recorded on Unibail-Rodamco’s
statement of fi nancial position at their fair value with the
impact of the change in fair value included in the income
statement and thus in the consolidated shareholders’ equity.
The ORNANE issued in 2009 has been almost fully
converted as at December 31, 2012(66) and therefore no
restatement of its fair value has been included in the NAV
calculation as at December 31, 2012. The conversion of the
ORNANE issued in 2009 led to the issue of 2,013,012 new
shares. The ORNANE issued in 2012 has not been restated
for the NNNAV calculation as it is “out of the money” as at
December 31, 2012 and therefore had no impact on the
number of shares.
The exercise of “in the money” stock-options and with
the performance criteria fulfi lled as at December 31, 2012,
would have led to a rise in the number of shares by 3,506,670,
generating an increase in shareholders’ equity of €421 million.
As at December 31, 2012, the fully-diluted number of shares
taken into account for the NNNAV calculation was 98,449,794.
2.3. Unrealised capital gains on intangible assets
The appraisal of property service companies and of the
operations (“fonds de commerce”) of Paris Nord Villepinte/
Palais des Congrès de Paris/Palais des Congrès de Versailles
and Issy-les-Moulineaux gave rise to an unrealised capital
gain of €284 million which was added for the NAV calculation.
The increase compared with December 31, 2011 mainly
comes from Comexposium and Espace Expansion.
2.4. Adjustment of capital gains taxes
In accordance with accounting standards, deferred tax
on property assets was calculated on a theoretical basis
on the consolidated statement of fi nancial position as at
December 31, 2012.
For the purpose of the EPRA NAV calculation, deferred taxes
on unrealised capital gains on assets not qualifying for tax
exemption (€943 million) has been added back. Goodwill booked
on the balance sheet as a result of deferred taxes was accordingly
excluded from the NAV for a total amount of €259 million.
For the calculation of the EPRA NNNAV, estimated taxes
actually payable should a disposal take place (€455 million)
were deducted.
2.5. Mark-to-market value of debt
In accordance with IFRS rules, fi nancial instruments
were recorded on Unibail-Rodamco’s statement of fi nancial
position at their fair value.
The fair value adjustment (€426 million) was added back
for the EPRA NAV calculation and then deducted for the EPRA
NNNAV calculation.
The value of the fi xed-rate debt on the balance sheet of the
Group is equal to the nominal value for the ex-Unibail debt
and the fair value of the ex-Rodamco debt at combination date
(June 30, 2007). Taking fi xed rate debt at its fair value would
have had a negative impact of €496 million. This impact was
taken into account in the EPRA NNNAV calculation.
(64) Bonds redeemable for shares.
(65) Net share settled bonds convertible into new and/or existing shares (ORNANE) – see Financial Resources note.(66) 2,766 remaining ORNANE have been reimbursed on January 2, 2013 at their nominal value.

CONSOLIDATED FINANCIAL STATEMENTS
CORPORATE SUSTAINABILITY
BUSINESS REVIEW AND 2012 RESULTS
PORTFOLIO
UNIBAIL-RODAMCO - FINANCIAL REPORT 2012 42 • 43
2.6. Restatement of transfer taxes and transaction costs
Transfer taxes and transaction costs are estimated after
taking into account the disposal scenario minimising these
costs: sale of the asset or of the company that owns it,
provided the anticipated method is achievable (which notably
depends on the net book value of the asset). This estimation is
carried out on a case-by-case basis on each individual asset,
according to the local tax regime.
As at December 31, 2012, these estimated transfer taxes
and other transaction costs compared to transfer taxes and
costs already deducted from asset values on the statement
of fi nancial position (in accordance with IFRS) came to a net
adjustment of €280 million.
2.7. EPRA triple Net Asset Value
Unibail-Rodamco’s EPRA triple Net Asset Value (owners of
the parent) thus stood at €13,621 million or 138.40 euros per
share (fully-diluted) as at December 31, 2012.
The EPRA NNNAV per share growth was 5.9% compared
with December 31, 2011.
Value creation during 2012 amounted to 15.70 euros per
share, adjusted for the €8.00 distribution paid out in May 2012.
The following tables show the calculation presented in
compliance with EPRA best practices recommendations. A bridge
from December 31, 2011 December 31, 2012 is also presented.

REPORT OF THE CHAIRMAN OF THE SUPERVISORY BOARD
LEGAL INFORMATION
FINANCIAL REPORT 2012 - UNIBAIL-RODAMCO 42 • 43
2.8. Going concern Net Asset Value
Unibail-Rodamco adds to the EPRA NNNAV per share estimated transfer taxes and effective deferred capital gain taxes resulting in a
Going concern NAV. This corresponds to the amount of equity needed to replicate the Group’s portfolio with its current fi nancial structure.
Going concern NAV stands at €151.10 per share as at December 31, 2012, an increase of +5.6% vs. December 31, 2011.
EPRA NNNAV calculation(all fi gures are Group share and in €Mn)
31/12/2011 30/06/2012 31/12/2012
€Mn €/share €Mn €/share €Mn €/share
Fully diluted number of shares 95,296,018 97,216,853 98,449,794
NAV per the fi nancial statements 11,636 11,693 12,903
ORA and ORNANE 170 210 0
Effect of exercise of options 291 453 421
Diluted NAV 12,097 12,356 13,324
include
Revaluation intangible assets 134 199 284
exclude
Fair value of fi nancial instruments 281 336 426
Deferred taxes on balance sheet 879 875 943
Goodwill as a result of deferred taxes (287) (259) (259)
EPRA NAV 13,105 €137.50 13,507 €138.90 14,718 €149.50
Fair value of fi nancial instruments (281) (336) (426)
Fair value of debt (183) (302) (496)
Effective deferred taxes (435) (428) (455)
Impact of transfer taxes estimation 253 263 280
EPRA NNNAV 12,459 €130.70 12,704 €130.70 13,621 €138.40
% of change over 6 months 2.9% 0,0% 5.9%
% of change over 1 year 2.9% 5.9%
Unibail-Rodamco also states the “going concern NAV” = EPRA NNNAV per share adding back transfer taxes and deferred capital gain taxes. It corresponds to the amount of equity needed to replicate the Group’s portfolio with its current fi nancial structure - on the basis of fully diluted number of shares.
Going Concern NAV calculation(all fi gures are Group share and in €Mn)
31/12/2011 30/06/2012 31/12/2012
€Mn €/share €Mn €/share €Mn €/share
EPRA NNNAV 12,459 12,704 13,621
Effective deferred capital gain taxes 435 428 455
Estimated transfer taxes 743 773 803
Going concern NAV 13,637 €143.10 13,905 €143.00 14,880 €151.10
% of change over 6 months 3.1% -0.1% 5.7%
% of change over 1 year 3.0% 5.6%

CONSOLIDATED FINANCIAL STATEMENTS
CORPORATE SUSTAINABILITY
BUSINESS REVIEW AND 2012 RESULTS
PORTFOLIO
UNIBAIL-RODAMCO - FINANCIAL REPORT 2012 44 • 45
Change in EPRA NNNAV and Going concern NAV between December 31, 2011 and December 31, 2012 broke down as follows:
Evolution of EPRA NNNAV and Going concern NAV EPRA NNNAVGoing concern
NAV
As at 31/12/2011, per share (fully diluted) €130.70 €143.10
Revaluation of property assets(1) 11.53 11.53
Retail 12.35
Offi ces (0.94)
Convention & Exhibition 0.12
Revaluation of intangible assets 1.52 1.52
Capital gain on disposals 0.17 0.17
Recurring net profi t 9.60 9.60
Distribution in 2012 (8.00) (8.00)
Mark-to-market of debt and fi nancial instruments (5.92) (5.92)
Variation in transfer taxes & deferred taxes adjustments (0.14) 0.60
Variation in number of shares (1.35) (1.78)
Other 0.28 0.28
As at 31/12/2012, per share (fully diluted) €138.40 €151.10
(1) Revaluation of property assets is €7.95 per share on like-for-like basis, of which €7.30 is due to rental effect and €0.65 is due to yield effect.

REPORT OF THE CHAIRMAN OF THE SUPERVISORY BOARD
LEGAL INFORMATION
FINANCIAL REPORT 2012 - UNIBAIL-RODAMCO 44 • 45
In 2012, the fi nancial markets were characterized by
generally improving conditions interrupted by periodic intervals
of high volatility due to macro-economic uncertainties and
the sovereign debt crisis. In this challenging context, Unibail-
Rodamco raised €4,559 million of medium to long-term funds
in the bond and bank markets at attractive conditions, thanks
to the strength of the Group’s balance sheet.
The fi nancial ratios stand at healthy levels: the Loan to
Value (LTV) ratio stands at 37% (in line with the LTV ratio as at
December 31, 2011) and the Interest Coverage Ratio (ICR) is
also almost stable at 3.5x (vs. 3.6x in 2011). The average cost
of debt for 2012 decreased to 3.4% (vs. 3.6% for 2011).
1. DEBT STRUCTURE AS AT DECEMBER 31, 2012
Unibail-Rodamco’s consolidated nominal fi nancial debt
as at December 31, 2012 increased to €11,034 million
(€9,749 million as at December 31, 2011). The increase
in debt is due primarily to the August 2012 acquisition of a
portfolio of assets in Germany and development pipeline
capital expenditures, with a number of projects successfully
delivered in 2012 or to be delivered in 2013.
The fi nancial debt includes €750 million of net share
settled bonds convertible into new and/or existing shares of
Unibail-Rodamco (ORNANE) for 100% of their nominal value.
The €750 million ORNANE was issued in September 2012 (see
section 1.2) while the previously outstanding €575 million
ORNANE issued in 2009 was repaid.
1.1. Debt breakdown
Unibail-Rodamco’s nominal fi nancial debt as at
December 31, 2012 breaks down as follows:
• €6,633 million in bonds, of which €6,133 million under the
Euro Medium Term Notes (EMTN) programme of Unibail-
Rodamco and €500 million under Rodamco Europe’s EMTN
programme;
• €750 million in ORNANE;
• €1,131 million in commercial paper (billets de trésorerie
and Euro Commercial Paper)(67);
• €2,520 million(68) in bank loans and overdrafts, including
€1,380 million in unsecured corporate loans, €1,130 million
in mortgage loans and €9 million in bank overdrafts.
No loans were subject to prepayment clauses linked to the
Group’s ratings(69).
Bank loans
and overdrafts
Short
term paper
Convertible
Bond
EMTN & Bonds6,633 €Mn/
60%
750 €Mn/
7%
1,131 €Mn/
10%
2,520 €Mn/
23%
The Group’s debt remains well diversifi ed with a
predominant and increased proportion of bond fi nancing, in
which the Group has a long track record.
1.2. Funds Raised
Medium to long-term fi nancing transactions completed in
2012 amounted to €4,559 million and include:
• the signing of €1,384 million medium to long-term credit
facilities or bank loans with an average maturity of 4.2 years
and an average margin(70) of 95 bps. This amount includes
the refi nancing of a €600 million syndicated credit facility
due in 2013, which was renegotiated and extended to
December 2017 in December 2012;
• the issue of three public EMTN bond issuances for a total
amount of €2,000 million with the following features:
• in March 2012: €750 million bond issue with a 3.00%
coupon and a 7-year maturity;
(67) Short term paper is backed by committed credit lines (see 1.2).(68) Figures may not add up due to rounding.(69) Barring exceptional circumstances (change in control).(70) Taking into account current rating and based on current utilization of these lines.
Financial Resources

CONSOLIDATED FINANCIAL STATEMENTS
CORPORATE SUSTAINABILITY
BUSINESS REVIEW AND 2012 RESULTS
PORTFOLIO
UNIBAIL-RODAMCO - FINANCIAL REPORT 2012 46 • 47
• in August 2012: €750 million bond issue with a 2.25%
coupon and a 6-year maturity;
• in October 2012: €500 million bond issue with a 1.625%
coupon and 4.7-year maturity. This is the lowest coupon
ever paid by Unibail-Rodamco for a public Euro benchmark;
• the issue of 2 private EMTN placements for a total amount of
€425 million, with a 3.196% coupon and a 10-year maturity.
In total €2,425 million was raised on the bond market in
2012 at an average margin of 99 bps over mid-swaps for an
average duration of 6.7 years versus 148 bps on average in
2011 for an average duration of 6.4 years;
• the issue of a €750 million ORNANE in September 2012
with a 0.75% coupon, a duration of 5.3 years and an exercise
price of €217.28 at issuance corresponding to a 35% issue
premium on the VWAP(71).
In addition, Unibail-Rodamco accessed the money
market by issuing commercial paper. The average amount
of commercial paper outstanding in 2012 was €989 million
(€559 million on average in 2011), including €964 million
of Billets de trésorerie and €25 million of Euro Commercial
Paper (maturity of up to 3 months). Billets de trésorerie were
raised over 2012 at an average margin of 4 bps above Eonia
and Euro Commercial Paper nearly fl at to Euribor.
As at December 31, 2012, the total amount of undrawn credit
lines came to €4,013 million(72) and the cash on-hand came to
€65 million as the Group uses a European cash pooling system
optimising the use of liquidity across the Group.
1.3. Debt maturity
The following chart illustrates Unibail-Rodamco’s debt as at
December 31, 2012 after the allocation of the committed credit
lines (including the undrawn part of the bank loans) by date of
maturity and based on the residual life of its borrowings.
0
1,000
2,000
3,000
4,000
5,000
More than 5Y4-5 Y3-4 Y2-3 Y1-2 Y-1 Y
0%
4%
11%
25%23%
37%
€Mn
About 85% of the debt had a maturity of more than 3 years
as at December 31, 2012 (after taking into account undrawn
credit lines).
The average maturity of the Group’s debt as at December 31,
2012, taking into account the unused credit lines improved to
4.9 years (versus 4.5 years as at December 2011).
Liquidity needs
Unibail-Rodamco’s debt repayment needs(73) for 2013 are
covered by the available undrawn credit lines. The amount of
bonds and bank loans outstanding as at December 31, 2012
and maturing or amortising within a year is €1,040 million
compared with €4,013 million(72) of undrawn committed credit
lines as at December 31, 2012.
1.4. Average cost of Debt
Unibail-Rodamco’s average cost of debt in 2012 decreased
to 3.4% for 2012 compared to 3.6% for 2011. This average cost
of debt results from low coupon levels achieved in 2012 on the
fi xed rate debt, the level of margins on existing borrowings,
the Group’s hedging instruments in place, the cost of carry
of the undrawn credit lines, and to a lesser extent the low
interest rate environment in 2012.
(71) Volume Weighted Average Price of Unibail-Rodamco share price, at the time of the issue.(72) Subsequently to this date, the Group cancelled €350 million of undrawn credit line due to its cost.(73) Excluding Commercial Paper’s repayment amounting to €1,131 million.

REPORT OF THE CHAIRMAN OF THE SUPERVISORY BOARD
LEGAL INFORMATION
FINANCIAL REPORT 2012 - UNIBAIL-RODAMCO 46 • 47
2. RATINGS
Unibail-Rodamco is rated by the rating agencies Standard
& Poor’s and Fitch Ratings.
Standard & Poor’s confi rmed its long-term rating “A” and
its short-term rating “A1” on June 28, 2012 and maintained
its stable outlook.
On March 23, 2012, Fitch confi rmed the “A” long term
rating of the Group with a stable outlook. Fitch also rates the
short-term issuances of the Group as “F1”.
3. MARKET RISK MANAGEMENT
Market risks can generate losses resulting from
fl uctuations in interest rates, exchange rates, raw material
prices and share prices. Unibail-Rodamco’s risk is limited
to interest rate fl uctuations on the loans it has taken out to
fi nance its investments and maintain the cash position it
requires, and exchange rate fl uctuations due to the Group’s
activities in countries outside the Euro-zone. The Group’s
exposure to equity risk is immaterial.
Unibail-Rodamco’s risk management policy aims to
limit the impact of interest rate fl uctuations on results,
while minimising the overall cost of debt. To achieve these
objectives, the Group uses derivatives, mainly caps and
swaps, to hedge its interest rate exposure through a macro
hedging policy. Market transactions are confi ned exclusively
to these interest rate hedging activities, which are managed
centrally and independently.
To manage exchange rate risk, the Group aims to limit
its net exposure by raising debt in local currency, by using
derivatives and by buying or selling foreign currencies at spot
or forward rates.
Due to its use of derivatives to minimise its interest
rate and currency risks, the Group is exposed to potential
counterparty defaults. The counterparty risk is the risk of
replacing the derivative transactions at current market rates
in the case of default.
3.1. Interest rate risk management
3.1.1. Interest rate hedging transactions
During 2012, interest rates came down in a deteriorating
macro-economic environment.
• after reviewing the interest rate exposure of the Group
as at December 31, 2011 and in particular following the
€500 million bond issued in December 2011 which has
been kept at a fi xed rate, the Group cancelled €500 million
of swaps in January 2012;
• in view of interest rates levels and of its hedging position,
Unibail-Rodamco restructured its portfolio of hedges in
2012:
• €5,500 million of existing swaps in nominal amounts have
been restructured or extended beyond 2016 to extend the
duration of the hedges of the Group,
• €400 million of swaps maturing in January 2014 were
cancelled,
• the Group entered into forward collars to hedge in
advance the years 2013 to 2016 for a notional amount of
€750 million and cancelled collars with a notional amount
of €750 million and €500 million covering 2013 and 2014
respectively.
Annual projection of average hedging amounts and fi xed rate debt over the next 5 years (€ million – as at December 31, 2012)
0
2,000
4,000
6,000
8,000
10,000
12,000
14,000
201720162015201420130.0
0.5
1.0
1.5
2.0
2.5
3.0
3.5
20172016201520142013
€Mn Average rate of swaps
(%)
Total capsTotal swapsTotal fixed rate debt
Average rate of macro swaps
The graph above shows:
• the part of debt which is kept at a fi xed rate;
• the hedging instruments used to hedge the variable rate
loans and fi xed rate debt immediately converted into variable
rate debt through the Group’s macro hedging policy.
Note that, Unibail-Rodamco does not classify in general
its fi nancial hedging instruments as a cash fl ow hedge.
As a result, any fair value changes in these instruments are
recognised in the income statement.
Rodamco Europe applied a cash fl ow hedge accounting
policy according to IFRS for some of its derivative instruments.

CONSOLIDATED FINANCIAL STATEMENTS
CORPORATE SUSTAINABILITY
BUSINESS REVIEW AND 2012 RESULTS
PORTFOLIO
UNIBAIL-RODAMCO - FINANCIAL REPORT 2012 48 • 49
3.1.2. Measuring interest rate exposure
As at December 31, 2012, net fi nancial debt stood at
€10,969 million, excluding partners’ current accounts and
after taking cash surpluses into account (€65 million).
The outstanding debt was hedged at 98% against an
increase in variable rates, based on debt outstanding as at
December 31, 2012 through both:
• debt kept at fi xed rate;
• hedging in place as part of Unibail-Rodamco’s macro
hedging policy.
Based on the estimated average debt position of Unibail-
Rodamco in 2013, if interest rates (Euribor, Stibor or Pribor)
were to rise by an average of 0.5%(74) (50 basis points) during
2013, the resulting increase in fi nancial expenses would
have an estimated negative impact of €4.4 million on the
2013 recurring net profi t. A further rise of 0.5% would have
an additional adverse impact of €5.8 million. Conversely, a
0.5% (50 basis points) drop in interest rates would decrease
fi nancial expenses by an estimated €4.4 million and would
impact 2013 recurring net profi t by an equivalent amount.
The anticipated debt of the Group is almost fully hedged for
2013, 2014 and 2015.
3.2. Managing and measuring currency risk exposure
The Group has activities and investments in countries
outside the euro-zone, primarily in Sweden. When converted
into euros, the income and value of the Group net investment
may be infl uenced by fl uctuations in exchange rates against
the euro. Wherever possible, the Group aims to match foreign
currency income with expenses in the same currency,
reducing the exchange effects on earnings volatility and net
valuation of the investment. Translation risks can be hedged
by either matching cash investments in a specifi c currency
with debt in the same currency, or using derivatives to achieve
the same risk management-driven goal. Currency risk during
the building period of pipeline investments is covered as early
as possible after signing of the actual building contract. Other
monetary assets and liabilities held in currencies other than
the euro are managed by ensuring that net exposure is kept
to an acceptable level by buying or selling foreign currencies
at spot or forward rates where necessary to address short
term balances.
Measuring currency exposure
Main foreign currency positions
Currency(€Mn) Assets Liabilities
Net exposure
Hedging Instruments
Exposure net of hedges
SEK 1,902 (524) 1,378 (142) 1,236
DKK 371 (219) 152 135 288
HUF 5 0 5 0 5
CZK 0 (88) (88) 0 (88)
PLN 103 0 103 0 103
Total 2,381 (831) 1,550 (7) 1,543
The main exposure kept is in Swedish Krona. A decrease of
10% in the SEK/EUR exchange rate would have a €112 million
negative impact on shareholders’ equity.
The sensitivity of the 2013 recurring result(75) to a 10%
depreciation in the SEK/EUR exchange rate is limited to
€6.0 million.
The SEK1,750 million credit line signed in April 2012
undrawn as at December 31, 2012 will hedge part of the SEK
balance sheet.
4. FINANCIAL STRUCTURE
As at December 31, 2012, the portfolio valuation
(including transfer taxes) of Unibail-Rodamco amounted to
€29,292 million.
4.1. Debt ratio
As at December 31, 2012, the Loan-to-Value ratio (LTV)
ratio calculated for Unibail-Rodamco stood at 37%, in line
with the level of 37% as at December 31, 2011.
4.2. Interest coverage ratio
The Interest Coverage Ratio (ICR) ratio for Unibail-
Rodamco came to 3.5x for 2012. It is in line with the solid
levels achieved in recent years and slightly decreased from
3.6x in 2011.
(74) The eventual impact on exchange rates due to this theoretical increase of 0.5% in interest rates is not taken into account; theoretical impacts of rise or decrease in interest rates are calculated above the 3-month Euribor as of December 31, 2012 of 0.187%.(75) The sensitivity is measured by applying a change in exchange rate to the net revenues in Swedish Krona (net rents – administrative and fi nancial expenses – taxes), based on a EUR/SEK exchange rate of 8.6625.

REPORT OF THE CHAIRMAN OF THE SUPERVISORY BOARD
LEGAL INFORMATION
FINANCIAL REPORT 2012 - UNIBAIL-RODAMCO 48 • 49
Financial ratios 31/12/2012 31/12/2011
LTV(1) 37% 37%
ICR(2) 3.5x 3.6x
(1) Loan-to-Value (LTV) = Net fi nancial debt / Total portfolio valuation including transfer taxes. Total Portfolio valuation includes consolidated portfolio valuation (€29,292 million as at December 31, 2012 versus €25,924 million as at December 31, 2011) + the valuation of Unibail-Rodamco’s 7.25% stake in Société Foncière Lyonnaise (€120 million as at December 31, 2012 versus €113 million as at December 31, 2011) + a €60 million bond issued by the owner of a shopping centre in France.(2) Interest Cover Ratio (ICR) = Recurring Ebitda / Recurring Net Financial Expenses (including capitalised interest); Recurring Ebitda being calculated as total recurring operating results and other income less general expenses, excluding depreciation and amortisation.
Those ratios show ample headroom vis-à-vis bank
covenants usually set at a maximum of 60% LTV and a
minimum of ICR of 2x, which the Group reports to the banks
twice a year.
As at December 31, 2012, 96% of the Group’s credit
facilities and bank loans allowed indebtedness amounting to
60% or more of the Group’s total asset value or of the value of
the asset of the borrowing entity, as the case may be.
There are no fi nancial covenants (such as LTV or ICR) in
the EMTN and the CP programs.

CONSOLIDATED FINANCIAL STATEMENTS
CORPORATE SUSTAINABILITY
BUSINESS REVIEW AND 2012 RESULTS
PORTFOLIO
UNIBAIL-RODAMCO - FINANCIAL REPORT 2012
1. Strategy and organisation 511.1. Materiality 511.2. Strategy 531.3. Implementation 531.4. Organisation and target-setting 531.5. Training 541.6. Research and development 541.7. Participation in external organizations 551.8. Awards and recognition 55
2. Corporate Governance, ethical conduct and risk management 562.1. Corporate Governance 562.2. Ethical conduct 562.3. Risk and crisis management 57
3. Environment 573.1. Environmental Management Systems (EMS) 573.2. Product labelling: Environmental certifi cation 593.3. Reporting methodology for environmental data 623.4. Climate change 643.5. Resource use 763.6. Health & safety and environmental risks
and pollutions 814. Stakeholders 83
4.1. Communities and local authorities 834.2. Customers 834.3. Tenants 844.4. Suppliers and contractors: Supply Chain
Management 854.5. Investors and shareholders 86
5. Philanthropy 865.1. Entrepreneurship 865.2. Education through Architecture 865.3. Social 87
6. Human resources 876.1. Reporting methodology 876.2. Employment and diversity 876.3. Career management 886.4. Training – UR Academy 886.5. Mobility 896.6. Employee Well-being 896.7. Remuneration 906.8. Employee relations 916.9. Organisational structure in 2012 92
7. 2012 Achievements & 2013-2020 objectives 937.1. 2012 Achievements 937.2. Long-term targets: a clear vision and objectives
through to 2020 968. Content indexes 97
8.1. EPRA Sustainability Performance Measures 978.2. GRI 3.1 CRESS - Application level B+ 998.3. Grenelle II, Article 225 107
9. Independent verifi er’s attestation and limited assurance report on social, environmental and societal information and related to the GRI Application Level B + self-declaration of the company 112
Corporate sustainability
50 • 51
REPORT OF THE CHAIRMAN OF THE SUPERVISORY BOARD
LEGAL INFORMATION
FINANCIAL REPORT 2012 - UNIBAIL-RODAMCO 50 • 51
Corporate sustainabilityWith a managed portfolio valued at €29.3 billion as of December 31, 2012,
Unibail-Rodamco has integrated its social and environmental responsibilities into its business model. Since 2007, the Group has published an annual corporate sustainability report which aims to provide a clear, objective picture of its goals and results. Since the 2010 reporting period, the corporate sustainability report has been integrated into the annual report to reflect the fact that sustainable practices are fully integrated into the
Group’s everyday operations. In 2012, the Group considered it was the right time to refi ne its long term sustainability vision and priorities by performing a materiality review. This
study identifi ed the issues that are most material to Unibail-Rodamco in order to sustain value for both its stakeholders and the company. This vision allows the Group to reallocate its eff orts and resources, to refi ne its long term targets and to transparently report against
its most material topics. In 2012, achieving -58%, the Group surpassed its long term target to cut CO2 emissions per visit by 50% in 2016 compared to its 2006 baseline. In this
favourable context, all targets have been reviewed and structured from a new 2012 baseline, in order to address the challenges the Group has to face by 2020. For more details
on 2012 progress, KPIs and the new long term targets please see pages 93-96. The environmental informations and indicators disclosed in the following pages cover
79.3% of the total gross market value at the Group’s assets portfolio aggregated as of december 31, 2012; and 100% of the Group’s salaries entities for social
informations (excluding Comexposium).
1. STRATEGY AND ORGANISATION
At Unibail-Rodamco, environmental best practice, social fairness
and responsible governance have a central role to play in the
construction and consolidation of long-term economic success.
1.1. Materiality
Since 2007, Unibail-Rodamco has developed a
comprehensive and ambitious sustainability strategy and
has demonstrated its capacity to succeed in all sustainability
fi elds. Tangible achievements have been accomplished, even
exceeding the Group’s initial long term targets set for the
2006 to 2016 reporting period. In 2012, the Group decided that
it was right time to re-consider its sustainability vision and
commissioned Jones Lang LaSalle’s Upstream Sustainability
Services to perform a materiality review of its sustainability
strategy. This would allow the Group to:
• understand and prioritise its sustainability impacts, risks
and opportunities;
• develop a sustainability vision for 2020 (this timeframe is
aligned to new European legislation);
• provide a hierarchy of the material issues – defi ning longer-
term objectives and shorter term targets;
• develop a sustainability strategy which focuses on the most
important topics for the real estate sector and for Unibail-
Rodamco’s business model, activities and portfolio spread;
• enable Unibail-Rodamco staff to clearly articulate its
sustainability vision and priorities to external stakeholders.
The materiality study has been conducted through six
complementary tests:
1. What value is Unibail-Rodamco deriving from its
current sustainability strategy?
2. What are the future compliance risks related to
European and French legislation?
3. What are the long term risks and opportunities that
could affect “business as usual”?
4. What are the current and future business challenges
and opportunities that the sustainability strategy needs
to address?
5 & 6. What do Unibail-Rodamco’s peers prioritise and where
do they innovate?
The conclusion of this study led to a new prioritisation of
issues detailed in the graph on page 52 and the new targets
in page 96, both refl ect the results of the materiality analysis
approved by the Management Board.

CONSOLIDATED FINANCIAL STATEMENTS
CORPORATE SUSTAINABILITY
BUSINESS REVIEW AND 2012 RESULTS
PORTFOLIO
UNIBAIL-RODAMCO - FINANCIAL REPORT 2012 52 • 53
Materiality matrix: Material issues to create sustainable value
The materiality matrix reveals 8 issues as a top priority for
Unibail-Rodamco to sustain value given the current business
strategy and activities.
The materiality review allowed Unibail-Rodamco to identify
the issues that are most material to sustain value for both
stakeholders and the company. This vision allows the Group
to reallocate its efforts and resources, to refi ne its long term
targets (page 96) and to transparently report against these
material topics.
The materiality matrix represents the important core
sustainability domains classifi ed according to the following:
• Horizontally: the impact on the value creation of the Group
determined through an alignment with business risks and
opportunities.
Three levels of impact:
• High: Key value creation opportunities: core priorities in line
with Unibail-Rodamco’s business levers for value creation;
• Middle: Actively manage risks and meet stakeholder
expectations: domains to master within Unibail-
Rodamco’s sustainability strategy, with a limited impact
on the Group’s value;
• Low: Less material, incorporate within reporting &
investor disclosure: issues with a low impact on the
Group’s value, to address through operational policies
and internal targets (maintained in the reporting).
• Vertically: the current management of these issues which
determines where new initiatives can be developed (upper
part of the graphic), and which issues are considered to
be under control and well managed (lower part).
Top material issues to create sustainable value(1)
ISSUES TO BE FURTHER MONITOREDISSUES TO MAINTAIN UNDER CONTROL
IMP
AC
T O
N T
HE
GR
OU
P V
AL
UE
Tenan
ts
Hum
an
rights
Crim
e
& S
afety
Was
te
Wat
er
Enhance
ment
of Public
Real
m
Climat
e
chan
ge
Labour
conditi
ons
in s
upply c
hain
Land d
egradat
ion
& p
ollutio
n
Bio
divers
ity
conse
rvat
ion
Sustai
nable
procu
rem
ent
Product
Lebelli
ng
Emplo
yees
Energy &
Car
bon
Heal
th
& S
afety
Bribery
and c
orruptio
nCom
munity
Wellb
eing
Tran
sport
Connect
ivity
& T
ransp
ort
Local E
conom
ic
Dev
elopm
ent Custom
ers &
Vis
itors
LO
WM
IDD
LE
HIG
H
(1) The top 8 issues which, given the current business Strategy and activities,
represent the biggest opportunities for creating value for our business
TOP 8 MATERIAL ISSUES IDENTIFIED

REPORT OF THE CHAIRMAN OF THE SUPERVISORY BOARD
LEGAL INFORMATION
FINANCIAL REPORT 2012 - UNIBAIL-RODAMCO 52 • 53
Rather than the reduction in water use or the enhancement
of biodiversity, the materiality analysis concludes that local
economic development is a dominant issue for Unibail-
Rodamco’s activities. The Group’s direct impact in this domain
is apparent, whether it is job creation or urban regeneration.
The operating activities of the Group are located in dense
cities across continental Europe, which means they have a
minor impact on biodiversity protection or water supply.
1.2. Strategy
Unibail-Rodamco’s new sustainability journey is now
structured around the conclusions of the materiality survey,
with the objective to give rise to a number of business benefi ts
in four main strategic domains:
1. Local economic development & community well-being:
creating opportunities for communities to prosper;
2. Energy & carbon, product labelling, and connectivity:
building resilience through innovation and efficient,
environmentally-sound buildings;
3. Tenant & Visitors: unlock opportunities for tenants and
customers to make sustainable decisions for revenue
growth, brand value and competitiveness;
4. Employees: a motivated workforce empowered to
deliver change.
For a more detailed vision on refi ned targets according to
these four strategic domains, please see page 96.
The Group’s sustainability strategy is consistent with its
desire to be a responsible corporate citizen communicating
transparently on its activities to all of its stakeholders. As a
signatory of the UN Global Compact, Unibail-Rodamco is
committed to promote the application of fundamental values
with respect to human rights, labour, the environment
and corruption.
1.3. Implementation
Unibail-Rodamco’s sustainability strategy is designed
to return reliable, quantifiable improvements in social,
environmental and economic performance over the long
term. Matters which are the sole responsibility of the Group
are managed through a system of in-house processes, targets
and key performance indicators that are fully integrated into
existing management processes. Their implementation is
verified with external audits and certification programmes.
Relevant management processes are in place at all stages
in the Group’s business cycle. For example:
• the due diligence process for acquisitions and investments
includes a complete audit of technical, regulatory,
environmental, and health and safety procedures; including
risks such as soil pollution;
• development projects are regularly reviewed through the
Design Guidelines to deliver the most demanding standards;
• each managed asset has a customised Environmental
Action Plan and performance targets, which are challenged
at least on an annual basis;
• the 4-person Internal Audit Department conducts regular
assessments of the management and compliance
processes in place at all of the Group’s business units. Final
audit reports are addressed to the Management Board and
to the departments involved in the audit;
• recruitment and career development procedures promote
equality and diversity and provide its employees with the
skills and opportunities required for rewarding careers.
When responsibility for obtaining results is shared with
other partners, the Group seeks to cooperate with those
partners in order to identify and work towards common goals.
In situations where results depend on factors that cannot be
controlled, such as weather conditions, the Group works both
to leverage opportunities and to identify and mitigate risks.
1.4. Organisation and target-setting
The management structure for sustainability issues is
designed to drive performance improvements from the top
down and the bottom up and ensure that the Group’s strategy
is informed by the needs and expectations of stakeholders.
• The Corporate Sustainability Committee (CSC) develops
the Group’s sustainability strategy, sets ambitious social
and environmental targets, and monitors results. The
6-member CSC meets at least three times a year and
reports on progress and objectives to the Management
Board and the Supervisory Board on a quarterly basis. The
committee is chaired by Catherine Pourre, the member of
the Management Board responsible for Unibail-Rodamco’s
environmental and social sustainability strategy and
activities; all but one of the members of the CSC report
directly to the CEO.
• The Environmental Performance Committee (EPC)
implements the Group’s sustainability strategy, motivates
regional teams, identifies and shares best practices and
tracks environmental performance to report results and
achievements on a quarterly basis. The committee is
chaired by François Cantin, the Group Director of Property
Maintenance, Purchasing & Sustainability. The committee
brings together the Group’s environmental sustainability
team and the regional environmental managers
regularly to share best practices and monitor progress.
Sustainability seminars gathering all EPC members are
held twice a year.
Economic, environmental and social targets are identified
and implemented in close cooperation with the Finance,
Leasing, Operating, Marketing and Human Resources
departments. Environmental targets are monitored and
managed by a four member team dedicated to corporate
environmental sustainability.

CONSOLIDATED FINANCIAL STATEMENTS
CORPORATE SUSTAINABILITY
BUSINESS REVIEW AND 2012 RESULTS
PORTFOLIO
UNIBAIL-RODAMCO - FINANCIAL REPORT 2012 54 • 55
Overall responsibility for achieving sustainability targets is
assigned to the relevant member of the Management Board,
and delegated to the managing director of each region,
who ensures that the necessary actions and processes are
integrated into their teams’ operating practices. The Group
has introduced financial incentives for sustainability
performance: from 2011, part of the variable remuneration
of the Regional Managing Director is based on sustainability
achievements. In 2012 this compensation policy has been
extended to the Group’s Management Team.
The shopping centre management team and asset
managers at each site play a particularly important role in
the Group’s sustainability strategy. They are responsible for
developing constructive relationships with tenants and local
communities and cooperating with suppliers to ensure that
day-to-day operations are as efficient and sustainable as
possible.
Sustainibility Governance
Vision
Policy
Target
Implement
Stimulate & Share
Report
Regions
6 members
Corporate
Sustainability
Committee
Catherine Pourre
Member of
the Management Board
8 members
Environmental
Performance
Committee
François Cantin
Group Director
of Sustainability
Supervisory
Board
Management
Board
Environmental
Responsibility
Employment
& Diversity
Stakeholders
& Shareholders
Members of the Corporate Sustainability Committee are
the following:
• Catherine Pourre, Member of the Management Board,
Chief Resources Offi cer, leading Sustainability and Human
Resources across the Group;
• Christophe Cuvillier, Member of the Management Board,
Chief Operating Offi cer;
• Olivier Bossard, Group Managing Director of Development;
• Simon Orchard, Managing Director of Spain;
• Pablo Nakhlé-Cerruti, Group Director of Communications
and Institutional Relations;
• François Cantin, Group Director of PMPS (Property
Maintenance, Purchasing & Sustainability).
1.5. Training
To ensure that the Group’s sustainability strategy and
processes are properly implemented, training sessions are
regularly organised for relevant employees and managers.
Details of sustainability training programmes are provided
alongside Group-wide training information and data in
section VI, Human Resources.
This year, the corporate sustainability team has delivered
its dedicated Group wide sustainability awareness training
program to regional teams in Spain, Central Europe, the
Netherlands and Austria.
A dedicated e-learning programme was also developed in
2012, in order to systematise awareness about sustainability
within the company. The e-learning will be rolled out to all of
the Group’s regions in 2013. Viparis implemented a specifi c
eco-charter composed of four topics and twenty commitments
to encourage the environmentally friendly behaviour of its
employees at work. The charter covers: waste selection,
energy savings, responsible use of paper and printing, and
effi cient business travel.
1.6. Research and development
The Group conducts sustainability research on a
case-by-case and project-by-project basis. Research
projects focus on environmentally-sound, energy-efficient
construction methods and operating practices for new
office and shopping centre developments. The Group’s
efforts to apply next-generation solutions offers a number of
benefits, including lowered operating costs throughout the
life-cycle of the building, “future-proofing” of the portfolio
relative to an increasingly tough regulatory environment,
and the commercial edge offered by recognised third-party
certifications.
In 2012 the Group created the UR Lab Research and
Development department. The role of the Lab is to defi ne the
Group’s innovation vision and support the implementation of
this policy by industrialising conception and design processes
and conduct pilot tests on active development projects.
2012 was an exceptional year in terms of innovation with
a number of initiatives launched by the UR Lab in order to
re-invent the customer experience in Unibail-Rodamco’s
malls and strengthen their leadership position in terms of
customer services and differentiation; the last changes in the
Group’s concepts are the following:
• the iconic shop front project, developed to welcome fl agship
stores by upgrading the overall height and quality of tenants’
shop fronts, thus promoting variety, innovation and design
excellence in the Group’s malls;

REPORT OF THE CHAIRMAN OF THE SUPERVISORY BOARD
LEGAL INFORMATION
FINANCIAL REPORT 2012 - UNIBAIL-RODAMCO 54 • 55
• the Dining Experience, a new initiative aimed at doubling
the space dedicated to dining in Unibail-Rodamco’s
shopping centres by offering a collection of the best local
restaurateurs and international food concepts.
1.7. Participation in external organizations
As Europe’s leading listed commercial real estate company,
Unibail-Rodamco has an opportunity and a responsibility to
encourage the industry as a whole to adopt more sustainable
operating practices.
The Group became a founding member of the International
Sustainability Alliance (ISA) in 2009. ISA is a global network
of leading real estate organisations dedicated to achieving
a more sustainable built environment by evaluating and
improving the performance and environmental impact of
commercial buildings.
Within the European Public Real Estate Association
(EPRA), Unibail-Rodamco has made a significant contribution
to the definition of consistent, shared key performance
indicators for the industry. The indicators reported in the 2012
Annual and Sustainable Development Report complies with
the draft Best Practice Recommendations that were issued
by EPRA in late 2010 and adopted in 2011 (see pages 97-98).
The Group is active in the EU Public Affairs Committee (EPAC)
of the International Council of Shopping Centres (ICSC)
and the sustainability committees of the French Council
of Shopping Centres (CNCC) and the French Property Real
Estate Association (FSIF).
In France, Unibail-Rodamco played an active role in the
government’s “Grenelle” consultation process to develop a
set of national environmental regulations. In 2012, Unibail-
Rodamco took part in RT 2012 defi nition for retail (French
thermal regulation for new buildings) and new legislation for
existing buildings (renovations for energy effi ciency between
2012 and 2020).
1.8. Awards and recognition
Unibail-Rodamco has been listed on a number of
prestigious SRI (Socially Responsible Investment) indexes in
2012:
• Dow Jones Sustainability Indexes (World since 2008;
Europe since 2010): the DJSI are global indexes tracking the
performance of the leading sustainability-driven companies
worldwide. Unibail-Rodamco has improved its score in each
annual assessment and scored 76 in 2012, moving further
away from the average score in the real-estate sector. With
a 76% score the Group is ranked in the top 5 per cent of
property companies and well ahead of the global average
industry score of 43%;
Unibail-Rodamco’s score compared to the industry average
20122011201020092008
+46%
since 2008
+19%
since 200836%
41%43%
45%43%
52%
Unibail-Rodamco’s total score Industry’s average total score
64%
70%
75% 76%
• FTSE4Good (since 2005): the FTSE4Good Index Series
is made up of companies that meet globally recognised
corporate responsibility standards. In 2012, Unibail-
Rodamco obtained an absolute score of 3.6/5 and a relative
score of 87/100;
• Advanced Sustainability Performance Eurozone Index
(since 2010): the ASPI Eurozone® tracks the performance of
companies in the Eurozone that are leaders in sustainability;
• Ethibel Sustainability Index (since 2011): the ESI
Excellence Europe include companies that show a
better than average performance in terms of corporate
sustainability and responsibility in their sector. Unibail-
Rodamco has been selected for inclusion in the Ethibel
EXCELLENCE Investment Register since 2011 and is being
monitored regarding its CSR profile since then;
• STOXX® Global ESG Leaders Index (since 2011): the STOXX
Global ESG Leaders index is composed of the leading
global companies in terms of environmental, social and
governance (ESG) criteria. Unibail-Rodamco is a member
of all three sub-indexes. In 2012, Unibail-Rodamco obtained
a score of 95.2/100;
• ECPI Index (since 2011): ECPI is a leading Rating and Index
company dedicated to ESG Research (Environmental, Social
and Governance). Unibail-Rodamco has been selected for
inclusion in the following ECPI® Indices: ECPI Developed
Ethical+ Equity, ECPI European Top 10 ECO Real Estate
Equity, ECPI Ethical EMU Equity, ECPI Global Eco Real
Estate and Building Equity.
The Group has also been recognised through diverse ESG
awards and rankings, including:
• Carbon disclosure project is an independent not-for-profi t
organisation working to drive a reduction in greenhouse gas
emissions for business and cities. Unibail-Rodamco actively
participates in this program through the disclosure of
specifi c pieces of information required by the organisation.
The Group achieved a 79 B score in 2012.
• GRESB (Global Real Estate Sustainability Benchmark).
Unibail-Rodamco was named a GRESB “Green Star” in

CONSOLIDATED FINANCIAL STATEMENTS
CORPORATE SUSTAINABILITY
BUSINESS REVIEW AND 2012 RESULTS
PORTFOLIO
UNIBAIL-RODAMCO - FINANCIAL REPORT 2012 56 • 57
2012 for the second consecutive year and ranked 5th out
of 40 companies in the EPRA peer group. Research is
conducted by the University of Maastricht.
• Ethisphere Institute’s World’s Most Ethical Companies.
Unibail-Rodamco has been confi rmed as one of the World’s
Most Ethical Companies, recognition of its commitment to
ethical leadership, compliance practices, and corporate
social responsibility.
• Oekom research AG is one of the world’s leading rating
agencies and provides the crucial head start in the segment
of sustainable investments. In 2012 the Group were ranked
2nd out of 24 real estate companies with a C+ (status: prime)
rating.
• Sustainalytics is an award-winning global responsible
investment research fi rm specialized in environmental,
social and governance (ESG) research and analysis. In 2012,
the Group were rated A-.
• Novethic Barometer. The Group ranked 3rd in the 2012
assessment of the environmental performance of buildings
owned and managed by French real estate companies;
• Universum. In 2012, young graduates from leading business
and engineering schools, ranked Unibail-Rodamco
number 1 in France for the “High level of responsibility
offered to recently- hired young graduates”.
Assets also received dedicated awards for their local
actions, showing their successful role in their local
community:
• the renovation of the Central Plaza complex in Rotterdam
won the Award for Sustainable Architecture 2012. The
prize is awarded annually by the Dutch Green Building
Council, which considered the renovation of Central
Plaza a “wonderful example of a large-scale, sustainable
renovation, where both quality and sustainable development
is deployed”;
• during the Siec12 event, Carré Sénart in France won the 2012
Sustainability award delivered by French National Council of
Shopping Centres (CNCC) for its exceptional sustainability
performance and engagement with its stakeholders;
• Rennes Alma in France won the annual innovation prize
awarded by the city authorities for its initiatives and
daily commitment with its tenants and visitors around
eco-mobility.
2. CORPORATE GOVERNANCE, ETHICAL CONDUCT
AND R ISK MANAGEMENT
Unibail-Rodamco’s Corporate Governance, ethical conduct and
risk management policies provide the stability and reliability
that are necessary for sustainable growth and performance.
2.1. Corporate Governance
Unibail-Rodamco has a two-tier governance structure with
a Management Board and a Supervisory Board. The Group
adheres and applies the best practice recommendations of
the French Afep-Medef Corporate Governance Code.
Please see the Legal Information chapter (pages 178-222)
for detailed information regarding:
• the composition and independence of the Supervisory
Board and its committees;
• the composition of the Management Board;
• the qualifi cations and professional experience of the
members of the Management and Supervisory Boards;
• the remuneration policy for members of the Management
and Supervisory Boards;
• the remuneration and fees paid to the members of the
Management and Supervisory Boards in 2012.
The Legal Information Chapter also contains information
about the Group’s Articles of Association, Corporate
Governance structure, general meetings of shareholders,
share capital and voting rights.
2.2. Ethical conduct
The Unibail-Rodamco Code of Ethics describes the values
and principles that every employee, manager and director
of the Group must respect and comply with at all times. In
particular, it covers:
• respect for dignity and for employees’ work, notably the
Group’s refusal to tolerate discrimination, harassment or
intimidation in any form;
• loyalty, integrity and conflicts of interest;
• respect for applicable laws and regulations, respect for
delegations of authority and signatures, the treatment of
confidential and proprietary information, the use of Unibail-
Rodamco’s assets and services, and the incident handling
procedure;
• operations on Unibail-Rodamco securities;
• ethical ways of doing business, notably with respect to the
purchase of goods and services, the rejection of corruption
and bribery, and environmental preservation.
The Code of Ethics is published on the corporate Internet and
intranet sites and is distributed to all employees, who are asked to
confirm their acceptance of its terms. It applies to all employees
and subsidiaries, and is available in English, French, German,
Polish, Czech and Swedish. The Group’s performance appraisal
system includes an assessment of each employee’s respect for
compliance procedures and codes of conduct. This information
is taken into account by the Group’s remuneration committees.
Training is provided to employees on compliance and ethical
business behaviour. An e-learning course on the contents of the
Code of Ethics has been developed and is being rolled out to
ensure that all employees in all regions understand how the Code
should be applied during day-to- day business operations.
The Unibail-Rodamco Compliance Book for Governance,
Organisation and Corporate Rules sets out the Group’s

REPORT OF THE CHAIRMAN OF THE SUPERVISORY BOARD
LEGAL INFORMATION
FINANCIAL REPORT 2012 - UNIBAIL-RODAMCO 56 • 57
operating and management rules. It systematically defines
the responsibilities, accountabilities and reporting lines that
are in place in all of the Group’s divisions and regions, as well
as for all core operational processes. The Compliance Book is
published on the corporate intranet site, and the Group Internal
Audit team conducts regular assessments of the compliance
and management standards in place across all business units.
Contracts signed with the Group’s suppliers include a
clause on ethical business behaviour. As well as explaining that
suppliers are expected to uphold the standards described in the
Group Code of Ethics, the clause describes the steps they should
take to report breaches, or possible breaches, of the code.
Employees and suppliers with concerns about compliance
or ethics are invited to contact the Group Compliance Officer,
who reports directly to the Chairmen of the Management
and Supervisory Boards. The Code of Ethics guarantees
the confi dentiality of employees and suppliers reporting
possible compliance breaches. The Group respects national
and European regulations on the reporting of compliance
breaches to financial authorities. Any breaches of the Group’s
compliance and ethical standards are met with appropriate
disciplinary or legal action.
Any material compliance breaches are reported to the
French Stock Market Authorities, Autorité des marchés
fi nanciers (AMF), which would then make this information
public via its Internet site. The Group did not report any
material breaches in 2012.
Unibail-Rodamco’s assets and operations are all
located in continental European Countries, where the legal
environment and business practices against corruption,
bribery, labour abuse, and environmental damages are
more binding and mature.
2.3. Risk and crisis management
The Report of the Chairman of the Supervisory Board
(pages 225-237) contains detailed information on Unibail-
Rodamco’s Internal Control System and its management
of key business risks. Relevant risks are identified through
a risk mapping process which focuses on key risks and
assesses them on the basis of probability and magnitude.
These risks are monitored through the Group’s Internal
Control System, which covers all activities of the Group in
all regions. The Internal Control System is in line with the
general principles of the internal control system reference
framework drafted by the AMF Working Group. The Group’s
risk assessment framework takes account of environmental,
social and governance risks, such as climate change, public
health and safety, and bribery and corruption. Please see
page 64-65 for information on climate change risks and
pages 81-82 for information on health and safety risks.
As part of the materiality study, Unibail-Rodamco’s long term
sustainability risks were determined, through their potential impact
on the Group’s assets and corporate value. By weighing potential
material issues against their associated level of risk, a fi nal hierarchy
of issues was revealed. The study identifi ed the most important
risks and the most relevant trends related to sustainability and the
property sector with clear indications of likelyhood, magnitude and
signifi cance. With this ranking, the Group is better able to identify
which issues carry the highest risk and the greatest impact on
Unibail-Rodamco’s corporate and asset value.
In 2012, a specifi c study was commissioned in order to assess
the Group’s exposure to the risk of fl oods and earthquakes for
the entire portfolio (including mfi , assets in Germany) it was
concluded that very few assets in Germany are located in areas
where such risks are probable.
3. ENVIRONMENT
Unibail-R odamco’s environmental strategy is designed to
reduce the environmental impact of each of the Group’s
managed assets and operations/activities and deliver a new
generation of ecologically-sound properties, while maintaining
the Group’s reputation for providing high-quality features and
anticipating services that reflect market demand.
3.1. Environmental Management Systems (EMS)
The Group’s environmental strategy is based on two
complementary environmental management systems (EMS)
which reduce the impact of its assets at every stage in their
lifecycle, from initial design through to daily operation. Unibail-
Rodamco’s EMS for sustainable design and construction is
called the “Sustainable Design Attitude” (SDA), while its EMS
for sustainable management and operations is known as the
“Sustainable Management Attitude” (SMA).
Two combined Environmental Management Systems to ensure the highest performance and certifications
Standing assets New Projects
Sustainable "Management" Attitude Sustainable “Design” Attitude
3 4 8 7
2 1 5 6
Construction Green Charter
Project review Detailed
Design Guidelines
Letting Green Lease &
Commissioning
Sourcing Investment sustainable
check-list
Review Environmental review
Policy & Targets
Track performance Quarterly report
Action plan Environmental action plan

CONSOLIDATED FINANCIAL STATEMENTS
CORPORATE SUSTAINABILITY
BUSINESS REVIEW AND 2012 RESULTS
PORTFOLIO
UNIBAIL-RODAMCO - FINANCIAL REPORT 2012 58 • 59
Best practices from the Sustainable Design Attitude are
leveraged to improve the Sustainable Management Attitude
and vice versa.
3.1.1. Sustainable Design Attitude (SDA): an EMS
for development projects
The SDA ensures that all development projects, whatever
their size or type, are designed in the most efficient way
for long-term success, in order to minimise environmental
impacts and ensure that each new project over 10,000 m²
obtains at least a BREEAM rating of “Very Good” or better.
For each pipeline project, the “Sustainable Design Attitude”
covers all four stages in the development process: sourcing;
design and planning; construction; and letting.
• Sourcing: sustainability and climate change risks are analysed
and evaluated during the Group’s due diligence process.
• Project reviews: at the design stage, each project is
assessed using the Group’s in-house “Design Guidelines”
to ensure that the building will be as sustainable as possible
and in preparation for its BREEAM assessment.
• Construction: the contractor agrees to abide by the Unibail-
Rodamco Considerate Construction Charter, which is
designed to reduce the social and environmental effects of
the construction process.
• Letting: a commissioning process is applied to ensure
that operational needs are met, building systems perform
efficiently and that maintenance suppliers and shopping
centre management staff are properly trained.
Since 2009 the Group’s “Design Guidelines” are applied
to all new development, renovation and extension projects.
The “Design Guidelines” aligned with BREEAM requirements
ensure that the Group’s projects, whatever their size or scope,
will be designed to ensure attractiveness, flexibility and the
most sustainable buildings with the lowest possible energy
consumption and GHG emissions levels. Best practices from
the “Design Guidelines” are also leveraged to improve the
energy efficiency of existing assets during major renovation
and extension projects.
Example of “Design Guidelines” requirements for new
developments include:
• close attention to structural elements that can affect
energy requirements (e.g. orientation, prevailing winds,
shell composition);
• an architectural design that maximises natural lighting
while minimising solar heat gains;
• the use of natural ventilation, along with a high-performance
building envelope to reduce the loss of heated and cooled air;
• integrated systems to produce renewable energy when
appropriate (e.g. wind turbines to ensure free-cooling,
geothermal energy to cool and heat large shopping centres);
• energy efficient equipment, coupled with an effective Building
Management System (BMS) that optimises operating hours
and conditions of each piece of technical equipment.
The “Design Guidelines” are updated each year on the basis
of new assumptions, technologies and operational feedback
from across the Group. New studies have been conducted to
enrich the Retail Guidelines with innovative solutions such as
geothermal systems, lighting, materials and a revolutionary
approach regarding sound design.
The SDA EMS ensures that the Group’s new retail and
office assets achieve respectively the highest possible
BREEAM ratings and HQE certifi cation. The SDA is central
to the work carried out by a number of departments,
including Development; PMPS (Property Maintenance,
Purchasing and Sustainability); Operating; Leasing; and
shopping centre management.
Since 2011 the Group’s construction charter is applied
to all new development projects in France. The worksite
charter describes the requirements and recommendations
aimed at optimising the worksite’s Environmental Quality
whilst minimising its forms of pollution both for the staff
of contractors working at the site and for the neighbouring
area and the natural environment. In every respect, it adopts
the requirements of the local town and country planning
regulations. It is also adapted to the requirements relating
to the BREEAM certifi cation. The constructor, as well as its
benefi ciaries is required to comply with the environmental
protection criteria and particularly that the worksite has a
low environmental impact. In 2013, the Group’s construction
charter will be come a prior obligation for the signature of
contracts for new works.
Examples of the topics included in the “Construction
Charter” topics:
• provide information to people living nearby;
• train and inform staff;
• risk management and the handling of hazardous products;
• ensure 50% of waste recycling by weight, and a clear
traceability of all waste managed;
• manage and limit noise, potential pollution of the soil, water
and air, visual pollution;
• limit the consumption of resources by monitoring them and
establishing reduction measures;
• limit traffi c disruptions…

REPORT OF THE CHAIRMAN OF THE SUPERVISORY BOARD
LEGAL INFORMATION
FINANCIAL REPORT 2012 - UNIBAIL-RODAMCO 58 • 59
3.1.2. Sustainable Management Attitude (SMA):
an EMS for existing assets
The SMA is the in-house environmental management
system (EMS) implemented across the whole of the managed
portfolio in Europe. This pragmatic and dynamic EMS ensures
that the Group is able to meet its annual and long term
targets and supports Unibail-Rodamco’s policy of continuous
improvement for each area covered by the Group’s policy,
including climate change, resource use and stakeholders.
The “Sustainable Management Attitude” covers four
stages in the management process: target setting; action
plan implementation; performance measurement; and
performance review.
• Group policy and targets: targets are set each year for each
managed asset in line with the Group’s long term targets
and with each of the sites individual specifications.
• Environmental action plan: an environmental action plan
covering key topics such as energy, CO2, water, waste,
transport and stakeholders is implemented and challenged
for each managed site.
• Quarterly and yearly report: performance is tracked and
analysed on a quarterly basis at site level, regional level and
Group level. A corrective action plan is implemented in case
of deviation.
• Sustainability review: the corporate sustainability team
holds sustainability reviews at least once a year for each
managed asset to check the status and progress and to
prepare the environmental action plan for the year to come.
The SMA EMS ensures that the Group’s retail assets
achieve the highest possible ratings under the BREEAM
In-Use scheme which has been chosen in 2011 for the main
assets in order to promote the environmental performance of
the Group’s running building policy towards visitors, tenants
and local communities. The SMA is fully integrated into
the daily operations of teams such as Operating; Leasing;
Marketing; PMPS (Property Maintenance, Purchasing and
Sustainability); and Shopping Centre Management.
The effective implementation of this in-house EMS has
now been verifi ed by an independent third party in each of
the countries where the Group operates with the completion
in 2012 of an external assessment in Poland, Spain, and the
Netherlands.
These two complementary EMS help the Group to:
• deliver the most sustainable and flexible projects with the
highest BREEAM scores;
• secure licence to operate for the Group’s development
projects (new developments and extensions);
• ensure that managed assets are operated efficiently from
a sustainable development and economical point of view;
• develop awareness and create a positive trend amongst
Unibail-Rodamco’s staff involved in the design, development,
management and redevelopment of the Group’s assets;
• ensure a high level of transparency and robustness to the
Group’s shareholders and investors.
3.2. Product labelling: Environmental certifi cation
Unibail-Rodamco relies on external certifi cation to validate
the environmental performance of its assets. The Group
deploys an active product labelling policy for both new
developments and standing assets thanks to its two in-house
Environmental Management Systems. This serves as
evidence to the Group’s stakeholders that Unibail-Rodamco’s
assets and responsible management processes are already
at the highest environmental standards available in the real
estate sector.
3.2.1. New development projects
As a confi rmation of the quality of the Sustainable Design
Attitude (SDA): Unibail-Rodamco seeks BREEAM certifi cation
for all of its new developments and extensions of more than
10,000 m2. BREEAM is the most widely used sustainable
construction certifi cation framework in Europe.
Unibail-Rodamco aims to achieve a rating of Very Good or
better for projects delivered from 2011 onwards. The Docks
76 project was the fi rst shopping centre in Europe to receive
BREEAM certifi cation. Since then, its teams have achieved a
number of other “fi rsts”:
• Tour Oxygen, Lyon, France: 1st offi ce tower certifi ed Very
Good in France (May 2010);
• Donauzentrum, extension, Vienna, Austria: 1st shopping
centre certifi ed in Austria (Very Good, May 2010);
• Lyon Confl uence, Lyon, France: 1st shopping centre certifi ed
Very Good in France (October 2010);
• SO Ouest, Levallois-Perret, France: 1st shopping centre
certifi ed Excellent in Europe (November 2010);
• Tour Majunga, La Défense, France: 1st high rise building
certifi ed Excellent in Europe (February 2011), Majunga received
2011 BREEAM Award at Ecobuild (highest score for a building
in Europe in 2011);
• Nouvel Air (former Issy Guynemer), Issy-les-Moulineaux,
France: 1st offi ce building certifi ed Excellent in France
(April 2012).
In 2012, the Group obtained 3 additional BREEAM
certifi cations: two “Very Good” scores for shopping centres
El Faro in Badajoz and the extension of Centrum Cerny Most
(CCM) in Prague; one “Excellent” score for the offi ce building
Nouvel Air (former Issy Guynemer) in Paris. Local certifi cation,
such as HQE certifi cation in France, High Environmental Quality
(the French standard certifi cation scheme for sustainable
constructions), is obtained when relevant.

CONSOLIDATED FINANCIAL STATEMENTS
CORPORATE SUSTAINABILITY
BUSINESS REVIEW AND 2012 RESULTS
PORTFOLIO
UNIBAIL-RODAMCO - FINANCIAL REPORT 2012 60 • 61
KPI: Environmental certifi cation of new developments
BREEAM – Retail
In 2012, 100% of the projects delivered were certifi ed BREEAM.
Site name City Group’s Region Project type
Date Performance rating
GLA (2012 m2 consolidated)
Certifi cation obtained Opening Level
Total score (out of 100%)
Docks 76 Rouen France New development 2009 2009 Good 47.3% 37,600
Donauzentrum Vienna Austria Extension 2010 2010 Very Good 63.2% 122,800
Confl uence Lyon France New development 2010 2012 Very Good 59.9% 53,500
So Ouest Levallois France New development 2010 2012 Excellent 73.1% 48,500
El Faro Badajoz Spain New development 2012 2012 Very Good 57.4% 43,300
Centrum Cerny Most Prague Central Europe Extension 2012 2013 Very Good 58.3% 51,800
Group’s average score Total m²
Very Good 59.9% 357,500
BREEAM – Offi ces
Site name City Group’s Region Project type
Date Performance ratingTotal fl oor space
according to consolidation (m²)
Certifi cation obtained Opening Level
Total score (out of 100%)
Issy Guynemer Nouvel Air
Paris France Refurbishment2012 2012 Excellent 70.6% 47,000
Majunga Paris la Defense France New development 2011 2014 Excellent 77.4% 69,500
HQE – Offi ces
Site name CityGroup’s Region Project type
Date Performance ratingTotal fl oor space
according to consolidation (m²)
Certifi cation obtained Opening Level
Energy label
Le Wilson 2 Paris region France Refurbishment 2012 2012 HQE THPE 23,100
So Ouest Paris region France Refurbishment 2010 2013 HQE BBC 37,339
Majunga Paris la Defense France New development 2011 2014 Passport Excellent HPE 69,500
Courcellor 1 (So Ouest Plaza)
Paris region France Refurbishment2012 2014 HQE BBC 45,327
3.2.3. Standing assets
In 2011, the Group extended its environmental certifi cation
policy to existing managed assets. Unibail-Rodamco aims to
obtain a BREEAM-In-Use certifi cation for at least 80% of its
shopping centres (managed assets – in m²) by 2016, with a
minimum of “Very Good” for the “Building Management” score.
In 2012 the Group came closer to achieving its goal in
achieving sustainable certifi cations for its entire managed
portfolio. At the end of 2012, 34% (in m² consolidated GLA ) and
43% (in terms of gross market value) of the Group’s standing
shopping centre portfolio were certifi ed “BREEAM In-Use”.
12 shopping centres were certifi ed and 4 certifi cations already
obtained in 2011 were renewed. At the end of 2012, the Group
had 16 shopping malls and consolidated over 1 million m²
GLA under BREEAM In-Use certifi cation.
88% of the BREEAM In-Use certifi cates delivered to the
Group’s assets reached at least the “Very Good” level for the
“Management” score, compared to only 32% for the Real
Estate European market (source: BREEAM In-Use Fact Sheet
– November 2012), confi rming the superior environmental
performance of the Group’s assets despite the diversity of the
portfolio in terms of size, age and location.

REPORT OF THE CHAIRMAN OF THE SUPERVISORY BOARD
LEGAL INFORMATION
FINANCIAL REPORT 2012 - UNIBAIL-RODAMCO 60 • 61
KPI: Environmental certifi cation of standing assets
BREEAM In-Use – Retail per region
RegionManaged portfolio
Total 2012 consolidated
m² GLA
Assets certifi ed Surface certifi ed
Name of assetsin number in %
2012 consolidated
m² GLA %
Austria 3 305,000 1 33% 122,800 40% Donauzentrum
Central Europe 5 330,900 3 60% 191,700 58% Arkadia, Galeria Mokotov, Chodov
France 32 1,306,000 7 22% 467,000 36%Carré Sénart(1), Docks 76(1), Part Dieu,
Rivétoile, 4 Temps, Vélizy 2, Cnit
Spain 16 620,000 4 25% 250,200 40%La Vaguada(1), Parquesur,
La Maquinista, Splau
Netherlands 5 281,900 0 0% 0 0% /
Nordics 8 344,300 1 13% 54,200 16% Nacka Forum(1)
Total Group 69 3,188,100 16 23% 1,085,900 34%
(1) Four assets certifi cated in 2011, for which renewed certifi cates delivered by BRE in 2012.
BREEAM In-Use – Retail total Group
2011 2012 Cumulated end 2012
Number of assets certifi cated 4 12 16
Surface certifi cated (m² GLA) 207,800 878,100 1,085,900
Average score ‘Asset rating’ 50.04% – Good 60.45% – Very Good 57.85% – Very Good
Average score “Building Management” 52.16% – Good 61.11% – Very Good 58.87% – Very Good
BREEAM In-Use – Offi ces
Adenauer, the Group’s headquarters in Paris, is the fi rst offi ce building within continental Europe to have been rated Excellent for
both the Asset and Management parts of the BREEAM In-Use International pilot scheme. The Group aims to obtain environmental
certifi cation (HQE and/or BREEAM) for at least 80% of the managed Offi ces portfolio by 2016 (in m²).
2011 2012 Cumulated end 2012
Number of assets certifi cated 0 1 (7 Adenauer) 1
Total fl oor area according to consolidation (m²) 0 12 100 12 100
Average score “Asset rating” / 71% – Excellent 71% – Excellent
Average score “Building Management” / 79% – Excellent 79% – Excellent
Breakdown of BREEAM In-Use certifi cations by rating (1)
European real estate sector
Acceptable
6%Excellent
8%
Very Good
24%
Good
26%
Pass
36%
Only
32% ≥ Very Good
Unibail-Rodamco (2)
Good
12.5%
Excellent
12.5%
Very Good
75%
87,5 % ≥ Very Good
(1) Source: BREEAM In-Use Fact Sheet - November 2012. BREEAM In-Use “management” certifi cation.(2) 4 assets certifi ed in 2011, 12 assets certifi ed in 2012.

CONSOLIDATED FINANCIAL STATEMENTS
CORPORATE SUSTAINABILITY
BUSINESS REVIEW AND 2012 RESULTS
PORTFOLIO
UNIBAIL-RODAMCO - FINANCIAL REPORT 2012 62 • 63
3.3. Reporting methodology for environmental data
The Group uses a variety of tools, processes and indicators
to monitor the performance of the assets that it owns and
manages. They serve to structure the Group’s environmental
management approach, track results, and inform third-
parties about performance.
Unibail-Rodamco continuously improves its environmental
reporting tools and processes in order to fine-tune the quality
and accuracy of its consolidated data. This enables the Group
to manage its data collection processes more efficiently,
track and analyse performance at all levels (site, region,
Group) on a regular basis, assess results against objectives,
and implement suitable corrective measures.
3.3.1. Description of environmental key performance
indicators (KPIs) and adherence to external
reporting frameworks
Environmental Key Performance Indicators (KPIs) covering
climate change and resource use are tracked for the entire
Group’s managed assets. Defi nitions of each KPI are provided
alongside the relevant data tables on the following pages.
The 2012 Annual and Sustainable Development Report
fully complies with EPRA Best Practices Recommendations
(BPR) on Sustainability Reporting and with the Application
level B+ of the Global Reporting Initiative Construction &
Real Estate Sector Supplement reporting framework (GRI3.1
CRESS published in 2011). Unibail-Rodamco received the
EPRA Gold Award with the best score in 2012 for compliying
its 2011 reporting with the EPRA Sustainability BPR. GRI
and EPRA content indexes are published on pages 97-106 of
this report.
In 2012, the Group introduced additional information and
KPIs to ensure compliance with the new French regulation
Grenelle II, Article 225 regarding mandatory and transparent
communication for companies on social and environmental
concerns (42 items). A specifi c content table “Article 225” is
published on pages 107-110.
3.3.2. Reporting values
Data is reported using absolute values (energy and
water consumptions, CO2 emissions, quantities of waste) or
normalised values (to show efficiency and a comparative trend).
In addition to the standard intensity that gives the ratio
between environmental information and the corresponding
floor space (energy, CO2 emissions, water/square metre),
Unibail-Rodamco promotes indicators that reflect the
intensity of use related to the building’s specific activity.
For standard intensity indicators, denominators (square
metres) are defined as:
• for Shopping Centres, areas of mall and common parts
accessible to public, and total GLA to which common
utilities (energy, water) are provided;
• for Offices, total floor area.
For intensity of use indicators, denominators are adapted
to each business unit:
• for Shopping Centres, the annual number of visitors which
is monitored by a footfall counting system (i.e. energy, CO2
emissions, water /visitor);
• for Offi ces, the number of occupants during the period
calculated by multiplying the occupation rate (sum of
occupied rented areas divided by the total number of areas
for rent in the building) with the maximum capacity and
number of working stations in the building (i.e. energy, CO2
emissions, water/occupant);
• for Convention & Exhibition, the annual sum of square
meters occupied during days when the venues are opened
to the public (i.e. energy, CO2 emissions /square meter DOP).
3.3.3. Reporting scope
Environmental indicators cover Shopping Centres,
Convention & Exhibition venues and Offi ces managed in 2012
by Unibail-Rodamco that represent 79.3% of the total gross
market value of the portfolio aggregated as of 2012. The Group
reports on the environmental performance of assets that are
under its operational management, where data on energy
efficiency and resource use can be measured and verified. In
2012, Unibail-Rodamco reported energy data for 100% of its
managed assets (all sectors combined), water data for 100%
of its shopping centres and for 93% of offices, and waste data
for 94% of its shopping centres.
Environmental KPIs are reported using two scopes:
• “All assets”, used to report the value of an indicator for the
year in question. This scope includes all assets that were
managed by the Group for the whole of the year. Assets which
enter the managed portfolio during a given year through
acquisition, construction or the delivery of a management
mandate are included in the scope the following year on a
full-year basis, or in the current given year if and only if all
complete data for the whole running year are available;
• “Like-for-like”, used to show the change in an indicator
over time at a constant portfolio scope (notably in terms
of the assets which are monitored). This scope includes
assets that were managed by Unibail-Rodamco over the
whole of the two-year comparison period. To assess the
positive impact of its management policy at the earliest
opportunity, Unibail-Rodamco ensures that the like-for-like
scope for year (Y+1) includes any site acquired in year Y and/
or managed as from year (Y), if and only if a complete set of
data is available for the full year (Y).

REPORT OF THE CHAIRMAN OF THE SUPERVISORY BOARD
LEGAL INFORMATION
FINANCIAL REPORT 2012 - UNIBAIL-RODAMCO 62 • 63
3.3.4. Changes in reporting scope
Changes in reporting scope may occur as a result of the
start or end of a management mandate; acquisitions or
disposals of assets; development of new assets or major
renovations and extensions.
The following rules are applied to reflect these situations:
• for property management mandates ending and for
disposals occurring during the rolling year (Y), all
corresponding data for the rolling year (Y) are excluded;
• for property management mandates starting and for
acquisitions occurring during the rolling year (Y), the asset
is included in the “all assets” scope for year (Y) and “like-
for-like” scope for year (Y+1) if only if all corresponding data
for the full rolling year (Y) are available;
• property developments in progress are not included in the
“all assets” reporting scope until the building goes into
operation and this will take effect from the next full rolling
year; the asset will be included in the “like-for-like” scope
as from the second full rolling year;
• assets refurbished during the rolling year remain in the
reporting scope for year (Y);
• assets whose common fl oor space is being extended by
more than 5% during the rolling year (Y) remain in the “all
assets” scope, and will be excluded from the “like-for-like”
scope from the end of works (opening of extension) until
the full rolling year (Y+2), following completion of the works.
Where it is possible to exclude data relating to the extension,
the asset will remain in the “like-for-like” scope.
The assessment of the evolution of portfolio’s performance
includes assets under refurbishment and extension works,
both integral to the Group’s activities. The asset extended is
excluded only at the opening of the extension (works ended,
new rents) and for one rolling year period in order to manage
the change in perimeter reported.
Assets included in 2012 reporting scope for environmental KPIs
Number of assets Assets
Reporting areas for standard
intensity indicators(1)
Denominators for intensity of use
indicators(3)
Austria 3 Aupark(*), Donauzentrum, Shopping City Süd 353,044 m2 54.2 million visits
Central Europe 5Centrum Cerný Most, Centrum Chodov, Galeria Mokotów, Arkadia, Wilenska 316,855 m2 75.5 million visits
France 31
BAB 2, Bay 2, Carré Sénart, Carrousel du Louvre, Cité Europe, Côté Seine, Cour Oxygène, Docks 76, Docks Vauban, Euralille, Gaîté Montparnasse, La Part-Dieu, Labège 2, Le Forum des Halles, Les Quatre Temps, L’Usine Côte d’Opale, L’Usine Roubaix, Centre Meriadeck, Passages Meriadeck, Nice Étoile, Parly 2, Place d’Arc, Rennes Alma, Rivétoile, Rosny 2, Saint-Sever,Toison d’Or, Ulis 2, Vélizy 2, l’Usine Mode et Maison, Villeneuve 2 1,140,159 m2 335.7 million visits
Netherlands 5Vier Meren, Leidsenhage, Citymall Almere, Stadshart Amstelveen, Stadshart Zoetermeer 110,403 m2 40.9 million visits
Nordic Countries 8Arninge Centrum, Eurostop Arlandastad, Eurostop Örebro, Fisketorvet, Nacka Forum, Nova Lund, Solna Centrum,Täby Centrum 335,541 m2 40.1 million visits(4)
Spain 15
Albacenter, Los Arcos, Bahía Sur, Barnasud, Bonaire, Equinoccio, Garbera, Glòries, Habaneras, La Maquinista, Parquesur, Sevilla Factory, Splau(*), La Vaguada, Vallsur 488,930 m2 119.4 million visits
Offices 1540 ter Suffren, 7 Adenauer, 2-8 Ancelle, 70-80 Wilson, Capital 8, Espace 21, Issy Guynemer, Tour Ariane, Tour Oxygène(*), Sextant 273,692 m2(2) 15,468 occupants
Convention & Exhibition 10
Cnit, Espace Champerret, Espace Grande Arche, Carrousel du Louvre, Palais des Congrès de Paris, Palais des Congrès de Versailles, Palais des Congrès d’Issy, Paris Nord Villepinte, Paris Nord Le Bourget, Porte de Versailles 634,400 m2(2)
31.640 million m2 occupied per days
opened to the public(m2 DOP)
(*) Added to the scope in 2012.(1) See the defi nition of reporting area for shopping centres above in Reporting value – standard intensity indicators.(2) Total spaces according to consolidation, see Portfolio pages 2-14.(3) See the defi nition of denominators used for intensity of use calculation above in Reporting value – intensity of use indicators.(4) Visits of Nordics portfolio have been maintained from 2011 numbers due to the non-availability of 2012 data.
3.3.5. Reporting system
Each region is responsible for collecting, checking and
consolidating the data for its managed assets. At the corporate
level, data is consolidated, analysed, validated and reported:
• quarterly for the consumption of each energy source
used, and the CO2 emissions. Regular, detailed monitoring
of these indicators ensures that performance issues are
identified and corrected swiftly at asset level. Energy data
is made available monthly as a minimum requirement and
can be sometimes measured on a real-time basis. The
quarterly frequency provides a regular assessment of the
asset’s performance in relation to the targets that have
been set. It promotes the sharing of good practices between
the various sites and enables corrective action plans to be
implemented swiftly;
• annually for water, waste, transport, environmental
certifi cations, Health & Safety, supplier assessments and for
supplementary data that is necessary for some calculations
(e.g. conversion factors for CO2 emissions; number of visits

CONSOLIDATED FINANCIAL STATEMENTS
CORPORATE SUSTAINABILITY
BUSINESS REVIEW AND 2012 RESULTS
PORTFOLIO
UNIBAIL-RODAMCO - FINANCIAL REPORT 2012 64 • 65
to shopping centres; m2 per days of opening of convention &
exhibitions venues to the public).
The Group’s Annual and Sustainable Development Report
discloses all KPIs together with their annual and cumulative
changes by business segment (shopping centres, offi ce
buildings and convention & exhibition venues), and by region.
This system has been applied across the whole of the
reporting scope.
3.3.6. Reporting period
In preparation for the extra-financial reporting obligations
introduced under the Grenelle II laws in France (Article 225),
the Group decided to integrate the Corporate Sustainability
Report into the Annual Report in 2010. As a result, the Group
adapted its reporting methodology to its environmental data for
a 12-month rolling period (Q4 previous year plus Q1, Q2 and Q3
for the reporting year) rather than for the financial year, as was
the case in the years prior to 2010.
3.3.7. Continuous improvement of definitions
and data quality
Unibail-Rodamco continues to improve the quality and
comparability of its environmental data, to develop internal
benchmarks, introduce sub-metering to collect information
for data which is currently estimated, and perfect accuracy of
data and perimeters reported. As a consequence, adjustments
may occur on data from the previous year where relevant.
In 2012, Unibail-Rodamco continued improving its
environmental reporting:
• complete and defi ne its Environmental Reporting Guidelines
(for the three business units (shopping centres, offi ces,
convention & exhibition centres): the Group’s reference
document that defines raw data collected, scope, rules, and
KPI calculations in order to secure the reporting system and
the homogeneity of disclosed results;
• update of 21 Asset Booklets by the shopping centre’s
Technical Managers where work on assets induced changes
in areas, equipment and/or perimeters. Asset Booklets are
the in-house reference documents for each managed asset
describing technical characteristics and functioning, areas,
and perimeters of collected data;
• continue to conduct on site internal controls of environmental
reporting. A sample of assets is audited each year by the
corporate sustainability team to check the accuracy and
compliance of their reporting with the Group’s Reporting
Guidelines. In 2012, three major shopping centres have
been internally audited (Fisketorvet-Denmark, Rivétoile-
France, Centrum Cerny Most-Czech Republic);
• perform a complete review of water consumption data
and perimeters reported. This work enables a better
understanding and defi nition of the reported scopes for
each asset;
• correction/update of CO2 emission factors used to calculate
CO2 emissions from energy consumptions:
• the conversion factor for gas is unchanged for all
shopping-centres in all regions across years. Different
factors for gas previously sourced from suppliers are now
replaced by one single factor as defi ned by the French
decree(1) : 0,185 kg CO2/kWh,
• the CO2 emission factors sourced from the International
Energy Agency are updated in the history to comply
with the 2012 International Energy Agency Report (IAE).
In 2012, the IAE reviewed its calculation methodology and
published corrected factors since 1990.
The CO2 emission factors refl ect emissions generated by
on-site combustion, not including the upstream transportation
and distribution impact of the energy consumed.
3.3.8. Third-party independent verification
In 2009, Unibail-Rodamco started to commision a third-
party audit for its environmental data with the carbon intensity
indicator. The Group has extended the scope of external
verifi cation through the years. In 2012, and according to the
Article 225 requirements (French Grenelle law), Ernst & Young
performed an in-depth review of the Group’s disclosures
regarding the Article’s 42 items and 32 key performance
indicators (see assurance statement page 112-113). This
verification included a detailed on-site review of 5 of the
Group’s largest assets.
For the second consecutive year, the Group continued to
comply with the Application level B+ of the Global Reporting
Initiative Construction & Real Estate Sector Supplement
reporting framework (GRI3.1 CRESS published in 2011). Level
B demands that all management information and at least 20
performance indicators are disclosed. The “+” shows that the
level declared has also been verified by Ernst & Young.
3.4. Climate change
The effects of climatic changes on Unibail-Rodamco’s
portfolio that could occur in the coming years will vary by
region and by asset. The scale and severity of any changes will
determine the extent of the impact, as will factors such as the
age, location, construction method and operational efficiency
of the asset, and the quality and capacity of local infrastructure.
Risks to the Group’s activities are likely to include: higher
insurance premiums; higher operating costs for energy, water
and maintenance; a higher chance of flooding; and a higher
risk of disruption to commercial activity from extreme weather
events, including problems affecting local infrastructure that
are outside the Group’s control. However, thanks to Unibail-
Rodamco’s strategic focus on major cities in continental
Europe, there is a low likelihood of significant changes to the
(1) French Decree of March 31, 2008 related to quantifi cation and verifi cation of GHG emissions declared into the European Union Emission Trading Scheme for the 2008/2012 period.

REPORT OF THE CHAIRMAN OF THE SUPERVISORY BOARD
LEGAL INFORMATION
FINANCIAL REPORT 2012 - UNIBAIL-RODAMCO 64 • 65
Group’s activities due to tidal flooding, extreme temperature
variations, aridity, demographic shifts, etc.
Unibail-Rodamco’s due diligence process for acquisitions
and new development projects covers a wide range of financial
and operational issues and takes many of these risks and
opportunities into account. For example, the due diligence
process includes a complete audit of technical, regulatory,
environmental, and health and safety performance. The
potential fi nancial impact of identifi ed risks is taken into
account during negotiations and investments. Issues covered
include asbestos, legionella, electromagnetic radiation and
soil pollution.
As well as preparing its assets to face the potential effects
of climate change, Unibail-Rodamco is working to limit
the impact of its activities on the climate. The Group’s CO2
reduction strategy is based on energy-efficient behaviours,
on equipment replacements by low energy consumption
technologies and, when possible, the use of low-carbon and
renewable energies.
The Group complies with regulatory requirements in each
region with regard to fl ooding risks, water management, and
drainage systems for exceptionally heavy rainfall.
3.4.1. Carbon footprint
Unibail-Rodamco is strongly committed to climate change
mitigation. This is refl ected by the remarkable performance
achieved in reducing carbon intensity: -58% of CO2 emissions
achieved by the Group since 2006 until the end of 2012,
cumulated like-for like (scope of calculation limited to emissions
related to energy consumptions on managed buildings).
To enhance the Group’s carbon strategy, carbon tracking
permits a better measurement of the entire scope of
emissions and their associated responsibility. In order to
complete the fi rst carbon footprint carried out by Carbone 4
in 2009 limited to a sample of assets, the Group’s full carbon
footprint assessment was performed by Carbone 4 in 2012
establishing the relevant perimeter and scope breakdown for
the Real Estate sector.
Methodology
When defi ning the Groups methodology for calculating its
activities total carbon footprint, Unibail-Rodamco chooses
the approach by “operational control”. It consolidates 100%
of emissions generated by the installations which are owned
and managed by the company. The choice of this approach
impacts the content counted in the different scopes according
to responsibilities. Considering energy for example, tenant’s
private electricity consumptions, not attached to Unibail-
Rodamco’s management scope, are consequently located
into the Scope 3. Split of carbon emissions related to energy:
• Scope 1: direct emissions from energy consumed on-site in
the common areas of shopping centres and offi ces (gas and
fuel combustion);
• Scope 2: indirect emissions from imported energy
consumed (electricity consumption in common areas,
common heating and cooling purchases through district
networks);
• Scope 3: all other direct and indirect emissions, including
electricity consumed in private areas (tenants).
The total consolidated perimeters for carbon emissions
have been defi ned through three separate entities: Asset
portfolio (100% of managed shopping centres and offi ces);
Group’s supporting activities and employees (100% of
headquarter activities); development projects delivered
during the current period. Moreover, three complete carbon
footprint tests have been performed on representative assets
of the Group’s Retail portfolio: Rivétoile (France), Rosny 2
(France), Centrum Chodov (Czech Republic).
The sources of emissions included into the total Group’s
carbon footprint are detailed below per entity and split per
scope.
To portray the Group’s business activities in the most
accurate manner, including the interactions between the
company and its stakeholders, Scope 3 has been defi ned with
three subdivisions:
• Scope 3 managed, Unibail-Rodamco’s operational control;
• Scope 3 related, Stakeholders’ responsibility;
• Scope 3 extended, Excluded of the carbon footprint perimeter.
Scope 1 & 2 (shopping centres, offi ces, headquarter)
Scope 1 Direct emissions from stationary combustion: gas and fuel consumption in common areas
Direct emissions from mobile combustion: fuel used for company’s cars
Direct fugitive emissions: leaks of refrigerant gas(1)
Scope 2 Indirect emissions from imported electricity consumed: electricity consumption in common areas
Indirect emissions from imported energy through a physical network, i.e. district network: common purchases of heating and cooling
(1) These sources have only been measured on the three sites tests.

CONSOLIDATED FINANCIAL STATEMENTS
CORPORATE SUSTAINABILITY
BUSINESS REVIEW AND 2012 RESULTS
PORTFOLIO
UNIBAIL-RODAMCO - FINANCIAL REPORT 2012 66 • 67
Scopes 3
Scope 3 ManagedUnibail-Rodamco’s operational control
Energy-related activities not included in scope 1&2 emissions (extraction, production and transport of fuels, electricity, steam, heating and cooling): Upstream transportation and distribution of energy consumed by common parts
Purchased products and services: services expenses for daily exploitation on site as cleaning, maintenance, security, maintenance, waste management, energies and fl uids provision and marketing expenses (OPEX), Offi ce material (headquarter)
Capital equipment: IT equipment on site, Company’s cars
Wastes: waste management on site
Employee commuting: Unibail-Rodamco employees transportation from home to work
Business travel: Unibail-Rodamco employees business travel by plane, train and taxi
New development projects/cost engaged and the surfaces of delivered projects during the current year:Brownfi eld/greenfi eld: emissions based on areas builtExtension/refurbishment: emissions based on cost of works
Scope 3 RelatedStakeholders’ responsibilities
Upstream commuting of visitors, clients, and/or occupant to the Groups’ shopping centres and offi ce buildings (clients and visitor transportation)
Downstream leased assets: electricity consumption of private areas (production, transportation and distribution)(1)
Tenants commuting: tenants employees transportation from home to work on site(1)
Scope 3 Extended Excluded of the perimeter
Production and distribution of products sold in shopping centres
Use phase of the product
End of life of the product
(1) These sources have only been measured on the 3 sites tests.
Group consolidated results
Split of the Group’s carbon footprint per entities
Group's headquarter
activities and employees
15%
Development projects
delivered in 2012
1%
Assets Portfolio
84%
Split of the Group’s carbon footprint per scopes
Scope 1
1%
Scope 2
8% Scope 3 managed
19%
Scope 3
related
71%
UNIBAIL-Rodamco’s carbon footprint
Group's headquarter
activities and employees
15%
Development projects
delivered in 2012
1%
Assets Portfolio
84%
Scope 1
2%
Scope 2
10%
Scope 3 managed
4%
Scope 3 related
84%
Scope 1
10%
Scope 2
13%
Scope 3
managed
76%
Scope 3 managed
100%
ve
el

REPORT OF THE CHAIRMAN OF THE SUPERVISORY BOARD
LEGAL INFORMATION
FINANCIAL REPORT 2012 - UNIBAIL-RODAMCO 66 • 67
Sites consolidated results per sources of emissions
Rivétoile, France
Employee commuting 6.5%
Downstream leased assets 18.9%
Clients and visitor transportation 57.7%
Wastes 4.2%
3.0% Purchased products
0.1% Capital equipment
0.4% Energy-related activities not included in scope 1&2
emissions (extraction, production and transport of fuels,
electricity, steam, heating and cooling)
2.4% Indirect emissions from consumed energy
imported through a physical network (heating, steam,
cooling)
2.2% Indirect emissions from imported
electricity consumed
Direct fugitive emissions 4.6%
Centrum Chodov, Czech Republic
Employee commuting 3.3%
Downstream leased assets 20.7%
Clients and visitor transportation 43.2%
Wastes 1.8%
2.1% Energy-related activities not included in scope 1&2
emissions (extraction, production and transport of fuels,
electricity, steam, heating and cooling)
13.1% Indirect emissions from consumed energy
imported through a physical network (heating,
steam, cooling)
15.3% Indirect emissions from imported
electricity consumed
Direct fugitive emissions 0.5%
Rosny 2, France
Employee commuting 9.7%
Downstream leased assets 18.8%
Clients and visitor transportation 59.4%
Wastes 3.4%
1.7% Purchased products
5.1% Direct emissions from stationary
combustion
1% Energy-related activities not included in scope 1&2
emissions (extraction, production and transport of fuels,
electricity, steam, heating and cooling)
0.9% Indirect emissions from imported
electricity consumed
Conclusion
The results of Unibail-Rodamco’s carbon footprint has
confi rmed the relevance of the Group’s strategy since 2007:
• location in major cities with high connectivity;
• continuous optimisation of energy consumptions;
• enhancement of footfall and occupancy rate (intensity of use);
• switch or low carbon emissive energies;
• roll-out of green leases.
Thanks to this survey, Unibail-Rodamco will enlarge the
scope of its carbon emissions calculation:
• Priority 2013: integrate in its internal reporting the
(i) refrigerant gas, (ii) emissions related to waste
management and (iii) visitors transportation;
• Mid-term: (i) investigate solutions for measuring tenant’s
private electricity consumptions, due to its major impact
on Scope 3 related, and (ii) perform carbon footprint
assessments for main construction projects.

CONSOLIDATED FINANCIAL STATEMENTS
CORPORATE SUSTAINABILITY
BUSINESS REVIEW AND 2012 RESULTS
PORTFOLIO
UNIBAIL-RODAMCO - FINANCIAL REPORT 2012 68 • 69
3.4.2. CO2 emissions
The Group’s reporting covers greenhouse gas emissions
(GHG) related to the energy consumption of buildings
managed by the Group (i.e. operating as a property manager),
converted into a CO2 equivalent unit (CO
2e). In 2012, on a
year to year and a like-for-like basis, the Group reduced the
carbon intensity (CO2e/visit) of its shopping centre portfolio by
12% due to:
• increased energy efficiency (i.e. less consumption) reduced
CO2 emissions by 7% (4,443 tonnes);
• changes in carbon conversion rates resulting from changes
in the primary energy mix of suppliers led to a 2% reduction
in carbon intensity (1,071 tonnes);
• the purchase of “green” electricity in the Nordic region
(8 shopping centres) with an impact of -3% (1,968 tonnes).
Visitor footfall was almost stable (+1%) and did not have a
noticeable impact on this result.
This encouraging CO2 performance is achieved by the
ambitious energy-saving programmes that operate across
all of the Group’s assets. However, for the last two years
this reduction in carbon intensity has benefited from cyclical
factors unsecured in the long term, such as favourable
climate conditions and the continuation of green electricity
purchase for the most carbon-intensive shopping centres.
More than quick carbon savings, the primary purpose of
signing certified “green” electricity contracts for the Group is
to encourage suppliers to invest in low-carbon and renewable
energy technologies, by increasing market demand for these
“clean” energies.
This result leads to a cumulative impact of -58% for the
carbon intensity indicator between 2006 and 2012, exceeding
the already updated target of -50% between 2006 and 2016.
As a consequence, Unibail-Rodamco has decided to set a
new long term target, even if this CO2 reduction performance
has to be considered in the long term, taking into account the
possible cyclical and external factors, such as tough climate
conditions or uncontrolled changes in the suppliers’ energy
mix. In this context of culmination of its long-term targets, the
Group’s new target for carbon mitigation is to achieve -30%
for its cumulated carbon intensity by 2020 compared to 2012
baseline.
The reduction of CO2 emissions between 2011 and 2012
in a like-for-like basis represents 7,279 tonnes, equivalent
to 5 times the 2012 emissions generated by the Group’s
business travels.
Reducing CO2/visits at managed shopping centres
(like-for-like)
-70%
-60%
-50%
-40%
-30%
-20%
-10%
0%
2012201120102009200820072006
Year-on-year reduction Accumulated reduction
-58%
-4% -4%
-20%
-6%
-31%
-12%
2012 evolution
-3%
-2%
-7%
Green electricity purchase Nordic
2012
-12%
Visits evolution
Energy consumption reduction
CO2 emission factor evolution
1 2012
-12%

REPORT OF THE CHAIRMAN OF THE SUPERVISORY BOARD
LEGAL INFORMATION
FINANCIAL REPORT 2012 - UNIBAIL-RODAMCO 68 • 69
KPI: CO2 emissions (kgCO
2e) [GRI EN16, EN 18]
CO2 emissions related to energy consumption are considered in absolute Energy Consumption KPI. The CO
2 figures are calculated
with local emission factors for each source of energy consumption. These factors depend on the source of energy (electricity, gas,
etc.), the country and the energy supplier. The KPI highlights the split between direct CO2 emissions (scope 1: gas and fuel oil) and
indirect CO2 emissions (scope 2: electricity, district heating network and district cooling network).
Shopping centres Offi ces Convention & Exhibition
Scope All assets AustriaCentral Europe France Netherlands Nordics Spain Scope All assets Scope All assets
2010 77/77 119,430,133 6,750,583 75,810,869 10,994,650 2,543,937 4,545,136 18,784,958 17/17 5,763,602 10/10 15,217,115
2011 66/66 67,447,648 5,660,032 32,516,773 9,100,382 1,457,550 3,590,339 15,122,572 14/14 3,666,246 10/10 16,153,724
2012 67/67 65,458,787 10,942,177 30,644,688 7,814,507 1,428,506 1,098,632 13,530,276 15/15 3,063,675 10/10 13,328,779
of which direct emissions 10,447,248 5,175,243 0 2,807,926 1,307,554 0 1,156,525 210,756 4,771,117
of which indirect emissions 55,011,539 5,766,935 30,644,688 5,006,581 120,952 1,098,632 12,373,751 2,963,355 8,557,662
2012/2006 Like-for-like cumulated -57% -27% -54% -41% -82% -79% -56% -41% -13%
2012/2010 Like-for-like cumulated -39% 24% -45% -29% -10% -76% -33% -39% -12%
2012/2011 Like-for-like 63/67 -11% 30% -6% -14% -2% -74% -17% 11/15 -18% 10/10 -17%
When calculating CO2 emissions, value of zero for the emission factor is applied to the green electricity purchased.
The table below indicates electricity consumptions in kWh:
Shopping centres Offi ces Convention & Exhibition
Scope All assets AustriaCentral Europe France Netherlands Nordics Spain Scope All assets Scope All assets
Total Electricity consumption 2012 (kWh) 67/67 269,658,151 43,813,809 51,076,857 94,900,189 5,168,509 28,696,181 46,002,606 15/15 22,228,254 10/10 94,941,128
of which green electricity purchase 2012 (kWh) 17/67 71,310,170 14,302,908 23,142,572 0 5,168,509 28,696,181 0 0/15 0 0/10 0
of which green electricity purchase 2012 (%) 17/67 26% 33% 45% 0% 100% 100% 0% 0/15 0% 0/10 0%
KPI: Carbon intensity of use (gCO2e/visit/year for shopping centres, kgCO
2e/occupant/year for offices, gCO
2e/m2 DOP/year
for Convention & Exhibition) [GRI CRE3]
Numerator: CO2 Emissions KPI.
Denominator: usage indicator per business activity (see Reporting Methodology part Reporting values page 62).
Shopping centres(gCO
2e/visit)
Offi ces (kgCO
2e/occupant)
Convention & Exhibition (gCO
2e/m2 DOP)
Scope All assets AustriaCentral Europe France Netherlands Nordics Spain Scope All assets Scope All assets
2010 76/77 167 159 790 32 53 69 157 13/17 258 10/10 524
2011 65/66 103 139 430 27 36 83 127 13/14 209 10/10 506
2012 65/67 97 202 406 23 35 27 105 12/15 196 10/10 423
2012/2006 Like-for-like cumulated -58% -27% -58% -43% -84% -80% -54% -34% /
2012/2010 Like-for-like cumulated -39% 13% -45% -30% -11% -75% -33% -32% -19%
2012/2011 Like-for-like 62/67 -12% 21% -6% -14% -3% -74% -17% 9/15 -16% 10/10 -16%
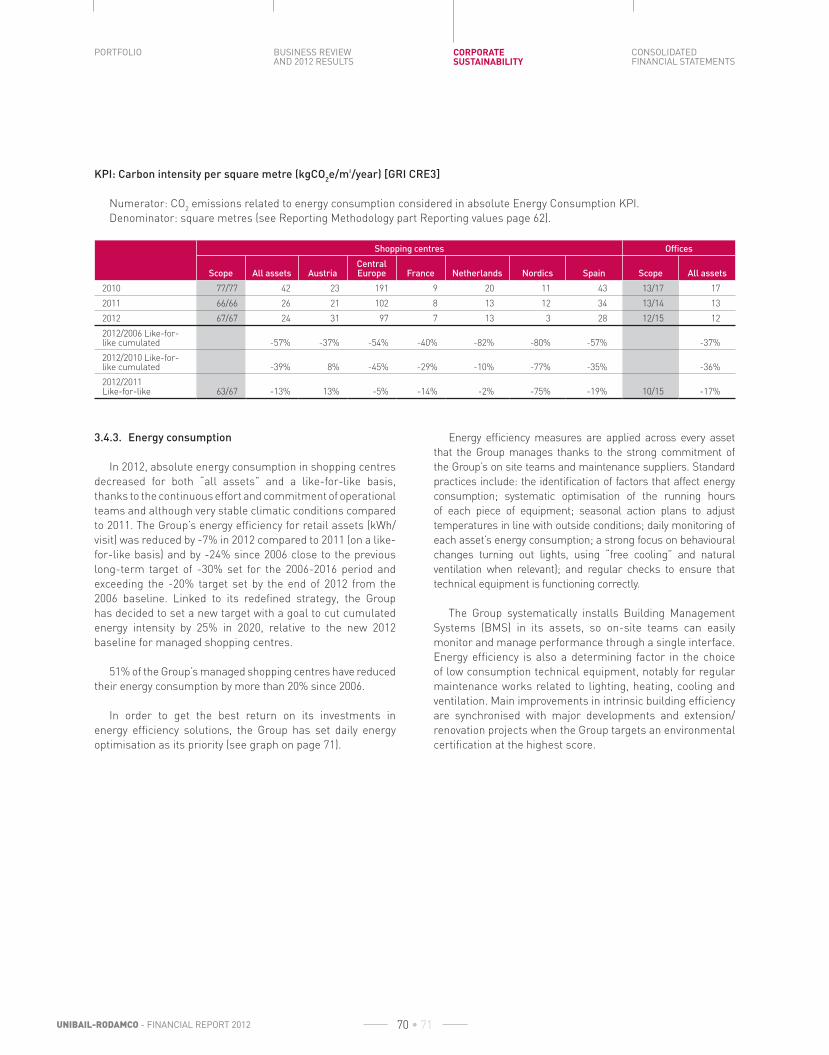
CONSOLIDATED FINANCIAL STATEMENTS
CORPORATE SUSTAINABILITY
BUSINESS REVIEW AND 2012 RESULTS
PORTFOLIO
UNIBAIL-RODAMCO - FINANCIAL REPORT 2012 70 • 71
KPI: Carbon intensity per square metre (kgCO2e/m²/year) [GRI CRE3]
Numerator: CO2 emissions related to energy consumption considered in absolute Energy Consumption KPI.
Denominator: square metres (see Reporting Methodology part Reporting values page 62).
Shopping centres Offi ces
Scope All assets AustriaCentral Europe France Netherlands Nordics Spain Scope All assets
2010 77/77 42 23 191 9 20 11 43 13/17 17
2011 66/66 26 21 102 8 13 12 34 13/14 13
2012 67/67 24 31 97 7 13 3 28 12/15 12
2012/2006 Like-for-like cumulated -57% -37% -54% -40% -82% -80% -57% -37%
2012/2010 Like-for-like cumulated -39% 8% -45% -29% -10% -77% -35% -36%
2012/2011 Like-for-like 63/67 -13% 13% -5% -14% -2% -75% -19% 10/15 -17%
3.4.3. Energy consumption
In 2012, absolute energy consumption in shopping centres
decreased for both “all assets” and a like-for-like basis,
thanks to the continuous effort and commitment of operational
teams and although very stable climatic conditions compared
to 2011. The Group’s energy efficiency for retail assets (kWh/
visit) was reduced by -7% in 2012 compared to 2011 (on a like-
for-like basis) and by -24% since 2006 close to the previous
long-term target of -30% set for the 2006-2016 period and
exceeding the -20% target set by the end of 2012 from the
2006 baseline. Linked to its redefi ned strategy, the Group
has decided to set a new target with a goal to cut cumulated
energy intensity by 25% in 2020, relative to the new 2012
baseline for managed shopping centres.
51% of the Group’s managed shopping centres have reduced
their energy consumption by more than 20% since 2006.
In order to get the best return on its investments in
energy efficiency solutions, the Group has set daily energy
optimisation as its priority (see graph on page 71).
Energy efficiency measures are applied across every asset
that the Group manages thanks to the strong commitment of
the Group’s on site teams and maintenance suppliers. Standard
practices include: the identifi cation of factors that affect energy
consumption; systematic optimisation of the running hours
of each piece of equipment; seasonal action plans to adjust
temperatures in line with outside conditions; daily monitoring of
each asset’s energy consumption; a strong focus on behavioural
changes turning out lights, using “free cooling” and natural
ventilation when relevant); and regular checks to ensure that
technical equipment is functioning correctly.
The Group systematically installs Building Management
Systems (BMS) in its assets, so on-site teams can easily
monitor and manage performance through a single interface.
Energy efficiency is also a determining factor in the choice
of low consumption technical equipment, notably for regular
maintenance works related to lighting, heating, cooling and
ventilation. Main improvements in intrinsic building efficiency
are synchronised with major developments and extension/
renovation projects when the Group targets an environmental
certifi cation at the highest score.

REPORT OF THE CHAIRMAN OF THE SUPERVISORY BOARD
LEGAL INFORMATION
FINANCIAL REPORT 2012 - UNIBAIL-RODAMCO 70 • 71
KPI: Energy consumption (kWh) [GRI EN3, EN4, EN5, EN6, EN7]
Energy consumption includes both direct and indirect energy. Direct energy refers to primary source energy which is purchased
and consumed on site (e.g. gas and fuel oil). Indirect energy refers to energy produced by and purchased from a third party in
the converted form of electricity or fluid (e.g. electricity, heating/cooling network or steam). For Shopping Centres, Offices and
Convention & Exhibition venues, final energy purchased for use in common areas includes car parks and common equipment
(heating & cooling, distribution power, ventilation, vertical transportation, and lighting) and energy provided to tenants for heating
and/or cooling. Electricity purchased by tenants is not included.
Shopping centres Offi cesConvention &
Exhibition
Scope All assets AustriaCentral Europe France Netherlands Nordics Spain Scope All assets Scope All assets
2010 77/77 507,669,644 59,687,648 116,473,795 163,065,501 23,455,737 83,578,468 61,408,496 17/17 53,386,362 10/10 167,911,989
2011 66/66 419,169,183 57,005,758 83,579,102 149,446,720 13,802,307 60,549,586 54,785,710 14/14 37,530,585 10/10 183,783,511
2012 67/67 418,728,181 81,118,422 75,789,193 137,407,378 13,458,102 52,159,991 58,795,094 15/15 39,200,943 10/10 161,872,451
of which direct energy 2012 56,471,612 27,974,284 0 15,177,980 7,067,860 0 6,251,488 1,139,219 25,789,823
of which indirect energy 2012 362,256,569 53,144,139 75,789,193 122,229,398 6,390,242 52,159,991 52,543,606 38,061,724 136,082,628
2012/2006 Like-for-like cumulated -22% 16% -22% -27% -15% -20% -29% -29% -16%
2012/2010 Like-for-like cumulated -12% 10% -12% -16% -12% -14% -11% -22% -4%
2012/2011 Like-for-like 63/67 -6% 9% -9% -8% -2% -13% 0% 11/15 -5% 10/10 -12%
The energy reduction year to year on a like-for-like basis represents 6 times the annual consumption of the Group’s headquarter
in 2012 (23,866 GWh).
An energy efficiency attitude is well embedded in all
existing processes related to technical management of each
asset by gradually ensuring:
• daily optimisation of technical equipment;
• technical improvement through annual non recurrent
maintenance works;
• intrinsic building works syncronised with the Group’s value
creation policy.
Increased energy efficiency limits Unibail-Rodamco’s
exposure to rising, increasingly volatile energy prices and
cushions it against possible supply shocks in the future. This
is particularly important in France, where energy prices are
currently below European market rates.
A gradual and pragmatic approach to energy savings
20% Energy savings
Daily operations Refurbishment Large works
Optimized
running
20 - 40% Energy savings
Low energy intensive
equipment
> 40% Energy savings
Building
efficiency
energies
x €10 k x €100 k x €1,000 k

CONSOLIDATED FINANCIAL STATEMENTS
CORPORATE SUSTAINABILITY
BUSINESS REVIEW AND 2012 RESULTS
PORTFOLIO
UNIBAIL-RODAMCO - FINANCIAL REPORT 2012 72 • 73
KPI: Financial savings resulting from reduced energy consumption (€) [GRI EN5]
Total cost saved thanks to the reduction of energy consumptions of the Energy Consumption Indicator, estimated with an average
energy cost per supplier.
Definition:
• The difference in energy consumption year-on-year, “like-for-like perimeter”.
• The energy consumption difference multiplied by energy cost, per supplier, per asset and consolidated per region.
Shopping centres
Scope All assets AustriaCentral Europe France Netherlands Nordics Spain
Energy consumptions evolutions 2012/2011 (kWh) 63/67 -23,866,302 2,134,148 -7,789,909 -12,039,342 -344,204 -5,811,616 -15,379
Costs savings 2012/2011 (€) 63/67 -1,733,724 230,328 -467,357 -930,488 -19,372 -479,177 -67,658
KPI: Energy effi ciency per building usage (kWh/visit/year for shopping centres, kWh/occupant/year for offices, kWh/m² DOP/
year for Convention & Exhibition) [GRI CRE1]
Numerator: Energy Consumption KPI.
Denominator: usage indicator per business activity (see Reporting Methodology part Reporting values page 62).
Shopping centres(kWh/visit)
Offi ces(kWh/occupant)
Convention & Exhibition
(kWh/m² DOP)
Scope All assets AustriaCentral Europe France Netherlands Nordics Spain Scope All assets Scope All assets
2010 76/77 0.71 1.41 1.21 0.48 0.49 1.26 0.51 13/17 2,373 10/10 5.8
2011 65/66 0.64 1.40 1.11 0.44 0.34 1.40 0.46 13/14 2,152 10/10 5.8
2012 65/67 0.62 1.50 1.00 0.40 0.33 1.30 0.46 12/15 2,321 10/10 5.1
2012/2006 Like-for-like cumulated -24% 17% -29% -29% -26% -14% -27% -18% /
2012/2010 Like-for-like cumulated -12% 1% -12% -17% -13% -11% -11% -13% -11%
2012/2011 Like-for-like 62/67 -7% 3% -9% -9% -3% -13% 0% 9/15 -4% 10/10 -11%
KPI: Energy effi ciency per square metre (kWh/m²/year) [GRI CRE1]
Numerator: Energy Consumption KPI.
Denominator: square metres (see Reporting Methodology part Reporting values page 62).
Shopping centres Offi ces
Scope All assets AustriaCentral Europe France Netherlands Nordics Spain Scope All assets
2010 77/77 178 201 293 139 184 200 140 13/17 159
2011 66/66 161 210 262 130 125 196 125 13/14 136
2012 67/67 153 230 239 121 122 155 120 12/15 139
2012/2006 Like-for-like cumulated -23% 1% -22% -26% -15% -24% -31% -26%
2012/2010 Like-for-like cumulated -13% -4% -11% -16% -12% -19% -13% -18%
2012/2011 Like-for-like 63/67 -8% -5% -9% -8% -2% -17% -2% 10/15 -15%

REPORT OF THE CHAIRMAN OF THE SUPERVISORY BOARD
LEGAL INFORMATION
FINANCIAL REPORT 2012 - UNIBAIL-RODAMCO 72 • 73
3.4.4. Energy mix
Unibail-Rodamco works to reduce the environmental
impact of the energy it consumes by purchasing low-carbon/
renewable energy from suppliers and generating low-carbon/
renewable energy on-site. The energy mix is a key focus
in regions which have carbon-intensive national energy
infrastructure, such as Central Europe or Spain.
The Group’s policy of purchasing low-carbon energy
from suppliers offers two key benefits. Firstly, it reduces
the carbon intensity of the Group’s operations. Secondly, it
encourages suppliers to invest in “green” power-generation
technologies by contributing to the strong and growing
market demand for low-carbon and renewable energies.
In 2012, Unibail-Rodamco expanded its “green” electricity
purchasing policy to 100% of its assets in the Nordic region.
4 out of 6 regions have now switched to a full or partial green
electricity supply.
Some assets are equipped with systems to generate
low-carbon or renewable energy. In Spain, for example, solar
panels covering 20,300 m2 were installed in nine assets and
produced renewable energy for re-sale to the national grid,
Two shopping centres were also equiped with tri-generation
systems.
In France, Aéroville (currently under construction) will be
the fi rst shopping centre to use its own geothermal plant for
its proper needs of heating and cooling.
KPI: Carbon weight of energy mix (gCO2e/kWh) [GRI EN16]
Numerator: CO2 emissions KPI.
Denominator: Energy Consumption KPI.
Shopping centres Offi cesConvention &
Exhibition
Scope All assets AustriaCentral Europe France Netherlands Nordics Spain Scope All assets Scope All assets
2010 77/77 235 113 651 67 108 54 306 17/17 108 10/10 91
2011 66/66 161 99 389 61 106 59 276 14/14 98 10/10 88
2012 67/67 156 135 404 57 106 21 230 15/15 78 10/10 82
2012/2006 Like-for-like cumulated -38% -55% -46% -8% -79% 185% -10% 11% 19%
2012/2010 Like-for-like cumulated -22% -20% -42% -3% 1% 206% 9% 3% 4%
2012/2011 Like-for-like 63/67 -5% 18% 4% -7% 1% -70% -17% 11/15 -13% 10/10 -6%

CONSOLIDATED FINANCIAL STATEMENTS
CORPORATE SUSTAINABILITY
BUSINESS REVIEW AND 2012 RESULTS
PORTFOLIO
UNIBAIL-RODAMCO - FINANCIAL REPORT 2012 74 • 75
KPI: Direct and indirect fi nal energy consumption by primary energy source (%) [GRI EN3, EN4]
Direct energy refers to the primary source of energy which is purchased and consumed on site (e.g. gas). Indirect energy refers
to energy which was generated by and purchased from a third-party in the form of electricity, heat or steam.
2012
Shopping centres Offi cesConvention & Exhibition
All assets AustriaCentral Europe France Netherlands Nordics Spain All assets All assets
Nuclear 32% 11% 2% 71% 0% 0% 40% 65% 62%
Direct natural gas 13% 34% 0% 11% 53% 0% 11% 3% 16%
Indirect natural gas 5% 9% 1% 5% 9% 1% 8% 11% 10%
Fuel oil 0% 0% 0% 1% 0% 0% 0% 10% 4%
Coal 13% 0% 58% 2% 0% 4% 7% 3% 2%
Other fossil fuels 2% 4% 3% 0% 0% 2% 4% 0% 0%
Sub-total: Fossil 34% 47% 62% 20% 62% 7% 30% 27% 32%
Hydro power 21% 35% 14% 4% 38% 60% 12% 4% 3%
Wind power 2% 1% 6% 0% 0% 6% 0% 0% 0%
Biomass based intermediate energy 5% 3% 13% 1% 0% 16% 0% 1% 0%
Other renewable sources 6% 2% 2% 3% 0% 12% 18% 3% 3%
Sub-total: Renewable 34% 41% 35% 9% 38% 93% 30% 8% 6%
Total fi nal energy (kWh) 418,728,181 81,118,422 75,789,193 137,407,378 13,458,102 52,159,991 58,795,094 39,200,943 161,872,451
of which direct energy 56,471,612 27,974,284 0 15,177,980 7,067,860 0 6,251,488 1,139,219 25,789,823
of which indirect energy 362,256,569 53,144,139 75,789,193 122,229,398 6,390,242 52,159,991 52,543,606 38,061,724 136,082,628
Scope: 67 shopping centres out of 67; 15 offices out of 15; 10 convention & exhibitions centres out of 10.
Direct and Indirect energy mix by region (all assets)
Conventions & Exhibitions
Offices
Spain
Nordics
Netherlands
France
Central Europe
Austria
Group Shopping Centres34% 32% 34%
47% 11% 41%
2%62% 35%
20% 71% 9%
0%
0% 93%
38%
30% 40% 30%
27%
32% 62% 6%
8%65%
NuclearFossil Renewable
Direct and indirect energy by primary source at managed
shopping centre
0
20
40
60
80
100
120
201220112010
27%
49%
24%
28%
42%
30%
32%
34%
34%
Fossil Nuclear Renewable
The primary energy mix remains very different across
the countries and mainly inluenced by the electricity plant
industry. The voluntary low carbon energy purchase policy at
shopping centres allows decreasing share of fossil energies
from 49% in 2010 to 34% in 2012.
KPI: Renewable energy produced and CO2 emissions saved
[GRI EN3, EN4, EN6]
Energy output from 20,300 m2 of solar panels installed at
nine assets in Spain.
Renewable electricity produced on site is sold to the public
network and not consumed on site. CO2 emissions avoided
thanks to this production represent the emissions that would
have been generated by the production of the same amount
of electricity in a non-renewable way. These assets permit the
electricity supplier not to produce this quantity of electricity
and therefore equivalent CO2 emissions are indirectly saved.
2010 2011 2012
Renewable energy produced on site (kWh) 1,354,068 1,278,943 1,548,307
CO2 emissions saved
(kgCO2e) 442,205 379,687 368,463

REPORT OF THE CHAIRMAN OF THE SUPERVISORY BOARD
LEGAL INFORMATION
FINANCIAL REPORT 2012 - UNIBAIL-RODAMCO 74 • 75
3.4.5. Transport
CO2 emissions from visitor transport signifi cantly outweigh
the CO2 emissions generated by energy consumed by the
asset itself. Buildings which are accessible mainly by car have
a far higher indirect carbon footprint than those which are
well connected to public transport networks. Furthermore,
the relative impact of visitor transport on overall CO2
emissions will continue to rise as buildings become more
energy efficient.
Unibail-Rodamco aims to limit transport-related CO2
emissions associated with its activities. The Group focuses on
assets that have central locations in major European cities
and are easily accessed by sustainable modes of transport.
All of the Group’s assets are connected to public transport.
Internal surveys show that almost 57% of customers walked,
cycled or used public transport to visit the Group’s shopping
centres in 2012. 51% of all of the Group’s shopping centres are
linked to a bicycle lane. The office portfolio is also particularly
well-connected to major transport hubs.
The Group is promoting the use of electric vehicles by
installing charging points in its shopping centres across
Europe. In 2012, 46 shopping centres across Europe have
been equipped with free recharging points representing 126
dedicated parking spaces for electrical vehicles.
The results of the carbon footprint conducted in 2012
highlight that a majority of CO2 emissions are related to the
transport modes of visitors to Unibail-Rodamco’s sites. This
source represents more than 40% of the global footprint of
one asset. This conclusion confi rms the relevance of the
Group’s strategy set since 2007: assets located in major cities
with high connectivity to public transport.
KPI: Split of shopping centres’ visits by mode of transport (%) [GRI EN17]
Visits split by mode of transport expressed in percentages. The split of transport modes is based on marketing surveys conducted
in 2012. In 2012, the fi gures have been updated for 57 assets.
Shopping centres
All assets AustriaCentral Europe France Netherlands Nordics Spain
Public transport 34% 33% 50% 41% 15% 24% 16%
Car/taxi 41% 54% 27% 34% 45% 48% 60%
Foot/bicycle 23% 11% 21% 23% 37% 26% 20%
Other (motorbike, etc.) 2% 2% 2% 2% 2% 2% 3%
Scope: 64 shopping centres out of 67. Figures may not add up due to rounding.
KPI: Access to public transport (%) [GRI EN29]
Percentage of assets with an excellent connection to public transport.
Definition:
• Assets located less than 200 metres from public transport.
• Assets with a public transport connection with intervals of at least 15 minutes during weekday office hours.
Shopping centres Offi cesConvention &
Exhibition
Scope All assets AustriaCentral Europe France Netherlands Nordics Spain Scope All assets Scope All assets
Percentage of assets located less than 200 metres from a public transport 66/67 95% 100% 100% 93% 80% 100% 100% 15/15 87% 10/10 90%
Percentage of assets served at least every 15 minutes during weekday offi ce hours 66/67 80% 100% 100% 77% 100% 38% 93% 15/15 100% 10/10 100%

CONSOLIDATED FINANCIAL STATEMENTS
CORPORATE SUSTAINABILITY
BUSINESS REVIEW AND 2012 RESULTS
PORTFOLIO
UNIBAIL-RODAMCO - FINANCIAL REPORT 2012 76 • 77
KPI: CO2 emissions from employees’ business travel by train and plane (tonnes CO
2e) [GRI EN29]
The indicator is given both as an absolute value and as the ratio between CO2 emissions from business travel and the average
number of employees in 2012. Data and methodology provided by referenced travel agencies.
TotalHeadquarters
& France AustriaCentral Europe Netherlands Nordics Spain
Total emissions (tCO2e) 1,477 841 92 108 89 117 230
kg CO2e/employee 987 804 1,353 1,450 1,450 1,183 1,565
In 2012, Unibail-Rodamco collected CO2 emissions data
relating to employees’ business trips made by air and by
train in all regions. The Group’s travel policy for employees
is designed to reduce transport-related CO2 emissions.
Employees are asked to travel by train whenever possible and
to question whether a physical meeting is necessary. A Group
compliance policy states that video and tele-conferences
should be used whenever possible. Unibail-Rodamco has not
introduced a target on travel-related emissions, as corporate
travel is heavily influenced by business activities and can vary
significantly from year to year (acquisitions, divestments,
meetings with international retailers, etc.).
3.5. Resource use
Unibail-Rodamco’s resource use policy covers materials,
water, waste and biodiversity. In-house Environmental
Management Systems for new developments and existing
assets provide clear, comprehensive guidelines on the use
of resources. Third-party certification systems and audits
are used to validate these guidelines and ensure that the
standards they impose are respected.
3.5.1. Materials
An in-house materials policy ensures that materials are fit
for purpose, that opportunities to reuse existing materials and
structures are systematically reviewed, and that materials
with a low environmental impact and recycled products and
materials are preferred.
Materials must not exceed the European Union’s Volatile
Organic Compounds (VOC) thresholds.
Complementary to the Design Guidelines used for the
choice of material, maintainability experts check each of
the Group’s development projects at the end of each design
phase (schematic design and detailed design) to ensure that
they achieve the highest levels of durability, maintainability,
accessibility and security. Life Cycle Assessment (LCA)
pilots have been carried out. This position may evolve as the
LCA process continues to mature and improve the quality
of assessment outcomes. A global cost study of design
features (including structure and heating, ventilation and
air-conditioning system) for periods of 30 and 60 years was
carried out at the SO Ouest development project. SO Ouest
is the fi rst shopping centre in Europe to receive BREEAM
Excellent certifi cation in the Retail category. Majunga’s
structure and envelop have been concieved following a
30/60 years life cycle analysis (BREEAM credit MAN12 rarely
obtained).
In line with BREEAM certifi cation requirements, the
Group’s materials policy specifies that 80% of wood used
in development, extension and renovation projects must be
responsibly sourced (i.e. from certified, managed forests with
FSC or PEFC labels) and that 100% must be legally sourced.
This policy is systematically specified in tender documents for
construction projects and all contractors are asked to abide by
its terms. The Group works with large, reputable construction
companies. In-house project managers are asked to pay close
attention to this contractual requirement. Nevertheless, given
the low volumes involved and the nature of the manufactured
products purchased, it is not possible to monitor the weight,
nor the origins of the wood used in all projects. The Group aims
to obtain post-construction BREEAM certification for projects
assessed using the BREEAM referential; certification is in
progress for a number of projects. As part of this certification
process, the sourcing of wood used during construction is
verified and validated.
In line with BREEAM In-Use certifi cation requirements
and for shopping centres being certifi ed, the Group deploys
a specifi c addendum regarding materials in the purchasing
contracts signed with the main service providers.
3.5.2. Water
The materiality study pointed out that water is not a strategic
environmental dimension for Unibail-Rodamco. Indeed, the
Group’s portfolio is not considered as being a signifi cant water
consumer. Moreover, its localization in continental European
countries does not meet hydric stressful situations, except
for 3 shopping centres located in Spain. Indeed, in 2012,
with the support of the WBSCD Global Water Tool, the Group
simulated its exposure to water scarcity for its entire portfolio.
The analysis performed according to the Mean Annual
Relative Water Stress Index, showed that 93% of the Group’s
assets are located in area with no or low water scarcity issue.

REPORT OF THE CHAIRMAN OF THE SUPERVISORY BOARD
LEGAL INFORMATION
FINANCIAL REPORT 2012 - UNIBAIL-RODAMCO 76 • 77
As a consequence, the Group has not maintained water in
its new long-term targets disclosed. However, as part of the
resource use monitoring policy, reducing water consumption
is still an operational target on sites and continues being
tracked and reported.
In line with environmental best practice, the Group is
taking active steps to cut water consumption, reduce wastage
and maintain water quality. In particular, efforts are made
to install water-efficient equipment, optimise operating
practices, and ensure that leaks are detected and repaired
rapidly. Run-off water collected from car parks is treated
before being disposed of through municipal networks.
Closed-circuit systems are being introduced to re-use water
during the testing of sprinkler equipment.
At existing assets, the Group relies on close cooperation
with tenants and customers to reduce water consumption.
Green leases and tenant sustainability committees are used
to help raise awareness and assist with water management.
At new developments and during renovations and upgrades,
efficiency is a determining factor in the choice of technical
equipment (toilets, urinals, taps, sprinkler systems, cooling
systems, etc.). The Design Guidelines for new developments,
renovation and extension projects provide clear steps on how
to achieve water efficiency.
In 2012, a complete review of water consumption data was
performed. This work aids in getting a better understanding
and a clearer defi nition for the reporting scopes of each asset.
Adjusted perimeters and data are reported since the 2010
baseline. This signifi cantly improves the accuracy of the KPIs.
Water savings in 2012 correspond to 116,987 m3, water
efficiency at managed shopping centres has been improved
by -16% since 2006 on a like-for-like basis.
Convention & Exhibition’s business units are excluded
from the scope of water indicators, since water is managed
by exhibition planners and exhibitors, rather than the
Group’s team.
KPI: Water consumption (m3) [GRI EN8]
Water purchased for common and private use (restrooms,
cleaning, heating & cooling systems, sprinkler systems,
watering of green spaces, etc.). Water consumption in tenants’
premises is indicated in percentage when consumption can
be estimated.
Shopping centres Offi ces
Scope All assets AustriaCentral Europe France Netherlands Nordics Spain Scope All assets
2010 69/77 3,205,496 244,567 605,521 1,179,119 34,175 387,478 754,639 16/17 209,859
2011 66/66 3,194,264 238,108 445,972 1,332,541 33,685 355,974 787,986 13/14 133,767
2012 67/67 3,077,277 293,099 444,964 1,124,870 31,196 342,936 840,215 14/15 115,667
of which estimated tenants’ consumptions 62% 62% 49% 63% - 62% 69%
2012/2006 Like-for-like cumulated -14% 8% -14% -26% -26% -7% 11% -23%
2012/2010 Like-for-like cumulated -2% 2% -1% -6% -9% 6% 4% -35%
2012/2011 Like-for-like 63/67 -7% 4% -0,2% -16% -7% 3% 0% 10/15 -7%

CONSOLIDATED FINANCIAL STATEMENTS
CORPORATE SUSTAINABILITY
BUSINESS REVIEW AND 2012 RESULTS
PORTFOLIO
UNIBAIL-RODAMCO - FINANCIAL REPORT 2012 78 • 79
KPI: Financial savings resulting from reduced water consumption (€) [GRI CRE2]
The total cost saved thanks to the reduction of water consumptions of the Water Consumption indicator, estimated with an
average water cost per supplier.
Definition:
• The difference in water consumption year-on-year, “like-for-like perimeter”.
• The water consumption difference multiplied by water cost, per supplier, per asset and consolidated per region.
Shopping centres
Scope All assets AustriaCentral Europe France Netherlands Nordics Spain
Water consumptions evolutions 2012/2011 (kWh) 63/67 -199,202 4,711 -1,007 -207,671 -2,489 7,914 -659
Costs savings 2012/2011 (€) 63/67 -426,050 8,544 -6,752 -433,302 -6,424 14,952 -3,070
KPI: Total water withdrawal by source (%) [GRI EN8, EN10]
Split by source of total water purchased and consumed in shopping centres from the indicator Water Consumption during the
reporting year.
Shopping centres Offi ces
Municipal water suppllies & other utilities 97% 100%
Rainwater collected 0.01% 0%
Reused water (grey water, black water, treated waste water…) 0% 0%
Ground water 3% 0%
Others sources 0% 0%
In 2012, the shopping centres Vélizy 2 (France), Donauzentrum (Austria), La Maquinista (Spain), and Stadshart Almere
(Netherlands), collected 78,753 m3 of rainwater and ground water on site, reused for cleaning and the watering of green spaces.
In 2012, 22 shopping centres across the Group reused the water from the periodic regulatory sprinkler tests.
KPI: Water intensity of use (litre/visit/year for shopping centres, m3/occupant/year for offices) [GRI CRE2]
Numerator: Water Consumption KPI.
Denominator: usage indicator per business activity (see Reporting Methodology part Reporting values page 62).
Shopping centres(litre/visit)
Offi ces(m3/occupant)
Scope All assets AustriaCentral Europe France Netherlands Nordics Spain Scope All assets
2010 68/77 4.71 5.77 6.31 3.63 0.84 6.79 6.30 13/17 10.01
2011 65/66 4.90 5.86 5.90 4.00 0.83 8.24 8.24 13/14 7.70
2012 65/67 4.53 5.40 5.89 3.34 0.76 8.55 6.59 12/15 6.66
2012/2006 Like-for-like cumulated -16% 9% -22% -29% -35% -1% 14% -14%
2012/2010 Like-for-like cumulated -3% -6% -1% -8% -9% 9% 4% -28%
2012/2011 Like-for-like 62/67 -7% -3% 0% -17% -8% 3% 0% 10/15 -6%

REPORT OF THE CHAIRMAN OF THE SUPERVISORY BOARD
LEGAL INFORMATION
FINANCIAL REPORT 2012 - UNIBAIL-RODAMCO 78 • 79
KPI: Water consumption per square metre (litre/m2/year) [GRI CRE2]
Numerator: Water Consumption KPI.
Denominator: square metres (see Reporting Methodology part Reporting values page 62).
Shopping centres Offi ces
Scope All assets AustriaCentral Europe France Netherlands Nordics Spain Scope All assets
2010 60/77 1,163 859 1,372 1,061 950 1,119 1,439 16/17 763
2011 65/66 1,192 877 1,358 1,101 936 1,153 1,503 13/14 487
2012 66/67 1,059 865 1,351 928 860 1,022 1,282 13/14 393
2012/2006 Like-for-like cumulated -16% -24% -18% -26% 58% -3% -3% -22%
2012/2010 Like-for-like cumulated -6% -11% -2% -6% -9% 0% -10% -32%
2012/2011 Like-for-like 62/67 -11% -10% 0% -16% -8% -3% -13% 10/15 -6%
3.5.3. Waste
Unibail-Rodamco’s waste management approach is designed
to maximise recycling and minimise disposal to landfill.
In assets under operations, tenants are regularly informed
about on-site waste management local policy and process.
Both supplier purchasing contracts and tenant green leases
establish the minimum requirements for waste sorting and
recycling that must be respected. Suitable waste segregation
facilities are in place in all assets. Unibail-Rodamco’s waste
management responsibilities and reporting scopes may vary
by region. In some assets, local authorities are responsible
for managing waste. Then, the Group does not control the
final destination of waste produced at these assets.
The total volume of waste generated in a building,
whatever its usage, mainly relies on the level of activity of
the tenants, i.e. sales for shopping centres and occupancy
for offi ces buildings. This means that the Group has a limited
impact on the total volume of waste generated on site. On the
other hand, the Group is committed to waste management
efficiency measured through long-term objectives set for
recycling and disposal route:
• reduce the proportion of waste sent to landfill by 50% in
2016 relative to 2009;
• obtain a waste recycling rate of at least 50% by 2016.
In 2012, 35% of waste was recycled and 18% was sent to
landfill without methanisation. Since 2009, the Group has
reduced the proportion of waste sent to landfill by 30%. These
two achievements are in line with the above long term targets.
The Group’s development projects are built in line with
in-house Design Guidelines and BREEAM certification, both of
which require waste management plans and project-specific
reduction/reuse/recycling targets as standard practice. The
Unibail-Rodamco Considerate Construction Charter sets waste
valorisation targets and incentives for contractors. The Charter
sets out the Group’s requirements and recommendations for
optimising the environmental quality of its construction sites with
the aim to create a positive experience for the workforce, local
communities, and the environment. It includes all applicable
local regulations and is aligned with BREEAM requirements.
Signature of the Charter is a pre-requisite for companies signing
construction contracts. It should be noted that Unibail-Rodamco
works with large, reputable construction firms which also apply
their own certified construction waste management schemes.
Demolition projects are relatively rare and are managed on a
case-by-case basis.
Offi ces and Convention & Exhibition’s business units are
excluded from the scope of waste indicators. At Convention &
Exhibition venues, waste is managed by exhibitions planners
and exhibitors rather than the Group’s team. At Offi ces,
a waste collection service, whether ensured by a private
company or the local authority, is shared with other buildings
and owners in order to optimise the itinerary of waste disposal
trucks. Therefore, consistent and separate data tracking for
the Group are not yet available.

CONSOLIDATED FINANCIAL STATEMENTS
CORPORATE SUSTAINABILITY
BUSINESS REVIEW AND 2012 RESULTS
PORTFOLIO
UNIBAIL-RODAMCO - FINANCIAL REPORT 2012 80 • 81
KPI: Total waste (tonnes) [GRI EN22]
Total waste collected on site
Shopping centres
Scope All assets Austria Central Europe France Netherlands Nordics Spain
2010 72/77 58,634 4,575 7,571 25,336 1,622 5,835 13,694
2011 64/66 55,051 3,904 5,685 25,798 777 3,945 14,943
2012 63/67 55,141 4,940 5,663 25,477 1,013 3,550 14,498
of which non-hazardous waste (in tonnes) 55,068 4,940 5,638 25,477 1,013 3,550 14,450
of which hazardous waste (in tonnes) 73 0 25 0 0 0 48
KPI: Percentage of waste recycled (%) [GRI EN22]
Tonnes of waste recycled divided by tonnes of waste collected
Shopping centres
Scope All assets Austria Central Europe France Netherlands Nordics Spain
2010 72/77 36% 53% 36% 30% 41% 50% 34%
2011 64/66 35% 58% 37% 25% 41% 57% 39%
2012 63/67 35% 48% 33% 28% 46% 64% 35%
KPI: Split of total non-hazardous and hazardous waste by disposal route (tonnes) [GRI EN22]
Tonnes of non-hazardous and hazardous waste by disposal method
Shopping centres
All assets Austria Central Europe France Netherlands Nordics Spain
Total waste (in tonnes) 55,141 4,940 5,663 25,477 1,013 3,550 14,498
Recycling/Reuse/Composting 35% 48% 35% 28% 46% 64% 36%
Incineration 9% 43% 0% 6% 52% 0% 5%
Incineration with Energetic valorisation 21% 8% 0% 39% 0% 33% 0%
Landfi ll 18% 0% 47% 17% 2% 1% 21%
Landfi ll with Methanisation 5% 0% 18% 6% 0% 0% 0%
Managed by local authority* 10% 0% 0% 0% 0% 0% 38%
Other 2% 0% 1% 3% 0% 3% 0%
Scope: 63 shopping centres out of 67. Figures may not add up due to rounding.*Information on how local authorities manage the waste they collect is not available. The final disposal route of this waste can not be monitored and reported.
Hazardous waste is eliminated in the suitable route by suppliers.
KPI: Split of recycled waste by type of waste (tonnes) [GRI EN22]
Shopping centres
All assets Austria Central Europe France Netherlands Nordics Spain
Total recycled waste (in tonnes) 19,071 2,395 1,891 7,023 466 2,272 5,025
CardBoard 14,957 1,522 1,848 6,126 380 1,564 3,517
Paper 439 0 0 1 4 86 348
Plastics 867 233 34 64 1 23 512
Glass 627 294 2 63 80 55 133
Wood 564 81 5 35 0 0 443
Metals 222 88 1 27 0 98 9
Mixed waste sorted 1,053 146 0 469 0 417 21
Other recycled waste 342 31 2 238 0 30 42
Scope: 61 shopping centres out of 67. Figures may not add up due to rounding.

REPORT OF THE CHAIRMAN OF THE SUPERVISORY BOARD
LEGAL INFORMATION
FINANCIAL REPORT 2012 - UNIBAIL-RODAMCO 80 • 81
3.5.4. Biodiversity
Unibail-Rodamco has developed a clear strategy and
methodology for integrating biodiversity and ecology into its
activities. The Group worked closely with a biodiversity expert
to define and implement its approach to these issues and
has integrated it into the Retail Design Guidelines. Unibail-
Rodamco corporate policy measures the biodiversity potential
impact and the way it is addressed and managed through the
BREEAM certifi cation for all new development projects and is
being extended through BREEAM In-Use for existing assets.
For all development projects involved in a BREEAM
certification process (i.e. projects over 10,000 m²), an ecologist
forms part of the design team. The ecologist advises the
architects and designers on the most appropriate species
to choose for the development, taking into account their
relevance to local habitats and their potential to create a
positive ecological impact by enhancing and/or conserving
local fauna and flora. For all other development projects, the
site is analysed to estimate its potential and ensure that all
opportunities to foster biodiversity are exploited. An impact
assessment, which includes an environmental/biodiversity
component, is a pre-requisite for obtaining a building permit
and commercial planning permission in France. A public
consultation is also carried out as part of this process.
SO Ouest (Paris) achieved 90% of credits in the “Land
Use and Ecology” section within the BREEAM certifi cation,
helping it become the fi rst retail development in Europe to
obtain an “Excellent” rating (creation of 10,000 m2 green area
recreating a wildlife habitat for local species, and 10,000 m² of
green roof, fostering biodiversity on the site).
At existing assets, an equally pragmatic approach is
taken to biodiversity and ecology, even though the very dense
urban locations of most assets severely limit the potential to
enhance biodiversity. As a result, Unibail-Rodamco’s main
focus is on creating “green” spaces, such as green roofs and
green walls, and carefully selecting the plant species used.
The Group undertakes a biodiversity study prior to major
renovations and/or extension. Gap analysis methodology
is used to measure the site’s ecological potential against
its initial status. Through the BREEAM In-Use certifi cation
policy, biodiversity issue is addressed and fostered to achieve
high standards in this domain too.
For example, La Part-Dieu (certifi ed “Very Good” in 2011)
launched an ecological study and installed 5 bee hives onsite
in close cooperation with the national beekeepers organisation
and local authorities. Protected habitats have also been
installed for birds in partnership with the tenant Nature &
Découvertes. In 2012, 3 bee hives were installed in Centrum
Chodov, Czech Republic, and 8 in Les Quatres Temps, France.
Most of the assets concerned make use of this initiative to
communicate on environmental awareness towards visitors.
The design teams and development teams within
Unibail-Rodamco are responsible for ensuring that BREEAM
biodiversity impact assessments are commissioned and that
the biodiversity expert’s recommendations are implemented
(e.g. choice of plant species). Once the project has been
constructed and delivered, the Group’s operating management
team, particularly the on-site teams that manage each asset,
are responsible for maintaining and monitoring biodiversity.
The corporate sustainability team monitors the application
of the Group’s biodiversity policy and is on-hand to provide
additional advice and support to operating teams if necessary.
3.6. Health & safety and environmental risks
and pollutions
With a managed standing portfolio of over 3 million
consolidated m² GLA, welcoming several hundred millions
visitors each year, and a development pipeline of over one
additional million m² GLA, Unibail-Rodamco takes the health
and safety of its employees, customers, tenants, suppliers,
contractors and local communities very seriously: the Group’s
main concern being prevention against the potential risks
for people and the environment. The Group complies with
all applicable health and safety legislation as a matter of
course and often exceeds minimum standards required by
laws to ensure a higher standard of service and safety in its
assets. On-site teams are trained in first aid techniques and
maintain close relationships with local emergency services
(fire brigade, paramedics and police). Defibrillators are made
available for security staff and were installed in all shopping
centres across Europe.
The Group has drawn-up an extensive, comprehensive
in-house risk management policy to ensure that risks are
mitigated and managed. The risk management process also
provides a framework for responding to exceptional risks
and crises. Unibail-Rodamco’s due diligence process for
acquisition includes a complete audit of technical, regulatory,
environmental, and health and safety procedures and risks,
including soil pollution and climate change.
In 2012, an independent third-party health and safety
inspector was appointed in each country where the Group
operates. This inspector visits each asset to undergo an
annual assessment of health and safety risk in order to
ensure compliance with applicable regulation and the
Group’s policies: in addition to delivering a rating and an
assessment report for each asset, a customised action plan
is implemented to continuously improve the quality of the risk
management for each managed asset. The main subjects
covered by this risk management process are air quality,
water quality, asbestos, ground and air pollution, legionella,
electromagnetic radiation, IPPC installations, technical
equipment such as lifts and escalators and fi re prevention.
The follow-up is run by on-site teams and checked every
year by the same inspector and internal audit department.

CONSOLIDATED FINANCIAL STATEMENTS
CORPORATE SUSTAINABILITY
BUSINESS REVIEW AND 2012 RESULTS
PORTFOLIO
UNIBAIL-RODAMCO - FINANCIAL REPORT 2012 82 • 83
This in-house health and safety management system allows
the Group to monitor and assess the risk performance on a
regular basis, and embed a culture of maintain a high level
of health and safety culture embedded within operating and
shopping centre management teams.
For new developments, the Group complies with all
in-force regulation regarding health, safety and environmental
matters. An Environmental Impact Assessment (EIA) is carried
out at the earliest stage, a soil remediation is performed
when necessary, and the Group ensures that the health and
safety plan and rules are applied by contractors during the
construction phase.
There is not any provision for environmental risk in the
Group’s accounting in 2012.
KPI: Annual risk assessment [GRI PR1]
Total number of owned and managed assets that have carried out an annual risk assessment conducted by a third-party and the
coverage it represents regarding the total Group owned and managed portfolio.
2012
Shopping centres OfficesConvention & Exhibition
All assets AustriaCentral Europe France Netherlands Nordics Spain All assets All assets
Total managed assets 67 3 5 30 5 8 16 12 10
Total audited assets 62 2 4 28 5 8 15 10 9
Coverage (%) 93% 67% 80% 93% 100% 100% 94% 83% 90%
Audits not performed in 2012 (8 assets) correspond to assets under major construction works (refurbishments and/or extensions) and will be conducted after fi nal works completion.
KPI: Soil pollution and site remediation [GRI CRE5]
Annual (current year) monetary expenses for soil
detoxifi cation/site remediation and equivalent areas (volumes
that have been detoxifi ed).
2012Standing portfolio
Development pipeline
Monetary expenses in depollution (€) 0 219,969
Volume concerned (tonnes) 0 1,304
KPI: Fines for environmental breaches [GRI EN28]
Annual monetary value of significant fines and total
number of non monetary sanctions for non compliance with
environmental laws and regulations.
2011 2012
Monetary value of significant fines (€) 0 0
Total number of non-monetary sanctions 0 0

REPORT OF THE CHAIRMAN OF THE SUPERVISORY BOARD
LEGAL INFORMATION
FINANCIAL REPORT 2012 - UNIBAIL-RODAMCO 82 • 83
4 . STAKEHOLDERS
The Group’s economic success is founded on the strength
of its relationships with stakeholders: tenants, customers,
investors, local communities, suppliers and contractors, and
employees. The need to develop and operate assets that meet
stakeholders’ expectations in terms of shopping experience,
financial return and environmental performance is central to
the Group’s strategy. These areas are embedded in the Group’s
operating structure and product development process, are
regularly discussed at Supervisory Board and Management
Board level, and are subject to careful analysis and monitoring.
Relevant tools have been developed to identify and respond
to the expectations of each stakeholder community and
communicate this information to top managers and on-site
operational teams.
4.1. Communities and local authorities
With €7 billion in the current pipeline, and a managed
portfolio valued at €29.3 billion at year end 2012, Unibail-
Rodamco’s role as a leader in the real estate market plays an
important social and economic role in the local community.
The Group’s activities generate economic growth through
employees’ salaries, payments to suppliers and infrastructure
investments; contribute directly and indirectly to job creation
and urban renewal, and also the global economy in the
country where the Group operates.
Thus, Unibail-Rodamco’s key roles in the local economy are:
• Economic driver: direct employment through construction
and operations spending, indirect employment by tenant’s
sales and activities, suppliers activities, local taxes;
• Urban planner: high connectivity, iconic architecture,
brownfi eld requalifi cation;
• Social integrator: services offered to visitors, charities,
partnerships with local communities, places for a unique
experience (events, entertainment, shopping…).
To ensure that its investments, developments and
operations benefi t the communities where it is present and
reflect their needs and expectations, the Group works to build
and maintain strong relationships with local residents and
public authorities. Extensive public consultations are held for
all development and extension projects.
The Group’s shopping centres provide opportunities to
socialise, relax and be entertained as well as an extensive,
high-quality retail offering. In addition to a commercial
leisure offer, which ranges from pony clubs to cinemas, all
assets regularly organise free events, such as fashion shows
and concerts. Shopping centre managers are committed to
develop many local cultural, charitable and environmental
initiatives with local or international associations. In order
to better address the local communities challenges, Unibail-
Rodamco decided to develop a Group’s ‘Community Charter’
and test implementation in the managed Retail portfolio in
the coming years.
Unibail-Rodamco works hard to ensure its assets are
welcoming and accessible to all members of the community.
Special provisions are made for customers with reduced
mobility and physical and sensory disabilities, as well as
for elderly customers and the parents of small children. In
France, for example, the Group is building a close partnership
with the UNAPEI, a charitable association for people with
mental disabilities. During 2012, shopping centre staff
working with the public (retail employees, security staff,
cleaning contractors, etc.) will receive a special training
program for welcoming customers with mental disabilities, in
order to accommodate their needs. These shopping centres
will display the “S3A” label as a permanent sign of their
commitment to the 700,000 people and their families who are
affected in France by mental disability. Each centre will also
hold a public event every year to raise awareness of mental
disability.
4.2. Customers
The quality of the customer experience is central to the
economic sustainability of Unibail-Rodamco’s business as
it attracts visitors and encourages loyalty. Innovation in this
domain is the result of hard work from the Group’s different
teams, the diverse set of skills they represent and the
capacity they have of working together with a common goal
of always striving for a better, more differentiating customer
experience. The different skills applied can be seen through
Development for outstanding architecture and design, Leasing
for differentiating the tenant mix, Maintenance for the feeling
of comfort and safety they enable, Marketing for attracting the
most striking events and innovation in customer research, or
Property Management for the welcome and quality of service.
The Group continuously improves its customer service
strategy for retail assets, named the Welcome Attitude.
In 2012 the Group launched the “4 Star label” initiative to
increase customer comfort and ensure consistency of quality
and services in the Group’s managed malls. It is intended
to provide customers with a unique shopping experience
through a welcoming atmosphere, quality management and
a set of “hotel-like” services: reception desk, valet parking,
personal shopper, shoes-shiner, free wifi , free newspapers,
iPad bar, etc. This label is based on a 571-point referential
and with an external audit conducted by the world leader in
certifi cation, SGS. The referential was developed by closely
listening to customers, and based on a satisfaction survey in
which 22,000 customers participated. In 2012, nine shopping
centres were awarded with the “4 Star label”, and 2 others
were successfully audited. The Group aims to successfully
audit at least 30 managed shopping centres according to the
“4 Star label” by the end of 2014.

CONSOLIDATED FINANCIAL STATEMENTS
CORPORATE SUSTAINABILITY
BUSINESS REVIEW AND 2012 RESULTS
PORTFOLIO
UNIBAIL-RODAMCO - FINANCIAL REPORT 2012 84 • 85
To satisfy its customers and facilitate their shopping
experience from their arrival until their departure, the Group
invests heavily in services such as rest areas and smart
Traffi c Management Systems (parking which guides cars in
real-time towards free slots allowing time and fuel savings).
At the end of 2012, already 25 shopping centres across the
Group were equipped with smart parking solutions. Further,
by organising differentiating events across its shopping
centres through exclusive partnerships, such as the Cirque
du Soleil or the Elite international modelling competition, the
Group is able to enhance the attractiveness of these assets
for visitors.
In addition to promoting its loyalty cards, a booming
‘digital marketing’ approach based on Facebook recruitment,
smartphones apps and websites for individual shopping
centres contribute to the Group’s permanent interactive
dialogue and loyalty with its customers. At the end of 2012,
the Group counted 1.3 million apps downloaded, 2.6 million
Facebook fans and 679 453 loyalty cards for its entire retail
portfolio.
To continuously improve the quality of service to its
customers and measure progress in this area, the Group
conducts annual customer satisfaction surveys and two
internal quality audits per year for each of its shopping
centres. Customer satisfaction surveys were conducted in
59 assets in 2012 with 27,067 interviews. The average score
across the Group was 7.6/10, and 95% of customers surveyed
were reported as very or rather satisfi ed. Internal quality
audits were used to assess 301 services and comfort criteria.
These audits help to ensure that the Group’s assets maintain
their prime position on the market. Unibail-Rodamco is
committed to maintain the customer satisfaction survey score
above 8,0 /10 for the managed retail portfolio.
2010 2011 2012
Average score in internal quality audit 86% 82% 86%
The score decrease in 2011 compared with 2010 result
represents a change in the methodology, in order to increase
the comprehensiveness of the answers and improve the
quality of the audit.
Many of the Group’s shopping centres organise events
and communication campaigns to promote environmentally-
responsible behaviour among their customers and highlight
the asset’s environmental performance and objectives. In
2012, a sustainability charter (four social commitments and
four environmental commitments) was launched as a pilot in
France in some shopping centres through website and on-site
signage.
4.3. Tenants
Strong, mutually benefi cial relationships with tenants
are fundamental to the Group’s long-term success and
sustainability. Unibail-Rodamco devotes considerable energy
to attracting premium retailers and supporting their national
and international expansion via its extensive network of well-
located, prime shopping centres. The prime and relevant tenant
mix offer is a key driver for attractiveness, differentiation from
competitors, and therefore customer retention for the Group.
Annual “retailer open house” events are held in each region
to present the Group’s portfolio of existing assets and new
developments to current and potential tenants. The Group
is also committed to leasing space and providing support to
entrepreneurs and smaller national and local retailers.
To strengthen the dialogue with tenants, the Group conducts
annual tenant satisfaction surveys in each shopping centre,
holds one-on-one meetings with tenants, and participates in
retail industry round tables and conferences. In 2012, 7,361
tenants responded to the Group’s satisfaction survey, with a
global response rate of 45%. Unibail-Rodamco’s target for
2013 is to increase the response rate to 50%.
Tenants are the Group’s most important partner when it
comes to reducing the global environmental footprint of its
assets. A proactive “green lease” policy, launched in late 2009
and founded on dialogue, information and the sharing of best
practices, is encouraging tenants to play an active role in
on-site environmental management. As well as contributing
to lower common and private service charges through
decreasing energy and utilities consumptions, these efforts
are helping all parties to prepare for a tougher regulatory
environment in the future.
Ahead of all existing regulation, all new leases and
renewals signed with retail and office tenants contain
environmental clauses. These “green” leases cover the
issues that are most relevant to improving environmental
awareness and performance among tenants, such as the
sharing of energy consumption data, technical specifications
for fi t-out projects (especially maximum power for private
lighting), and measures for tenant’s employees in order to
encourage energy, water savings and the recycling of waste.
1,633 of these “green” leases, which regardless of the size
of surface leased, were signed in 2012 for both existing or
developpment portfolio. In three years, 49.5% of Group’s active
leases includes “green lease” clauses. Unibail-Rodamco set
an ambitious target aiming to reach 90% of green lease for
total active Retail and Offi ce portfolio by 2016.
In addition to the tenants’ associations which are active
in most assets, tenant-landlord environmental committees
are now set up in 59% of managed shopping centres in 2012
compared to 43% in 2011.

REPORT OF THE CHAIRMAN OF THE SUPERVISORY BOARD
LEGAL INFORMATION
FINANCIAL REPORT 2012 - UNIBAIL-RODAMCO 84 • 85
KPI: Green leases
2010 2011 2012
Number of “green” leases signed 1,180 1,434 1,633
Percentage of “green” leases signed for all new office/retail leases (including renewals) 79% 85.3% 92.8%(1)
Percentage of total “green” leases compared to the Group’s total active leases (cumulated ) 18% 32% 49.5%
(1) Figures are calculated covering Group’s retail and France’s offi ces portfolio.
4.4. Suppliers and contractors: Supply Chain Management
According to the varied nature of purchases and the
scattered locations of its properties, Unibail-Rodamco works
with a large number of suppliers and contractors, most of
them are local players or are subsidiaries that support the
local economy.
Purchases at Unibail-Rodamco can be split into:
• services provided to properties for daily on site exploitation,
such as cleaning, maintenance, security, waste
management, energy and fl uid provision, and marketing
expenses (OPEX paid by the property owner and mostly
recharged to tenants as service charges);
• the capitalised construction work invested in properties for
three main purposes: enhancement works for development,
maintenance works or re-letting works (CAPEX paid by
the property owner); these mainly include purchases to
constructors, fees for architects, designers and engineering
fi rms, insurance premiums;
• overhead costs, including offi ce management, business
travels, consulting and audit fees, corporate communication
costs, IT, and other administrative costs – this for the entire
Group’s staff and regional headquarters.
Overheads being not so signifi cant in the overall expenses,
the purchases are mainly composed of OPEX and CAPEX
for the operation and development of properties. Purchases
analysis are performed per domain and per country. In France
purchases mappings are consolidated twice a year for all
operational services per type covering both exploitation and
works.
Most of the purchases correspond to services on assets
and provided by the local work-force working on site. As much
as it is possible, the purchasing policy promotes local market
procurement in the primary catchment area of the Group’s
assets in order to contribute to local employment and the
economy.
The purchasing strategy of the Group is meant to comply
with the following rules: a focus on quality, long-term
partnerships, reduced risk and the respect for both applicable
regulations and the entrustment given to Unibail-Rodamco
through the property management contract which strives to
be transparent and cost effi cient.
Unibail-Rodamco places important attention on the choice
of its contractors, in order to make sure that they comply with
the Group’s purchasing policy. This is why that since 2010, the
Group has implemented a Group wide purchasing procedure
in order to guarantee an optimised price for the best level of
service, to encourage equal treatment between providers/
suppliers (transparency), to protect owner interests, and to
respect the approved budget per property. Tender process
and the use of standard contracts are the rule. General
Purchasing Conditions apply for all the countries in which the
Group operates and also includes social and environmental
requirements.
In addition to the principles and rules detailed in
this procedure, all purchases must respect the Group’s
Compliance Book, the applicable local country laws and
regulations, and standard contracts, in particular in terms of
sustainability clauses. The Group-wide purchasing policy and
processes in place permit to better identify risks in the supply
chain. Each of the steps in purchasing is duly documented for
traceability. Internal compliance rules state that the suppliers
of all goods and services must be selected equitably on the
basis of objective, comparable criteria and, when relevant,
according to a procedures applying to invitations to tender
process. In the case of a complaint against the Group, the
supplier can contact the Group’s Compliant Offi cer to expose
and solve the situation. Unibail-Rodamco’s Corporate Internal
Audit carries out regular audits across the Group to assure
the thorough application of the Group’s purchasing policy and
Compliance Book.
Sustainability is fully integrated in each step of the
procurement process and all procurement staff (project
managers for construction works, and technical managers on
site) which have been trained to respect the Group’s rules and
purchasing procedures. When referencing a new supplier,
a detailed list of information is required, and includes the
main sustainability information identifi ed as a priority. The
sustainability issues are part of the selection criteria, both for
tenders and for designation.
To encourage existing suppliers and contractors to adopt
sustainable operation practices and use environmentally
sustainable materials, Unibail-Rodamco is communicating
with key suppliers about its environmental and social
objectives and asking them to share their sustainability
policies and practices. Service providers in existing assets,
primarily cleaning, facilities management and security
providers, are also asked to sign a contract addendum.
The addendum covers a range of issues, including energy
effi ciency, waste, use of environmentally-sound products
and materials, and social and ethical behaviour (notably an
engagement to comply with International Labour Organisation
(ILO) conventions and local labour laws and regulations).

CONSOLIDATED FINANCIAL STATEMENTS
CORPORATE SUSTAINABILITY
BUSINESS REVIEW AND 2012 RESULTS
PORTFOLIO
UNIBAIL-RODAMCO - FINANCIAL REPORT 2012 86 • 87
Initiatives are also in place on incentive for energy savings
or on the waste segregation performance. These site by site
practices are challenging suppliers and integrate them in a
process of continuous improvement for all managed assets.
Measuring performance:
• In 2012 a yearly assessment was performed for 341 key
maintenance, cleaning and security suppliers in 84 Shopping
Centres, Offi ces and Convention & Exhibition venues for a
the total contract purchase of €119 million. This enabled
the Group to verify their compliance with environmental
clauses, management practices and service quality.
• 76 French suppliers have signed the Group’s environmental
addendum in their contracts.
• 56% of operational service providers in France have a
certifi cation: ISO 14001, ISO 9001, ISO 18001, OHSAS…
It represents 83% of maintenance, cleaning, waste
management and security purchases (in euro).
• In 2012, as part of the Group’s “4 Star” criteria, Unibail-
Rodamco launched mandatory trainings in “customer-
service” skills for the staff of suppliers in the roles of
security and cleaning across all Shopping Centre’s labelled
“4 Star”’. In France, maintenance suppliers are freely
trained to the Group’s Environmental and Health & Safety
processes.
KPI: Suppliers assessment [GRI HR1]
Evaluate the compliance of security, cleaning and
maintenance suppliers with environmental clauses,
management and service quality.
2012
Number of suppliers evaluations performed 341
Percentage of security, cleaning, and maintenance suppliers assessed (%) 100
Amount in euro of service charges evaluated (€) 119,105,931
4.5. Investors and shareholders
Unibail-Rodamco is listed on a number of prestigious
SRI indexes (see pages 55-56 for details). The Group shares
its sustainability strategy and achievements with investors
in dedicated sessions. In 2012, the Group met 61% of its
shareholders and approximately 370 different investors
in meetings, events and site visits. 16 investors were met
specifi cally on the subject of sustainable development. These
meetings also enable Unibail-Rodamco to learn more about
its investors’ vision of sustainability in the real estate sector
and to improve its yearly notations in the different SRI indexes.
Sustainability information is regularly disclosed to the
Group’s investors, through the annual results and regular
publications and letters. Unibail-Rodamco participates in the
Carbon Disclosure Project and is a signatory of the UN Global
Compact.
5. PHILANTHROPY
In 2012, a total of €4,183,285, in cash and in kind, was donated;
representing a 44% increase compared to 2011. These
donations originated from three sources: (i) shopping centres
and regional initiatives contributed €2,284,561; (ii) corporate
donations totalled €548,723 and (iii) the Grand Prix des Jeunes
Créateurs, to which the Group donated €1,350,000. In 2012,
more than 397 local charity fundraising and awareness events
were held in the Group’s shopping centres.
Philanthropy at Unibail-Rodamco aims to support
the education of young people, entrepreneurs and those
in need. To this extent, the group develops educational,
entrepreneurial and social initiatives. Unibail-Rodamco’s
employees are encouraged to carry these values and to get
involved in the different actions the Group supports.
Since 2011, the Group decided to place a new focus on the
involvement of its employees in philanthropic activities. This new
trend commenced with two initiatives: Majunga and Frateli.
5.1. Entrepreneurship
The Grand Prize for Young Retail Entrepreneurs is an
action that aims to harness the creativity of tomorrow’s
retail stars by providing them with the fi nancial and logistical
support they need to start their business. It is the most
signifi cant action supporting the creation of new business in
France, distributing prizes of a value of €1.35 million to the
three winners.
VIPARIS, the Group’s convention and exhibition division,
also encourages entrepreneurship and innovative thinking
in its sector by organising the ”Originality Prize”, which
rewards the most original and creative approach to an event.
In 2012, the main prize winner was ”The Champions Match”;
a basketball match on the stage of a music hall, between
the annual winner of the French Cup and the winner of the
previous year. The event which transformed sport into a
unique experience attracted nearly 3,000 spectators.
5.2. Architecture
Inspired by the construction of the Majunga tower
in La Défense, which is due to be completed in H1 2014,
the Group further reaffi rmed its support for education,
by partnering with the associations Écoles du Monde and
Enfants de Majunga, to completely fund a school in Majunga,
Madagascar, designed by renowned architect Jean-Paul
Viguier. A fundraising event was organised in the Group’s
headquarter, where employees contributed to the school’s
funding. The school will be delivered in H4 2013.
In 2012, the Group launched a cycle of conferences
in Architecture, aimed to raise a debate on questions
surrounding the future of cities and urban planning.

REPORT OF THE CHAIRMAN OF THE SUPERVISORY BOARD
LEGAL INFORMATION
FINANCIAL REPORT 2012 - UNIBAIL-RODAMCO 86 • 87
Jean Nouvel (Pritzker Price winner 2008) was invited to talk
at the fi rst conference, followed by Ricardo Bofi ll. These
conferences target the students of Architectural schools in
Paris, the Group’s employees and the general public. Other
leading architects such as Renzo Piano (Pritzker Price
winner 1998) and Winy Maas are expected to animate these
conferences in the near future.
5.3. Social
The Group continued to support its partnership with
École de la Deuxième Chance (E2C, School of the Second
Chance), which provides 18-25 year olds, who have little or
no qualifi cations, with the training and support they require to
access further education or employment.
The Group continued its partnership with Frateli, an
initiative that mentors students with high potential who lack
the opportunities to access higher education and a subsequent
career due to modest or unfavorable backgrounds. It is the
fi rst association of its kind in France that wishes to accompany
students of high potential. The program integrates three
phases in order to comprehensively accompany the student
through his academic career and the employment market.
6. HUMAN RESOURCES
Unibail-Rodamco aims to offer a working environment that
promotes equality and diversity, and provide its employees
with the skills and opportunities they require to build exciting
and rewarding careers. Recruitment and human resources
policies are designed to attract and retain the best talents on
the market.
6.1. Reporting methodology
Throughout the year, Unibail-Rodamco uses a set of Key
Performance Indicators (KPI’s) to track and analyse key data
in the Company to support the implementation of the Group’s
Human Resources policies.
Description of Human Resources Key
Performance Indicators
Human Resources KPI’s are based on precise common
data repositories for all regions. Many of these Human
Resources indicators are outlined in the different tables below
and preceded by a short definition.
Reporting scope
Unibail-Rodamco’s social reporting is based on data from
all the regions where the Group operates and across its three
types of assets; Shopping Centers, Offices and Convention/
Exhibitions (excluding Comexposium) as of December 31, 2012.
Reporting period
Each region controls, collects and consolidates quarterly
data related to their area as part of a common database
accessible by the Corporate Human Resources teams. In
2012, the Group invested in an Human Resources Information
System (HRIS) to further automate the production of Human
Resources data at the Group level. Work was conducted
across the Group in order to build a coherent and structured
system covering all HR reporting needs. Two key regions
tested this implementation to ensure its reliability before
further deployment in 2013.
6.2. Employment and diversity
In 2012, the average headcount for the Group was 1,496
employees. The Group maintained its positive track record for
gender and age diversity: with an equal split between men
and women and a well-balanced age pyramid.
Diversity, in all its forms in the workplace is a key element
of Unibail-Rodamco’s recruitment and mobility strategy. The
Group strongly promotes professionalism, transparency,
effi ciency, humility, team work and mutual respect, regardless
of gender, age, disability, sexual orientation and religion.
These principles are emphasised in the Code of Ethics
and the Group Compliance book of Unibail-Rodamco as a
foundation of our culture. In 2010, Unibail-Rodamco signed
the Diversity and Disability Workplace Charters in France. In
2012, a European Diversity Charter was deployed throughout
the Group emphasising principles and practices to combat
any kind of discrimination and harassment.
In 2010, a specifi c action plan was launched to promote
the employment of disabled people in France with a brochure
given to all the employees explaining Unibail-Rodamco’s
commitment towards disability. All the French HR teams
(who manage 70% of the Group’s employees) were trained.
Annually, the Corporate recruitment team participates in a
forum concerning the employment of people with disabilities,
as well as other specifi c meetings. In France, job offers are
open to disabled people and identifi ed through a logo, found
in each offer. Finally, Unibail-Rodamco employs 16 disabled
people, despite the diffi culties of declaring a disability for the
people concerned. The Group across the regions in which it
operates, purchases offi ce supplies, where possible, from
companies employing disabled people and gives a priority to
companies that have a sheltered workshop status.
The Group ensures that the standards set out in these charters
are respected across all regions from the time of recruitment
onwards. Candidates are asked to submit anonymous CVs to
ensure that academic profile and proven achievements are the
sole criteria for selection. The talent review process is based on
a 360° assessment system which allows decision making based
on objective achievements and competencies.

CONSOLIDATED FINANCIAL STATEMENTS
CORPORATE SUSTAINABILITY
BUSINESS REVIEW AND 2012 RESULTS
PORTFOLIO
UNIBAIL-RODAMCO - FINANCIAL REPORT 2012 88 • 89
In parallel, the Group has developed partnerships with
associations such as the “Ecole de la 2ème Chance” and
“Frateli” in order to support young people in their education
and job search. Within the Frateli association partnership,
the Group encourages employees to mentor high-potential
students from modest backgrounds in order to help them
during their post-secondary school studies.
The Group participates in the voluntary, non-profit
BoardWomen Partners program, which aims to improve
the Corporate Governance of European listed companies
by increasing the number of women present on their
Supervisory Boards.
In 2012, 37.2% of management position were held by
women, versus 36.0% in 2011.
At the end of 2011, the “Women@UR” network was
launched. It includes a mentoring program for women, events
with external guest speakers, a social network (including a
Facebook page), and an excellent leadership development
course dedicated for women.
KPI: Employment by country [GRI LA1,LA13]
Sum of the headcount on the last day of each month in the
year in each region divided by 12
2011 % 2012 %
Austria 67(2) 4.6% 61 4.1%
Czech Republic 35 2.4% 35 2.4%
Denmark 10 0.7% 9 0.6%
France(1) 1,015 69.3% 1,046 69.9%
Netherlands 61 4.2% 62 4.1%
Poland 41 8.8% 39 2.6%
Slovakia 0 0% 7 0.5%
Spain 135 9.2% 147 9.8%
Sweden 100 6.8% 90 6.0%
Total 1,464 100% 1,496 100%(1) This figure includes 100% of VIPARIS employees (399 in 2011 and 390 in 2012).(2) This fi gure includes Slovakia in 2011 (0,3).
KPI: Employment by activity [GRI LA1,LA13]
Sum of the headcount on the last day of each month in the
year in each activity divided by 12
2011 2012
Offices 16 18
Shopping Centres 550 563
Convention & Exhibition(1) 399 390
Development(2) 85 90
Shared Services 230 242
Headquarters 184 193
Total 1,464 1,496(1) These figures include 100% of VIPARIS employees.(2) Offices and Shopping centre development.
KPI: Employment by age [GRI LA1,LA13]
Workforce at December 31
2011 2012
< 30 years old 24.2% 26.5%
30-40 years old 35.7% 34.2%
40-50 years old 24.3% 23.6%
> 50 years old 15.8% 15.7%
KPI: Employment by gender [GRI LA1,LA13]
Workforce at December 31
2011 2012
Women 49.2% 49.7%
Men 50.8% 50.3%
6.3. Career management
A job grading system provides a common, consistent and
transparent language, that supports careers and mobility across
the Group. Employees receive regular support and advice on
career development. Employees meet with their manager at
least once a year to discuss their performance objectives and
career progression, to review their achievements and identify
possible training needs. A 360° feedback review process, which
is hierarchical, peer-to-peer and upward, is held annually to
provide employees and managers with comprehensive feedback
on their strengths and development needs and allow objective
decisions in term of career planning. 100% of employees are
reviewed in the Group’s Talent Committees each year. The Talent
Review process is entirely conducted via an IT Portal.
Internal mobility between core disciplines is strongly
promoted. This approach provides employees with an
in-depth understanding of the technical processes and
business priorities at different stages in the lifecycle of
the Group’s assets. It helps employees to build networks
and share best practices between the different regions. In
2012, 22 people worked abroad on an international mobility
assignment. During the year, 164 employees made a lateral
geographical career shift within the Group and 159 employees
were promoted.
6.4. Training – UR Academy
Unibail-Rodamco’s training and mobility policies are
designed to ensure that employees have the skills and
confidence required to make sound decisions in complex
situations that involve large assets and important sums of
money. Targeted training is backed by on-the-job experience
and mentoring to accelerate skills acquisition for new
recruits, enable career progression and support transitions
to new positions, functions and/or countries.

REPORT OF THE CHAIRMAN OF THE SUPERVISORY BOARD
LEGAL INFORMATION
FINANCIAL REPORT 2012 - UNIBAIL-RODAMCO 88 • 89
General business and management skills are taught via a
combination of internal and external experts and are delivered
through the Unibail-Rodamco Academy which includes 154
different training programs which are regularly reviewed and
updated.
In 2012, the Group deployed several new programs for
managers at all levels covering basic management skills,
project management, performance management, feedback and
management coaching. Over 300 managers were trained in 2012
versus almost 180 in 2011.
Another focus area in 2012 was training sessions to support
our new business initiatives (4 Star/Iconic Shopping Centre/
Dining Experience/Leasing managers@UR). Over 500 employees
were trained across all regions.
Sustainability and Ethics training programs were also
expanded: the “Prevention of psycho-social risks” training
was deployed in all regions through the Group. This training
is aimed at sensitising managers about psycho-social risks in
the workplace, covering topics such as stress and harassment.
Since 2011, the Group’s e-learning course on the Code
of Ethics, was delivered to more than 1,000 employees
across the Group to ensure that employees in all regions
understand how the Code should be applied during day-to-day
business operations. Finally, representatives from all regions
participated in a sustainability seminar and training course in
Paris. Training sessions were held on environmental Design
Guidelines, BREEAM assessment and ethical business
behavior for corporate development. Additional sessions aimed
at increasing awareness towards sustainability policy were
held for local teams in the regions. An e-learning sustainability
course will be deployed in 2013 in the Group.
KPI: Training (GRI LA10)
Sum of all the hours of training attended by Employees with
permanent and fixed term contracts
2011 2012(1)
Total number of hours provided 26,083 31,394
Average number of hours per employee(2) 18.0 20.4
(1) Indicators for which a limited assurance has been delivered by Ernst &Young. The statutory auditor’s report is available on pages 112-113 and on the Group’s website: www.unibail-rodamco.com(2) Based on effective headcount at the end of the year.
6.5. Mobility
The Group recruits “the best-in-class” talent from leading
business and engineering schools across Europe. In 2012,
the Group recruited 39 young graduates into the European
Graduate Programme (EGP) across all its Regions. A total of
75 people – of 14 different nationalities – participated in the
program during this year. Unibail-Rodamco is recognised as
the n°1 company in France for the “High level of responsibility
offered to recently-hired young graduates” (2011) and “the ideal
employer for leadership opportunities” (2012) by Universum,
one of the largest surveyors of young graduates.
Employee turnover, as measured by the number of
resignations, dismissals, mutual agreements, retirements
and departures during probationary periods over permanent
headcount at the end of 2012, stood at 13.6% in 2012 (versus
18.6% in 2011).
KPI: Recruitment [GRI LA1, LA2]All new comers (excluding internships)
2011 2012
Permanent contracts 244 257
Fixed-term contracts 70 52
Apprenticeships(1) 6 2
Total 320 311
(1) Excluding internships (35 in 2011 and 52 in 2012).
KPI: Departures (GRI LA2) All departures (excluding internships)
Reasons for departures 2011 2012
Resignations 144 88
Dismissals 33 31
Mutual Agreements 82 55
Retirements 6 7
Departures during probationary periods 23 21
Expiry of temporary contracts 59 36
Outsourcing 19 4
Deaths 0 0
Total 366 242
6.6. Employee Well-being
A Group-wide employee Health and Safety policy is in place
to promote a safe working environment.
In order to support this policy, Unibail-Rodamco is
committed to:
1. Reporting all injuries and work-related illnesses;
2. Identifying and preventing hazards in the workplace;
3. Preventing the recurrence of all major incidents;
4. Providing information and training to avoid hazards;
5. Ensuring excellence in employee health and well-being;
6. Promoting effective Management Practices.
In 2012, the Group deployed First Aid training with the Red
Cross across all regions. A brochure was published on the
intranet giving useful advice and tips on health and safety in
the workplace.
A specifi c focus was placed on the prevention of psycho-
social risks with the extension of the French training
approach to all Regions. The Group wanted to emphasise the

CONSOLIDATED FINANCIAL STATEMENTS
CORPORATE SUSTAINABILITY
BUSINESS REVIEW AND 2012 RESULTS
PORTFOLIO
UNIBAIL-RODAMCO - FINANCIAL REPORT 2012 90 • 91
deep importance of the health and safety of its employees and
prevent unethical behaviour and harassment of any kind.
The Group also develops regular efforts to foster employee
health and well-being such as, for instance, Christmas and
New Year parties, an annual football tournament involving
teams from all regions, total or partial reimbursement
for health club memberships for employees, fresh fruit
distributed free of charge to all employees, and ergonomic
assessments by a trained consultant in several countries.
Unibail-Rodamco entities have undertaken various
initiatives to organise statutory working time. These measures
take into account the specific operating requirements of each
site and business line within the Group. The most common
arrangements adopted are as follows:
• a fixed annual number of working days for executives;
• or in another case a shorter working weeks and extra leave days;
• an annual number of working hours and yearly adjustment
for certain employee categories (mainly VIPARIS).
In addition, 3.5% of employees work part-time or fewer
fixed days per year, corresponding to a range between 40%
and 90% of the full-time activity rate.
KPI: Labour contracts
Employees by contract type 2011 2012
Permanent contract 97.1% 97.5%
Fixed-term contract 2.9% 2.5%
Employees by contracted hours 2011 2012
Full-time contract 95.3% 96.5%
Part-time contract(1) 4.7% 3.5%(1) Corresponding to between 40% and 90% of a full-time activity rate.
In 2012, sickness absences totalled 13,103 calendar days
(2,39% of total calendar days) and lost days for injuries and
occupational diseases represented 728 days (0.13% of total
calendar days).
• Absenteeism is tracked in each region and data is regularly
reported back to management.
• The causes of work-related injuries are studied and
measures are taken to reduce the likelihood that they will
reoccur. In 2012, the injury frequency and severity rates(1)
were respectively of 2.03 and 0.15.
KPI: Absenteeism [GRI LA7]
N° of incidents
Injuries 14
Work-related fatalities 0
Number of calendar
days Ratio*
Lost days for injuries 728 0.13
Lost days for sick leave 13,103 2.39
Last days for personal/family events 925 0.17
Total 14,756 2.69%
* The absenteeism rate is calculated in calendar days: total number of missed (absentee) days in 2012/(366 * average headcount 2012).Not counted in the absenteeism ratio: maternity/paternity/parental leaves which represented 10 672 calendar days (1.95% of total calendar days).Not counted in the absenteeism ratio: other absences such as sabbatical leaves which represented 306 calendar days (0.06% of total calendar days).
6.7. Remuneration
Unibail-Rodamco works to ensure that there is no
difference between the remuneration of men and women who
do the same job and have similar responsibilities. All young
graduates in a given country are recruited at the same base
salary, regardless of gender or age.
Remuneration policy is designed to encourage individual
achievement and support the long- term growth of the Group.
In 2012, 65.7% of Group employees received an individual Short
Term Incentive (STI). On a like-for-like headcount basis, total
salaries increased by an average 3.9% between 2011 and 2012.
KPI: Remuneration breakdown [GRI LA14, EC1]
Comparison of remuneration (in euros) for similar positions across the Group in 2012(1)
Women Men
% per category
Average gross
monthly salary(2)
% per category
Average gross
monthly salary(2)
Accountants 72% 3,091 28% 3,277
Analysts(3) 56% 3,525 44% 3,530
Assistants 95% 2,849 5% 2,589
Controllers 33% 3,901 67% 4,872
Development/Investment 17% 5,361 83% 5,312
IT managers & project heads 22% 6,091 78% 5,220
Leasing 63% 5,146 37% 4,990
Legal managers 67% 4,438 33% 4,765
Marketing managers (shopping centres) 91% 3,581 9% 3,096
Operating managers 48% 5,305 52% 5,350
Property Maintenance & Purchasing (PMP) 14% 3,643 86% 3,951
Shopping centre managers 41% 5,511 59% 5,414
(1) Positions composed of more than 12 staff in the Group, excluding VIPARIS.(2) Average gross monthly salary equals annual fixed salary plus individual STI divided by twelve.(3) “Analyst” category encompasses all employees graded “Analyst” in the job grading system.
(1) The injury frequency rate is the number of work accidents in 2012 multiplied by 1,000,000 divided by the number of hours worked. The injury severity rate is the number of lost days in 2012 due to work accidents multiplied by 1,000 divided by the number of hours worked.

REPORT OF THE CHAIRMAN OF THE SUPERVISORY BOARD
LEGAL INFORMATION
FINANCIAL REPORT 2012 - UNIBAIL-RODAMCO 90 • 91
Total remuneration(1) 2009/2010 2010/2011 2011/2012
Annual increase in average salary, including individual STI 2.5% 4.1% 3.9%
(1) Based on like-for-like headcount.
Variable remuneration 2010 2011 2012
Received an individual STI* 65.0% 64.1% 65.7%
Received stock options 18.6% 19.8% 20.0%
* Individual Short Term Incentive paid year N/effective headcount at the end of the year N-1.
In 2012, 672,202 options and 44,975 performance shares
were granted to 20.0% of total employees and MB members at
no discount to the share price at the time of allocation. These
options and performance share were all subject to conditions
based on Unibail-Rodamco’s share price performance
compared with that of the EPRA Euro zone index, which is a
benchmark for the sector’s performance.
In 2012, the Group supported the voluntary saving
contribution of its staff by making a total employer gross
contribution of 499 k€.
On December 31, 2012, more than 69.3% of eligible
employees (excluding Viparis) were shareholders of Unibail-
Rodamco through the Group’s Saving Plan.
In France, employees this year received an exceptional
bonus which reached up to 600€ per employee as part of the
French law on the distribution of dividends. The approach
taken was to award the highest bonuses to people with lower
salaries.
The Group reinforced a KPI system for its leasing
managers in 2012. A similar KPI approach was deployed in
2012 for the Shopping Centre Managers across the Group. In
2012, sustainability criteria were included for the fi rst time in
the Group Management Team’s performance assessment and
variable compensation.
6.8. Employee relations
Unibail-Rodamco abides by the labour standards as
outlined by the International Labour Organisation (ILO).
Unibail-Rodamco only operates in the European Union
where the social regulations are well developed through
democratic and parliamentary frameworks. Internally,
specifi c frameworks have been set up in order to defi ne
and manage complementary legislation which reinforces
the rights of employees and strongly endorses respect and
ethics in business (collective agreements, Code of Ethics,
compliance book).
Unibail-Rodamco works closely with employee
representative bodies in compliance with the local labor
laws of the various European countries where the Group is
present. The Group chose to become a European Company
in April 2009. As part of this transformation, a European
Employees’ Committee (EEC) was created. Each European
country (with more than 9 employees) within the Group is
entitled to have at least one representative on the EEC. The
EEC is held twice per year in two different countries to discuss
key topics (Group results and forecasts, project development
and investments, new business strategy, HR policy, etc.).
In 2012, the Group continued to conduct employee surveys.
For the 3rd year in a row, an EGP survey was deployed to all
newcomers in the program. This survey covers induction,
expectations, appreciation of the EGP program and explored
ways of improvement for the future. This survey yielded very
positive results. Another survey was conducted in partnership
with Mckinsey on a representative sample of employees in
France, and all employees in Poland and Czech Republic. This
survey known as the Organizational Health Index included
over 80 questions covering topics ranging from climate and
culture, to leadership and strategy considerations.
In addition, the Group conducted social relations meetings
in the regions with representative employee Committees and
Unions on various subjects (almost 140 meetings in 2012
across the Group) and new Employees representatives were
elected in France in 2012.
Currently, 31 agreements signed with Unions are in force
in France (Viparis included) and cover a variety of topics
including Professional equality between men and women,
Senior employment, profi t sharing, working hours, annual
salary agreements, etc. The “Professional equality between
men and women” agreement, applicable since 2012, reiterates
the importance attached to the respect for equality between
women and men both as regards access to employment,
conditions of employment, career and remuneration and
defi nes and encourages the connection between work and the
exercise of family responsibility. Beginning 2013, a followup
will be done to measure results.
At the end of 2012, the Group started to deploy a specifi c
action plan about Health and Safety issues in France, with
a focus on psychosocial risk prevention. The results of
this initiative, which was piloted with specialised external
consultants in coordination with representative employees, will
be fully known and deployed during the 1st semester of 2013.
On December 31, 2012, 90.7% of employees were covered
by collective bargaining agreements. The remaining 9.3% is
dependant on countries where this scheme is not applicable
KPI: Collective bargaining [GRI LA4]
Labour relations 2011 2012
Employees covered by collective bargaining agreements 90.4% 90.7%

CONSOLIDATED FINANCIAL STATEMENTS
CORPORATE SUSTAINABILITY
BUSINESS REVIEW AND 2012 RESULTS
PORTFOLIO
UNIBAIL-RODAMCO - FINANCIAL REPORT 2012 92 • 93
6.9. Organisational structure in 2012
Catherine Pourre (1)
Member of the Management Board
Chief Resources Officer
Jaap Tonckens (2)
Member of the Management Board
Chief Financial Officer &Chief Investment Officer
Guillaume PoitrinalChairman of the
Management BoardChief Executive Officer
Christophe CuvillierMember of the
Management BoardChief Operating Officer
Markus PichlerManaging Director Austria/Slovakia
Simon OrchardManaging Director
Spain
Olivier CoutinManaging Director Nordic
Countries
Michel DessolainManaging Director
Strategy & Innovation
John van HaarenManaging Director
Benelux
Elizabeth MathieuManaging Director
New Markets
Olivier BossardGroup Managing Director
of Development
Renaud HamaideManaging Director
Convention &Exhibition France
Arnaud BurlinManaging Director
Central Europe
Jean-Marie TritantManaging Director Retail
and Offices France
Valérie BritayDeputy Managing Director
Retail
Jean-Jacques LefebvreManaging Director Major
Construction Projetcs
Fabrice MouchelDeputy Chief Financial
Officer
Andrew FarnsworthGroup Director
of Human Resources
David ZeitounGroup Director of Legal
Members of the Management Board
Members of the Management Team
(1) In charge of IT, Organization and Sustainability.(2) In charge of Investments.
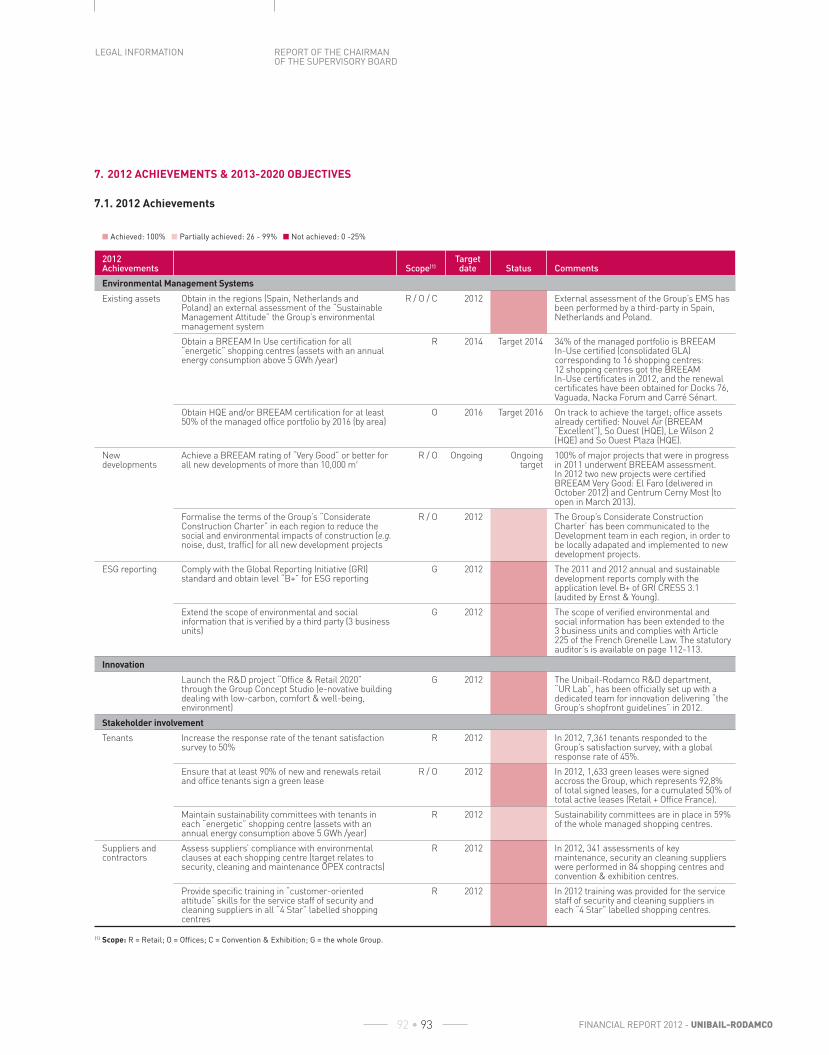
REPORT OF THE CHAIRMAN OF THE SUPERVISORY BOARD
LEGAL INFORMATION
FINANCIAL REPORT 2012 - UNIBAIL-RODAMCO 92 • 93
7. 2012 ACHIEVEMENTS & 2013-2020 OBJECTIVES
7.1. 2012 Achievements
■ Achieved: 100% ■ Partially achieved: 26 - 99% ■ Not achieved: 0 -25%
2012 Achievements Scope(1)
Target date Status Comments
Environmental Management Systems
Existing assets Obtain in the regions (Spain, Netherlands and Poland) an external assessment of the “Sustainable Management Attitude” the Group’s environmental management system
R / O / C 2012 External assessment of the Group’s EMS has been performed by a third-party in Spain, Netherlands and Poland.
Obtain a BREEAM In Use certifi cation for all “energetic” shopping centres (assets with an annual energy consumption above 5 GWh /year)
R 2014 Target 2014 34% of the managed portfolio is BREEAM In-Use certifi ed (consolidated GLA) corresponding to 16 shopping centres: 12 shopping centres got the BREEAM In-Use certifi cates in 2012, and the renewal certifi cates have been obtained for Docks 76, Vaguada, Nacka Forum and Carré Sénart.
Obtain HQE and/or BREEAM certifi cation for at least 50% of the managed offi ce portfolio by 2016 (by area)
O 2016 Target 2016 On track to achieve the target; offi ce assets already certifi ed: Nouvel Air (BREEAM “Excellent”), So Ouest (HQE), Le Wilson 2 (HQE) and So Ouest Plaza (HQE).
New developments
Achieve a BREEAM rating of “Very Good” or better for all new developments of more than 10,000 m²
R / O Ongoing Ongoing target
100% of major projects that were in progress in 2011 underwent BREEAM assessment. In 2012 two new projects were certifi ed BREEAM Very Good: El Faro (delivered in October 2012) and Centrum Cerny Most (to open in March 2013).
Formalise the terms of the Group’s “Considerate Construction Charter” in each region to reduce the social and environmental impacts of construction (e.g. noise, dust, traffi c) for all new development projects
R / O 2012 The Group’s Considerate Construction Charter’ has been communicated to the Development team in each region, in order to be locally adapated and implemented to new development projects.
ESG reporting Comply with the Global Reporting Initiative (GRI) standard and obtain level “B+” for ESG reporting
G 2012 The 2011 and 2012 annual and sustainable development reports comply with the application level B+ of GRI CRESS 3.1 (audited by Ernst & Young).
Extend the scope of environmental and social information that is verifi ed by a third party (3 business units)
G 2012 The scope of verifi ed environmental and social information has been extended to the 3 business units and complies with Article 225 of the French Grenelle Law. The statutory auditor’s is available on page 112-113.
Innovation
Launch the R&D project “Offi ce & Retail 2020” through the Group Concept Studio (e-novative building dealing with low-carbon, comfort & well-being, environment)
G 2012 The Unibail-Rodamco R&D department, “UR Lab”, has been offi cially set up with a dedicated team for innovation delivering “the Group’s shopfront guidelines” in 2012.
Stakeholder involvement
Tenants Increase the response rate of the tenant satisfaction survey to 50%
R 2012 In 2012, 7,361 tenants responded to the Group’s satisfaction survey, with a global response rate of 45%.
Ensure that at least 90% of new and renewals retail and offi ce tenants sign a green lease
R / O 2012 In 2012, 1,633 green leases were signed accross the Group, which represents 92,8% of total signed leases, for a cumulated 50% of total active leases (Retail + Offi ce France).
Maintain sustainability committees with tenants in each “energetic” shopping centre (assets with an annual energy consumption above 5 GWh /year)
R 2012 Sustainability committees are in place in 59% of the whole managed shopping centres.
Suppliers and contractors
Assess suppliers’ compliance with environmental clauses at each shopping centre (target relates to security, cleaning and maintenance OPEX contracts)
R 2012 In 2012, 341 assessments of key maintenance, security an cleaning suppliers were performed in 84 shopping centres and convention & exhibition centres.
Provide specifi c training in “customer-oriented attitude” skills for the service staff of security and cleaning suppliers in all “4 Star” labelled shopping centres
R 2012 In 2012 training was provided for the service staff of security and cleaning suppliers in each “4 Star” labelled shopping centres.
(1) Scope: R = Retail; O = Offi ces; C = Convention & Exhibition; G = the whole Group.

CONSOLIDATED FINANCIAL STATEMENTS
CORPORATE SUSTAINABILITY
BUSINESS REVIEW AND 2012 RESULTS
PORTFOLIO
UNIBAIL-RODAMCO - FINANCIAL REPORT 2012 94 • 95
■ Achieved: 100% ■ Partially achieved: 26 - 99% ■ Not achieved: 0 -25%
2012 Achievements Scope(1)
Target date Status Comments
Customers Increase the average score in the internal quality audit by 25% between 2009 and 2012
R 2012 The quality audit score evolved from 82 in 2011 to 86,5 in 2012. It was not possible to calculate the trend of the average score since 2009 due to a substantial change in the methodology to improve the exhaustivity of the answers and the global accuracy of the audit.
Increase the Customer Satisfaction Survey score at 8.0/10
R 2012 Customer satisfaction survey scored was 7.6 in 2012. 68% of the Customers have noticed an improvement of the quality of service in the 4 Star labelled shopping centres.
Obtain the “4 Star” label (the Unibail-Rodamco service quality standard) for 15 managed shopping centres
R 2012 9 shopping centres were “4 Star” labelled in 2012, and 2 others were successfully audited according to the “4 Star” label.
Conduct an annual third-party audit of health and safety risk management in each managed asset
G 2012 In 2012 an annual third-party health & safety risk management audit has been carried out in each managed asset.
Shareholders and investors
Organise meetings on Corporate Governance with fi ve of the Group’s top 10 investors
G 2012 One Corporate Governance roadshow with meetings with APG, BNPP IP and Kempen (respectively #1, #6 and #20 largest shareholders). All top 20 shareholders (except index funds) consulted prior to AGM 2012 on resolutions submitted to shareholders and Corporate Governance issues.
Participate in an investor conference, or organise investor meetings, on sustainable development with at least 10 investors
G 2012 Participation in 3 dedicated SRI conferences in 2012 (Morgan Stanley, Oddo and Rabobank), 13 investors have been met. 3 dedicated SRI one to one meetings with Edmond de Rotschild, Natixis and Amundi AM.
Cover at least 90% of the top 50% of investors by value in meetings with management
G 2012 97% of top 50% of shareholders (excluding index funds) met by management in 2012.
Communities and local authorities
Cooperate with local authorities to launch specifi c sustainability initiatives for at least 15 shopping centres
R 2012 Sustainability initiatives organised in cooperation with local authorities at Carré Sénart, Docks 76, Rennes Alma, Chodov, SCS, Solna, Cité Europe, Vélizy 2, Donauzentrum, Nacka Forum, Arkadia, Galeria Mokotow, Maquinista, Vaguada, Parquesur.
Obtain the S3A label for at least 12 French shopping centres, to show their commitment to welcoming and supporting people with mental disabilities
R 2012 In 2012, 8 French shopping centres got the S3A label (Villeneuve 2, Place d’Arc, Rennes Alma, Meriadeck, Carré Sénart, Labège 2, Forum des Halles, Docks 76) in addition to St Sever.
Environmental responsibility
Climate change adaptation and mitigation
Apply the new climate change risk criteria during the technical due dilligence process for acquisitions
R / O / C 2012 The climate change criteria were checked after the acquisition of MFI assets.
Reduce carbon intensity (CO2 emissions per visit) at
managed shopping centres by at least 50% in 2016 relative to 2006
R 2016 The carbon intensity reduced by -12% in 2012, for a cumulative -58% for CO
2
emissions/visit since 2006, exceeding the -50% target from 2006 baseline.
Increase energy effi ciency (KWh per visit) at managed shopping centres by 30% in 2016 relative to 2006 (& by 20% in 2012 compared to a 2006 baseline)
R 2016 Energy intensity decreased by -7% in 2012, for a cumulative -24% for energy consumption per visit since 2006, exceeding the -20% target from 2006 to 2012.
Resource use Increase water effi ciency (litres/visit) in managed shopping centres by 20% in 2012 relative to 2006
R 2012 Water intensity decreased by -7% in 2012, for a cumulative -14% for water consumption/visit since 2006, below the -20% target from 2006 baseline.
Reduce the proportion of waste sent to landfi ll by 50% in 2016 relative to 2009 (target relates to waste managed by Unibail-Rodamco)
R 2016 Target 2016 On track to achieve target in 2016. The proportion of waste sent to landfi ll reduced by 30% since 2009.
Obtain a waste recycling rate of at least 50% at managed shopping centres by 2016 (target relates to waste managed by Unibail-Rodamco)
R 2016 Target 2016 In 2012, 35% of waste were recycled.
(1) Scope: R = Retail; O = Offi ces; C = Convention & Exhibition; G = the whole Group.
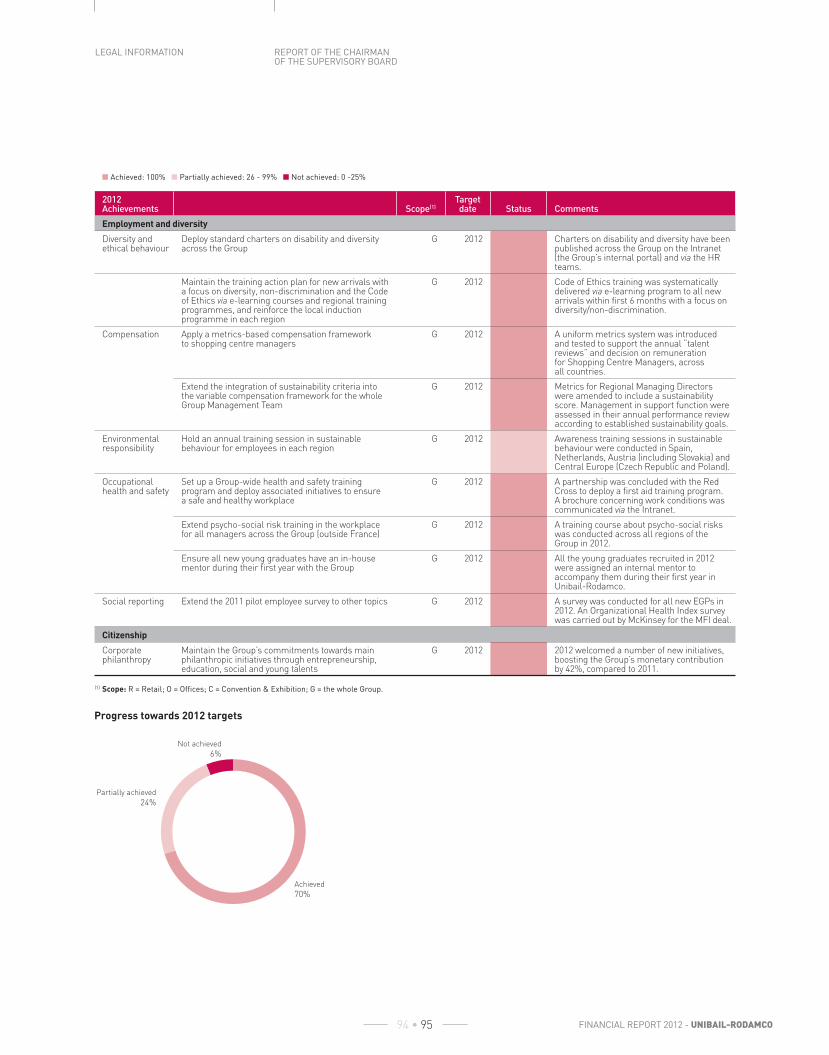
REPORT OF THE CHAIRMAN OF THE SUPERVISORY BOARD
LEGAL INFORMATION
FINANCIAL REPORT 2012 - UNIBAIL-RODAMCO 94 • 95
■ Achieved: 100% ■ Partially achieved: 26 - 99% ■ Not achieved: 0 -25%
2012 Achievements Scope(1)
Target date Status Comments
Employment and diversity
Diversity and ethical behaviour
Deploy standard charters on disability and diversity across the Group
G 2012 Charters on disability and diversity have been published across the Group on the Intranet (the Group’s internal portal) and via the HR teams.
Maintain the training action plan for new arrivals with a focus on diversity, non-discrimination and the Code of Ethics via e-learning courses and regional training programmes, and reinforce the local induction programme in each region
G 2012 Code of Ethics training was systematically delivered via e-learning program to all new arrivals within fi rst 6 months with a focus on diversity/non-discrimination.
Compensation Apply a metrics-based compensation framework to shopping centre managers
G 2012 A uniform metrics system was introduced and tested to support the annual “talent reviews” and decision on remuneration for Shopping Centre Managers, across all countries.
Extend the integration of sustainability criteria into the variable compensation framework for the whole Group Management Team
G 2012 Metrics for Regional Managing Directors were amended to include a sustainability score. Management in support function were assessed in their annual performance review according to established sustainability goals.
Environmental responsibility
Hold an annual training session in sustainable behaviour for employees in each region
G 2012 Awareness training sessions in sustainable behaviour were conducted in Spain, Netherlands, Austria (including Slovakia) and Central Europe (Czech Republic and Poland).
Occupational health and safety
Set up a Group-wide health and safety training program and deploy associated initiatives to ensure a safe and healthy workplace
G 2012 A partnership was concluded with the Red Cross to deploy a fi rst aid training program. A brochure concerning work conditions was communicated via the Intranet.
Extend psycho-social risk training in the workplace for all managers across the Group (outside France)
G 2012 A training course about psycho-social risks was conducted across all regions of the Group in 2012.
Ensure all new young graduates have an in-house mentor during their fi rst year with the Group
G 2012 All the young graduates recruited in 2012 were assigned an internal mentor to accompany them during their fi rst year in Unibail-Rodamco.
Social reporting Extend the 2011 pilot employee survey to other topics G 2012 A survey was conducted for all new EGPs in 2012. An Organizational Health Index survey was carried out by McKinsey for the MFI deal.
Citizenship
Corporate philanthropy
Maintain the Group’s commitments towards main philanthropic initiatives through entrepreneurship, education, social and young talents
G 2012 2012 welcomed a number of new initiatives, boosting the Group’s monetary contribution by 42%, compared to 2011.
(1) Scope: R = Retail; O = Offi ces; C = Convention & Exhibition; G = the whole Group.
Progress towards 2012 targets
Not achieved
6%
Partially achieved
24%
Achieved
70%

CONSOLIDATED FINANCIAL STATEMENTS
CORPORATE SUSTAINABILITY
BUSINESS REVIEW AND 2012 RESULTS
PORTFOLIO
UNIBAIL-RODAMCO - FINANCIAL REPORT 2012 96 • 97
7.2. Long-term targets: a clear vision and objectives through to 2020
As stated in this report the Group has decided to concentrate its efforts and resources on the subjects that count based on the
materiality survey performed, revealing a list of top priorities. As a consequence the Group has reviewed and aligned its sustainability
long-term targets according to these top material issues in order to be more consitent with the Group’s long term vision for value
creation cycle. However the Group will continue to adress and manage internal targets for each operational core function (such as
waste, water, biodiversity, bribery and corruption, land pollution, sustainable procurement…).
Material issues that count for the Group Objectives Scope(1) Target date
Building resilience through innovation and efficient, environmentally-sound buildings
Energy and carbon
Reduce carbon intensity (CO2 emissions per visit) at managed shopping
centres by 30% in 2020 relative to 2012 R 2020
Increase energy effi ciency (kWh/visit) at managed shopping centres by 25% in 2020 relative to 2012 R 2020
Product labelling
Obtain a BREEAM In-Use certifi cation for at least 80% of the managed Retail portfolio with a minimum of ‘Very Good’ for “building management” score by 2016 (by m²) R 2016
Obtain environmental certifi cation (HQE and/or BREEAM) for at least 80% of the managed Offi ces portfolio by 2016 (by m²) O 2016
Achieve a BREEAM certifi cation of minimum “Very Good” rating for all new developments of more than 10,000 m² R / O Standing
Connectivity Promote alternative transport mode in order that the part of visitors coming by individual car targets 35% by 2020 for the managed Retail portfolio (like-for-like) R 2020
Unlock opportunities for tenants and customers to make sustainable decisions for revenue growth, brand value and competitiveness
Tenants Increase the response rate of the tenant satisfaction survey to 50% R 2013
Exceed 90% of green lease for total active Retail and Offi ce portfolio by 2016 R / O 2016
Suppliers Assess suppliers’ compliance with environmental clauses at each managed shopping centre (target relates to security, cleaning and maintenance contracts) R 2013
Provide specifi c training in “customer-oriented attitude” skills for the service staff of security and cleaning suppliers in all “4 Star” labeled shopping centres by 2014, with a minimum of 90% of staff suppliers trained R 2014
Visitors and Customers
Maintain the Customer Satisfaction Survey score above 8,0/10 for the managed Retail portfolio R 2014
Extend the service quality program within the Group and achieve at least 30 managed shopping centres successfully audited according to the “4 Star” label by 2014 R 2014
Maintain in each region the scores for “health & safety risks” assessment, measured through the annual third-party audits G 2013
Creating opportunities to communities to prosper
Community well-being
Cooperate with local authorities to launch specifi c environmental or social initiatives in each managed shopping centre by 2016 R 2016
Develop a Group’s “Community Charter” and test implementation in the managed Retail portfolio R 2013
Local economic development
Develop methodology to measure economical & social impact of the Group’s assets R 2013
Maintain the Group’s commitments in supporting its main philanthropic causes towards entrepreneurship, social and young talents G 2013
A motivated workforce empowered to deliver change
Employees Design and implement a pilot for a metrics-based compensation framework to PMPS teams (i.e. on-site technical managers) G 2013
Reinforce the psycho-social risk prevention policy in France G 2013
Continue to conduct targeted employee surveys in 2013 on topics of interest to the Group G 2013
Deploy new actions to develop women’s leadership across the Group G 2013
Reinforce induction program for new hires in all regions with a focus on diversity, non-discrimination and the Code of Ethics via e-learning courses and regional training programmes G 2013
(1) Scope: R = Retail; O = Offi ces; C = Convention & Exhibition; G = the whole Group.

REPORT OF THE CHAIRMAN OF THE SUPERVISORY BOARD
LEGAL INFORMATION
FINANCIAL REPORT 2012 - UNIBAIL-RODAMCO 96 • 97
8. CONTENT INDEXES
8.1. EPRA Sustainability Performance Measures
In 2012, Unibail-Rodamco received the EPRA Gold Award, with the best score, for its exceptional compliance of its sustainability
reporting 2011 with the Best Practice Recommendations (BPR). The indicators reported in the 2012 Annual and Sustainable
Development Report again comply with the EPRA Sustainability BPR. The table below shows the cross concordance between the
EPRA guidelines and Unibail-Rodamco report.
■ Reported ■ Partially Reported ■ Not reported
N° Indicator Type Description Reported Cross reference Pages
Performance measures
3.1 Total energy consumption from electricity (annual kWh)
Core Amount of electricity used from indirect non-renewable and renewables sources
KPI: Energy consumption (kWh) 71
CO2 emissions – Table giving the split of Total
electricity purchased between green electricity purchased and non-green electricity purchased
69
Additional Amount of primary energy required to produce electricity
KPI: Direct and indirect fi nal energy consumption by primary energy source (%)
74
3.2 Total energy consumption from district heating and cooling (annual kWh)
Core District heating and cooling consumption at the point of use
KPI: Energy consumption (kWh) 71
Additional Primary energy required to produce heating and cooling
KPI: Direct and indirect fi nal energy consumption by primary energy source (%)
74
3.3 Total energy consumption from fuels (annual kWh)
Core Fuels purchased and consumed at point of use
N/A
Additional Fuels produced and/or sold on sites
N/A
3.4 Building energy intensity (kWh/m2/year or kWh/person/year)
Core Total energy normalised using an appropriate denominator
KPI: Energy effi ciency per square metre (kWh/m2/year) 72
KPI: Energy effi ciency per building usage (kWh/visit (shopping centre) – occupant (Offi ces) – m2 DOP (exhibition centres)/year)
72
3.5 Total direct greenhouse gas emissions (annual metric tonnes CO
2e)
Core Direct emissions of greenhouse gases arising from fuels burned on site, as well as on-site generation of electricity, heat, or steam
KPI: CO2 emissions (kg CO
2e) 69
Additional Fugitive emissions (i.e. refrigerant gases) and emissions from transportation of materials, products, and waste
In 2012, an exhaustive CO2 Carbon Footprint including
refrigerant gases has been conducted in 3 shopping centres. This source of emissions will be included into the internal reporting in 2013
65-67
3.6 Total indirect greenhouse gas emissions (annual metric tonnes CO
2e)
Core Indirect emissions of greenhouse gases resulting from the offsite generation of purchased electricity, heat, or steam
KPI: CO2 emissions (kg CO
2e) 69
3.7 Greenhouse gas intensity from building energy (kg CO
2e/
m2/year or kgCO2e/
person/year)
Core Total greenhouse gases emissions normalised using an appropriate denominator
KPI: Carbon intensity per square metre (kgCO2e/m2/
year)70
KPI: Carbon intensity of use (gCO2/visit(shopping
centre) – occupant (offi ce) – m2 DOP(exhibition centres)/year)
69
3.8 Total water withdrawal by source (annual m3)
Core Total volume of water withdrawn from any water source (including intermediary use and abstraction of cooling water)
KPI: Water consumption (m3) 77
Additional Water sources (surface, ground, grey, black, etc.)
KPI: Total water withdrawal by source (%) 78
3.9 Building water intensity (litres/person/day or m3/m2/year)
Core Total water consumption normalised using an appropriate denominator
KPI: Water consumption per square metre (litre/m2/year)
79
KPI: Water intensity of use (litre/visit (shopping centre)/year – m3/occupant(offi ces)/year)
78
3.10 Total weight of waste by disposal route (annual metric tonnes)
Core Amount of waste (hazardous & non-hazardous) by type (recycling, composting, etc.) created by the company’s operations
KPI: Total waste (tonnes) 80
KPI: Split of recycled waste by type of waste (tonnes) 80

CONSOLIDATED FINANCIAL STATEMENTS
CORPORATE SUSTAINABILITY
BUSINESS REVIEW AND 2012 RESULTS
PORTFOLIO
UNIBAIL-RODAMCO - FINANCIAL REPORT 2012 98 • 99
■ Reported ■ Partially Reported ■ Not reported
N° Indicator Type Description Reported Cross reference Pages
3.11 Proportion of waste by disposal route (% of total waste)
Core Amount of waste (hazardous & non-hazardous) by proportion (recycling, composting, etc.) created by the company’s operations
KPI: Percentage of waste recycled (%) 80
KPI: Split of non-hazardous and hazardous waste by disposal route (tonnes)
80
Overarching recommendations
4.1 Organisational boundaries
Core Organisational structure by type of asset (subsidiaries, associates, etc.) and fi nancial/operational leases
Portfolio 2-14
4.2 Boundaries – Reporting on landlord and tenant consumption
Core Absolute consumption (only landlord-obtained energy/water)
KPI: Energy consumption (kWh) 71
KPI: Water consumption (m3) 77
4.3 Analysis – Normalisation
Core Intensity Sustainability Performance Measures (denominators: managed Floor Area or Occupancy)
Origin of denominators: Assets included in 2012 reporting scope for environmental KPIs (columns reporting areas and intensity of use)
63
See every intensity KPI: denominators used are logical/in accordance with EPRA’s advice
62
4.4 Analysis – Like-for-Like approach for absolute Sustainability Performance
Core Defi nition of the like-for-like perimeter
Reporting methodology – Reporting scope 62
For every KPI: the “scope” column refers to the Like-for-like coverage
4.5 Analysis – Segmental analysis (by property type; geography)
Core Concordance with property typology adopted in fi nancial reporting
Geographic zones, property types, same as in fi nancial segmentation
4.6 Analysis – Narrative on performance
Core Commentaries/Explanations on environmental performance
Corporate Sustainability – Section 1/2/3 50-113
Product labelling: environmental certifi cation 59-61
4.7 Location of EPRA Sustainability Performance Measures in company’s Annual Report
Core EPRA and environmental measures included in the annual report
EPRA concordance table 97-98
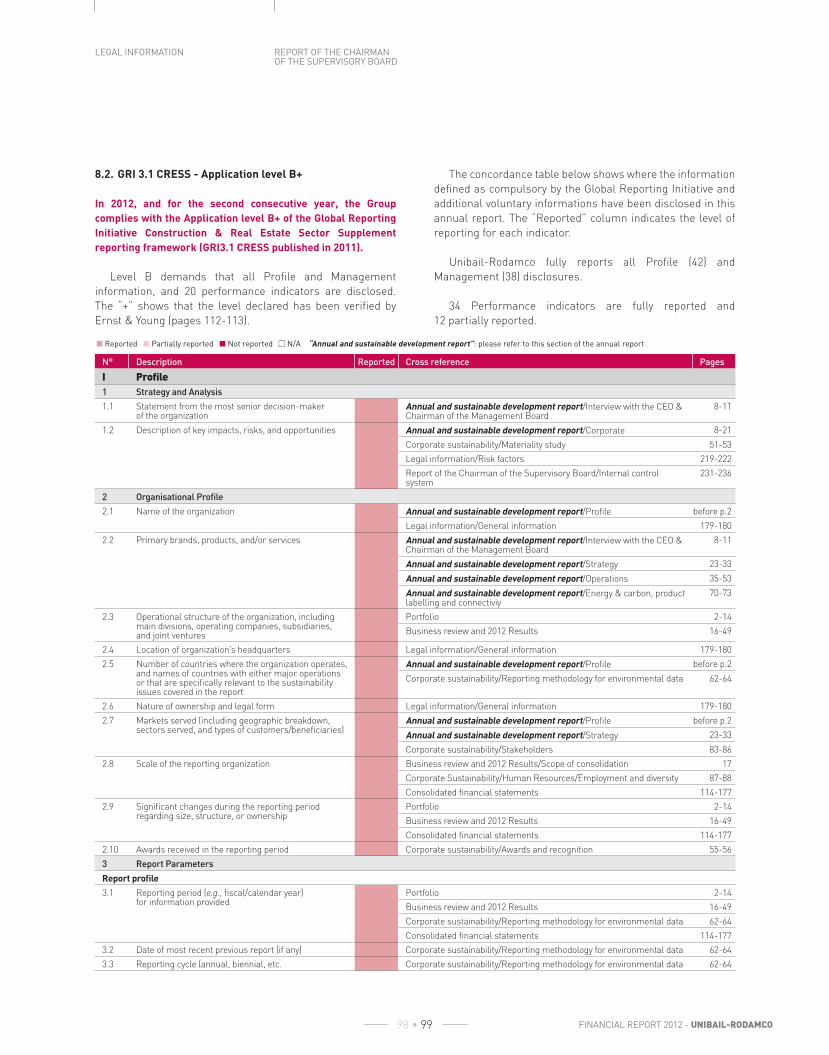
REPORT OF THE CHAIRMAN OF THE SUPERVISORY BOARD
LEGAL INFORMATION
FINANCIAL REPORT 2012 - UNIBAIL-RODAMCO 98 • 99
■ Reported ■ Partially reported ■ Not reported ■■ N/A “Annual and sustainable development report”: please refer to this section of the annual report
N° Description Reported Cross reference Pages
I Profi le1 Strategy and Analysis
1.1 Statement from the most senior decision-maker of the organization
Annual and sustainable development report/Interview with the CEO & Chairman of the Management Board
8-11
1.2 Description of key impacts, risks, and opportunities Annual and sustainable development report/Corporate 8-21
Corporate sustainability/Materiality study 51-53
Legal information/Risk factors 219-222
Report of the Chairman of the Supervisory Board/Internal control system
231-236
2 Organisational Profi le
2.1 Name of the organization Annual and sustainable development report/Profi le before p.2
Legal information/General information 179-180
2.2 Primary brands, products, and/or services Annual and sustainable development report/Interview with the CEO & Chairman of the Management Board
8-11
Annual and sustainable development report/Strategy 23-33
Annual and sustainable development report/Operations 35-53
Annual and sustainable development report/Energy & carbon, product labelling and connectiviy
70-73
2.3 Operational structure of the organization, including main divisions, operating companies, subsidiaries, and joint ventures
Portfolio 2-14
Business review and 2012 Results 16-49
2.4 Location of organization’s headquarters Legal information/General information 179-180
2.5 Number of countries where the organization operates, and names of countries with either major operations or that are specifi cally relevant to the sustainability issues covered in the report
Annual and sustainable development report/Profi le before p.2
Corporate sustainability/Reporting methodology for environmental data 62-64
2.6 Nature of ownership and legal form Legal information/General information 179-180
2.7 Markets served (including geographic breakdown, sectors served, and types of customers/benefi ciaries)
Annual and sustainable development report/Profi le before p.2
Annual and sustainable development report/Strategy 23-33
Corporate sustainability/Stakeholders 83-86
2.8 Scale of the reporting organization Business review and 2012 Results/Scope of consolidation 17
Corporate Sustainability/Human Resources/Employment and diversity 87-88
Consolidated fi nancial statements 114-177
2.9 Signifi cant changes during the reporting period regarding size, structure, or ownership
Portfolio 2-14
Business review and 2012 Results 16-49
Consolidated fi nancial statements 114-177
2.10 Awards received in the reporting period Corporate sustainability/Awards and recognition 55-56
3 Report Parameters
Report profi le
3.1 Reporting period (e.g., fi scal/calendar year) for information provided
Portfolio 2-14
Business review and 2012 Results 16-49
Corporate sustainability/Reporting methodology for environmental data 62-64
Consolidated fi nancial statements 114-177
3.2 Date of most recent previous report (if any) Corporate sustainability/Reporting methodology for environmental data 62-64
3.3 Reporting cycle (annual, biennial, etc. Corporate sustainability/Reporting methodology for environmental data 62-64
8.2. GRI 3.1 CRESS - Application level B+
In 2012, and for the second consecutive year, the Group
complies with the Application level B+ of the Global Reporting
Initiative Construction & Real Estate Sector Supplement
reporting framework (GRI3.1 CRESS published in 2011).
Level B demands that all Profi le and Management
information, and 20 performance indicators are disclosed.
The “+” shows that the level declared has been verified by
Ernst & Young (pages 112-113).
The concordance table below shows where the information
defi ned as compulsory by the Global Reporting Initiative and
additional voluntary informations have been disclosed in this
annual report. The “Reported” column indicates the level of
reporting for each indicator.
Unibail-Rodamco fully reports all Profi le (42) and
Management (38) disclosures.
34 Performance indicators are fully reported and
12 partially reported.

CONSOLIDATED FINANCIAL STATEMENTS
CORPORATE SUSTAINABILITY
BUSINESS REVIEW AND 2012 RESULTS
PORTFOLIO
UNIBAIL-RODAMCO - FINANCIAL REPORT 2012 100 • 101
■ Reported ■ Partially reported ■ Not reported ■■ N/A “Annual and sustainable development report”: please refer to this section of the annual report
N° Description Reported Cross reference Pages
3.4 Contact point for questions regarding the report or its contents
Persons responsible for this document, for the fi nancial information and for auditing the accounts
240-241
Report scope and boundary
3.5 Process for defi ning report content Corporate sustainability/Strategy and organisation 51-56
Corporate sustainability/Reporting methodology for environmental data 62-64
Corporate sustainability/Stakeholders 83-86
3.6 Boundary of the report (e.g., countries, divisions, subsidiaries, leased facilities, joint ventures, suppliers). See GRI Boundary Protocol for further guidance
Annual and sustainable development report/Profi le before p.2
Portfolio 2-14
Business review and 2012 Results 16-49
Corporate sustainability/Reporting methodology for environmental data 62-64
3.7 State any specifi c limitations on the scope or boundary of the report (see completeness principle for explanation of scope)
Portfolio 2-14
Business review and 2012 Results 16-49
Corporate sustainability/Reporting methodology for environmental data 62-64
Consolidated fi nancial statements 114-177
3.8 Basis for reporting on joint ventures, subsidiaries, leased facilities, outsourced operations, and other entities that can signifi cantly affect comparability from period to period and/or between organizations
Portfolio 2-14
Business review and 2012 Results 16-49
Corporate sustainability/Reporting methodology for environmental data 62-64
Consolidated fi nancial statements 114-177
3.9 Data measurement techniques and the bases of calculations, including assumptions and techniques underlying estimations applied to the compilation of the Indicators and other information in the report. Explain any decisions not to apply, or to substantially diverge from, the GRI Indicator Protocols
Portfolio 2-14
Business review and 2012 Results 16-49
Corporate sustainability/Reporting methodology for environmental data 62-64
Consolidated fi nancial statements 114-177
3.10 Explanation of the effect of any re-statements of information provided in earlier reports, and the reasons for such re-statement (e.g., mergers/acquisitions, change of base years/periods, nature of business, measurement methods)
Business review and 2012 Results 16-49
Corporate sustainability/Reporting methodology for environmental data 62-64
Consolidated fi nancial statements 114-177
3.11 Signifi cant changes from previous reporting periods in the scope, boundary, or measurement methods applied in the report
Business review and 2012 Results 16-49
Corporate sustainability/Reporting methodology for environmental data 62-64
Consolidated fi nancial statements 114-177
GRI Content Index
3.12 Table identifying the location of the Standard Disclosures in the report
Corporate sustainability/GRI & EPRA Content indexes 97-106
Assurance
3.13 Policy and current practice with regard to seeking external assurance for the report
Corporate sustainability/Third- party independent verifi cation 64
Consolidated fi nancial statements 114-177
Report of the Chairman of the Supervisory Board 225-237
4 Governance, Commitments and Engagement
Governance
4.1 Governance structure of the organization, including committees under the highest governance body responsible for specifi c tasks, such as setting strategy or organizational oversight
Annual and sustainable development report/Interview with the Chairman of the Supervisory Board
12
Annual and sustainable development report/Corporate Governance and Risk Management
15
Corporate sustainability/Strategy and organisation 51-56
Corporate sustainability/Corporate Governance, ethical conduct and risk management
56-57
Legal information/Management Board and Supervisory Board 193-216
Report of the Chairman of the Supervisory Board 225-237
4.2 Indicate whether the Chair of the highest governance body is also an executive offi cer
Legal information/Management Board and Supervisory Board 193-216
Corporate sustainability/Organisational structure 225-237
4.3 For organizations that have a unitary Board structure, state the number and gender of members of the highest governance body that are independent and/or non-executive members
Unibail-Rodamco has two Board
Legal information/Management Board and Supervisory Board 193-216
Report of the Chairman of the Supervisory Board 225-237
4.4 Mechanisms for shareholders and employees to provide recommendations or direction to the highest governance body
Legal information/General information 179-180
Legal information/Corporate Governance 199-201

REPORT OF THE CHAIRMAN OF THE SUPERVISORY BOARD
LEGAL INFORMATION
FINANCIAL REPORT 2012 - UNIBAIL-RODAMCO 100 • 101
■ Reported ■ Partially reported ■ Not reported ■■ N/A “Annual and sustainable development report”: please refer to this section of the annual report
N° Description Reported Cross reference Pages
4.5 Linkage between compensation for members of the highest governance body, senior managers, and executives (including departure arrangements), and the organization’s performance (including social and environmental performance)
Corporate sustainability/Remuneration 90-91
Legal information/Remuneration of Management Board and Supervisory Board members
201-215
Report of the Chairman of the Supervisory Board/Remuneration of the Management Board
231
4.6 Processes in place for the highest governance body to ensure confl icts of interest are avoided
Legal information/Corporate Governance 199-201
4.7 Process for determining the composition, qualifi cations, and expertise of the members of the highest governance body and its committees, including any consideration of gender and other indicators of diversity
Corporate sustainability/Employment and diversity 87-88
Legal information/Management Board and Supervisory Board 193-216
Report of the Chairman of the Supervisory Board 225-237
4.8 Internally developed statements of mission or values, codes of conduct, and principles relevant to economic, environmental, and social performance and the status of their implementation
Corporate sustainability/2012 Achievements & 2013-2020 Objectives 93-96
Legal information/Corporate Governance 199-201
Report of the Chairman of the Supervisory Board 225-237
4.9 Procedures of the highest governance body for overseeing the organization’s identifi cation and management of economic, environmental, and social performance, including relevant risks and opportunities, and adherence or compliance with internationally agreed standards, codes of conduct, and principles
Annual and sustainable development report/Corporate Governance and risk management
15
Legal information/Corporate Governance 199-201
Report of the Chairman of the Supervisory Board 225-237
4.10 Processes for evaluating the highest governance body’s own performance, particularly with respect to economic, environmental, and social performance
Annual and sustainable development report/Corporate Governance and risk management
15
Legal information/Corporate Governance 199-201
Report of the Chairman of the Supervisory Board 225-237
Commitments to external initiatives
4.11 Explanation of whether and how the precautionary approach or principle is addressed by the organization
Corporate sustainability/Environmental management systems 57-59
Corporate sustainability/Climate change 64-76
4.12 Externally developed economic, environmental, and social charters, principles, or other initiatives to which the organization subscribes or endorses
A comprehensive strategy (signatory of the UN Global Compact) 53
Corporate sustainability/Participation in external organisations 55-56
Legal information/Corporate Governance 199-201
Corporate sustainability/GRI & EPRA Content indexes 97-106
4.13 Memberships in associations (such as industry associations) and/or national/international advocacy organizations in which the organization:• Has positions in governance bodies;• Participates in projects or committees;• Provides substantive funding beyond routine
membership dues; or• Views membership as strategic
Corporate sustainability/Participation in external organisations 55-56
Stakeholder engagement
4.14 List of stakeholder groups engaged by the organization Corporate sustainability/Stakeholders 83-86
4.15 Basis for identifi cation and selection of stakeholders with whom to engage
Annual and sustainable development report/Interview with the CEO & Chairman of the Management Board
8-11
Annual and sustainable development report/Tenants & visitors 74-75
Annual and sustainable development report/Employees 64-65
Corporate sustainability/Stakeholders 83-86
4.16 Approaches to stakeholder engagement, including frequency of engagement by type and by stakeholder group
Corporate sustainability/participation in external organisations 55-56
Corporate sustainability/Stakeholders 83-86
Corporate sustainability/2012 Achievements & 2013-2020 Objectives 93-96
4.17 Key topics and concerns that have been raised through stakeholder engagement, and how the organization has responded to those key topics and concerns, including through its reporting
Annual and sustainable development report/Tenants & visitors 74-75
Annual and sustainable development report/Employees 64-65
Corporate sustainability/Stakeholders 83-86
Corporate sustainability/2012 Achievements & 2013-2020 Objectives 93-96
II Management approachEconomic
EC Economic performance Annual and sustainable development report/Corporate 8-21
Business review and 2012 Results 16-49
Consolidated fi nancial statements 114-177
EC Market presence Annual and sustainable development report/Profi le before p.2
Annual and sustainable development report/Strategy 23-33

CONSOLIDATED FINANCIAL STATEMENTS
CORPORATE SUSTAINABILITY
BUSINESS REVIEW AND 2012 RESULTS
PORTFOLIO
UNIBAIL-RODAMCO - FINANCIAL REPORT 2012 102 • 103
■ Reported ■ Partially reported ■ Not reported ■■ N/A “Annual and sustainable development report”: please refer to this section of the annual report
N° Description Reported Cross reference Pages
EC Indirect economic impacts Annual and sustainable development report/Employees 64-65
Communities & local authorities 83
Environmental
EN Materials Materials 76
EN Energy Annual and sustainable development report/Energy & carbon, product labelling and connectivity
70-73
Energy consumption 70-72
EN Water Water 76-79
EN Biodiversity Biodiversity 81
EN Emissions, effl uents and waste Annual and sustainable development report/Energy & carbon, product labelling and connectivity
70-73
Climate change 64-76
CO2 emissions 68-70
Waste 79-80
EN Land degradation, contamination and remediation Health & safety and environmental risks and pollutions 81-82
EN Products and services Annual and sustainable development report/Energy & carbon, product labelling and connectivity
70-73
Product labelling: environmental certifi cation 59-61
EN Compliance Third-party independent verifi cation 64
Independant verifi er’s attestation and assurance report on social environmental and societal information and related to the GRI Application level
112-113
EN Transport Annual and sustainable development report/Energy & carbon, product labelling and connectivity
70-73
Transport 75-76
EN Overall Strategy and organisation 51-56
Environmental management systems 57-59
Corporate sustainability 50-113
2012 Achievements & 2013-2020 Objectives 93-96
Labour Practices and Decent Work
LA Employment Annual and sustainable development report/Employees 64-65
Employment and diversity 87-88
LA Labour/management relations Annual and sustainable development report/Employees 64-65
Employee relations 91
LA Occupational health and safety Health & safety and environmental risks and pollutions 81-82
Employee Well- being 89-90
LA Training and education Training - Unibail-Rodamco Academy 88-89
Long-term targets 96
LA Diversity and equal opportunity Annual and sustainable development report/Employees 64-65
Employment and diversity 87-88
LA Equal remuneration for women and men Annual and sustainable development report/Employees 64-65
Remuneration 90-91
Human Rights
As a signatory of the UN Global Compact, Unibail-Rodamco has undertaken to promote the application of fundamental values with respect to human rights, labour, the environment and corruption
HR Investment and procurement practices Ethical conduct 56-57
Group Compliance Book and Code of Ethics 56-57
HR Non-discrimination Ethical conduct 56-57
Employment and diversity 87-88
Employee relations 91
Group Compliance Book and Code of Ethics 56-57
HR Freedom of association and collective bargaining Employee relations 91
HR Child labour Ethical conduct 56-57
Suppliers and contractors: supply chain 85-86
Employment and diversity 87-88
Employee relations 91
Group Compliance Book and Code of Ethics 56-57

REPORT OF THE CHAIRMAN OF THE SUPERVISORY BOARD
LEGAL INFORMATION
FINANCIAL REPORT 2012 - UNIBAIL-RODAMCO 102 • 103
■ Reported ■ Partially reported ■ Not reported ■■ N/A “Annual and sustainable development report”: please refer to this section of the annual report
N° Description Reported Cross reference Pages
HR Prevention of forced and compulsory labour Ethical conduct 56-57
Suppliers and contractors: supply chain 85-86
Employment and diversity 87-88
Employee relations 91
Group Compliance Book and Code of Ethics 56-57
HR Security practices Ethical conduct 56-57
Suppliers and contractors: supply chain 85-86
Employment and diversity 87-88
Employee relations 91
Group Compliance Book and Code of Ethics 56-57
HR Indigenous rights Suppliers and contractors: supply chain 85-86
Employee relations 91
HR Assessment Suppliers and contractors: supply chain 85-86
Employee relations 91
HR Remediation Ethical conduct 56-57
Health & safety and environmental risks and pollutions 81-82
Corporate philanthropy 86-87
Human Resources 87-92
Group Compliance Book and Code of Ethics 56-57
Society
SO Local communities Communities and local authorities 83
SO Corruption Ethical conduct 56-57
Group Compliance Book and Code of Ethics 56-57
SO Public policy Ethical conduct 56-57
Group Compliance Book and Code of Ethics 56-57
SO Anti-competitive behaviour Ethical conduct 56-57
Group Compliance Book and Code of Ethics 56-57
SO Compliance Annual and sustainable development report/Corporate Governanceand Management
15
Ethical conduct 56-57
Audit Committee 199
Report of the Chairman of the Supervisory Board 225-237
Product Responsibility
PR Customer health and safety Health & safety and environmental risks and pollutions 81-82
Customers 83-84
PR Product and service labelling Annual and sustainable development report/Energy & carbon, product labelling and connectivity
70-73
Product labelling: environmental certifi cation 59-61
PR Marketing communications Stakeholders 83-86
Long-term targets 96
PR Customer privacy Stakeholders 83-86
Long-term targets 96
PR Compliance Annual and sustainable development report/Energy & carbon, product labelling and connectivity
70-73
Product labelling: environmental certifi cation 59-61
III Performance indicatorsEconomic
Economic performance
EC1 Direct economic value generated and distributed, including revenues, operating costs, employee compensation, donations and other community investments, retained earnings, and payments to capital providers and governments
Narrative on Corporate philanthropy 86-87
KPI: Recruitment 89
KPI: Remuneration 90
Consolidated fi nancial KPIs 114-176
Consolidated Financial Statements/Employee remuneration and benefi ts
170-174

CONSOLIDATED FINANCIAL STATEMENTS
CORPORATE SUSTAINABILITY
BUSINESS REVIEW AND 2012 RESULTS
PORTFOLIO
UNIBAIL-RODAMCO - FINANCIAL REPORT 2012 104 • 105
■ Reported ■ Partially reported ■ Not reported ■■ N/A “Annual and sustainable development report”: please refer to this section of the annual report
N° Description Reported Cross reference Pages
EC2Financial implications and other risks and opportunities for the organization’s activities due to climate change
Narrative on Climate change 64-76
Legal information/Risk factors 219-222
EC3 Coverage of the organization’s defi ned benefi t plan obligations
Remuneration 90-91
Employee remuneration and benefi ts 170-174
Consolidated Financial Statements 114-177
Market presence
EC7 Procedures for local hiring and proportion of senior management hired from the local community at signifi cant locations of operation
Annual and sustainable development report/Local economic development and community well-being
66-69
Narrative on communities and local authorities 83
Narrative on Suppliers and contractors 85-86
Indirect economic impacts
EC9 Understanding and describing signifi cant indirect economic impacts, including the extent of impacts
Annual and sustainable development report/Local economic development and community well-being
66-69
Environmental
Energy
EN3 Direct energy consumption by primary energy source KPI: Energy consumption (kWh) 71
KPI: Direct and indirect fi nal energy consumption by primary energy source (%)
74
KPI: Renewable energy produced and CO2 emissions saved 74
EN4 Indirect energy consumption by primary source KPI: Energy consumption (kWh) 71
KPI: Direct and indirect fi nal energy consumption by primary energy source (%)
74
KPI: Renewable energy produced and CO2 emissions saved 74
CRE1 Building energy intensity KPI: Energy effi ciency per building usage (kWh/visit/year for shopping centres, kWh/occupant/year for offi ces, kWh/m2DOP/year for convention & exhibitions)
72
KPI: Energy effi ciency per square metre (kWh/m²/year) 72
EN5 Energy saved due to conservation and effi ciency improvements
KPI: Energy consumption (kWh) 71
KPI: Financial savings resulting from reduced energy consumption (€) 72
EN6 Initiatives to provide energy-effi cient or renewable energy based products and services, and reductions in energy requirements as a result of these initiatives
Narrative on Energy consumption 70-72
KPI: Energy consumption (kWh) 71
KPI: Renewable energy produced and CO2 emissions saved 74
EN7 Initiatives to reduce indirect energy consumption and reductions achieved
Narrative on Energy consumption 70-72
KPI: Energy consumption (kWh) 71
Water
EN8 Total water withdrawal by source KPI: Water consumption (m3) 77
KPI: Total water withdrawal by source (%) 78
CRE2 Building water intensity KPI: Water intensity of use (litre/visit/year for shopping centres, m3/occupant/year for offi ces)
78
KPI: Water consumption per m2 (litre/m2/year) 79
EN10 Percentage and total volume of water recycled and reused
KPI: Total water withdrawal by source (%) 78
Narrative on Water 76-79
Biodiversity
EN13 Habitats protected or restored No habitats were protected or restored in 2012
EN14 Strategies, current actions, and future plans for managing impacts on biodiversity
Narrative on Biodiversity 81
Emissions, effl uents and waste
EN16 Total direct and indirect greenhouse gas emissions by weight
KPI: CO2 emissions (kg CO
2e) 69
KPI: Carbon weight of energy mix (g CO2e/kWh) 73
EN17 Other relevant indirect greenhouse gas emissions by weight
KPI: Split of shopping centres’ visits by mode of transport (%) 75
CRE3 Greenhouse gas emissions intensity from buildings KPI: Carbon intensity of use (g CO2e/visit/year for shopping centres, kg
CO2e/occupant/year for offi ces, g CO
2e/m2DOP/year for convention &
exhibitions)
69
KPI: Carbon intensity per square metre (kg CO2e/m²/year) 70
CRE4 Greenhouse gas emissions intensity from new construction and redevelopment activity
In 2012, the Group performed a carbon intensity simulation for new projects on a sample of assets. These initiatives are not extended to the entire Group yet

REPORT OF THE CHAIRMAN OF THE SUPERVISORY BOARD
LEGAL INFORMATION
FINANCIAL REPORT 2012 - UNIBAIL-RODAMCO 104 • 105
■ Reported ■ Partially reported ■ Not reported ■■ N/A “Annual and sustainable development report”: please refer to this section of the annual report
N° Description Reported Cross reference Pages
EN18 Initiatives to reduce greenhouse gas emissions and reductions achieved
Narrative on CO2 emissions 68-69
KPI: CO2 emissions (kg CO
2e) 69
EN22 Total weight of waste by type and disposal method KPI: Total waste (tonnes) 80
KPI: Percentage of waste recycled (%) 80
KPI: Split of total non-hazardous and hazardous waste by disposal route (tonnes)
80
KPI: Split of recycled waste by type of waste (tonnes) 80
CRE5 Land and other assets remediated and in need of remediation for the existing or intended land use according to applicable legal designations
Narrative on Health & safety and environmental risks and pollutions 81-82
KPI: Soil pollution and site remediation 82
Products and services
EN26 Initiatives to mitigate environmental impacts of products and services, and extent of impact mitigation
Annual and sustainable development report/Energy & carbon, product labelling and connectivity
70-73
Narrative on Environmental Management Systems 57-59
Narrative on Climate change 64-76
Narrative on Energy consumption 70-74
Narrative on Biodiversity 81
Compliance
EN28 Monetary value of signifi cant fi nes and total number of non-monetary sanctions for non-compliance with environmental laws and regulations
KPI: Fines for environmental breaches 82
EN29 Signifi cant environmental impacts of transporting products and other goods and materials used for the organization’s operations, and transporting members of the workforce
KPI: Access to public transport (%) 75
KPI: CO2 emissions from employees’ business travel by train and plane
(tonnes CO2e)
76
Labour Practices and Decent Work
Employment
LA1 Total workforce by employment type, employment contract, and region, broken down by gender
KPI: Employment by country 88
KPI: Employment by activity 88
KPI: Employment by age 88
KPI: Employment by gender 88
KPI: Recruitment 89
LA2 Total number and rate of new employee hires and employee turnover by age group, gender, and region
KPI: Recruitment 89
KPI: Departures 89
Employee turnover 89
LA3 Benefi ts provided to full-time employees that are not provided to temporary or part-time employees, by major operations
Narrative on Remuneration 90-91
Employee remuneration and benefi ts 170-174
Labour/Management relations
LA4 Percentage of employees covered by collective bargaining agreements
Narrative on Employee relations 91
Occupational health and safety
LA7 Rates of injury, occupational diseases, lost days, and absenteeism, and number of work-related fatalities by region and by gender
KPI: Absenteeism 90
CRE6 Percentage of the organisation operating in verifi ed compliance with an internationally recognised health and safety management system
Narrative on Health & safety and environmental risks and pollutions 81-82
Training and education
LA10 Average hours of training per year per employee by gender, and by employee category
Narrative on training 88-89
KPI: Training 89
LA11 Programs for skills management and lifelong learning that support the continued employability of employees and assist them in managing career endings
Narrative on Career Management 88
LA12 Percentage of employees receiving regular performance and career development reviews, by gender
Narrative on Career Management 88

CONSOLIDATED FINANCIAL STATEMENTS
CORPORATE SUSTAINABILITY
BUSINESS REVIEW AND 2012 RESULTS
PORTFOLIO
UNIBAIL-RODAMCO - FINANCIAL REPORT 2012 106 • 107
■ Reported ■ Partially reported ■ Not reported ■■ N/A “Annual and sustainable development report”: please refer to this section of the annual report
N° Description Reported Cross reference Pages
Diversity and equal opportunity
LA13 Composition of governance bodies and breakdown of employees per employee category according to gender, age group, minority group membership, and other indicators of diversity
KPI: Employment by country 88
KPI: Employment by activity 88
KPI: Employment by age 88
KPI: Employment by gender 88
% of women in management position 88
Legal information/Composition of the Management Board and the Supervisory Board
193-198
LA14 Ratio of basic salary and remuneration of women to men by employee category, by signifi cant locations of operation
KPI: Remuneration 90
Human Rights
As a signatory of the UN Global Compact, Unibail-Rodamco has undertaken to promote the application of fundamental values with respect to human rights, labour, the environment and corruption
Investment and procurement practices
HR1 Percentage and total number of signifi cant investment agreements and contracts that include clauses incorporating human rights concerns, or that have undergone human rights screening
Ethical conduct 56-57
Narrative on Suppliers and contractors: supply chain 85-86
KPI: Suppliers assessment 86
Society
SO9 Operations with signifi cant potential or actual negative impacts on local communities
Narrative on Communities and local authorities 83
Annual and sustainable development report/Local economic development and community well-being
66-69
SO10 Prevention and mitigation measures implemented in operations with signifi cant potential or actual negative impacts on local communities
Narrative on Communities and local authorities 83
CRE7 Number of persons voluntarily and involuntarily displaced and/or resettled by development, broken down by project
N/AThe Group activity does not imply people voluntarily or involuntarily displaced considering the fact that Unibail-Rodamco only develops projects on greenfi eld and brownfi elds
Corruption
SO2 Percentage and total number of business units analysed for risks related to corruption.
Group Compliance Book and Code of Ethics 56-57
Internal control system 231-236
SO3 Percentage of employees trained in organization’s anti-corruption policies and procedures
Narrative on Ethical conduct 56-57
Group Compliance Book and Code of Ethics 56-57
Public policy
SO5 Public policy positions and participation in public policy development and lobbying
Participation in external organisations 55
Product Responsibility
Customer health and safety
PR1 Life cycle stages in which health and safety impacts of products and services are assessed for improvement, and percentage of signifi cant products and services categories subject to such procedures
Risk and crisis management 57
Health & safety and environmental risks and pollutions 81-82
KPI: Annual risk assessment 82
Product and service labelling
PR3 Type of product and service information required by procedures, and percentage of signifi cant products and services subject to such information requirements
Narrative on Materials 76
CRE8 Type and number of sustainability certifi cation, rating and labelling schemes for new construction, management, occupation and redevelopment
Annual and sustainable development report/Energy & carbon, product labelling and connectivity
70-73
Product labelling: environmental certifi cation 59-61
PR5 Practices related to customer satisfaction, including results of surveys measuring customer satisfaction
Narrative on Customers and Tenants 84-86
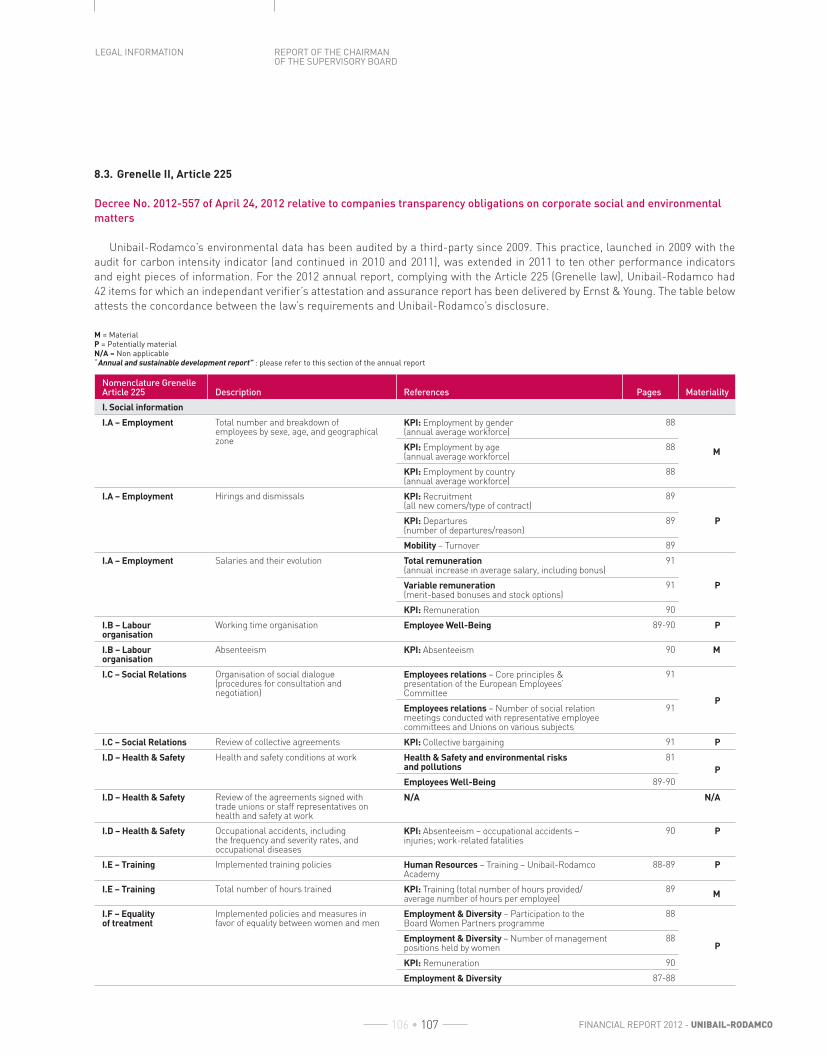
REPORT OF THE CHAIRMAN OF THE SUPERVISORY BOARD
LEGAL INFORMATION
FINANCIAL REPORT 2012 - UNIBAIL-RODAMCO 106 • 107
8.3. Grenelle II, Article 225
Decree No. 2012-557 of April 24, 2012 relative to companies transparency obligations on corporate social and environmental
matters
Unibail-Rodamco’s environmental data has been audited by a third-party since 2009. This practice, launched in 2009 with the
audit for carbon intensity indicator (and continued in 2010 and 2011), was extended in 2011 to ten other performance indicators
and eight pieces of information. For the 2012 annual report, complying with the Article 225 (Grenelle law), Unibail-Rodamco had
42 items for which an independant verifi er’s attestation and assurance report has been delivered by Ernst & Young. The table below
attests the concordance between the law’s requirements and Unibail-Rodamco’s disclosure.
M = MaterialP = Potentially materialN/A = Non applicable“Annual and sustainable development report” : please refer to this section of the annual report
Nomenclature Grenelle Article 225 Description References Pages Materiality
I. Social information
I.A – Employment Total number and breakdown of employees by sexe, age, and geographical zone
KPI: Employment by gender(annual average workforce)
88
MKPI: Employment by age(annual average workforce)
88
KPI: Employment by country(annual average workforce)
88
I.A – Employment Hirings and dismissals KPI: Recruitment(all new comers/type of contract)
89
PKPI: Departures(number of departures/reason)
89
Mobility – Turnover 89
I.A – Employment Salaries and their evolution Total remuneration(annual increase in average salary, including bonus)
91
PVariable remuneration(merit-based bonuses and stock options)
91
KPI: Remuneration 90
I.B – Labour organisation
Working time organisation Employee Well-Being 89-90 P
I.B – Labour organisation
Absenteeism KPI: Absenteeism 90 M
I.C – Social Relations Organisation of social dialogue (procedures for consultation and negotiation)
Employees relations – Core principles & presentation of the European Employees’ Committee
91
PEmployees relations – Number of social relation meetings conducted with representative employee committees and Unions on various subjects
91
I.C – Social Relations Review of collective agreements KPI: Collective bargaining 91 P
I.D – Health & Safety Health and safety conditions at work Health & Safety and environmental risks and pollutions
81
P
Employees Well-Being 89-90
I.D – Health & Safety Review of the agreements signed with trade unions or staff representatives on health and safety at work
N/A N/A
I.D – Health & Safety Occupational accidents, including the frequency and severity rates, and occupational diseases
KPI: Absenteeism – occupational accidents – injuries; work-related fatalities
90 P
I.E – Training Implemented training policies Human Resources – Training – Unibail-Rodamco Academy
88-89 P
I.E – Training Total number of hours trained KPI: Training (total number of hours provided/average number of hours per employee)
89M
I.F – Equality of treatment
Implemented policies and measures in favor of equality between women and men
Employment & Diversity – Participation to the Board Women Partners programme
88
PEmployment & Diversity – Number of management positions held by women
88
KPI: Remuneration 90
Employment & Diversity 87-88

CONSOLIDATED FINANCIAL STATEMENTS
CORPORATE SUSTAINABILITY
BUSINESS REVIEW AND 2012 RESULTS
PORTFOLIO
UNIBAIL-RODAMCO - FINANCIAL REPORT 2012 108 • 109
Nomenclature Grenelle Article 225 Description References Pages Materiality
I.F – Equality of treatment
Implemented policies and measures for employment and integration of disabled people
Employment & Diversity – Signature of the Diversity and Disability Workplace Charter
87 P
I.F – Equality of treatment
Implemented policies and measures to fi ght against discrimination
Employment & Diversity – Anonymous CVs 87
PEthical Conduct 56-57
Strategy & Organisation – Training 88-89
I.G – Respect/Promotion of ILO Principles
• for freedom of association respect and right to collective bargaining
N/A N/A
I.G – Respect/Promotion of ILO Principles
• to the elimination of discrimination in matters of employment and profession
Suppliers & Contractors – Promotion of ILO’s core principles
85
PEmployee Relations – Compliance with the labour standards outlined by the ILO
91
I.G – Respect/Promotion of ILO Principles
• to the elimination of forced or compulsory labour
N/A N/A
I.G – Respect/Promotion of ILO Principles
• to the effective abolition of child labour N/A N/A
II. Environmental information
II.A – Overall environmental policy
Company’s organisation to take into account environmental matters and environmental assessment approaches or certifi cation
Corporate Governance 56
M
KPI: Environmental certifi cation of new developments
60
KPI: Environmental certifi cation of standing assets 61
Environmental management systems – Number of regions having obtained a SMA certifi cation from the EMS (less than 3 years)
59
2012 Achievements & 2013-2020 objectives – BREEAM “Very Good”-for every new project >10 000m2
96
Strategy & Organisation – Materiality 51-53
II.A – Overall environmental policy
Training and informing activities conducted on employees for the protection of the environment
Strategy and organisation – Training – Regions trained to sustainability awareness
56
P
Human Resources – Training – Training indicator 88-89
II.A – Overall environmental policy
Resources devoted to the prevention of environmental risks and pollution
Climate Change – Due Diligence 65
PHealth & Safety and environmental risks and pollutions – Group policy
81
KPI: Annual Risk Assessment 82
II.A – Overall environmental policy
Prevention, reduction or compensation measures for air rejections, water and soil discharge that seriously harm the environment
Resource use – Waste – Considerate Construction Charter
79
PSuppliers & Contractors – Compulsory contract addendum on environmental and social matters
85-86
Climate Change – Removal of asbestos’ policy 65
II.A – Overall environmental policy
Amount of provisions and guarantees for environmental risks (if the information is not likely to cause serious harm to society in a pending litigation)
Health & Safety and environmental risks and pollutions – No amount of provisions for environmental risks
82
P
II.B – Pollution and waste management
Actions taken in support for the prevention, recycling and waste disposal
Resource use – Waste – Policy & Objectives 79
P
KPI: Total waste (tonnes) 80
KPI: Percentage of waste recycled (%) 80
KPI: Split of total non-hazardous and hazardous waste by disposal route (tonnes)
80
KPI: Split of recycled waste by type of waste (tonnes) 80
II.B – Pollution and waste management
Consideration of noise pollution and any other form of pollution specifi c to an activity
Resource use – Waste – Considerate Construction Charter
79
PHealth & Safety and environmental risks and pollutions – Respect of the applicable regulation
81-82

REPORT OF THE CHAIRMAN OF THE SUPERVISORY BOARD
LEGAL INFORMATION
FINANCIAL REPORT 2012 - UNIBAIL-RODAMCO 108 • 109
Nomenclature Grenelle Article 225 Description References Pages Materiality
II.C – Sustainable use of resources
Water consumption and supply according to local constraints
2012 Achievements & 2013-2020 objectives – Increase water effi ciency(litres/visit)
94
P
KPI: Water consumption(m3)
77
KPI: Total water withdrawal by source(%)
78
KPI: Water intensity of use(litre/visit (shopping centre ) – occupant (offi ce)/year)
78
KPI: Water consumption per square metre (litre/m2/year)
79
Resource use – Water – Water Stress study (WBSCD Global Water Tool)
76-77
II.C – Sustainable use of resources
Consumption of raw material and measures taken to improve the effi ciency of their use
Resource use – Materials – BREEAM certifi cation includes the materials selection
76
PResource use – Materials – Contractors have to abide by the same policy
76
II.C – Sustainable use of resources
Energy consumption Climate Change – Energy Consumption – Group Policy & measures taken to improve the energy effi ciency
70-71
M
Use of renewable energies 2012 Achievements & 2013-2020 objectives – Increase the energy effi ciency of commercial centres
94
Measures taken to improve energy effi ciency
KPI: Energy consumption(kWh)
71
KPI: Energy effi ciency per building usage(kWh/visit (shopping centres) – m² JOP (convention & exhibitions centres) – occupant (offi ces)/year)
72
KPI: Energy effi ciency per square meter(kWh/m²/year)
72
KPI: Direct & indirect fi nal energy consumption by primary energy source(%)
74
II.C – Sustainable use of resources
Land use Health & Safety and environmental risks and pollutions – Pollution prevention policy on existing sites and acquisitions (due diligence)
81-82
PKPI: Soil Pollution and Site Remediation 82
Climate Change – Due diligence 65
II.D – Climate change Green House Gases emissions Reporting methodology – CO2 emissions –
Group policy62-64
M
2012 Achievements & 2013-2020 objectives – Reduction of carbon intensity
94
KPI: CO2 emissions
(kg CO2e)
69
KPI: Carbon intensity of use(kgCO
2e/visit (shopping centres) – m²JOP
(convention & exhibition centres) – occupant (offi ces) /year)
69
KPI: Renewable energy produced and C02 emissions
saved74
KPI: Carbon intensity per square metre(kgCO
2 e/m²/year (shopping centres et offi ces))
70
KPI: Split of shopping centres’ visits by mode of transport(%)
75
II.D – Climate change Adaptation to climate change impacts Climate Change – Due diligence taking potential climate change impacts into account
65
PClimate Change – Analysis of likely impacts of climate change on existing assets
64
II.E – Biodiversity protection
Measures taken to preserve or develop biodiversity
Resource use – Biodiversity 81P

CONSOLIDATED FINANCIAL STATEMENTS
CORPORATE SUSTAINABILITY
BUSINESS REVIEW AND 2012 RESULTS
PORTFOLIO
UNIBAIL-RODAMCO - FINANCIAL REPORT 2012 110 • 111
Nomenclature Grenelle Article 225 Description References Pages Materiality
III. Societal information
III.A – Territorial, economic and social impact of the company
• in terms of employment and regional development
Community and local authorities 83
MAnnual and sustainable development report/Local economic development and community well-being
66-69
III.A – Territorial, economic and social impact of the company
• on local population Corporate philanthropy – Total donations amount 86
PCorporate philanthropy – Education through Architecture
86-87
Corporate philanthropy – Social 87
III.B – Relationships with persons or organizations interested in the company’s business
Dialogue conditions with those persons or organizations
2012 Achievements & 2013-2020 objectives – The tenants have to sign a green lease (new/renewal)
93
M2012 Achievements & 2013-2020 objectives – Sustainability Committees
93
KPI: Green leases (Stakeholders -Tenants) 85
III.B – Relationships with persons or organizations interested in the company’s business
Actions of partnership or sponsorship Corporate philanthropy – Total donations amount 86
PCorporate philanthropy – Education through Architecture
87
Corporate philanthropy – Social 87
III.C – Subcontractors and suppliers
Consideration of social and environmental issues in the procurement policy of the company
Suppliers & contractors – Inclusion of sustainable development criteria
85-86
M
Suppliers & contractors – Contract addendum on environmental matters
85-86
Suppliers & contractors – Environmental criteria in the assessment grid
85-86
2012 Achievements & 2013-2020 objectives – Supplier’s compliance with environmental clauses assessment
93
KPI: Suppliers assessment 86
III.C – Subcontractors and suppliers
Importance of subcontracting and addressing the social and environmental responsibility of suppliers
2012 Achievements & 2013-2020 objectives – Respect of environmental clauses by our suppliers and contractors
96M
III.D – Fair practices Actions taken against corruption Corporate Governance – Ethical conduct 56-57
MStrategy & Organisation – Training – E-learning 54
Suppliers & contractors 85-86
III.D – Fair practices Measures taken in favour of customers health and safety
2012 Achievements & 2013-2020 objectives – Conduct an annual third-party audit of health & safety risk
94
MHealth & Safety and environmental risks and pollutions
81-82
KPI: Annual Risk Assessment 82
III.E – Human rights Others measures taken in favour of Human Rights
As a signatory of the UN Global Compact, Unibail-Rodamco promotes the application of fundamental values and human rights, labour, the environment and corruption
53
P
“Annual and sustainable development report” : please refer to this section of the annual reportM = Material P = Potentially material N/A = Non applicable

REPORT OF THE CHAIRMAN OF THE SUPERVISORY BOARD
LEGAL INFORMATION
FINANCIAL REPORT 2012 - UNIBAIL-RODAMCO 110 • 111
Disclaimer
Certain statements contained in this document are
statements of future expectations and other forward-
looking statements. These expectations are based on the
management’s current views and assumptions and involve
known risks and uncertainties that could cause actual results
and/or data to differ materially from those expressed or
implied in these statements. Statements are based on the
current property portfolio and disregard the potential effects of
external factors including, but not limited to, climate change,
local energy policy or regulatory or legal developments.
The 2006-2008 data that is provided in this report was
collected and consolidated for the first time in 2008.The data
provided for 2009, 2010, 2011 and 2012 was collected using
internal management tools on a quarterly and/or annual
basis. The accuracy of this data may be affected by a number
of variables, including but not limited to the heterogeneity
of the assets in Unibail-Rodamco’s portfolio, the specific
characteristics of certain assets, and the differences in data
collection systems and perimeters at different assets.
Readers should not place undue reliance on forward-
looking statements. Unibail-Rodamco assumes no obligation
to update any forward-looking information contained in this
document subject to legal requirement. Data is subject to
change without notice.

CONSOLIDATED FINANCIAL STATEMENTS
CORPORATE SUSTAINABILITY
BUSINESS REVIEW AND 2012 RESULTS
PORTFOLIO
UNIBAIL-RODAMCO - FINANCIAL REPORT 2012 112 • 113
9. INDEPENDENT VERIFIER’S ATTESTATION AND LIMITED
ASSURANCE REPORT ON SOCIAL, ENVIRONMENTAL
AND SOCIETAL INFORMATION AND RELATED TO THE
GRI APPLICATION LEVEL B + SELF-DECLARATION OF
THE COMPANY
Year ended December 2012, 31st
To the Executive Board,
Pursuant to your request and in our capacity as
independent verifi er of Unibail-Rodamco SE, we hereby
report to you on the consolidated social, environmental and
societal information presented in the management report
issued for the year ended December 2012, 31st in accordance
with the requirements of Article L. 225-102-1 of the French
Commercial Code (Code de commerce).We also performed
a review of the adherence of the annual and sustainable
development report to the GRI 3.1 CRESS (Construction and
Real Estate Sector Supplement) guidelines corresponding to
Application Level B+.
Management’s Responsibility
The Executive Board is responsible for the preparation of
the management report including the consolidated social,
environmental and societal information (the «Information»)
in accordance with the requirements of Article R. 225-105-1
of the French Commercial Code (Code de commerce),
presented as required by the entity’s internal environmental
and social reporting standards (the «Guidelines») and of
which a summary is provided on pages 62-64 and 87 of the
management report ( the “methodology note”).
Our Independence and Quality Control
Our independence is defi ned by regulatory requirements,
the Code of Ethics of our profession (Code de déontologie) and
Article L. 822-11 of the French Commercial Code (Code de
commerce). In addition, we maintain a comprehensive system
of quality control including documented policies and procedures
to ensure compliance with ethical requirements, professional
standards and applicable legal and regulatory requirements.
Independent verifi er’s responsibility
It is our role, on the basis of our work:
• To attest whether the required Information is presented in
the management report or, if not presented, whether an
appropriate explanation is given in accordance with the third
paragraph of Article R. 225-105 of the French Commercial
Code (Code de commerce) and Decree no. 2012-557 dated
24 April 2012 (Attestation of presentation);
• To provide limited assurance on whether the Information is
presented fairly, in all material respects, in accordance with
the Guidelines (limited assurance).
1. Attestation of presentation
Our engagement was performed in accordance with
professional standards applicable in France:
• We compared the Information presented in the management
report with the list as provided in Article R. 225-105-1 of
the French Commercial Code (Code de commerce) and
summarized in the cross-reference table provided on pages
107 - 110 ;
• We verifi ed that the Information covers the consolidated
perimeter, namely the entity and its subsidiaries within the
meaning of Article L. 233-1 and the controlled entities within
the meaning of Article L. 233-3 of the French Commercial
Code (Code de commerce) within the limits specifi ed in the
methodology note presented on pages 62-64 and 87 of the
management report;
• In the event of the omission of certain consolidated
Information, we verifi ed that an appropriate explanation
was given in accordance with Decree no. 2012-557 dated
24 April 2012.
On the basis of our work, we attest that the required
information is presented in the management report in
accordance with the requirements of Article L. 225-102-1 of
the French Commercial Code (Code de commerce).
2. Limited assurance report
Nature and scope of the work
We conducted our engagement in accordance with ISAE
3000 (International Standard on Assurance Engagements)
and French professional guidance. We performed the
following procedures to obtain limited assurance that nothing
has come to our attention that causes us to believe that the
Information is not fairly presented, in all material respects, in
accordance with the Guidelines. A higher level of assurance
would have required extending the scope of our verifi cation
work. We also checked the adherence of the annual and
sustainable development report to the GRI 3.1 CRESS
guidelines corresponding to Application Level B+.
Our work consisted in the following:
• We assessed the appropriateness of the Guidelines as
regards their relevance, completeness, neutrality, clarity
and reliability, taking into consideration, where applicable,
the good practices in the sector.
This is a free translation into English of the original report issued in the French language and it is provided solely for the convenience
of English speaking users. This report should be read in conjunction with, and construed in accordance with, French law and professional
standards applicable in France.

REPORT OF THE CHAIRMAN OF THE SUPERVISORY BOARD
LEGAL INFORMATION
FINANCIAL REPORT 2012 - UNIBAIL-RODAMCO 112 • 113
• We verifi ed that the Group had set up a process for the
collection, compilation, processing and control of the
Information to ensure its completeness and consistency.
We examined the internal control and risk management
procedures relating to the preparation of the Information. We
conducted interviews with those responsible for social and
environmental reporting as well as the Group’s compliance
offi cer.
• We selected the consolidated Information to be tested and
determined the nature and scope of the tests, taking into
consideration their importance with respect to the social and
environmental consequences related to the Group’s business
and characteristics, as well as its societal commitments.
• Concerning the quantitative consolidated information that
we deemed to be the most important:
- at the level of the consolidating entity and the controlled
entities, we implemented analytical procedures and,
based on sampling, verifi ed the calculations and the
consolidation of this information;
- at the level of the sites and the countries that we
selected based on their business, their contribution
to the consolidated indicators, their location and a risk
analysis:
- we conducted interviews to verify that the procedures
were correctly applied;
- we performed tests of detail based on sampling,
consisting in verifying the calculations made and
reconciling the data with the supporting documents.
The sample thus selected represents on average 56% of
the workforce and between 15% and 27% of the quantitative
environmental information tested.
• Concerning the qualitative consolidated information that we
deemed to be the most important, we conducted interviews
and reviewed the related documentary sources in order
to corroborate this information and assess its fairness.
Regarding information related to fair operating practices,
interviews were only conducted at the consolidated level.
• As regards the other consolidated information published,
we assessed its fairness and consistency in relation to our
knowledge of the company and, where applicable, through
interviews or the consultation of documentary sources.
• Finally, we assessed the relevance of the explanations given
in the event of the absence of certain information.
Comments on Guidelines and the Information
We wish to make the following comments on the Guidelines
and the Information:
• The Guidelines, particularly those related to environmental
and societal information, was updated following
recommendations made during the 2011 verifi cation
exercise, a materiality analysis conducted in the context
of Article 225, and redefi ned objectives put in place for
the 2012-2020 period in accordance with the materiality
analysis.
• The energy effi ciency indicators reported refl ect the sectoral
recommendations provided by the European Public Real Estate
Association (EPRA). However, the calculation methodology for
the energy effi ciency and carbon intensity indicators, based on
the aggregation of the annual percentage, leads to the addition
of the annual uncertainties, which might generate a high level
of uncertainty in the long term.
• In case where a «green» energy contract exists with an
energy provider, the Group applies a zero emission factor
for the electricity consumed. Green electricity purchases
signifi cantly infl uence the reduction in emissions reported
by the Group.
• The information related to responsible purchasing are
limited to maintenance, security and cleaning service
providers.
Conclusion
Limited assurance
Based on our work described in this report, nothing
has come to our attention that causes us to believe that
the information is not fairly presented in accordance with
the requirements of Article L. 225-102-1 of the French
Commercial Code (Code de commerce) and, in all material
respects, in accordance with the Guidelines.
In addition, we confi rm that the annual and sustainability
development report of Unibail-Rodamco meets the
requirements of Application Level B + GRI CRESS 3.1, as
indicated in the self-declaration of the Group.
Paris La Défense, March 14, 2013
The Independent Verifi er
Ernst & Young et Associés
French original signed by:
Eric Duvaud
(1) • Social and societal information: total headcount and geographic distribution; absenteeism; total hours of training; territorial; economic and social impact of the activity; the Group’s organization related to stakeholder dialogue; the treatment of social and societal issues in the purchasing policy; sub-contracting and suppliers; fair operating practices. Environmental information: the Group’s organization related to environmental issues and its approach toward environmental certifi cation; energy consumption and measures taken to improve energy effi ciency; greenhouse gas emissions. ;(2) • Environment: Arkadia (Shopping Center – Poland), La Vaguada (Shopping Center – Spain), La Part Dieu (Shopping Center – France), Tour Ariane (Offi ces – France), Paris Nord Villepinte (Convention and Exhibition Center– France); Social: at the consolidated level for Poland, Spain and France.

CONSOLIDATED FINANCIAL STATEMENTS
CORPORATE SUSTAINABILITY
BUSINESS REVIEW AND 2012 RESULTS
PORTFOLIO
UNIBAIL-RODAMCO - FINANCIAL REPORT 2012
1. Consolidated fi nancial statements as at December 31, 2012 117Consolidated statement of comprehensive income 117Consolidated statement of fi nancial position 118Consolidated statement of cash fl ows 119Consolidated statement of changes in equity 120Changes in share capital 121
2. Notes to the consolidated fi nancial statements 1212.1. Accounting principles and consolidation methods 1212.2. Business segment report 1302.3. Scope of consolidation 1362.4. Highlights and comparability of the last two years 1422.5. Notes and comments 1472.6. Financial instruments 1642.7. Capital risk management 1692.8. Financial commitments and guarantees 1692.9. Employee remuneration and benefi ts 1722.10. Related party disclosures 1762.11. Relationship with Statutory Auditors 1762.12. Post closing events 177
3. Statutory auditors’ report on the consolidated fi nancial statements 178
Consolidatedfi nancialstatementsas at December 31, 2012
114 • 115

REPORT OF THE CHAIRMAN OF THE SUPERVISORY BOARD
LEGAL INFORMATION
FINANCIAL REPORT 2012 - UNIBAIL-RODAMCO 114 • 115
1. CONSOLIDATED FINANCIAL STATEMENTS AS AT DECEMBER 31, 2012
Consolidated statement of comprehensive income
Consolidated income statement – Presented under EPRA(1) format(€Mn) Notes 2012 2011
Gross rental income(2) 21 1,548.3 1,468.1
Ground rents paid 22 (20.7) (17.6)
Net service charge expenses 23 (20.5) (13.8)
Property operating expenses(2) 24 (189.5) (174.7)
Net rental income 1,317.6 1,262.0
Corporate expenses(3) (82.9) (84.4)
Development expenses (4.5) (5.2)
Depreciation (2.3) (2.3)
Administrative expenses 25 (89.7) (91.9)
Acquisition and related costs 26 (6.6) (2.9)
Revenues from other activities 177.1 165.8
Other expenses (120.5) (123.4)
Net other income 27 56.6 42.4
Proceeds from disposal of investment properties 615.3 772.6
Carrying value of investment properties sold (598.6) (736.5)
Result on disposal of investment properties 28 16.6 36.1
Proceeds from disposal of shares 90.4 378.1
Carrying value of disposed shares (90.4) (342.0)
Result on disposal of shares 29 – 36.1
Valuation gains 1,490.9 1,022.9
Valuation losses (287.7) (193.7)
Valuation movements 30 1,203.2 829.2
Impairment of goodwill (2.0) –
Net operating result before fi nancing cost 2,495.8 2,111.0
Result from non-consolidated companies 7.1 9.9
Financial income 93.6 81.9
Financial expenses (422.1) (383.0)
Net fi nancing costs 31 (328.6) (301.1)
Fair value adjustment of net share settled bonds convertible into new and/or existing shares (ORNANE) 14 (230.4) 43.4
Fair value adjustments of derivatives and debt 32 (219.3) (234.0)
Debt discounting 33 0.5 (0.5)
Share of the result of associates 34 79.9 4.2
Income on fi nancial assets 34 15.4 6.0
Result before tax 1,820.4 1,638.8
Income tax expenses 35 (136.0) (120.9)
Net result for the period 1,684.4 1,517.9
Non-controlling interests(3) 36 225.7 193.3
Net result (Owners of the parent)(3) 1,458.6 1,324.6
Average number of shares (undiluted) 92,358,483 91,850,947
Net result for the period (Owners of the parent) 1,458.6 1,324.6
Net result for the period (Owners of the parent) per share (€) 15.79 14.42
Net result for the period restated (Owners of the parent)(4) 1,638.0 1,281.2
Average number of diluted shares 93,105,153 93,291,418
Diluted net result per share – Owners of the parent (€) 17.59 13.73
Net comprehensive income (€Mn) Notes 2012 2011
Net result for the period 1,684.4 1,517.9
Foreign currency differences on translation of fi nancial statements of subsidiaries 19.3 21.9
Gain/loss on net investment hedge 29.7 (14.4)
Cash fl ow hedge (4.0) 1.4
Employee benefi ts(3) (8.1) 3.2
Revaluation of shares available for sale 5.2 4.3
Other comprehensive income(5) 37 42.1 16.3
Net comprehensive income 1,726.5 1,534.2
Non-controlling interests 225.4 193.4
Net comprehensive income (Owners of the parent) 1,501.0 1,340.9
(1) Presentation complying with European Public Real estate Association best practice recommendations.(2) In 2012, the property management fees reinvoiced to the tenants are reclassifi ed in Gross rental income. The fi gures in 2011 have been restated accordingly.(3) In 2012, the Group opted for an early adoption of IAS 19 Revised (“Employee benefi ts”). 2011 has been restated and €3.2 million were reclassifi ed from “Consolidated result” to “Consolidated reserves”.(4) The impact of the fair value of the ORNANE is restated from the net result of the period (see section 2.1 “Accounting principles and consolidation methods” § 2.1.13).(5) The other comprehensive income could be recycled, at any time, in the net result of the period.

CONSOLIDATED FINANCIAL STATEMENTS
CORPORATE SUSTAINABILITY
BUSINESS REVIEW AND 2012 RESULTS
PORTFOLIO
UNIBAIL-RODAMCO - FINANCIAL REPORT 2012 116 • 117
Consolidated statement of fi nancial position
(€Mn) Notes 31/12/2012 31/12/2011
Non current assets 28,797.5 25,426.1
Investment properties 1 26,658.3 24,055.9
Investment properties at fair value 25,912.8 23,419.1
Investment properties at cost 745.6 636.8
Other tangible assets 2 200.4 198,4
Goodwill 3 269.4 296,8
Intangible assets 4 206.1 211,3
Loans and receivables 5 127.0 244,5
Financial assets(1) 6 77.0 8,8
Shares available for sale 7 118.1 113.0
Deferred tax assets 16 5.0 6.0
Derivatives at fair value 15 182.6 84.9
Shares and investments in companies consolidated under the equity method 8 953.5 206.6
Current assets 773.6 977.2
Properties under promise or mandate of sale 1 – 221.5
Trade receivables from activity 10 278.5 282.5
Property portfolio 238.3 257.4
Other activities 40.2 25.1
Other trade receivables 11 429.7 390.9
Tax receivables 167.0 179.3
Receivables on sale of property – 3.4
Other receivables 200.8 155.1
Prepaid expenses 61.9 53.1
Cash and cash equivalents 12 65.3 82.3
Available for sale investments 2.2 2.3
Cash 63.1 80.0
Total assets 29,571.1 26,403.3
Shareholders’ equity (Owners of the parent) 12,902.5 11,636.1
Share capital 474.5 459.0
Additional paid-in capital 5,838.2 5,712.0
Bonds redeemable for shares 1.4 1.4
Consolidated reserves(2) 5,112.3 4,166.5
Hedging and foreign currency translation reserves 17.6 (27.4)
Consolidated result(2) 1,458.6 1,324.6
Non-controlling interests 1,583.1 1,419.4
Total shareholders’ equity 14,485.6 13,055.5
Non current liabilities 11,723.9 10,127.0
Long term commitment to purchase non-controlling interests 13 – 10.7
Net share settled bonds convertible into new and/or existing shares (ORNANE) 14 794.7 738.5
Long term bonds and borrowings 14 8,774.8 7,571.4
Long term fi nancial leases 14 121.3 120.8
Derivatives at fair value 15 625.3 369.8
Deferred tax liabilities 16 1,016.0 965.3
Long term provisions 17 30.2 28.3
Employee benefi ts 17 20.0 10.9
Guarantee deposits 192.2 182.1
Tax liabilities 20 14.5 –
Amounts due on investments 18 134.7 129.3
Current liabilities 3,361.6 3,220.8
Amounts due to suppliers and other current debt 19 965.5 759.1
Amounts due to suppliers 127.0 117.3
Amounts due on investments 18 400.0 280.8
Sundry creditors 274.0 180.8
Other liabilities 164.5 180.2
Current borrowings and amounts due to credit institutions 14 2,225.6 2,309.2
Current fi nancial leases 14 2.6 4.6
Tax and social security liabilities 20 146.4 122.2
Short term provisions 17 21.5 25.7
Total liabilities and equity 29,571.1 26,403.3
(1) The loans and receivables in 2011 have been restated in order to reclassifi y the shares in the line “Financial assets”.(2) In 2012, the Group opted for an early adoption of IAS 19 Revised (“Employee benefi ts”). 2011 has been restated and €3.2 million were reclassifi ed from “Consolidated result” to “Consolidated reserves”.

REPORT OF THE CHAIRMAN OF THE SUPERVISORY BOARD
LEGAL INFORMATION
FINANCIAL REPORT 2012 - UNIBAIL-RODAMCO 116 • 117
Consolidated statement of cash fl ows
(€Mn) Notes 2012 2011
Operating activities
Net result (1) 1,684.4 1,517.9
Depreciation & provisions(1) 16.1 21.4
Changes in value of property assets (1,203.2) (829.2)
Changes in value of fi nancial instruments 449.7 190.7
Discounting income/charges (0.5) 0.5
Charges and income relating to stock options and similar items 7.1 6.9
Other income and expenses – 0.3
Net capital gains/losses on sales of consolidated subsidiaries – (36.1)
Net capital gains/losses on sales of properties(2) (17.6) (35.2)
Income from companies consolidated under the equity method (79.9) (4.2)
Income on fi nancial assets (15.4) (6.0)
Dividend income from non-consolidated companies (7.3) (9.9)
Net fi nancing costs 328.6 301.1
Income tax charge 136.0 120.9
Cash fl ow before net fi nancing costs and tax 1,297.9 1,239.1
Income on fi nancial assets 14.8 6.0
Dividend income and result from companies under equity method or non consolidated 17.3 7.8
Income tax paid 38 (33.2) (17.2)
Change in working capital requirement 34.5 (16.6)
Total cash fl ow from operating activities 1,331.3 1,219.0
Investment activities
Property activities (1,497.5) (265.6)
Acquisition of consolidated subsidiaries 39 (481.9) (357.1)
Amounts paid for works and acquisition of property assets 40 (1,362.1) (1,245.6)
Exit tax payment (8.6) (0.5)
Repayment of property fi nancing 8.3 1.0
Increase of property fi nancing 41 (63.7) (1.3)
Disposal of consolidated subsidiaries 39 155.1 503.4
Disposal of investment properties 42 255.5 834.6
Finance leasing and short-term lending activities 0.3 (0.1)
Repayment of fi nance leasing 0.3 (0.1)
Financial activities 21.1 (105.5)
Acquisition of fi nancial assets (4.9) (108.6)
Disposal of fi nancial assets 25.6 3.0
Change in fi nancial assets 0.4 –
Total cash fl ow from investment activities (1,476.1) (371.2)
Financing activities
Capital increase of parent company 131.6 19.3
Change in capital from company with non-controlling shareholders (0.5) 7.5
Distribution paid to parent company shareholders 43 (735.4) (735.2)
Dividends paid to non-controlling shareholders of consolidated companies (9.8) (3.1)
Purchase of treasury shares – (17.3)
New borrowings and fi nancial liabilities 44 4,077.8 2,758.2
Repayment of borrowings and fi nancial liabilities 44 (2,983.7) (2,410.7)
Financial income 45 95.7 82.3
Financial expenses 45 (376.1) (386.1)
Other fi nancing activities (71.3) (159.0)
Total cash fl ow from fi nancing activities 128.4 (844.0)
Change in cash and cash equivalents during the period (16.5) 3.8
Cash at the beginning of the year 73.5 70.9
Effect of exchange rate fl uctuations on cash held (0.7) (1.2)
Cash at period-end(3) 46 56.3 73.5
(1) In 2012, the Group opted for an early adoption of IAS 19 Revised (“Employee benefi ts”). 2011 has been restated and €3.2 million were reclassifi ed from “Consolidated result” to “Consolidated reserves”.(2) Includes capital gains/losses on property sales, disposals of short term investment properties, disposals of fi nance leasing and disposals of operating assets.(3) Cash and equivalents include bank accounts and current accounts with terms of less than three months, less bank overdrafts.
The fi nancial statements are presented in millions of euros, rounded to the nearest hundred thousand and, as a result, slight
differences between rounded fi gures could exist in the different statements.

CONSOLIDATED FINANCIAL STATEMENTS
CORPORATE SUSTAINABILITY
BUSINESS REVIEW AND 2012 RESULTS
PORTFOLIO
UNIBAIL-RODAMCO - FINANCIAL REPORT 2012 118 • 119
Consolidated statement of changes in equity
(€Mn)
Sh
are
ca
pit
al
Ad
dit
ion
al
pa
id-i
n c
ap
ita
l
Bo
nd
s r
ed
ee
ma
ble
fo
r sh
are
s
Co
nso
lid
ate
d r
ese
rve
s
Co
nso
lid
ate
d n
et
resu
lt
He
dg
ing
& f
ore
ign
cu
rre
ncy
tra
nsla
tio
n
rese
rve
s(1
)
Tota
l O
wn
ers
of
the
p
are
nt
No
n-c
on
tro
llin
g in
tere
sts
Tota
l S
ha
reh
old
er’
s e
qu
ity
Equity as at 31/12/2010 458.7 5 948.2 1.8 2,465.1 2,187.6 (36.2) 11,025.2 1,345.4 12,370.6
Profi t or loss of the period – – – – 1,324.6 – 1,324.6 193.3 1,517.9
Other comprehensive income – – – 7.5 – 8.8 16.3 0.1 16.4
Net comprehensive income – – – 7.5 1,324.6 8.8 1,340.9 193.4 1,534.3
Earnings appropriation – – – 2,187.6 (2,187.6) – – (66.2) (66.2)
Dividends related to 2010 – (237.7) – (497.5) – – (735.2) – (735.2)
Stock options and Company Savings Plan 0.9 18.3 – – – – 19.2 – 19.2
Conversion of Bonds redeemable for shares – – (0.4) – – – (0.4) – (0.4)
Cancellation of treasury shares (0.7) (16.7) – – – – (17.4) – (17.4)
Share based payment – – – 6.9 – – 6.9 – 6.9
Changes in scope of consolidation and other movements – – – (3.0) – – (3.0) (53.2) (56.2)
Equity as at 31/12/2011 459.0 5,712.0 1.4 4,166.5 1,324.6 (27.4) 11,636.1 1,419.4 13,055.5
Profi t or loss of the period – – – – 1,458.6 – 1,458.6 225.7 1,684.3
Other comprehensive income – – – (2.6) – 45.0 42.4 (0.3) 42.1
Net comprehensive income – – – (2.6) 1,458.6 45.0 1,501.0 225.4 1,726.4
Earnings appropriation – – – 1,324.6 (1,324.6) – – (60.1) (60.1)
Dividends related to 2011 – – – (735.4) – – (735.4) – (735.4)
Stock options and Company Savings Plan 5.5 126.2 – – – – 131.6 – 131.6
Conversion of ORNANE(2) 10.1 – – 352.0 – – 362.1 – 362.1
Share based payment – – – 7.1 – – 7.1 – 7.1
Changes in scope of consolidation and other movements – – – – – – – (1.6) (1.6)
Equity as at 31/12/ 2012 474.5 5,838.2 1.4 5,112.3 1,458.6 17.6 12,902.5 1,583.1 14,485.6
(1) The foreign currency translation reserve is used to record exchange differences arising from the translation of the fi nancial statements of foreign subsidiaries. It is also used to record the effect of hedging net investments in foreign operations.(2) The Ornane issued in 2009 have been almost fully converted in 2012.
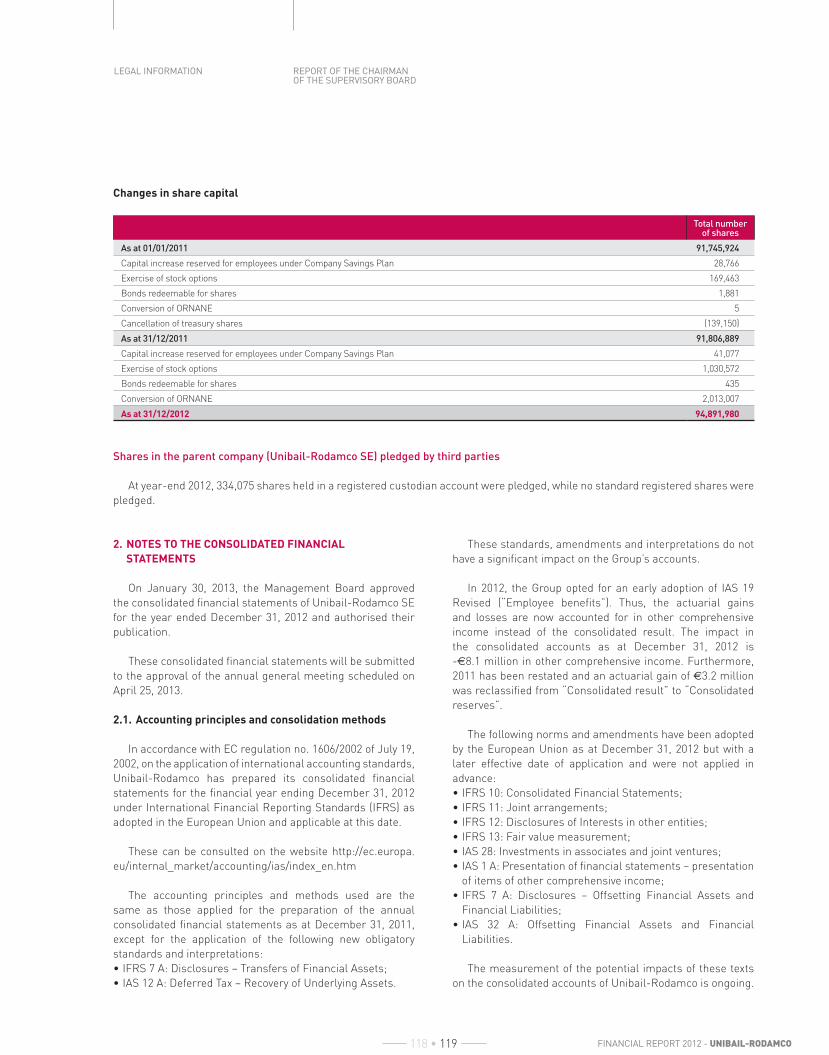
REPORT OF THE CHAIRMAN OF THE SUPERVISORY BOARD
LEGAL INFORMATION
FINANCIAL REPORT 2012 - UNIBAIL-RODAMCO 118 • 119
Changes in share capital
Total number of shares
As at 01/01/2011 91,745,924
Capital increase reserved for employees under Company Savings Plan 28,766
Exercise of stock options 169,463
Bonds redeemable for shares 1,881
Conversion of ORNANE 5
Cancellation of treasury shares (139,150)
As at 31/12/2011 91,806,889
Capital increase reserved for employees under Company Savings Plan 41,077
Exercise of stock options 1,030,572
Bonds redeemable for shares 435
Conversion of ORNANE 2,013,007
As at 31/12/2012 94,891,980
Shares in the parent company (Unibail-Rodamco SE) pledged by third parties
At year-end 2012, 334,075 shares held in a registered custodian account were pledged, while no standard registered shares were
pledged.
2. NOTES TO THE CONSOLIDATED FINANCIAL
STATEMENTS
On January 30, 2013, the Management Board approved
the consolidated fi nancial statements of Unibail-Rodamco SE
for the year ended December 31, 2012 and authorised their
publication.
These consolidated fi nancial statements will be submitted
to the approval of the annual general meeting scheduled on
April 25, 2013.
2.1. Accounting principles and consolidation methods
In accordance with EC regulation no. 1606/2002 of July 19,
2002, on the application of international accounting standards,
Unibail-Rodamco has prepared its consolidated fi nancial
statements for the fi nancial year ending December 31, 2012
under International Financial Reporting Standards (IFRS) as
adopted in the European Union and applicable at this date.
These can be consulted on the website http://ec.europa.
eu/internal_market/accounting/ias/index_en.htm
The accounting principles and methods used are the
same as those applied for the preparation of the annual
consolidated fi nancial statements as at December 31, 2011,
except for the application of the following new obligatory
standards and interpretations:
• IFRS 7 A: Disclosures – Transfers of Financial Assets;
• IAS 12 A: Deferred Tax – Recovery of Underlying Assets.
These standards, amendments and interpretations do not
have a signifi cant impact on the Group’s accounts.
In 2012, the Group opted for an early adoption of IAS 19
Revised (“Employee benefi ts”). Thus, the actuarial gains
and losses are now accounted for in other comprehensive
income instead of the consolidated result. The impact in
the consolidated accounts as at December 31, 2012 is
-€8.1 million in other comprehensive income. Furthermore,
2011 has been restated and an actuarial gain of €3.2 million
was reclassifi ed from “Consolidated result” to “Consolidated
reserves”.
The following norms and amendments have been adopted
by the European Union as at December 31, 2012 but with a
later effective date of application and were not applied in
advance:
• IFRS 10: Consolidated Financial Statements;
• IFRS 11: Joint arrangements;
• IFRS 12: Disclosures of Interests in other entities;
• IFRS 13: Fair value measurement;
• IAS 28: Investments in associates and joint ventures;
• IAS 1 A: Presentation of fi nancial statements – presentation
of items of other comprehensive income;
• IFRS 7 A: Disclosures – Offsetting Financial Assets and
Financial Liabilities;
• IAS 32 A: Offsetting Financial Assets and Financial
Liabilities.
The measurement of the potential impacts of these texts
on the consolidated accounts of Unibail-Rodamco is ongoing.

CONSOLIDATED FINANCIAL STATEMENTS
CORPORATE SUSTAINABILITY
BUSINESS REVIEW AND 2012 RESULTS
PORTFOLIO
UNIBAIL-RODAMCO - FINANCIAL REPORT 2012 120 • 121
The Group currently expects to opt for early adoption of
the new IFRS 10-11-12 in 2013. Regarding these norms, and
particularly the new defi nition of control, an impact analysis
has been carried out. The Group does not anticipate any
signifi cant modifi cation of the scope of consolidation, except
for the entities currently under joint control. The application
of IFRS 10 & 11 would lead to consolidation under equity
method of 26 companies currently consolidated under the
proportional method. If IFRS 10 and 11 had been applied
in 2012, it would have impacted the net rental income by
-€48.7 million and on the investment properties portfolio
by -€1,200.5 million. Following the change of consolidation
method from proportional to equity method, no impact on the
net result owner of the parent would be expected.
The following texts were published by the IASB but have
not yet been adopted by the European Union:
• Annual improvements to IFRS (the 2009-2011 cycle), which
include amendments to the following standards:
– IAS 1: Presentation of Financial Statements,
– IAS 16: Property, Plant and Equipment,
– IAS 32: Financial Instruments – Presentation;
• Transition guidance (Amendments to IFRS 10, 11, 12);
• Investment entities (Amendments to IFRS 10, IFRS 12 and
IAS 27);
• IFRS 9: Financial instruments.
Estimations and assumptions
Certain amounts recorded in the consolidated fi nancial
statements refl ect estimates and assumptions made by
management, particularly with regards to the fair value of
investment properties and fi nancial instruments as well as
the valuation of goodwill and intangible assets.
The most signifi cant estimates are set out in the notes to
the consolidated fi nancial statements: for the valuation of
investment properties in section 2.1 § 2.1.5 “Asset valuation
methods” and section 2.5 note 1 “Investment properties”, for
the goodwill and intangible assets, respectively in section 2.1
§ 2.1.3 “Business combinations” and § 2.1.5 “Asset valuation
methods” and, for fair value of fi nancial instruments, in
section 2.5 note 15 “Hedging instruments”. Actual future
results or outcomes may differ from these estimates. The
property portfolio and intangible assets used by the Shopping
centres, Offi ces and Convention-Exhibition segments are
valued by independent appraisals.
The consolidated fi nancial statements under IFRS concern
the fi nancial years ending December 31, 2012 and
December 31, 2011.
2.1.1. Options selected under IFRS 1
When adopting IFRS for the fi rst time, IFRS 1 grants
certain exemptions with regards to the application of other
IFRS. These exemptions are optionally applied.
The exemptions applied relate mainly to business
combinations, where the application of IFRS 3 “Business
combinations” retrospectively to business combinations
which occurred prior to the transition to IFRS is optional.
Unibail-Rodamco has chosen to use this exemption.
Unibail-Rodamco has chosen not to apply other options
provided by IFRS 1.
2.1.2. Scope and methods of consolidation
The scope of consolidation includes all companies
controlled by Unibail-Rodamco and all companies in which
the Group exercises joint control or signifi cant infl uence.
The method of consolidation is determined by the type of
control exercised:
• control: fully consolidated. Control is presumed if Unibail-
Rodamco, directly or indirectly, holds an interest of
more than 50%, unless there is clear evidence that this
shareholding does not provide control. Full control also
exists when the parent company holds 50% or less of the
voting rights in a company and has authority regarding the
company’s fi nancial and operational strategies and can
appoint or dismiss the majority of members of the Board of
Directors or an equivalent decision-making body;
• joint control: proportionally consolidated. This is
demonstrated by the sharing of control of an economic
activity under a contractual agreement. It requires the
unanimous agreement of partners for operating, strategic
and fi nancial decisions;
• signifi cant infl uence: consolidated under the equity method.
Signifi cant infl uence is identifi ed when there is authority to
contribute to fi nancial and operational decision-making
of the company concerned, but without exercising control
over its policies. Signifi cant infl uence is assumed where
the Group directly or indirectly holds 20% or more of voting
rights in a company.
The consolidated fi nancial statements are established by
integrating the individual fi nancial statements of Unibail-
Rodamco SE with all relevant subsidiaries over which
Unibail-Rodamco exercises control. Subsidiaries closing
their accounts more than three months before or after
Unibail-Rodamco’s closing date prepare pro forma interim
statements to December 31, determined on a 12-month basis.
2.1.3. Business combinations
Business combinations are accounted for using the
acquisition method. The acquisition is recognised at the
aggregate of the consideration transferred, measured
at acquisition date fair value, and the amount of any
non-controlling interest in the acquiree. For each business
combination, the acquirer measures the non-controlling
interest in the acquiree either at fair value or at the
proportionate share of the acquiree’s identifi able net assets.

REPORT OF THE CHAIRMAN OF THE SUPERVISORY BOARD
LEGAL INFORMATION
FINANCIAL REPORT 2012 - UNIBAIL-RODAMCO 120 • 121
The Group continues to measure the non-controlling interest
at the proportionate share of the acquiree’s identifi able net
assets.
Acquisition costs incurred are booked as expenses. For
the companies consolidated under equity method, acquisition
costs are capitalised in the value of the shares.
At the date of acquisition and in accordance with IFRS 3
Revised, identifi able assets, liabilities, off-balance sheet
items and contingent liabilities of the acquired company are
valued individually at their market value regardless of their
purpose. The analysis and appraisals required for the initial
valuation of these items, as well as any corrections based on
new information, may be carried out within 12 months of the
date of acquisition.
If the business combination is achieved in stages, the
acquisition date fair value of the acquirer’s previously held
equity interest in the acquiree is remeasured to fair value at
the acquisition date through income statement.
Any contingent consideration to be transferred by the
acquirer is recognised at fair value at the acquisition date.
Subsequent changes to the fair value of any contingent
consideration classifi ed as liability will be recognised in
income statement.
Goodwill
Goodwill only arises upon a business combination and
is initially measured as the residual cost of the business
combination after recognising the acquiree’s identifi able
assets, liabilities, and contingent liabilities. Subsequently the
goodwill is carried at cost and is subject to regular reviews
by the Group and impairment tests at least once per year or
whenever there is an indication of impairment. At the date
of acquisition, goodwill is allocated to one or more cash-
generating units expected to benefi t from the acquisition. The
recoverable amount of a cash-generating unit is determined
using the most appropriate method, most commonly the
discounted cash fl ows method, and is applied to the full cash-
generating unit rather than each legal entity.
Goodwill may arise on acquiring an asset via a share
deal, where the Group inherits the fi scal basis of the assets.
As IFRS require recognition of deferred taxes on a nominal
basis, while share transactions are based on market value
of these taxes, a difference may appear that is refl ected in
the goodwill. The impairment of this goodwill is calculated
according to the amounts of tax optimisation existing at the
date of reporting.
Under IFRS 3 Revised, acquisition of additional shares
from non-controlling shareholders are regarded as equity
transactions and therefore no additional goodwill is
recognised.
Consequently, when non-controlling shareholders have an
agreement to sell, non-controlling interests are reclassifi ed
as debt at the present value of the exercise price. The
difference between the latest value and the net carrying value
of the non-controlling interests is recognised as equity –
Owners of the parent. Any subsequent change in debt is also
accounted for as equity – Owners of the parent. Income from
non-controlling interests and dividends are booked in equity
– Owners of the parent.
2.1.4. Foreign currency translation
Functional and presentation currency
Items included in the fi nancial statements of each of the
Group’s entities are measured using the currency of the
primary economic environment in which the entity operates
(the “functional currency”). Consideration in determining
the functional currency is given to the denomination of the
major cash fl ows of the entity e.g. revenues and fi nancing. As
a consequence, the Group uses the functional currency rather
than the local currency for the following entities: euro for the
property companies in Czech Republic, Hungary, Slovakia and
Poland.
The consolidated fi nancial statements are presented
in euros, which is the Group’s functional and presentation
currency.
Foreign currency transactions and balances
Transactions in foreign currencies are translated into
euro at the spot exchange rate on the date of the transaction.
Monetary assets and liabilities denominated in foreign
currencies at the accounting date are translated into euro at
the exchange rate on that date. Foreign exchange differences
arising on translation are recognised in the income statement
account. Non-monetary assets and liabilities that are
measured in terms of historical cost in foreign currency are
translated using the exchange rate on the date of transaction.
Non-monetary assets and liabilities denominated in foreign
currencies that are stated at fair value are translated into
euros at exchange rates on the dates the fair value was
determined.
Exchange differences arising on the settlement of
currency transactions or on translating monetary items at
rates different from those at which they were translated on
initial recognition during the year or in previous fi nancial
statements are recognised in the income statement account
in the year in which they arise. Translation differences on
non-monetary fi nancial assets and liabilities that are stated
at fair value are reported as part of the fair value gain or loss.
Foreign currency transactions are translated into the
functional currency of the Group using the exchange rates
at the date of transactions. Foreign exchange gains and

CONSOLIDATED FINANCIAL STATEMENTS
CORPORATE SUSTAINABILITY
BUSINESS REVIEW AND 2012 RESULTS
PORTFOLIO
UNIBAIL-RODAMCO - FINANCIAL REPORT 2012 122 • 123
losses resulting from settlement of these transactions are
recognised in the income statement. Foreign exchange gains
and losses resulting from the retranslation of monetary assets
and liabilities denominated in foreign currencies are also
recognised in the income statement with the exception of:
• unrealised translation results on net investments;
• unrealised translation results on intercompany loans that,
in substance, form part of the net investment.
Hedges of a net investment in a foreign operation, including
a hedge of a monetary item that is accounted for as part of the
net investment, are accounted for in a way similar to cash fl ow
hedges. Gains or losses on the hedging instruments relating
to the effective portion of the hedge are recognised directly in
equity, whereas those relating to the ineffective portion are
recognised in the income statement account.
Group companies with a functional currency different
from the presentation currency
The results and fi nancial position of all the Group entities
that have a functional currency different from the presentation
currency are translated into the presentation currency as
follows:
• the assets and liabilities, including goodwill and fair value
adjustments arising on consolidation, are translated into
euro at foreign exchange rates ruling at the accounting date;
• income and expenses are translated into euro at rates
approximating the foreign exchange rates ruling at the
dates of the transactions;
• all resulting exchange rate differences are recognised
as a separate component of equity (currency translation
reserve);
• when a Group company is sold, exchange differences that
were recorded in equity are recognised in the income
statement as part of the gain or loss on sale.
2.1.5. Asset valuation methods
Investment properties (IAS 40)
Under the benchmark treatment recommended by IAS 40,
investment properties are shown at their market value.
Transaction costs incurred for an asset deal are capitalised
in the value of the investment property.
Investment Properties Under Construction (IPUC) are
covered by IAS 40 and are eligible to be measured at fair
value. In accordance with the Group’s investment properties
valuation method, they are valued at fair value by an external
appraiser. Projects for which the fair value is not reliably
determinable are valued at cost until such time that a fair
value valuation becomes reliable, or until one year before the
construction completion.
The development project is eligible for a fair value
measurement once all three of the following criteria are fulfi lled:
• all administrative authorisations needed to complete the
project are obtained;
• the construction has started and costs are committed
toward the contractor;
• substantial uncertainty in future rental income has been
eliminated.
If the time to delivery is less than one year, the project has
to be taken at fair value.
For the Investment Properties Under Construction whose
fair value could be reliably measured, the difference between
market value and cost value is entirely recognised in the
income statement.
Properties under construction carried at cost are
subject to impairment tests, determined on the basis of the
estimated fair value of the project. The fair value of a project
is assessed by the Development & Investment teams through
a market exit capitalisation rate and the targeted net rents at
completion. When the fair value is lower than net book value,
an impairment provision is booked.
For properties measured at fair value, the market value
adopted by Unibail-Rodamco is determined on the basis of
appraisals by independent external experts, who value the
Group’s portfolio as at June 30 and December 31 of each year.
A discount is applied to the gross value in order to refl ect
disposal costs and transfer taxes(1), depending on the country
and on the tax situation of the property.
As at December 31, 2012, independent experts have
appraised 95% of Unibail-Rodamco’s portfolio.
For the Shopping centres and Offi ces portfolios, the
valuation principles adopted are based on a multi-criteria
approach. The independent appraisers determine the fair
market value based on the results of two methods: the
discounted cash fl ow methodology as well as the yield
methodology. Furthermore, the resulting valuations are
cross-checked against the initial yield, value per square
meter and the fair market values established through actual
market transactions.
Appraisers have been given access to all information
relevant for valuations, such as the Group’s rent rolls,
including information on vacancy, break options, expiry dates
and lease incentives, performance indicators (e.g., footfall and
sales where available), letting evidence and the Group’s cash
fl ow forecasts from annually updated detailed asset business
plans. Appraisers make their independent assessments of
current and forward looking cash fl ow profi les and usually
refl ect risk either in the cash fl ow forecasts (e.g. future
(1) Transfer taxes are valued on the assumption that the property is sold directly, even though the cost of these taxes can, in certain cases, be reduced by selling the property’s holding company.

REPORT OF THE CHAIRMAN OF THE SUPERVISORY BOARD
LEGAL INFORMATION
FINANCIAL REPORT 2012 - UNIBAIL-RODAMCO 122 • 123
rental levels, growth, investment requirements, void periods,
incentives) or in the applied required returns or discount rates.
For the Convention-Exhibition portfolio, the valuation
methodology adopted is mainly based on a discounted cash
fl ow model applied to total net income projected over the life of
the concession (notably the Porte de Versailles concession(1))
or leasehold, if it exists or otherwise over a 10-year period,
with an estimation of the asset’s value at the end of the given
time period, based either on the residual contractual value for
concessions or on capitalised cash fl ows over the last year.
The valuations carried out by the appraisers took into account
total net income, which comprised net rents and ancillary
services, as well as net income from car parks. The cost
of maintenance works, major repairs, refurbishments,
redevelopments and extensions, as well as concession or
leasehold fees, are included in projected cash fl ow fi gures.
The income statement for a given year (Y) records the
change in value for each property, which is determined as
follows:
market value Y – [market value Y-1 + amount of works and
other costs capitalised in year Y].
Capital gains on disposals of investment properties are
calculated by comparison with their latest market value
recorded in the closing statement of fi nancial position for the
previous fi nancial year.
Properties under promise or mandate of sale are identifi ed
separately in the statement of fi nancial position.
Other tangible assets
Under the preferential method proposed by IAS 16,
operating assets are valued at their historic cost, less
cumulative depreciation and any decrease in value.
Depreciation is calculated using the “component accounting”
method, where each asset is broken down into major
components based on their useful life. The four components
of a property are the main structure, the facade, technical
equipment and fi nishing fi xtures and fi ttings, depreciated
respectively over 60, 30, 20 and 15 years for Offi ces properties
and 35, 25, 20 and 15 years for Shopping centres assets.
The property owned and occupied by the Group, located at
7, place Adenauer, Paris 16th, is classifi ed in “Other tangible
assets”.
If the appraisal value of a property is lower than net book
value, an impairment provision is booked.
Borrowing costs generated by construction projects (IAS 23)
Borrowing costs directly attributable to the acquisition or
construction of an asset are capitalised as part of the cost of
the respective assets. All other borrowing costs are expensed
in the period in which they occur. Borrowing costs consist of
interest and other costs that an entity incurs in connection
with the borrowing of funds.
The interest costs capitalised are calculated using the
Group’s weighted average costs of borrowing applied to the
average value of the work completed during each quarter,
unless specifi c fi nancing exists for the project. In this case,
the specifi c interest costs are capitalised.
Capitalisation of borrowing costs starts when an
Investment Property Under Construction is recognised as an
asset and ends when the project is transferred to standing
investment property at the delivery date to the tenant or
earlier when the project is technically completed.
Intangible assets (IAS 38) / Impairment of assets (IAS 36)
An intangible asset is recognised when it is identifi able and
separable and can be sold, transferred, licensed, rented, or
exchanged, either individually or as part of a contract with an
attached asset or a liability, or which arises from contractual
or other legal rights regardless of whether those rights are
transferable or separable. After initial recognition, intangible
assets are recognised at cost less any amortisation charges
and impairment losses.
Intangible assets with a fi nite life are amortised on a linear
basis over the life of the asset. The useful life of an asset is
reviewed each year and an impairment test is carried out
whenever there is an indication of impairment.
Intangible assets with an indefi nite useful life are not
amortised but their life span is reviewed each year. These
assets are subject to impairment tests annually or whenever
there is an indication of impairment, which consists of
comparing the book value with the recoverable amount of
the intangible. The recoverable amount of an asset or a
cash-generating unit is the maximum between its fair value
less disposal costs and its value in use. It is assessed on
the basis of the present value of expected future cash fl ows
from the continued use of the asset and its terminal value.
Impairment tests are carried out by grouping assets together
into cash-generating units. In the case of reduction in value,
a corresponding impairment charge is recognised in the
income statement.
The intangible assets recognised on Viparis entities are
valued by external appraisers. If the appraisal value of an
intangible asset is lower than net book value, an impairment
provision is booked.
(1) For Porte de Versailles asset valuations, a concession renewal probability of 22.5% was assumed by the appraiser.

CONSOLIDATED FINANCIAL STATEMENTS
CORPORATE SUSTAINABILITY
BUSINESS REVIEW AND 2012 RESULTS
PORTFOLIO
UNIBAIL-RODAMCO - FINANCIAL REPORT 2012 124 • 125
2.1.6. Leasing
Leases are classifi ed as fi nance leases when they transfer
substantially all risks and rewards of ownership of the leased
asset to the lessee. Otherwise they are classifi ed as operating
leases.
• The Group’s remaining fi nance leasing activity as lessor
represents a residual outstanding amount of €0.2 million
as at December 31, 2012.
• Ground leaseholds: based on the analysis of existing
contracts, IAS 17 and IAS 40, a leasehold may be
classifi ed as either an operating lease or a fi nance lease.
The classifi cation is made on a contract-by-contract basis
and depends on the risks and rewards transferred to the
Group.
– For the leaseholds recognised as operating leases, rental
payments are recognised as expenses in the income
statement. Rental payments made at the beginning of the
contract are classifi ed as prepaid expenses and expensed
over the life of the contract.
– Buildings constructed on land under a lease agreement
are recognised in accordance with the accounting
principles described in § 2.1.5.
Revenue recognition
Accounting treatment of investment properties leases
Assets leased as operating leases are recorded on the
statement of fi nancial position as investment property assets.
Rental revenue is recorded on a straight-line basis over the
fi rm duration of the lease.
Rents and key money
Under IAS 17 and SIC 15, the fi nancial impacts of terms set
out in the lease agreement are spread over the fi xed duration
of the lease starting from the date the premises are made
available to the tenant. This applies to rent-free periods, step
rents and key money.
Eviction costs
Compensation payments to evicted tenants may be
capitalised, in view of securing higher rentals through new
lease agreements on improved terms and which ultimately
enhance or at least maintain asset performance.
Delivery of an Investment Property
In case of an Investment property Under Construction,
revenues are recognised once spaces are delivered to tenants.
2.1.7. Financial instruments (IAS 32 / IAS 39 / IFRS 7)
The recognition and measurement of fi nancial assets and
liabilities are defi ned by the standard IAS 39.
a. Classifi cation and measurement of non-derivative
fi nancial assets and liabilities
Loans and receivables
Loans and receivables, acquired or granted, not held for
the purpose of trading or sale, are recorded on the statement
of fi nancial position as “Loans and receivables”. After initial
recording, they are measured at amortised cost based on the
effective interest rate. They may be subject to impairment
when necessary.
Financial assets
They comprise shares on non-consolidated companies
and bonds held to maturity. After initial recording, they
are measured at amortised cost. They may be subject to
impairment when necessary.
Available-for-sale securities
These are non-derivative fi nancial assets held for an
undetermined period that may be sold by the Group at any
time. They are measured at their fair value at the accounting
date and recorded as available-for-sale investments. Interest
accrued or received on fi xed-income securities is recorded
as income based on the effective interest rate. Changes
in market value other than income are recorded in other
comprehensive income. Fair value variations are recorded
on the income statement if the asset is sold or signifi cantly
impaired.
Non-derivative fi nancial liabilities
Non-derivative fi nancial liabilities are measured after initial
booking at amortised cost using the effective interest rate.
In certain cases, IAS 39 permits fi nancial liabilities to be
designated at fair value upon initial recording. This treatment
was applied for the net share settled bonds convertible into
new and/or existing shares (ORNANE) issued in April 2009 as
well as to the new ORNANE issued in September 2012.
Being a fi nancial debt with an embedded derivative,
and based on the option provided by IAS 39, the ORNANE
convertible bond, net of net of the issuance costs’ write off, are
accounted for fully, at inception, at fair value, on a separate
line in the statement of fi nancial position, with subsequent
changes recorded on a separate line in the income statement.
The accrued interest is classifi ed in the consolidated statement
of fi nancial position on the line “Current borrowings and
amounts due to credit institutions”. The interest expenses
are booked based on the contractual’s interest rates and are
classifi ed in the statement of comprehensive income on the
line “Net fi nancing costs”.

REPORT OF THE CHAIRMAN OF THE SUPERVISORY BOARD
LEGAL INFORMATION
FINANCIAL REPORT 2012 - UNIBAIL-RODAMCO 124 • 125
b. Classifi cation and measurement of fi nancial derivatives
and hedge accounting
The Group uses derivative fi nancial instruments to hedge its
exposure to movements in interest and currency exchange rates.
All fi nancial derivatives are recorded as fi nancial assets or
liabilities at fair value on the statement of fi nancial position.
Fair value variations of fi nancial derivatives, apart from
those designated as cash fl ow hedges or as net investment
hedges (see below), are recognised in the income statement
for the period.
Unibail-Rodamco has a macro-hedging strategy for its
debt. Except for currency derivatives, it has chosen not to use
the hedge accounting proposed by IAS 39. All such derivatives
are therefore measured at their market value and any fair
value variations are recorded in the income statement.
Regarding the currency derivatives, they aim at hedging
the investments made in countries outside of the Eurozone.
Therefore the majority of currency swaps and forward
contracts are designated as a net investment hedge. The
portion of the gain or loss on these instruments that is
determined to be an effective hedge is recognised directly in
equity (currency translation reserve). The ineffective portion
is recognised directly in the income statement, as fair value
changes derivative fi nancial instruments.
Changes in the fair value of forward exchange contracts
that economically hedge monetary assets and liabilities
in foreign currencies and for which no hedge accounting is
applied are recognised in the income statement account.
Both the changes in fair value of the forward contracts and the
foreign exchange gains and losses relating to the monetary
items are recognised as part of “fi nancing result” as these
instruments are designated as hedging instruments.
2.1.8. Discounting of deferred payments
Long term liabilities and receivables are discounted when
this has a signifi cant impact.
• Deferred payments on assets deals, share deals, acquisitions
of lands and ground leases have been discounted up to the
payment date.
• The exit tax liability payable over a four-year period (to
qualify for the SIIC tax regime) is discounted.
• Provisions for material liabilities taken under IAS 37 are
discounted over the estimated duration of the disputes
they cover.
• Guarantee deposits received from tenants have not been
discounted given the negligible impact of discounting.
2.1.9. Taxes
The Group companies are taxable according to the tax
rules of their country. In some countries, special tax regimes
for public property companies exist.
French SIIC status (Société d’Investissement
Immobilier Cotée)
Most of the French property companies which are eligible
for SIIC tax status have opted for this regime. Recurring
income and capital gains are exempted from French tax
but the companies are required to distribute 85% of their
recurring income, 50% of capital gains and 100% of dividends
received from SIIC subsidiaries.
Due to the diversity of its business activities, Unibail-
Rodamco SE undergoes a specifi c tax treatment:
• its SIIC-eligible business is exempt from tax on recurring
income and capital gains on disposals;
• activities relating to fi nance leasing contracts signed before
January 1, 1991 are tax exempt;
• all other operations are taxable.
Dutch FBI regime
The requirements for FBI companies are partly related to
their activities and their shareholding base. According to the
Dutch Ministry of Finance, Unibail-Rodamco itself does not
qualify as an FBI, as it is deemed not to meet the activity test.
Therefore, as reported in its press release of December 11,
2009, Unibail-Rodamco expects that the Dutch tax authorities
will deny the status of FBI in The Netherlands for Unibail-
Rodamco’s Dutch activities for 2010 onwards. Differences
between the French SIIC and the Dutch FBI regime, although
materially insignifi cant in the Group’s case, proved to be
irreconcilable for the Dutch tax authorities.
Although Unibail-Rodamco does not agree with the
viewpoint of the Dutch tax authorities, it continues to apply a
prudent view in its 2012 accounts, based on the assumption
that the Dutch activities from 2010 onwards will be taxable.
Due to signifi cant Dutch tax-loss carry forwards the Group
has realised, this had no impact on the Group’s recurring
result for 2012, and will not have a material impact on its
recurring results for the foreseeable future.
Income tax and deferred tax
Corporate income tax
Corporate income tax is calculated using appropriate local
rules and rates.

CONSOLIDATED FINANCIAL STATEMENTS
CORPORATE SUSTAINABILITY
BUSINESS REVIEW AND 2012 RESULTS
PORTFOLIO
UNIBAIL-RODAMCO - FINANCIAL REPORT 2012 126 • 127
In France, the companies which pay income tax are mainly
the Viparis entities and some property services companies.
The other companies which are not eligible for SIIC tax status
are grouped under tax consolidation sub-groups, which have
opted for the tax consolidation scheme.
Deferred tax
Deferred taxes are recognised in respect of all temporary
differences between the carrying amount and tax base of
assets and liabilities at each fi nancial year-end.
Deferred tax assets or liabilities are calculated based on
total temporary differences and on tax losses carried forward,
using the local tax rate that will apply on the expected reversal
date of the concerned differences, if this rate has been set.
Otherwise, they are calculated using the applicable tax rate
in effect at the fi nancial year-end date. Within a given fi scal
entity or group and for a given tax rate, debit balances are
booked to assets for the amount expected to be recoverable
over a foreseeable period. A deferred tax asset is recognised
only to the extent that it is probable that future taxable profi ts
will be available against which the temporary difference can
be utilised.
The main deferred tax liabilities relate to:
• the mark-to-market of investment properties, resulting in
the recognition of a deferred tax liability for non tax-exempt
assets;
• the recognition of intangible assets identifi ed on Viparis
entities, particularly Viparis Porte de Versailles and Viparis
Nord Villepinte.
2.1.10. Share-based payments
Under IFRS 2, all transactions relating to share-based
payments must be recognised in the income statement.
This is the case for Unibail-Rodamco’s Stock Option Plan,
Performance Shares Plan and Company Savings Plan.
Stock options granted to employees are stated at their
fair value on the date of allocation. As the transactions are
equity-settled share-based payments, this value remains
unchanged, even if the options are never exercised. The value
applied to the number of options fi nally acquired at the end
of the vesting period (estimation of the turnover) is booked
as an expense, with a corresponding increase in equity which
is spread over the vesting period (i.e. the period during which
employees must work for the company before they can
exercise the options granted to them).
The stock options and performance shares, all subject to
performance criteria, have been valued using a Monte Carlo
model.
Shares issued under the Company Savings Plan are offered
at a discount to the share price. This discount represents an
employee benefi t and is recorded in the income statement for
the period, with a corresponding increase in equity.
The additional expenses incurred by the stock option
plans, performance shares plans and company savings plan
are classifi ed under personnel expenses.
2.1.11. Employee benefi ts
In 2012, the Group opted for an early adoption of IAS 19
Revised (“Employee benefi ts”). 2011 has been restated
accordingly.
Under IAS 19 Revised, a company must recognise all
commitments made to its employees (i.e. current or future,
formal or informal, cash payments or payments in kind).
The cost of employee benefi ts must be recorded during the
vesting period.
Post-employment benefi ts
Pension schemes may be defi ned contribution or defi ned
benefi t schemes.
Under defi ned contribution schemes, the employer only
pays a contribution, with no commitment from the Group
regarding the level of benefi ts to be provided. The contributions
paid are booked as expenses for the year.
Under defi ned benefi t schemes, the employer makes
a formal or implied commitment to an amount or level of
benefi ts and therefore carries the medium or long term
risk. A provision is booked to liabilities to cover all of these
pension commitments. This provision is assessed regularly by
independent actuaries using the projected unit credit method,
which takes into account demographic assumptions, early
retirements, salary increases and discount and infl ation rates.
In the majority of the Group’s companies, pensions due
under the various compulsory retirement schemes to which
employers contribute are managed by specialist external
organisations. Defi ned contributions paid into these various
compulsory retirement schemes are recognised in the
income statement for the period.
The Dutch companies have pension plans with both
defi ned contribution as well as defi ned benefi t components.
For the latter, commitments are recorded as a provision.

REPORT OF THE CHAIRMAN OF THE SUPERVISORY BOARD
LEGAL INFORMATION
FINANCIAL REPORT 2012 - UNIBAIL-RODAMCO 126 • 127
Provisions are booked for retirement allowances relating
to defi ned benefi t schemes based on the net present value
of these future allowances. According to IAS 19 Revised, the
actuarial gains and losses are accounted for in the “other
comprehensive income”.
Long term benefi ts
These are benefi ts paid to employees more than
12 months after the end of the fi nancial year during which
the corresponding service was provided. The same valuation
method is used as for post-employment benefi ts.
Except for the provision for retirement allowances, no
commitments relating to long term or post-employment
benefi ts need to be accrued.
2.1.12. Business segment reporting
Segment information is presented in respect of the Group’s
divisions and geographical segments, based on the Group’s
management and internal reporting structure.
Business segments
The Group presents its result by segment: Shopping
centres, Offi ces, Convention-Exhibition and Property services.
The Convention-Exhibition segment comprises
management of exhibition venues (Viparis), management
of hotels (Pullman-Montparnasse and Cnit-Hilton hotels
operated under an operational lease agreement, and Lyon
Confl uence hotel operated under a management contract)
and the organisation of exhibitions (Comexposium), the latter
consolidated under the equity method.
Geographical segments
Geographical segments are determined on the basis of the
Group’s defi nition of a home region. A home region is defi ned
as a region with more than €1 billion in property investment
and a local organisation dedicated to all three business lines:
the “owner function” (asset selection and management
including pipeline), Shopping centre management, and the
fi nance function.
The following are considered home regions based on
specifi c operational and strategic factors:
• France;
• Spain;
• Central Europe, managed from Prague, including the Czech
Republic, Germany, Hungary and Poland;
• Austria, managed from Vienna, including Austria and
Slovakia;
• Nordic countries, managed from Stockholm, including
Sweden, Denmark and Finland;
• The Netherlands.
2.1.13. Earnings per share
The earnings per share indicator is calculated by dividing
net result (owners of the parent) by the weighted average
number of ordinary shares in circulation over the period.
To calculate diluted earnings per share, the average
number of shares in circulation is adjusted to take into
account the conversion of all potentially dilutive ordinary
shares, in particular stock options and performance shares
during the vesting period, as well as the bonds redeemable
for shares (ORA) and the net share settled bonds convertible
into new and/or existing shares (ORNANE).
The dilutive impact is determined using the treasury
stock method, which assumes that proceeds from the
exercise of options are used to repurchase company shares
at their market value. The market value corresponds to the
average monthly share price weighted by trading volumes.
The theoretical number of shares that may be purchased at
the market value is deducted from the total number of shares
resulting from the exercise of rights. This number is then
added to the average number of shares in circulation and
hence constitutes the denominator.
The ORNANE being accounted as a debt at fair value, the
impact of the variation of their fair value is restated from the
net result when taking into account the dilutive impact.
2.1.14. Current and non-current assets and liabilities
In accordance with IAS 1 “Presentation of Financial
Statements”, assets and liabilities other than consolidated
shareholders’ equity are classifi ed in the statement of
fi nancial position as “current” when they are due or payable
within twelve months of the accounting date.

CONSOLIDATED FINANCIAL STATEMENTS
CORPORATE SUSTAINABILITY
BUSINESS REVIEW AND 2012 RESULTS
PORTFOLIO
UNIBAIL-RODAMCO - FINANCIAL REPORT 2012 128 • 129
2.2. Business segment report
Consolidated income statement by segment
(€Mn)
2012 2011
Recurring activities
Non-recurring activities(3) Result
Recurring activities
Non-recurring activities(3) Result
Sh
op
pin
g c
en
tre
s
Fra
nce
Gross rental income(1) 599.4 – 599.4 552.6 – 552.6
Operating expenses & net service charges(1) (62.7) – (62.7) (53.2) – (53.2)
Net rental income 536.7 – 536.7 499.3 – 499.3
Gains/losses on sales of properties – 6.7 6.7 – 8.4 8.4
Valuation movements – 765.6 765.6 – 352.9 352.9
Result Shopping centres France 536.7 772.3 1,309.0 499.3 361.3 860.7
Sp
ain
Gross rental income 155.7 – 155.7 139.8 – 139.8
Operating expenses & net service charges (15.0) – (15.0) (11.1) – (11.1)
Net rental income 140.7 – 140.7 128.7 – 128.7
Valuation movements – (77.4) (77.4) – 60.7 60.7
Impairment of Goodwill – (2.0) (2.0) – – –
Result Shopping centres Spain 140.7 (79.3) 61.4 128.7 60.7 189.4
Ce
ntr
al
Eu
rop
e
Gross rental income 113.4 – 113.4 105.5 – 105.5
Operating expenses & net service charges (5.2) – (5.2) (4.2) – (4.2)
Net rental income 108.2 – 108.2 101.3 – 101.3
Contribution of affi liates 18.1 64.6 82.7 – – –
Gains/losses on sales of properties – – – – 5.4 5.4
Valuation movements – 261.7 261.7 – 202.6 202.6
Result Shopping centres Central Europe 126.3 326.3 452.6 101.3 208.0 309.3
Au
stri
a
Gross rental income 106.5 – 106.5 94.2 – 94.2
Operating expenses & net service charges (4.6) – (4.6) (4.6) – (4.6)
Net rental income 101.9 – 101.9 89.6 – 89.6
Gains/losses on sales of properties – – – – 3.0 3.0
Valuation movements – 128.1 128.1 – 71.4 71.4
Result Shopping centres Austria 101.9 128.1 230.1 89.6 74.3 163.9
No
rdic
co
un
trie
s
Gross rental income 107.5 – 107.5 113.9 – 113.9
Operating expenses & net service charges (19.7) – (19.7) (23.7) – (23.7)
Net rental income 87.8 – 87.8 90.2 – 90.2
Gains/losses on sales of properties – 11.4 11.4 – 30.9 30.9
Valuation movements – 164.7 164.7 – 69.6 69.6
Result Shopping centres Nordic countries 87.8 176.1 263.8 90.2 100.6 190.8
Th
e N
eth
erl
an
ds
Gross rental income 76.9 – 76.9 83.0 – 83.0
Operating expenses & net service charges (7.7) – (7.7) (8.0) – (8.0)
Net rental income 69.2 – 69.2 75.0 – 75.0
Gains/losses on sales of properties – 0.8 0.8 – 17.3 17.3
Valuation movements – 41.3 41.3 – 19.5 19.5
Result Shopping centres The Netherlands 69.2 42.1 111.3 75.0 36.8 111.8
Total result Shopping centres 1,062.5 1,365.6 2,428.1 984.1 841.8 1,825.8
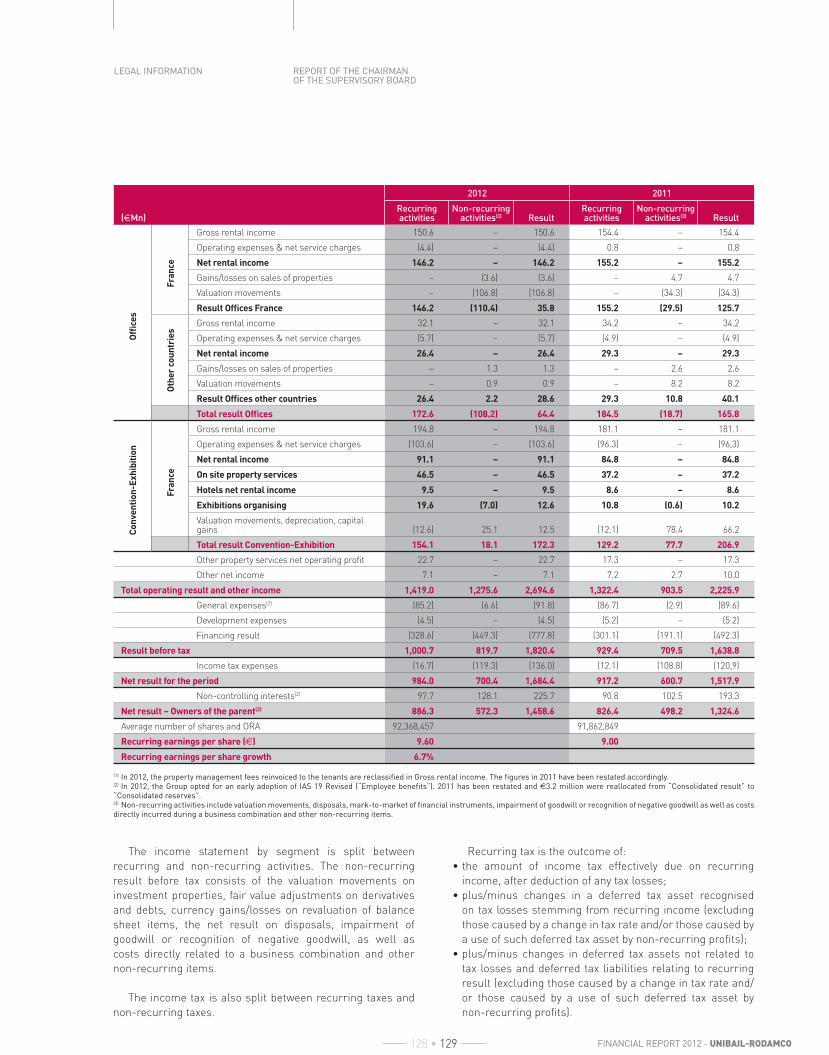
REPORT OF THE CHAIRMAN OF THE SUPERVISORY BOARD
LEGAL INFORMATION
FINANCIAL REPORT 2012 - UNIBAIL-RODAMCO 128 • 129
(€Mn)
2012 2011
Recurring activities
Non-recurring activities(3) Result
Recurring activities
Non-recurring activities(3) Result
Offi
ce
s
Fra
nce
Gross rental income 150.6 – 150.6 154.4 – 154.4
Operating expenses & net service charges (4.4) – (4.4) 0.8 – 0.8
Net rental income 146.2 – 146.2 155.2 – 155.2
Gains/losses on sales of properties – (3.6) (3.6) – 4.7 4.7
Valuation movements – (106.8) (106.8) – (34.3) (34.3)
Result Offi ces France 146.2 (110.4) 35.8 155.2 (29.5) 125.7
Oth
er
cou
ntr
ies
Gross rental income 32.1 – 32.1 34.2 – 34.2
Operating expenses & net service charges (5.7) – (5.7) (4.9) – (4.9)
Net rental income 26.4 – 26.4 29.3 – 29.3
Gains/losses on sales of properties – 1.3 1.3 – 2.6 2.6
Valuation movements – 0.9 0.9 – 8.2 8.2
Result Offi ces other countries 26.4 2.2 28.6 29.3 10.8 40.1
Total result Offi ces 172.6 (108.2) 64.4 184.5 (18.7) 165.8
Co
nve
nti
on
-Ex
hib
itio
n
Fra
nce
Gross rental income 194.8 – 194.8 181.1 – 181.1
Operating expenses & net service charges (103.6) – (103.6) (96.3) – (96,3)
Net rental income 91.1 – 91.1 84.8 – 84.8
On site property services 46.5 – 46.5 37.2 – 37.2
Hotels net rental income 9.5 – 9.5 8.6 – 8.6
Exhibitions organising 19.6 (7.0) 12.6 10.8 (0.6) 10.2
Valuation movements, depreciation, capital gains (12.6) 25.1 12.5 (12.1) 78.4 66.2
Total result Convention-Exhibition 154.1 18.1 172.3 129.2 77.7 206.9
Other property services net operating profi t 22.7 – 22.7 17.3 – 17.3
Other net income 7.1 – 7.1 7.2 2.7 10.0
Total operating result and other income 1,419.0 1,275.6 2,694.6 1,322.4 903.5 2,225.9
General expenses(2) (85.2) (6.6) (91.8) (86.7) (2.9) (89.6)
Development expenses (4.5) – (4.5) (5.2) – (5.2)
Financing result (328.6) (449.3) (777.8) (301.1) (191.1) (492.3)
Result before tax 1,000.7 819.7 1,820.4 929.4 709.5 1,638.8
Income tax expenses (16.7) (119.3) (136.0) (12.1) (108.8) (120,9)
Net result for the period 984.0 700.4 1,684.4 917.2 600.7 1,517.9
Non-controlling interests(2) 97.7 128.1 225.7 90.8 102.5 193.3
Net result – Owners of the parent(2) 886.3 572.3 1,458.6 826.4 498.2 1,324.6
Average number of shares and ORA 92,368,457 91,862,849
Recurring earnings per share (€) 9.60 9.00
Recurring earnings per share growth 6.7%
(1) In 2012, the property management fees reinvoiced to the tenants are reclassifi ed in Gross rental income. The fi gures in 2011 have been restated accordingly.(2) In 2012, the Group opted for an early adoption of IAS 19 Revised (“Employee benefi ts”). 2011 has been restated and €3.2 million were reallocated from “Consolidated result” to “Consolidated reserves”.(3) Non-recurring activities include valuation movements, disposals, mark-to-market of fi nancial instruments, impairment of goodwill or recognition of negative goodwill as well as costs directly incurred during a business combination and other non-recurring items.
The income statement by segment is split between
recurring and non-recurring activities. The non-recurring
result before tax consists of the valuation movements on
investment properties, fair value adjustments on derivatives
and debts, currency gains/losses on revaluation of balance
sheet items, the net result on disposals, impairment of
goodwill or recognition of negative goodwill, as well as
costs directly related to a business combination and other
non-recurring items.
The income tax is also split between recurring taxes and
non-recurring taxes.
Recurring tax is the outcome of:
• the amount of income tax effectively due on recurring
income, after deduction of any tax losses;
• plus/minus changes in a deferred tax asset recognised
on tax losses stemming from recurring income (excluding
those caused by a change in tax rate and/or those caused by
a use of such deferred tax asset by non-recurring profi ts);
• plus/minus changes in deferred tax assets not related to
tax losses and deferred tax liabilities relating to recurring
result (excluding those caused by a change in tax rate and/
or those caused by a use of such deferred tax asset by
non-recurring profi ts).

CONSOLIDATED FINANCIAL STATEMENTS
CORPORATE SUSTAINABILITY
BUSINESS REVIEW AND 2012 RESULTS
PORTFOLIO
UNIBAIL-RODAMCO - FINANCIAL REPORT 2012 130 • 131
Reconciliation between the Results by segment and the income statement of the period (EPRA format) for 2012
(€Mn)
Shopping centres Offi ces C.E.(1)
Not allocated
Total2012France Spain
Central Europe Austria
Nordic countries
The Netherlands
Total Shopping centres France Others
Total Offi ces France
Gross rental income 599.4 155.7 113.4 106.5 107.5 76.9 1,159.4 150.6 32.1 182.6 206.4 – 1,548.3
Net rental income 536.7 140.7 108.2 101.9 87.8 69.2 1,044.4 146.2 26.4 172.6 100.6 – 1,317.6
Administrative expenses – – – – – – – – – – – (89.7) (89.7)
Acquisition and related costs – – – – – – – – – – – (6.6) (6.6)
Revenues from other activities – – – – – – – – – – 121.2 55.9 177.1
Net other income – – – – – – – – – – 33.9 22.7 56.6
Result on disposal of investment properties and shares 6.7 – – – 11.4 0.8 18.9 (3.6) 1.3 (2.3) – – 16.6
Valuation movements 765.6 (77.4) 261.7 128.1 164.7 41.3 1,284.0 (106.8) 0.9 (105.9) 25.1 – 1,203.2
Impairment of goodwill – (2.0) – – – – (2.0) – – – – – (2.0)
Net operating result before fi nancing cost 1,309.0 61.4 369.9 230.1 263.8 111.3 2,345.4 35.8 28.6 64.4 159.7 (73.6) 2,495.8
Share of the result of associates & income on fi nancial assets – – 82.7 – – – 82.7 – – – 12.6 – 95.3
Result from non-consolidated companies 7.1 7.1
Net fi nancing costs (328.6) (328.6)
Fair value adjustment of net share settled bonds convertible into new and/or existing shares (ORNANE) (230.4) (230.4)
Fair value adjustment of derivatives and debt & debt discounting (218.8) (218.8)
Result before tax – 1,820.4
Income tax expenses (136.0) (136.0)
Net result for the period 1,684.4
(1) Convention-Exhibition segment.

REPORT OF THE CHAIRMAN OF THE SUPERVISORY BOARD
LEGAL INFORMATION
FINANCIAL REPORT 2012 - UNIBAIL-RODAMCO 130 • 131
Reconciliation between the Results by segment and the income statement of the period (EPRA format) for 2011
(€Mn)
Shopping centres Offi ces C.E.(1)
Not allocated
TOTAL 2011France Spain
Central Europe Austria
Nordic countries
The Netherlands
Total Shopping centres France Others
Total Offi ces France
Gross rental income(2) 552.6 139.7 105.5 94.2 113.9 83.0 1,089.0 154.4 34.2 188.6 190.5 – 1,468.1
Net rental income 499.3 128.7 101.3 89.6 90.2 75.0 984.1 155.2 29.3 184.5 93.4 – 1,262.0
Administrative expenses(3) – – – – – – – – – – – (91.9) (91.9)
Acquisition and related costs – – – – – – – – – – – (2.9) (2.9)
Revenues from other activities – – – – – – – – – – 109.4 56.4 165.8
Net other income – – – – – – – – – – 25.1 17.3 42.4
Result on disposal of investment properties and shares 8.4 – 5.4 3.0 30.9 17.3 65.0 4.7 2.6 7.3 – – 72.2
Valuation movements 352.9 60.7 202.6 71.4 69.6 19.5 776.8 (34.3) 8.2 (26.0) 78.4 – 829.2
Net operating result before fi nancing cost 860.7 189.4 309.3 163.9 190.8 111.8 1,825.8 125.7 40.1 165.8 196.8 (77.5) 2,111.0
Share of the result of associates & income on fi nancial assets – – – – – – – – – – 10.2 – 10.2
Result from non consolidated companies – – – – – – – – – – – 9.9 9.9
Net fi nancing costs (301.1) (301.1)
Fair value adjustment of net share settled bonds convertible into new and/or existing shares (ORNANE) 43.4 43.4
Fair value adjustment of derivatives and debt & debt discounting (234.5) (234.5)
Result before tax – 1,638.8
Income tax expenses (120.9) (120.9)
Net result for the period 1,517.9
(1) Convention-Exhibition segment.(2) In 2012, the property management fees reinvoiced to the tenants are reclassifi ed in Gross rental income. The fi gures in 2011 have been restated accordingly.(3) In 2012, the Group opted for an early adoption of IAS 19 Revised (“Employee benefi ts”). 2011 has been restated and €3.2 million were reallocated from “Consolidated result” to “Consolidated reserves”.

CONSOLIDATED FINANCIAL STATEMENTS
CORPORATE SUSTAINABILITY
BUSINESS REVIEW AND 2012 RESULTS
PORTFOLIO
UNIBAIL-RODAMCO - FINANCIAL REPORT 2012 132 • 133
December 31, 2012
Statement of fi nancial position by segment
(€Mn)
Shopping centres Offi ces C.E.(1)
Not allocated(2) 31/12/2012France Spain
Central Europe Austria
Nordic countries
The Netherlands
Total Shopping centres France Others
Total Offi ces France
Investment properties at fair value 11,321.3 2,341.5 2,150.9 1,953.3 2,103.2 1,307.1 21,177.3 2,629.1 391.2 3,020.3 1,715.1 – 25,912.8
Investment properties at cost 54.1 75.9 32.5 – 182.9 – 345.4 399.3 – 399.3 0.9 – 745.6
Other tangible assets – – – – – – – 149.0 – 149.0 41.1 10.3 200.4
Goodwill 7.5 – 89.1 95.9 51.8 – 244.2 – – – 14.9 10.3 269.4
Intangible assets – – – – – – – – – – 203.4 2.7 206.1
Shares and investments in companies consolidated under the equity method – – 774.3 – – – 774.3 – – – 179.1 – 953.5
Other non current assets 81.4 2.2 85.1 – – 1.3 170.0 118.1 – 118.1 – 221.7 509.8
Total non current assets 11,464.4 2,419.5 3,131.9 2,049.1 2,337.9 1,308.4 22,711.2 3,295.5 391.2 3,686.8 2,154.5 245.0 28,797.5
Total current assets 292.8 81.5 7.7 14.9 8.7 9.3 414.9 95.8 4.0 99.8 111.4 147.5 773.6
Total Assets 11,757.1 2,501.0 3,139.6 2,064.0 2,346.6 1,317.7 23,126.1 3,391.4 395.2 3,786.6 2,266.0 392.5 29,571.1
Total Liabilities excluding shareholders’ equity 638.7 214.4 236.7 321.2 221.1 25.1 1,657.2 86.4 11.4 97.8 299.6 13,030.9 15,085.5
(1) Convention-Exhibition segment, including hotels.(2) Refers to structure properties, furniture and equipments items.
Investments by segment
(€Mn)
Shopping centres Offi ces C.E.(1)
Not allocated 31/12/2012France Spain
Central Europe Austria
Nordic countries
The Netherlands
Total Shopping centres France Others
Total Offi ces France
Investments in investment properties at fair value 949.7 150.3 91.5 79.9 142.4 51.8 1,465.5 42.6 10.6 53.2 38.4 – 1,557.1
Investments in tangible assets at cost(2) 65.2 2.8 26.2 – 88.7 – 182.9 121.4 0.3 121.8 0.2 12.1 317.0
Total investments 1,014.9 153.0 117.6 79.9 231.1 51.8 1,648.4 164.0 10.9 174.9 38.7 12.1 1,874.0
(1) Convention-Exhibition segment.(2) Before transfer between category of investment property.

REPORT OF THE CHAIRMAN OF THE SUPERVISORY BOARD
LEGAL INFORMATION
FINANCIAL REPORT 2012 - UNIBAIL-RODAMCO 132 • 133
December 31, 2011
Statement of fi nancial position by segment
(€Mn)
Shopping centres Offi ces C.E.(1)
Not allocated(2) 31/12/2011France Spain
Central Europe Austria
Nordic countries
The Netherlands
Total Shopping centres France Others
Total Offi ces France
Investment properties at fair value 9,966.5 2,265.2 1,738.1 1,745.3 1,727.3 1,155.6 18,598.0 2,824.0 343.7 3,167.6 1,653.4 – 23,419.1
Investment properties at cost 176.0 74.0 5.9 – 102.9 – 358.9 277.3 – 277.3 0.7 – 636.8
Properties under promise or mandate of sale 34.3 – 59.6 – 26.4 69.9 190.3 – 31.2 31.2 – – 221.5
Other tangible assets – – – – – – – 147.7 – 147.7 39.9 10.8 198.4
Goodwill 35.7 1.2 86.8 96.0 51.9 – 271.6 – – – 14.9 10.3 296.7
Intangible assets – – – – – – – – – – 207.8 3.5 211.3
Shares and investments in companies consolidated under the equity method – 1.2 – – – – 1.2 – – – 205.3 – 206.6
Other non current assets 21.7 10.0 198.0 – – 1.7 231.4 113.0 – 113.0 – 112.8 457.2
Total non current assets 10,234.2 2,351.6 2,088.5 1,841.3 1,908.5 1,227.3 19,651.4 3,361.9 374.9 3,736.8 2,122.0 137.3 25,647.5
Total current assets 257.4 121.6 23.0 8.4 8.5 7.2 426.1 96.2 5.2 101.4 103.5 124.7 755.7
Total Assets 10,491.6 2,473.2 2,111.5 1,849.7 1,917.0 1,234.5 20,077.5 3,458.1 380.1 3,838.2 2,225.6 262.0 26,403.3
Total Liabilities excluding shareholders’ equity 676.1 196.3 166.5 268.4 181.0 25.9 1,514.2 109.1 18.7 127.8 274.8 11,431.0 13,347.8
(1) Convention-Exhibition segment, including hotels.(2) Refers to structure properties, furniture and equipments items.
Investments by segment
(€Mn)
Shopping centres Offi ces C.E.(1)
Not allocated 31/12/2011France Spain
Central Europe Austria
Nordic countries
The Netherlands
Total Shopping centres France Others
Total Offi ces France
Investments in investment properties at fair value 372.6 255.0 261.9 212.2 45.0 14.2 1,160.8 74.4 13.6 88.0 63.8 – 1,312.6
Investments in tangible assets at cost(2) 132.5 61.1 21.7 – 159.0 – 374.2 74.3 6.1 80.4 7.3 6.3 468.2
Total investments 505.1 316.1 283.6 212.2 204.0 14.2 1,535.0 148.7 19.8 168.4 71.1 6.3 1,780.8
(1) Convention-Exhibition segment.(2) Before transfer between category of investment property.

CONSOLIDATED FINANCIAL STATEMENTS
CORPORATE SUSTAINABILITY
BUSINESS REVIEW AND 2012 RESULTS
PORTFOLIO
UNIBAIL-RODAMCO - FINANCIAL REPORT 2012 134 • 135
2.3. Scope of consolidation
List of consolidated companies Country Method(1)% interest31/12/2012
% control31/12/2012
% interest31/12/2011
Unibail-Rodamco SE France FC 100.00 100.00 100.00
Shopping centres
Donauzentrum Besitz- u. Vermietungs GmbH Austria FC 100.00 100.00 90.00
SCS Liegenschaftsverwertung GmbH Austria FC 100.00 100.00 100.00
SCS Motor City Süd Errichtungsges.mbH Austria FC 100.00 100.00 100.00
Shopping Center Planungs- und Entwicklungsgesellschaft mbH Austria FC 100.00 100.00 100.00
Shopping Center Planungs- und Entwicklungsgesellschaft mbH & Co. Werbeberatung KG Austria FC 100.00 100.00 100.00
Shopping City Süd Erweiterungsbau Gesellschaft mbH & Co Anlagenvermietung KG Austria FC 99.99 99.99 99.99
Centrum Cerny Most as Czech Republic FC 100.00 100.00 100.00
Centrum Chodov Czech Republic FC 100.00 100.00 –
Centrum Praha Jih-Chodov sro Czech Republic FC 100.00 100.00 100.00
Pankrac Shopping Center ks Czech Republic PC 75.00 75.00 75.00
Autopaikat Oy Finland PC 34.29 34.29 34.29
Kiinteistö Oy Vantaanportin Liikekeskus Finland PC 21.40 21.40 21.40
Kiinteistö Oy Vantaanportin Liiketilat Finland PC 60.00 60.00 60.00
SA SFLA France – Liquidated Liquidated 100.00
SA Société d’Exploitation des Parkings et du Forum des Halles de Paris France FC 65.00 65.00 65.00
SARL Bay 1 Bay 2 France FC 100.00 100.00 100.00
SARL BEG Investissements France FC 100.00 100.00 100.00
SARL Foncière d’Investissement France FC 100.00 100.00 100.00
SARL Geniekiosk France PC 50.00 50.00 –
SARL Le Cannet Développement France PC 50.00 50.00 50.00
SAS Aquarissimo France FC 100.00 100.00 100.00
SAS La Toison d’Or France FC 100.00 100.00 100.00
SAS Le Carrousel du Louvre France FC 100.00 100.00 100.00
SAS Monpar France FC 100.00 100.00 100.00
SAS Nice Étoile France FC 100.00 100.00 100.00
SAS Parimall-Bobigny 2 France FC 100.00 100.00 100.00
SAS Parimall-Parly 2 France FC 100.00 100.00 100.00
SAS Parimall-Ulis 2 France FC 100.00 100.00 100.00
SAS Parimall-Vélizy 2 France FC 100.00 100.00 100.00
SAS Parimmo-58 Marceau France FC 100.00 100.00 100.00
SAS Parly 2 Avenir France FC 95.08 95.08 78.40
SAS PCE France PC 50.00 50.00 50.00
SAS PCE-FTO France PC 25.00 25.00 25.00
SAS SALG France FC 100.00 100.00 100.00
SAS SFAM France FC 100.00 100.00 100.00
SAS Société de Lancement de Magasins à l’Usine France FC 100.00 100.00 100.00
SAS SP Poissy Retail Entreprises France PC 50.00 50.00 50.00
SAS Spring Alma France FC 100.00 100.00 100.00
SAS Spring Valentine France FC 100.00 100.00 100.00
SAS Spring Vélizy France FC 100.00 100.00 100.00
SAS Uni-commerces France FC 100.00 100.00 100.00
SAS Uniwater France FC 100.00 100.00 100.00
SAS Villeneuve 2 France FC 100.00 100.00 100.00
SCI 3borders France FC 100.00 100.00 100.00
SCI Aéroville France FC 100.00 100.00 100.00
SCI Berri Washington France PC 50.00 50.00 100.00
SCI Bordeaux-Bonnac France FC 100.00 100.00 100.00
SCI Channel City France – Liquidated Liquidated 100.00
SCI Chesnay Pierre 2 France PC 50.00 50.00 –
SCI Chesnay Remiforme France PC 50.00 50.00 –

REPORT OF THE CHAIRMAN OF THE SUPERVISORY BOARD
LEGAL INFORMATION
FINANCIAL REPORT 2012 - UNIBAIL-RODAMCO 134 • 135
List of consolidated companies Country Method(1)% interest31/12/2012
% control31/12/2012
% interest31/12/2011
SCI Coquelles et Coquelles France FC 100.00 100.00 100.00
SCI des Bureaux Rouen Bretagne France FC 100.00 100.00 100.00
SCI du CC de Bordeaux Préfecture France FC 61.00 61.00 61.00
SCI du CC de Lyon La Part-Dieu France FC 100.00 100.00 100.00
SCI du CC de Rouen Saint-Sever France FC 100.00 100.00 100.00
SCI du CC des Pontôts France FC 100.00 100.00 100.00
SCI du Forum des Halles de Paris France FC 65.00 65.00 65.00
SCI du Petit Parly 2 France PC 50.00 50.00 100.00
SCI Eiffel Levallois Commerces France FC 100.00 100.00 100.00
SCI Elysées Parly 2 France PC 50.00 50.00 100.00
SCI Elysées Vélizy 2 France FC 100.00 100.00 100.00
SCI Espace Commerce Europe France PC 50.00 50.00 50.00
SCI Extension Villeneuve 2 France FC 100.00 100.00 100.00
SCI Foncière Marceau Saint-Sever France FC 100.00 100.00 100.00
SCI Grand Magasin Sud LPD France FC 100.00 100.00 100.00
SCI Grigny Gare France FC 100.00 100.00 100.00
SCI Hoche France FC 99.87 99.87 –
SCI Labex France FC 100.00 100.00 100.00
SCI Lyon Kléber France FC 100.00 100.00 100.00
SCI Lyon Les Brotteaux France FC 100.00 100.00 100.00
SCI Marceau Bussy-Sud France FC 100.00 100.00 100.00
SCI Marceau Côté Seine France FC 100.00 100.00 100.00
SCI Marceau Parly 2 France PC 50.00 50.00 100.00
SCI Marceau Plaisir France FC 100.00 100.00 100.00
SCI Parlunic 2 France – Liquidated Liquidated 100.00
SCI Pégase France FC 53.30 53.30 53.30
SCI Rosny Beauséjour France PC 50.00 50.00 50.00
SCI Rouen Verrerie France FC 100.00 100.00 100.00
SCI SCC de La Défense France FC 53.30 53.30 53.30
SCI SCC du Triangle des Gares France FC 76.00 100.00 76.00
SCI Sicor France FC 73.00 73.00 73.00
SCI Sirmione France FC 100.00 100.00 100.00
SCI Vendôme Boissy 2 France FC 100.00 100.00 100.00
SCI Vendôme Villeneuve 2 France FC 100.00 100.00 100.00
SCI Waskim France – Liquidated Liquidated 100.00
SEP Bagnolet France PC 35.22 35.22 35.22
SEP du CC de Rosny 2 France PC 26.00 26.00 26.00
SEP Galerie Villabé France PC 15.00 15.00 15.00
SEP Valorisation CC LPD France PC 62.51 62.51 62.51
SEP Valorisation CC Parly 2 France PC 47.85 48.47 47.85
SEP Valorisation CC Saint-Sever France PC 76.55 76.55 76.55
SEP Valorisation CC Ulis 2 France PC 38.92 38.92 38.92
SEP Valorisation CC Villeneuve 2 France PC 52.57 52.57 52.57
SNC Almacie France FC 100.00 100.00 100.00
SNC CC Francilia France FC 100.00 100.00 100.00
SNC Cegep et Cie France FC 100.00 100.00 100.00
SNC de Bures-Palaiseau France FC 100.00 100.00 100.00
SNC de l’Extension de Rosny France FC 100.00 100.00 100.00
SNC du CC de Labège France FC 100.00 100.00 100.00
SNC Élysées Vauban France FC 100.00 100.00 100.00
SNC Holmy France FC 100.00 100.00 –
SNC Les Docks de Rouen France FC 100.00 100.00 100.00
SNC Les Passages de l’Étoile France FC 100.00 100.00 100.00
SNC Maltèse France FC 100.00 100.00 100.00

CONSOLIDATED FINANCIAL STATEMENTS
CORPORATE SUSTAINABILITY
BUSINESS REVIEW AND 2012 RESULTS
PORTFOLIO
UNIBAIL-RODAMCO - FINANCIAL REPORT 2012 136 • 137
List of consolidated companies Country Method(1)% interest31/12/2012
% control31/12/2012
% interest31/12/2011
SNC Randoli France FC 100.00 100.00 100.00
SNC Vélizy Petit-Clamart France FC 100.00 100.00 100.00
SNC Vilplaine France FC 80.00 80.00 –
SNC VUC France FC 100.00 100.00 100.00
KG Schliebe & Co Geschäftszentrum Frankfurter Allee Germany PC 66.67 66.67 66.67
mfi AG (subgroup) Germany EM 46.49 46.49 –
Euromall Kft Hungary FC 100.00 100.00 100.00
Red Grafton 1(2) Luxembourg EM 50.00 50.00 –
Red Grafton 2(2) Luxembourg EM 50.00 50.00 –
Arkadia Centrum Handlowe Sp. z.o.o. Poland FC 100.00 100.00 100.00
Rodamco CH1 Sp zoo Poland FC 100.00 100.00 100.00
Wilenska Centrum Handlowe Sp. z.o.o. Poland FC 100.00 100.00 100.00
Zlote Tarasy Sp Zoo Poland EM 76.85 – –
Aupark as Slovakia FC 100.00 100.00 100.00
Aupark Bratislava Slovakia FC 100.00 100.00 100.00
D-Parking Spain PC 42.50 42.50 42.50
Essential Whites SLU Spain FC 52.78 100.00 52.78
Glorias Parking Spain PC 50.00 50.00 50.00
Promociones Immobiliarias Gardiner SLU Spain FC 52.78 100.00 52.78
Proyectos Immobiliarios New Visions SLU Spain FC 100.00 100.00 100.00
Proyectos Immobiliarios Time Blue SLU Spain FC 51.11 100.00 51.11
Unibail-Rodamco Benidorm SL Spain PC 50.00 50.00 50.00
Unibail-Rodamco Inversiones SLU Spain FC 100.00 100.00 100.00
Unibail-Rodamco Ocio SLU Spain FC 100.00 100.00 100.00
Unibail-Rodamco Proyecto Badajoz SLU Spain FC 100.00 100.00 100.00
Unibail-Rodamco Steam SLU Spain FC 51.11 100.00 51.11
Eurostop KB Sweden FC 100.00 100.00 100.00
Rodamco Arninge Centrum KB Sweden FC 100.00 100.00 100.00
Rodamco Centerpool AB Sweden FC 100.00 100.00 100.00
Rodamco Fisketorvet AB Sweden FC 100.00 100.00 100.00
Rodamco Forum Nacka KB Sweden FC 100.00 100.00 100.00
Rodamco Garage AB Sweden FC 100.00 100.00 100.00
Rodamco Nova Lund KB Sweden FC 100.00 100.00 100.00
Rodamco Nova Lund 2 AB Sweden FC 100.00 100.00 100.00
Rodamco Nova Lund 3 AB Sweden FC 100.00 100.00 100.00
Rodamco Parkering AB Sweden FC 100.00 100.00 100.00
Rodamco Solna Centrum AB Sweden FC 100.00 100.00 100.00
Rodamco Täby Centrum KB Sweden FC 100.00 100.00 100.00
Rodamco Väsby Centrum AB Sweden FC 100.00 100.00 100.00
Oranjevast/Amvest CV The Netherlands EM 10.00 10.00 10.00
Unibail-Rodamco Nederland Winkels BV The Netherlands FC 100.00 100.00 100.00
Offi ces
SA Rodamco France France FC 100.00 100.00 100.00
SAS Aquabon France FC 100.00 100.00 100.00
SAS Immobilière Louvre France FC 100.00 100.00 100.00
SAS Iseult France FC 100.00 100.00 100.00
SAS Unibail Investissements II France FC 100.00 100.00 100.00
SCI Ariane-Défense France FC 100.00 100.00 100.00
SCI Bureaux Tour Crédit Lyonnais France FC 100.00 100.00 100.00
SCI Cnit Développement France FC 100.00 100.00 100.00
SCI Eiffel Levallois Bureaux France FC 100.00 100.00 100.00
SCI Gaîté Bureaux France FC 100.00 100.00 100.00
SCI Galilée-Défense France FC 100.00 100.00 100.00
SCI Le Sextant France FC 100.00 100.00 100.00
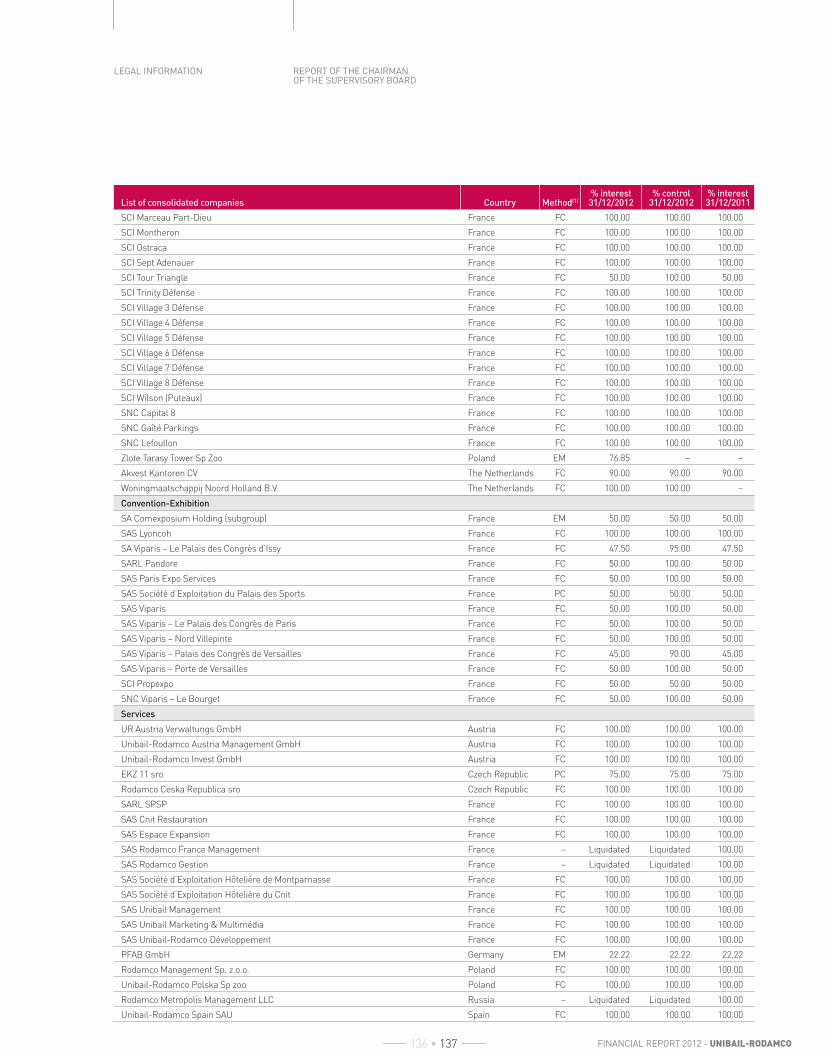
REPORT OF THE CHAIRMAN OF THE SUPERVISORY BOARD
LEGAL INFORMATION
FINANCIAL REPORT 2012 - UNIBAIL-RODAMCO 136 • 137
List of consolidated companies Country Method(1)% interest31/12/2012
% control31/12/2012
% interest31/12/2011
SCI Marceau Part-Dieu France FC 100.00 100.00 100.00
SCI Montheron France FC 100.00 100.00 100.00
SCI Ostraca France FC 100.00 100.00 100.00
SCI Sept Adenauer France FC 100.00 100.00 100.00
SCI Tour Triangle France FC 50.00 100.00 50.00
SCI Trinity Défense France FC 100.00 100.00 100.00
SCI Village 3 Défense France FC 100.00 100.00 100.00
SCI Village 4 Défense France FC 100.00 100.00 100.00
SCI Village 5 Défense France FC 100.00 100.00 100.00
SCI Village 6 Défense France FC 100.00 100.00 100.00
SCI Village 7 Défense France FC 100.00 100.00 100.00
SCI Village 8 Défense France FC 100.00 100.00 100.00
SCI Wilson (Puteaux) France FC 100.00 100.00 100.00
SNC Capital 8 France FC 100.00 100.00 100.00
SNC Gaîté Parkings France FC 100.00 100.00 100.00
SNC Lefoullon France FC 100.00 100.00 100.00
Zlote Tarasy Tower Sp Zoo Poland EM 76.85 – –
Akvest Kantoren CV The Netherlands FC 90.00 90.00 90.00
Woningmaatschappij Noord Holland B.V. The Netherlands FC 100.00 100.00 –
Convention-Exhibition
SA Comexposium Holding (subgroup) France EM 50.00 50.00 50.00
SAS Lyoncoh France FC 100.00 100.00 100.00
SA Viparis – Le Palais des Congrès d’Issy France FC 47.50 95.00 47.50
SARL Pandore France FC 50.00 100.00 50.00
SAS Paris Expo Services France FC 50.00 100.00 50.00
SAS Société d’Exploitation du Palais des Sports France PC 50.00 50.00 50.00
SAS Viparis France FC 50.00 100.00 50.00
SAS Viparis – Le Palais des Congrès de Paris France FC 50.00 100.00 50.00
SAS Viparis – Nord Villepinte France FC 50.00 100.00 50.00
SAS Viparis – Palais des Congrès de Versailles France FC 45.00 90.00 45.00
SAS Viparis – Porte de Versailles France FC 50.00 100.00 50.00
SCI Propexpo France FC 50.00 50.00 50.00
SNC Viparis – Le Bourget France FC 50.00 100.00 50.00
Services
UR Austria Verwaltungs GmbH Austria FC 100.00 100.00 100.00
Unibail-Rodamco Austria Management GmbH Austria FC 100.00 100.00 100.00
Unibail-Rodamco Invest GmbH Austria FC 100.00 100.00 100.00
EKZ 11 sro Czech Republic PC 75.00 75.00 75.00
Rodamco Ceska Republica sro Czech Republic FC 100.00 100.00 100.00
SARL SPSP France FC 100.00 100.00 100.00
SAS Cnit Restauration France FC 100.00 100.00 100.00
SAS Espace Expansion France FC 100.00 100.00 100.00
SAS Rodamco France Management France – Liquidated Liquidated 100.00
SAS Rodamco Gestion France – Liquidated Liquidated 100.00
SAS Société d’Exploitation Hôtelière de Montparnasse France FC 100.00 100.00 100.00
SAS Société d’Exploitation Hôtelière du Cnit France FC 100.00 100.00 100.00
SAS Unibail Management France FC 100.00 100.00 100.00
SAS Unibail Marketing & Multimédia France FC 100.00 100.00 100.00
SAS Unibail-Rodamco Développement France FC 100.00 100.00 100.00
PFAB GmbH Germany EM 22.22 22.22 22.22
Rodamco Management Sp. z.o.o. Poland FC 100.00 100.00 100.00
Unibail-Rodamco Polska Sp zoo Poland FC 100.00 100.00 100.00
Rodamco Metropolis Management LLC Russia – Liquidated Liquidated 100.00
Unibail-Rodamco Spain SAU Spain FC 100.00 100.00 100.00

CONSOLIDATED FINANCIAL STATEMENTS
CORPORATE SUSTAINABILITY
BUSINESS REVIEW AND 2012 RESULTS
PORTFOLIO
UNIBAIL-RODAMCO - FINANCIAL REPORT 2012 138 • 139
List of consolidated companies Country Method(1)% interest31/12/2012
% control31/12/2012
% interest31/12/2011
Rodamco Management AB Sweden FC 100.00 100.00 100.00
Rodamco Projekt AB Sweden FC 100.00 100.00 100.00
Rodamco Sverige AB Sweden FC 100.00 100.00 100.00
Rodamco Europe Beheer BV The Netherlands FC 100.00 100.00 100.00
Rodamco Nederland BV The Netherlands FC 100.00 100.00 100.00
Unibail-Rodamco Development Nederland BV The Netherlands FC 100.00 100.00 100.00
U&R Management BV The Netherlands FC 100.00 100.00 100.00
Holdings and other
Unibail-Rodamco Liegenschaftserwerbs GmbH Austria FC 100.00 100.00 100.00
Unibail-Rodamco Belgium N.V. Belgium FC 100.00 100.00 –
Moravska Obchodni as Czech Republic FC 65.00 65.00 65.00
Rodamco Pankrac as Czech Republic FC 100.00 100.00 100.00
Rodareal Oy Finland FC 100.00 100.00 100.00
SA Société de Tayninh France FC 97.68 97.68 97.68
SA Uni-Expos France FC 100.00 100.00 100.00
SA Union Internationale Immobilière France FC 100.00 100.00 100.00
SA Viparis Holding France FC 50.00 50.00 50.00
SAS Espace Expansion Immobilière France FC 100.00 100.00 100.00
SAS Foncière Immobilière France FC 100.00 100.00 100.00
SARL Groupe BEG France – Liquidated Liquidated 100.00
SAS Unibail-Rodamco SIF France France FC 100.00 100.00 100.00
SAS Defunic France FC 100.00 100.00 –
SAS Doria France FC 100.00 100.00 100.00
SAS Frankvink Investissements France FC 100.00 100.00 100.00
SAS R.E. France Financing France FC 100.00 100.00 100.00
SAS Unibail-Rodamco Participations France FC 100.00 100.00 100.00
SAS Valorexpo France FC 100.00 100.00 100.00
SCI du CC d’Euralille S3C Lille France FC 60.00 60.00 60.00
SCI Tayak France FC 100.00 100.00 100.00
SNC Financière 5 Malesherbes France FC 100.00 100.00 100.00
SNC Financière Loutan France FC 100.00 100.00 –
Poland Finco France FC 100.00 100.00 –
Rodamco Deutschland GmbH Germany FC 100.00 100.00 100.00
Rodamco Deutschland GmbH & Co Süd Liegenschafts KG Germany FC 100.00 100.00 100.00
Zeilgalerie Gbr Germany FC 100.00 100.00 100.00
Liffey River Financing Ltd. Ireland FC 100.00 100.00 100.00
SA Crossroads Property Investors Luxembourg FC 100.00 100.00 100.00
Purple Grafton Luxembourg EM 51.00 51.00 –
Red Grafton Luxembourg EM 50.00 50.00 –
Uniborc SA Luxembourg FC 90.00 90.00 90.00
UR Lab Luxembourg FC 100.00 100.00 –
ZT Poland 2 SCA Luxembourg EM 100.00 – 100.00
Crystal Warsaw Sp. zoo Poland FC 100.00 100.00 100.00
GSSM Sp. z.o.o. Poland FC 100.00 100.00 100.00
GSSM Warsaw Sp. z.o.o. Poland FC 100.00 100.00 100.00
Lodz Nord Shopping Mall Sp. z.o.o. Poland – Liquidated Liquidated 100.00
Polska Shopping Mall Sp. z.o.o. Poland – Liquidated Liquidated 100.00
Wood Sp. zoo Poland FC 100.00 100.00 –
WSSM Sp. z.o.o. Poland FC 100.00 100.00 100.00
WSSM Warsaw Sp. z.o.o. Poland FC 100.00 100.00 100.00
Aupark Property Holding as Slovakia FC 100.00 100.00 –
Arrendamientos Vaguada CB Spain PC 62.47 62.47 62.47
Anlos Fastighets AB Sweden FC 100.00 100.00 100.00
Eurostop AB Sweden FC 100.00 100.00 100.00
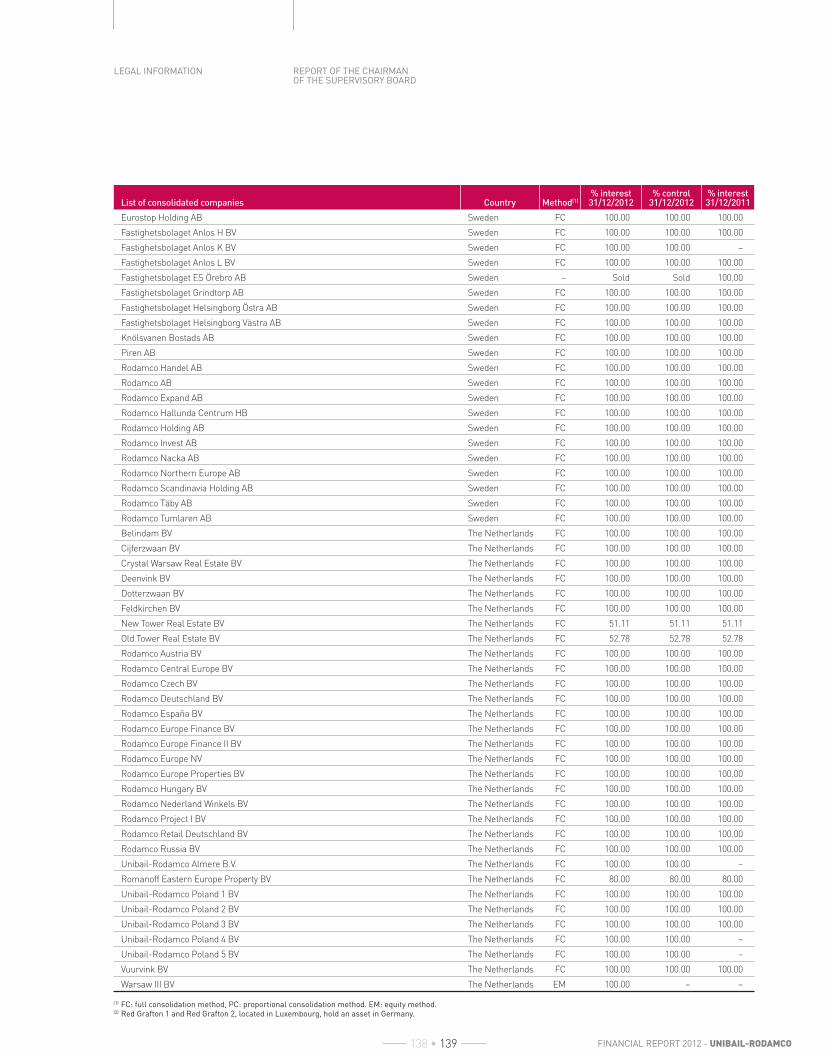
REPORT OF THE CHAIRMAN OF THE SUPERVISORY BOARD
LEGAL INFORMATION
FINANCIAL REPORT 2012 - UNIBAIL-RODAMCO 138 • 139
List of consolidated companies Country Method(1)% interest31/12/2012
% control31/12/2012
% interest31/12/2011
Eurostop Holding AB Sweden FC 100.00 100.00 100.00
Fastighetsbolaget Anlos H BV Sweden FC 100.00 100.00 100.00
Fastighetsbolaget Anlos K BV Sweden FC 100.00 100.00 –
Fastighetsbolaget Anlos L BV Sweden FC 100.00 100.00 100.00
Fastighetsbolaget ES Örebro AB Sweden – Sold Sold 100.00
Fastighetsbolaget Grindtorp AB Sweden FC 100.00 100.00 100.00
Fastighetsbolaget Helsingborg Östra AB Sweden FC 100.00 100.00 100.00
Fastighetsbolaget Helsingborg Västra AB Sweden FC 100.00 100.00 100.00
Knölsvanen Bostads AB Sweden FC 100.00 100.00 100.00
Piren AB Sweden FC 100.00 100.00 100.00
Rodamco Handel AB Sweden FC 100.00 100.00 100.00
Rodamco AB Sweden FC 100.00 100.00 100.00
Rodamco Expand AB Sweden FC 100.00 100.00 100.00
Rodamco Hallunda Centrum HB Sweden FC 100.00 100.00 100.00
Rodamco Holding AB Sweden FC 100.00 100.00 100.00
Rodamco Invest AB Sweden FC 100.00 100.00 100.00
Rodamco Nacka AB Sweden FC 100.00 100.00 100.00
Rodamco Northern Europe AB Sweden FC 100.00 100.00 100.00
Rodamco Scandinavia Holding AB Sweden FC 100.00 100.00 100.00
Rodamco Täby AB Sweden FC 100.00 100.00 100.00
Rodamco Tumlaren AB Sweden FC 100.00 100.00 100.00
Belindam BV The Netherlands FC 100.00 100.00 100.00
Cijferzwaan BV The Netherlands FC 100.00 100.00 100.00
Crystal Warsaw Real Estate BV The Netherlands FC 100.00 100.00 100.00
Deenvink BV The Netherlands FC 100.00 100.00 100.00
Dotterzwaan BV The Netherlands FC 100.00 100.00 100.00
Feldkirchen BV The Netherlands FC 100.00 100.00 100.00
New Tower Real Estate BV The Netherlands FC 51.11 51.11 51.11
Old Tower Real Estate BV The Netherlands FC 52.78 52.78 52.78
Rodamco Austria BV The Netherlands FC 100.00 100.00 100.00
Rodamco Central Europe BV The Netherlands FC 100.00 100.00 100.00
Rodamco Czech BV The Netherlands FC 100.00 100.00 100.00
Rodamco Deutschland BV The Netherlands FC 100.00 100.00 100.00
Rodamco España BV The Netherlands FC 100.00 100.00 100.00
Rodamco Europe Finance BV The Netherlands FC 100.00 100.00 100.00
Rodamco Europe Finance II BV The Netherlands FC 100.00 100.00 100.00
Rodamco Europe NV The Netherlands FC 100.00 100.00 100.00
Rodamco Europe Properties BV The Netherlands FC 100.00 100.00 100.00
Rodamco Hungary BV The Netherlands FC 100.00 100.00 100.00
Rodamco Nederland Winkels BV The Netherlands FC 100.00 100.00 100.00
Rodamco Project I BV The Netherlands FC 100.00 100.00 100.00
Rodamco Retail Deutschland BV The Netherlands FC 100.00 100.00 100.00
Rodamco Russia BV The Netherlands FC 100.00 100.00 100.00
Unibail-Rodamco Almere B.V. The Netherlands FC 100.00 100.00 –
Romanoff Eastern Europe Property BV The Netherlands FC 80.00 80.00 80.00
Unibail-Rodamco Poland 1 BV The Netherlands FC 100.00 100.00 100.00
Unibail-Rodamco Poland 2 BV The Netherlands FC 100.00 100.00 100.00
Unibail-Rodamco Poland 3 BV The Netherlands FC 100.00 100.00 100.00
Unibail-Rodamco Poland 4 BV The Netherlands FC 100.00 100.00 –
Unibail-Rodamco Poland 5 BV The Netherlands FC 100.00 100.00 –
Vuurvink BV The Netherlands FC 100.00 100.00 100.00
Warsaw III BV The Netherlands EM 100.00 – –
(1) FC: full consolidation method, PC: proportional consolidation method. EM: equity method.(2) Red Grafton 1 and Red Grafton 2, located in Luxembourg, hold an asset in Germany.

CONSOLIDATED FINANCIAL STATEMENTS
CORPORATE SUSTAINABILITY
BUSINESS REVIEW AND 2012 RESULTS
PORTFOLIO
UNIBAIL-RODAMCO - FINANCIAL REPORT 2012 140 • 141
2.4. Highlights and comparability of the last two years
2.4.1. In 2011
Disposals
Shopping centres
Divestment of non core assets has been actively pursued
in 2011. Asset deals amounted to €673.1 million net disposal
price and gave a net result of €35.4 million based on the
valuations as at December 31, 2010. Share deals amounted
to €291.7 million net disposal price and gave a net positive
result of €29.6 million.
The underlying assets values were as follows:
• €310.2 million in France: Bonneveine in Marseille, Shopping
Etrembières in Annemasse (50%) and participations in
Saint Genis 2 near Lyon, Évry 2 in Paris region, Boisseuil in
Limoges and Croix Dampierre in Châlons-en-Champagne.
Most of these disposals took place during the fi rst half of
the year;
• €325.8 million in Sweden: Haninge Centrum, Väsby
Centrum, Tyresö – Stockholm, Balsta – Stockholm,
Helsingborg and Eurostop – Jönköping;
• €245.9 million in The Netherlands: Buitenmere – Almere,
Houtmarktpassage – Breda, Walburg – Zwijndrecht, Oude
Marktpassage – Stadskanaal, Woonmall – Rotterdam and
Piazza Centre – Eindhoven;
• €202.2 million for the Group’s share in the Arkad centre
in Budapest, the 50% participation in Allee – Center in
Magdeburg, Germany and the Group’s 50% stake in Südpark
Klagenfurt, Austria.
Offi ces
During 2011, the Group sold six offi ce buildings in Sweden,
two in The Netherlands and one in France. One French
disposal and one of the Swedish disposals in part took the
form of a share deal. For the assets sold directly, the total
net disposal price amounted to €99.6 million and gave a net
positive result of €0.8 million based on the valuations as at
December 31, 2010. For the share deals, the net disposal
proceed amounted to €86.4 million and gave a net positive
result of €6.5 million.
The most signifi cant disposal was the 3-5 Malesherbes
offi ce in Paris, sold in July 2011.
Acquisitions
Asset deal
In May 2011, the Group’s subsidiary SCI Aéroville signed
a long term ground leasehold with Aéroports de Paris for
the development of the Aéroville shopping centre project.
This agreement has been treated as a fi nancial lease in the
consolidated fi nancial statements, recognising an Investment
Property at Cost and a fi nancial liability, both for €68.8 million.
On October 7, 2011, the Group acquired shopping centre
Splau in Barcelona for a total amount of €188.8 million
including transaction costs.
A plot of land was acquired adjacent to la Maquinista in
Barcelona for an amount of €58.2 million.
Several acquisitions of additional plots were made in
Les Quatre Temps and Aquaboulevard in Paris, in Alma in
Rennes, Parquesur, La Vaguada in Madrid and some in The
Netherlands, as well as parking plots close to Las Glorias in
Barcelona and a piece of land used for temporary parking in
Täby, in Sweden.
Share deal
Galeria Mokotow-Warsaw
On August 1, 2011, Unibail-Rodamco has acquired the
co-owner’s 50% stake in Galeria Mokotow, a prime shopping
and entertainment centre located in Warsaw in Poland.
This brings Unibail-Rodamco’s ownership to 100%. Unibail-
Rodamco will continue to manage the centre. The Group who
formerly had a joint control on this entity, has now the full
control.
The acquisition was treated as a business combination in
stages.
The acquisition date fair value of the equity interest in
Galeria Mokotow held by the Group immediately before
acquisition date amounted to €139.0 million.
An amount of €34.2 million was recognised on the line
“Valuation movements” of the statement of the comprehensive
income, as a result of remeasuring to fair value the equity
interest in the acquiree held by the acquirer before the
business combination.
Furthermore, a total amount of -€17.2 million previously
recognised in the other comprehensive income as foreign
currency differences on translation was booked in the
statement of comprehensive income.
An amount of €7.3 million corresponding to the
cancellation of Rodamco Europe goodwill allocated to the tax
optimisation on this entity was reversed and booked as an
expense in the result of the period.
All these impacts were recognised on the line “Valuation
movements” of the statement of comprehensive income.

REPORT OF THE CHAIRMAN OF THE SUPERVISORY BOARD
LEGAL INFORMATION
FINANCIAL REPORT 2012 - UNIBAIL-RODAMCO 140 • 141
The fair value of the identifi able assets and liabilities of
Galeria Mokotow as at the date of acquisition were:
(€Mn)
Fair value recognised on
acquisition
Investment properties 495.4
Other fi nancial assets 3.1
Other current assets 1.5
Cash and cash equivalents 10.0
510.0
Bonds and borrowings 195.6
Other fi nancial liabilities 2.8
Deferred tax liabilities 69.6
Other non current liabilities 3.2
Other current liabilities 9.1
280.3
Total identifi able net assets at fair value 229.7
Goodwill arising on acquisition 48.2
Total consideration 278.0
The total consideration of €278.0 million booked for the
100% share consists of €139.0 million cash for the acquisition
of the 50% additional stake in the company and €139.0 million
for the 50% previously held equity interest in the acquiree
revalued at the date of acquisition.
The incidental costs of €0.6 million incurred in connection
with the acquisition have been expensed and are included in
the operating result on the line “acquisition and related costs”.
From the date of acquisition, Galeria Mokotow has
contributed at 100% to €11.5 million to the gross rental
income and €2.8 million to the recurring result for the Group.
If the combination had taken place at the beginning of
the year, the contribution of Galeria Mokotow at 100% would
have been:
• Gross rental income: €26.4 million;
• Recurring result: €8.6 million.
The goodwill of €48.2 million is justifi ed by tax optimisation
expected on the asset. None of the goodwill is expected to be
deductible for tax purposes.
Aupark-Bratislava
In October 2011, Unibail-Rodamco has acquired 50% stake
in Aupark AS in Slovakia. This brings Unibail-Rodamco’s
ownership to 100%. The Group who formerly had a joint
control on this entity, has now the full control.
The acquisition was treated as a business combination
in stages.
The acquisition date fair value of the equity interest
in Aupark AS held by the Group immediately before the
acquisition date amounted to €122.1 million.
An amount of €20.6 million was recognised on the line
“Valuation movements” of the statement of comprehensive
income, as a result of remeasuring to fair value the equity
interest in the acquiree held by the acquirer before the
business combination.
An amount of €5.5 million corresponding to the
cancellation of Rodamco Europe goodwill allocated to the
tax optimisation on this entity was reversed and booked as
an expense in the result of the period on the line “Valuation
movements”.
The fair value of the identifi able assets and liabilities of
Aupark as at the date of acquisition were:
(€Mn)
Fair value recognised on
acquisition
Investment properties 328.5
Other fi nancial assets 3.1
Other current assets 3.1
Cash and cash equivalents 6.4
341.0
Bonds and borrowings 46.0
Deferred tax liabilities 42.8
Other non current liabilities 3.1
Other current liabilities 27.4
119.3
Total identifi able net assets at fair value 221.7
Goodwill arising on acquisition 22.5
Total consideration 244.2
The total consideration of €244.2 million booked for the
100% share consists of €122.1 million cash for the acquisition
of the 50% additional stake in the company and €122.1 million
for the 50% previously held equity interest in the acquiree
revalued at the date of acquisition.
The incidental costs of €0.6 million incurred in connection
with the acquisition have been expensed and are included in
the operating result on the line “Acquisition and related costs”.
From the date of acquisition, Aupark AS has contributed
at 100% to €3.9 million to the gross rental income and
€2.1 million to the recurring result for the Group.
If the combination had taken place at the beginning of the
year, the contribution of Aupark at 100% would have been:
• Gross rental income: €22.4 million;
• Recurring result: €12.1 million.

CONSOLIDATED FINANCIAL STATEMENTS
CORPORATE SUSTAINABILITY
BUSINESS REVIEW AND 2012 RESULTS
PORTFOLIO
UNIBAIL-RODAMCO - FINANCIAL REPORT 2012 142 • 143
The goodwill of €22.5 million is justifi ed by tax optimisation
expected on the asset. None of the goodwill is expected to be
deductible for tax purposes.
At the same date, the Group acquired also 100% of Aupark
Bratislava, spol s.r.o. The total consideration booked for the
100% share acquired amounted to €3.1 million. The goodwill
of €0.5 million is justifi ed by tax optimisation expected on the
asset. From the date of acquisition, there is no signifi cant
impact on the recurring result.
Glorias Parking
On November 16, 2011, the Group acquired, in Spain, 50%
of Glorias Parking S.A. and 42.5% of D-Parking S.C.P. The
total consideration booked for the share acquired amounted
to €4.9 million. From the date of acquisition, there is no
signifi cant impact neither on the recurring result, nor on the
non-recurring result.
Convention-Exhibition
In January 2011, the Group acquired SAS Société
d’Exploitation Hôtelière de Montparnasse (“SEHM”), the
managing company of the Méridien Montparnasse hotel in
Paris, and simultaneously signed a management contract
with Accor group which now runs the hotel under the Pullman
brand name. The Group, which already owned the walls of the
hotel, has now the full control of the building.
The acquisition was treated as a business combination.
The fair value of the identifi able assets and liabilities of
SEHM as at the date of acquisition were:
(€Mn)
Fair value recognised on
acquisition
Intangible assets 39.1
Investment property 7.6
Other non current assets 3.0
Current assets 5.2
Cash and cash equivalents 1.4
56.2
Provisions 2.9
Deferred tax liabilities 12.9
Bonds and borrowings 0.3
Other fi nancial liabilities 0.2
Current liabilities 20.1
36.4
Total identifi able net assets at fair value 19.8
Goodwill arising on acquisition 0.4
Total consideration 20.2
The total consideration booked for the 100% share acquired
amounted to €20.2 million.
The incidental costs of €1.5 million incurred in connection
with the acquisition have been expensed and are included in
the operating result on the line “Acquisition and related costs”.
The hotel has been valued by external appraiser at the
date of the business combination, part of this value has been
allocated to the intangible asset.
Other fi nancial investments
Unibail-Rodamco SE acquired from Eurohypo AG on
March 2, 2011 a 7.25% stake in Société Foncière Lyonnaise
(“SFL”) for a total amount of €108.7 million (including
€2.1 million of transaction costs) corresponding to €31.59
per share. SFL is listed on the Paris Stock Exchange, and
invests predominantly in high quality offi ce buildings in the
Paris Central Business District.
The acquisition has been made for investment purposes
and is classifi ed on the statement of fi nancial position as
“Shares available for sale” in the non current assets. According
to IAS 39, they are measured at their stock market value and
changes in fair value are recognised in other comprehensive
income. The dividends received in May 2011 (€4.7 million) and
in November 2011 (€2.4 million) were booked as an income in
the net result of the period.
Rodamco Europe squeeze out proceedings
During the fi rst quarter 2011, Unibail-Rodamco purchased
79,061 shares of Rodamco Europe NV, representing 0.09% of
the outstanding share capital.
On May 17, 2011, the Enterprise Chamber of the Court
of Appeal in Amsterdam decided on the buy-out price for
the 660,562 remaining Rodamco Europe NV shares (0.74%),
which Unibail-Rodamco proceeded to purchase.
€64.7 million was paid in total to buy out the minority
shareholders. In accordance with IFRS 3 Revised, these
transactions were treated as equity transactions and therefore
no additional goodwill was recognised. The impact on the
consolidated equity of the owners of the parent amounted to
-€3.9 million.
Effective June 9, 2011, Unibail-Rodamco is the 100%
shareholder of Rodamco Europe NV.

REPORT OF THE CHAIRMAN OF THE SUPERVISORY BOARD
LEGAL INFORMATION
FINANCIAL REPORT 2012 - UNIBAIL-RODAMCO 142 • 143
2.4.2. In 2012
Disposals
Shopping centres
While the major part of the Group’s divestment plan has
been completed during 2011 and prior years, the Group
has sold a few non core assets in France, Sweden and The
Netherlands in 2012 for a total net disposal price of almost
€98 million, excluding the Parly 2 transaction in Paris region.
Offi ces
On December 21, 2012, the Group sold a building in Lyon at
book value as at June 30, 2012 at a net initial yield of 5.9% and
with a gain of €9.9 million compared to the total investment cost.
Acquisitions
Shopping centres
On January 20, 2012, the Group acquired a part of the
Sant Cugat shopping centre in Barcelona and several plots
in Los Arcos and La Maquinista for a total acquisition cost of
€36 million.
In France, several acquisitions of additional plots were
made mainly in Villabé, in Forum des Halles and in Les Quatre
Temps for a total acquisition cost of €36 million.
In The Netherlands, a number of retail units and other
minor assets were acquired during the period for a total
acquisition cost of €26 million.
In Central Europe, an acquisition of €21 million was made
on August 2012 in Poland to develop a new shopping centre.
Offi ces
The Group acquired several plots in France for an amount
of €3 million.
Zlote Tarasy complex
In 2002, Rodamco Europe N.V. entered into an agreement
to acquire upon completion of the project 50% of the equity in
a Polish company, Zlote Tarasy S.p.z.o.o (Zlote Tarasy), which
developed a shopping centre (64,243 m2 GLA), a parking and
two offi ce towers, Lumen and Skylight (a total of 43,576 m2
GLA) in central Warsaw.
In March of 2012, a fi nal agreement was reached pursuant
to which the Group acquired a limited partnership which
holds 100% of the holding company (Warsaw III) which in turn
owns 76.85% of Zlote Tarasy. Pursuant to this transaction, the
Group invested €312.8 million (group share), allowing it to
own indirectly 76.85% of the equity in addition to various loans.
Warsaw III will continue to make payments on a participating
loan made by a fund managed by CBRE Global Investors which
matures no later than December 31, 2016. In compliance with
the restrictions imposed on Unibail-Rodamco by the Polish
competition authorities in connection with the acquisition by
the Group of the shopping centres Arkadia and Wilenska in
July of 2010, the management of Warsaw III, shopping centre
and parking is performed by CBRE Global Investors and AXA
REIM. Consequently, the Group’s investment in the Zlote
Tarasy complex is consolidated under the equity method in its
consolidated accounts as at December 31, 2012.
The calculation of the purchase price resulted in the
recognition of €48.1 million negative goodwill in the line
“Share of the result of associates” of the consolidated
statement of comprehensive income as at December 31, 2012.
The values recognised in the consolidated fi nancial
position as at December 31, 2012 are based upon current
best estimates. It is possible that further adjustments may
be recognised within twelve months of the acquisition in
accordance with IFRS rules.
Parly 2 shopping centre
On July 26, 2012, Unibail-Rodamco and Abu Dhabi
Investment Authority (“ADIA”) signed an agreement to
merge their respective assets in Parly 2, a major shopping
centre in the Paris region, into a jointly controlled company.
Following this transaction, the Parly 2 combined entity is now
consolidated under the proportional method since that date.
This operation is shown in the consolidated fi nancial
statements, fi rstly as a disposal of the asset held formerly
by the Group and secondly as an entry into a new asset,
comprising the whole shopping center.
This transaction was accomplished through both share
deals and an asset deal.
The incidental costs incurred in connection with the
operation have been expensed and are included in the
operating result on the line “Acquisition and related costs”.
According to the signed deal, Unibail-Rodamco will have
the management of the shopping centre as from July 2013.
As a result the combined entity will be fully consolidated from
such date.
Acquisitions of mfi AG and Ruhr-Park
On August 2, 2012, Unibail-Rodamco acquired a 51%
stake in a holding company owning 90.4% of mfi AG (“mfi ”,
Germany’s second largest shopping centre operator, investor
and developer). mfi ’s portfolio consists of 5 standing shopping
centres, 1 shopping centre under construction and 2 projects

CONSOLIDATED FINANCIAL STATEMENTS
CORPORATE SUSTAINABILITY
BUSINESS REVIEW AND 2012 RESULTS
PORTFOLIO
UNIBAIL-RODAMCO - FINANCIAL REPORT 2012 144 • 145
in its development portfolio as at December 31, 2012.
In addition, mfi manages 20 shopping centers for unrelated
third parties.
On August 10, 2012, Unibail-Rodamco acquired a 50%
stake in the company which owns the Ruhr-Park shopping
centre, one of the largest shopping centres in Germany.
€322.7 million was paid in August 2012 and €67.6 million
is due to be paid on June 30, 2014. The deferred payment has
been discounted. The purchase price refl ects an enterprise
value of mfi of €1.1 billion and a gross market value of
€380 million for 100% of Ruhr-Park asset. Following a capital
increase of €50 million made in August 2012, the holding
company now owns 91.15% of mfi .
The seller, from whom Unibail-Rodamco acquired the 51%
stake, still holds 49% of the shares of the holding company,
which owns 91.15% of mfi , has a put option to sell its shares
to Unibail-Rodamco between July 1, 2014 and March 31,
2017. At the date of acquisition, this put has been valued at
€3 million and booked in the line “Derivatives at fair value”, in
non-current liabilities, in the statement of fi nancial position.
In the event of the seller’s exit, not resulting from the
exercise of the put option, the seller shall pay to Unibail-
Rodamco a carried interest based on the value of the
company at the date of disposal. At the date of acquisition, the
carried interest has been valued and booked for an amount of
€31.9 million. The put and the carried interest are revalued at
each closing date and the change in fair value is recorded in
the income statement of the period.
The calculation of the purchase price resulted in the
registration of €73.8 million goodwill as at December 31, 2012.
The signifi cant majority is accounted for the value of servives
business corresponding to the property management, leasing
activity and project development services of the assets hold by
the Group or by third parties.
The governance policy in place provides control to the
seller until December 31, 2012. As Unibail-Rodamco does not
control the acquired companies, they have been consolidated
under the equity method in the consolidated fi nancial
statements as at December 31, 2012.
In 2013, according to the the Shareholders Agreement and
after receiving the approval of the authorisation of the French
and German Anti-trust authorities, the governance policy will
be modifi ed and mfi and Ruhr-Park will be jointly controlled.
From July 1, 2014, the governance agreement can be
modifi ed to provide control of mfi to Unibail-Rodamco and
consequently mfi should be fully consolidated from January
1, 2015 at the latest.
The values recognised in the consolidated fi nancial
position as at December 31, 2012 are based upon current
best estimates. It is possible that further adjustments may
be recognised within twelve months of the acquisition in
accordance with IFRS rules.
ORNANE
ORNANE 2012
Unibail-Rodamco announced on September 11, 2012 the
issuance of 3,451,767 net share settled bonds convertible
into new and/or existing shares (ORNANE) at a nominal value
of €217.28 per unit (representing a premium of 35% over
Unibail-Rodamco’s reference share price at issuance date)
for a total amount of €750 million.
The public offer was open to the public in France from
September 12, 2012 to September 14, 2012, based on a
prospectus approved by the French securities regulator,
Autorité des marchés fi nanciers (the “AMF”) under n°12-440
on September 11, 2012.
These bonds are listed on the Euronext Paris market of
NYSE Euronext.
Main characteristic of the ORNANE 2012
The bonds will bear interest at a nominal annual rate
of 0.75%, payable annually in arrears on January 1 of each
year (1), i.e. approximately €1.63 per bond. As an exception,
the fi rst interest payment, to be made on January 1, 2013(1),
will correspond to the accrued interest for the period from,
and including, September 19, 2012 (the issue date of the
bonds), to, and including, December 31, 2012, and will be
calculated prorata temporis. It will therefore amount to
approximately €0.46 per bond. The bonds will be redeemed
at par on January 1, 2018(1). They may be redeemed prior to
the maturity date at the option of Unibail-Rodamco, pursuant
terms described in the prospectus relating to this transaction
and approved by the AMF. In the case of the exercise of their
right to convert or exchange their bonds, bondholders will
receive an amount in cash and, as the case may be, an amount
payable in new and/or existing shares of Unibail- Rodamco.
The Company also has the option to deliver new and/or
existing shares only.
Being a fi nancial debt with an embedded derivative,
and based on the option provided by IAS 39, the ORNANE
convertible bond, net of the charges and premium’s write off,
are accounted for fully, at inception, at fair value, on a separate
line in the statement of fi nancial position, with subsequent
changes recorded on a separate line in the income statement.
The accrued interest is classifi ed in the consolidated statement
of fi nancial position on the line “Current borrowings and
(1) Or on the following business day if such date is not a business day.

REPORT OF THE CHAIRMAN OF THE SUPERVISORY BOARD
LEGAL INFORMATION
FINANCIAL REPORT 2012 - UNIBAIL-RODAMCO 144 • 145
amounts due to credit institutions”. The interest expenses
are booked based on the contractual’s interest rates and are
classifi ed in the statement of comprehensive income on the
line “Net fi nancing costs”.
ORNANE 2009
Almost all the ORNANE(1) convertible bonds issued in
April 2009 have been converted as at December 31, 2012,
while generating the creation of 2,013,012 new shares and an
increase of shareholders’ equity of €362.1 million.
2.5. Notes and comments
2.5.1. Notes to the consolidated assets
NOTE 1 – INVESTMENT PROPERTIES
The trend of diverging performance of prime and all other
asset classes has continued during 2012 for both offi ces and
retail assets. Regarding shopping centres, this trend is fuelled
by the economic outlook and austerity measures announced
in various countries, which is prompting consumers to be
more cautious. Retailers are responding to the pressure
on the consumer and the opportunity brought about by the
internet by continuing to be highly selective in the locations of
their key points of sale and fl agship stores. They continue to
favour the larger schemes characterized by high footfall and
high sales per square meter.
Consequently, the prime asset class characterised by
secure income with a solid risk premium over risk-free rates
remains on top of the shopping lists of active investors. Many
investors are actively looking for stable and secure yields
and have signifi cant amounts of equity allocated to European
prime commercial real estate, despite the continuing
shortfall in supply of this product category. In parallel, bank
fi nancing remains restricted especially for non-prime assets,
which combined with limited interest from equity investors
and deteriorating performance, negatively affects non-prime
valuations.
Unibail-Rodamco’s appraisers have scrutinized
and benchmarked the Group’s assets’ productivity and
performance trends (lease agreements signed, tenant sales,
footfall, rental uplift, occupancy cost ratio, etc.) to determine
individual assets’ outlook. They have taken into account
proven ability of these assets to outperform national sales
indices and their resilience in the face of generally adverse
economic trends in 2012.
In accordance with the preferred method provided under
IAS 40, investment properties are stated at their market value
as determined by independent appraisers.
Investment Properties Under Construction (IPUC) are
eligible for revaluation except for those for which the fair
value is not reliably determinable.
The following IPUC were assessed at fair value as at
December 31, 2012:
• four shopping centre projects: in Spain, the Faro del
Guadiana land, in Czech Republic the Cerny Most extension
and in France, La Toison d’Or extension in Dijon and
Aéroville in Paris region;
• So Ouest Offi ce in Levallois-Perret, Paris region.
These projects represented a total amount of
€758.9 million in the consolidated statement of fi nancial
position at December 31, 2012. The total impact of the
revaluation of these assets in the income statement for 2012
is a gain of €101.5 million.
The shopping centres Carré Sénart Shopping Park,
Confl uence in Lyon, So Ouest in Levallois-Perret, all in
France, El Faro in Badajoz, Spain and Lyon Confl uence Hotel
in France, assessed in IPUC at fair value as at December 31,
2011, were delivered in 2012. They are now considered as part
of the corresponding standing assets.
As at December 31, 2012, buildings under construction
valued at cost are shopping centres under development,
notably Val-Tolosa in Toulouse-France, Maquinista extension
in Barcelona and Mall of Scandinavia in Stockholm, and
offi ces developments such as Phare and Majunga in Paris-La
Défense and So Ouest Plaza Offi ce in Levallois-Perret, Paris
region.
Assets still stated at cost were subject to an impairment
test at December 31, 2012. An allowance was booked on one
asset for -€1.0 million.
The valuation principles of the assets by segment activity
are described in section 2.1 “Accounting principles and
consolidation methods” §2.1.5 “Asset valuation methods”.
Shopping centres portfolio
Based on an asset value excluding estimated transfer
taxes and transaction costs, the segment’s net initial yield as
at December 31, 2012 came to 5.3% vs. 5.5% at year-end 2011.
Based on the year-end yield of 5.3%, a change of +25 basis
points would result in an adjustment of -€964 million (-4.2%)
of the portfolio value (including transfer taxes and transaction
costs).
(1) 2,766 remaining ORNANE have been reimbursed on January 2, 2013 at their nominal value.

CONSOLIDATED FINANCIAL STATEMENTS
CORPORATE SUSTAINABILITY
BUSINESS REVIEW AND 2012 RESULTS
PORTFOLIO
UNIBAIL-RODAMCO - FINANCIAL REPORT 2012 146 • 147
Offi ces portfolio
For occupied offi ces and based on an asset value excluding
estimated transfer taxes and transaction costs, the segment’s
net initial yield at December 31, 2012 increased to 6.9%.
Based on the year-end yield of 6.9%, a change of +25 basis
points would result in an adjustment of -€119 million (-3.1%)
of the portfolio value (occupied and vacant space, including
transfer taxes and transaction costs).
Convention-Exhibition portfolio
Based on the valuations, the average EBITDA yield on
Viparis at December 31, 2012 (Unibail-Rodamco’s recurring
operating profi t divided by the value of Unibail-Rodamco’s
assets, excluding estimated transfer taxes) was 8.6%, vs.
7.8% at year-end 2011.
A change of +25 basis points of the yield and WACC
as determined at the end of the year would result in an
adjustment of -€53.6 million (-3.5%).
For further information on the parameters used for the
investment properties valuation, please refer to the note on
the Net Asset Value as at December 31, 2012.
As at December 31, 2012, the outstanding balances of
deferred lease incentives and key monies amortised over the
fi rm term of the lease and deducted from the appraisal value
represented €18.8 million.
Changes in investment properties at fair value
2012 Change
(€Mn) 31/12/2011 Acquisitions(1)
Entry into the scope of
consolidation(2)Capitalised expenses(3)
Disposals/Exit from
the scope of consolidation(4)
Reclassifi cation and transfer of
category(5)Discounting
impact(6)Valuation
movementsCurrency
translation 31/12/2012
Shopping centres 18,598.0 101.0 474.3 890.3 (582.1) 345.6 3.6 1,285.1 61.6 21,177.3
Offi ces 3,167.7 2.0 – 51.2 (131.7) 31.5 – (109.5) 9.2 3,020.3
Convention-Exhibition centres 1,653.4 0.5 – 38.0 – (1.8) – 25.1 – 1,715.1
Total investment properties 23,419.1 103.4 474.3 979.5 (713.8) 375.2 3.6 1,200.7 70.8 25,912.8
Properties under promise or mandate of sale 221.5 – – – (44.2) (177.3) – – – –
Total 23,640.6 103.4 474.3 979.5 (758.0) 197.9 3.6 1,200.7 70.8 25,912.8
(1) The main acquisitions were: a part of the Sant Cugat shopping centre in Barcelona as well as several plots in Los Arcos and La Maquinista in Spain for a total amount of €35.7 million; several additionnal plots in France, mainly in Forum des Halles, Les Quatre Temps and in Villabé for a total amount of €35.3 million and a number of retail units in the Netherlands (€25.7 million).(2) The entry into the scope of consolidation corresponds to Parly 2 (see section 2.4 “Highlights and comparability of the last two years”, in 2012 § “Parly 2 shopping centre”).(3) Capitalised expenses related mainly to:
• Shopping centres:- in France (€437.6 million), mainly for So Ouest (€84.8 million) and Aéroville in Paris region (€62.9 million), Confl uence in Lyon (€38.5 million), Parly 2 in Paris region (€23.4 million), Les Quatre Temps in Paris La Défense (€35.6 million), La Toison d’Or in Dijon (€30.9 million), Alma in Rennes (€18.9 million), Le Forum des Halles in Paris (€17.2 million) and Carré Sénart in Paris region (€15 million);- in Sweden for Täby Centrum (€92.3 million) and Solna (€10.8 million) in Stockholm;- in Austria, for Shopping City Süd (€57.6 million) and Donau Zentrum (€18.8 million) both in Vienna;- in Czech Republic, for Centrum Cerny Most in Prague (€75.6 million);- in Spain, Faro del Guadiana in Badajoz (€55.3 million) and La Maquinista in Barcelona (€11.8 million);- in Denmark, for Fisketorvet in Copenhagen (€29.9 million).
• Offi ces: in France (€40.7 million) mainly for So Ouest in Paris region (€18.7 million).• Convention-exhibition: in France, the convention-exhibition centre Parc des Expositions de la Porte de Versailles (€15.5 million) and Pullman hotel in Paris (€14.2 million).
(4) Refer mainly to the disposals of Parly 2 in France for -€545.2 million (see section 2.4 “Highlights and comparability of the last two years”, in 2012 § “Parly 2 shopping centre”), shopping centres in Sweden (-€33.3 million), in France (-€32.5 million), and in The Netherlands (-€11.6 million), and mainly offi ces in France (see section 2.4 “Highlights and comparability of the last two year”, in 2012 § “Disposals”).(5) The majority of the reclassifi cation and transfer of category was due to the transfer from IPUC at cost of the shopping centre Aéroville (Paris region), as at June 30, 2012.(6) Mainly impact of the deferred payment on the ground leasehold of Forum des Halles in Paris (€2.9 million). The debt value was discounted in counterpart of the asset value.

REPORT OF THE CHAIRMAN OF THE SUPERVISORY BOARD
LEGAL INFORMATION
FINANCIAL REPORT 2012 - UNIBAIL-RODAMCO 146 • 147
2011 Change
(€Mn) 31/12/2010 Acquisitions
Entry into the scope of
consolidationCapitalised expenses
Disposals/Exit from
the scope of consolidation
Reclassifi cation and transfer of
categoryDiscounting
impactValuation
movementsCurrency
translation 31/12/2011
Shopping centres 16,856.6 232.2 438.6 490.1 (262.3) 77.1 3.7 754.1 8.0 18,598.0
Offi ces 3,271.1 3.8 – 84.1 (160.7) (8.5) 0.5 (24.3) 1.7 3,167.7
Convention-Exhibition centres 1,518.8 – 7.6 56.2 – (0.2) – 71.0 – 1,653.4
Total investment properties 21,646.5 236.0 446.2 630.4 (423.1) 68.3 4.2 800.9 9.6 23,419.1
Properties under promise or mandate of sale 975.4 – – – (848.8) 95.4 – (0.5) – 221.5
Total 22,622.0 236.0 446.2 630.4 (1,271.9) 163.7 4.2 800.4 9.6 23,640.6
Changes in investment properties at cost
2012 Change
(€Mn) 31/12/2011 Acquisitions(1)Capitalised expenses(2)
Disposals/ Exit from
the scope of consolidation(3)
Reclassifi cation and transfer of
category(4)Discounting
impact Impairment(5)Currency
translation 31/12/2012
Gross value 667.9 20.5 284.0 (3.8) (197.2) 0.6 – 5.7 777.7
Amortisation (31.1) – – – – – (1.0) – (32.1)
Total investment properties at cost 636.8 20.5 284.0 (3.8) (197.2) 0.6 (1.0) 5.7 745.6
(1) Relates mainly to an acquisition in Poland in order to develop a new shopping centre (€19.0 million).(2) Capitalised expenses mainly related to the shopping centres Mall of Scandinavia in Sweden (€88.7 million) and Aéroville in Paris region (€54.5 million) and to French offi ce properties Majunga in Paris-La Défense (€89.2 million) and So Ouest Plaza in Paris region (€19.4 million).(3) Corresponds to the disposals of Parly 2 (see section 2.4 “Highlights and comparability of the last two years”, in 2012 § “Parly 2 shopping centre”)(4) Corresponds mainly to the transfer to Investment Properties at fair value of the shopping centre Aéroville in Paris region, as at June 30, 2012.(5) Relates to an allowance of €1.0 million booked on one asset.
2011 Change
(€Mn) 31/12/2010 AcquisitionsCapitalised expenses
Disposals/Exit from
the scope of consolidation
Reclassifi cation and transfer of
categoryDiscounting
impact ImpairmentCurrency
translation 31/12/2011
Gross value 371.0 213.5 241.2 (0.2) (156.7) (0.8) – (0.2) 667.9
Amortisation (29.1) – – – – – (2.0) – (31.1)
Total investment properties at cost 341.9 213.5 241.2 (0.2) (156.7) (0.8) (2.0) (0.2) 636.8
Properties under promise or mandate of sale 4.3 – – (4.3) – – – – –
Total 346.2 213.5 241.2 (4.5) (156.7) (0.8) (2.0) (0.2) 636.8
NOTE 2 – OTHER TANGIBLE ASSETS
2012 Change
Gross value(€Mn) 31/12/2011
Acquisitions and
capitalised expenses(1) Disposals Amortisation
Other movements 31/12/2012
Operating assets 169.1 – – – – 169.1
Furniture and equipment 99.2 12.5 (1.9)(2) – (1.1) 108.7
Total 268.3 12.5 (1.9) – (1.1) 277.8
(1) Major works relate to Viparis entities for €7.9 million and service entities for €4.6 million.(2) Main disposals refer to technical equipments which was scrapped.

CONSOLIDATED FINANCIAL STATEMENTS
CORPORATE SUSTAINABILITY
BUSINESS REVIEW AND 2012 RESULTS
PORTFOLIO
UNIBAIL-RODAMCO - FINANCIAL REPORT 2012 148 • 149
Depreciation/Impairment(€Mn) 31/12/2011 Charges Reversals Amortisation
Other movements 31/12/2012
Operating assets 21.4 2.3 (3.6)(1) – – 20.1
Furniture and equipment 48.3 10.0 (1.4)(2) – 0.3 57.2
Total 69.8 12.3 (5.0) – 0.3 77.3
(1) Relates to the headquarters of the Group located at 7 place Adenauer Paris 16th – France, for which a reversal of impairment was booked according to the appraisal value.(2) Main disposals refer to technical equipment which was scrapped.
Net value(€Mn) 31/12/2011
Acquisitions and
capitalised expenses Disposals
Amortisation (net of
reversals)Other
movements 31/12/2012
Operating assets 147.7 – – 1.3 – 149.0
Furniture and equipment 50.8 12.5 (0.5) (10.0) (1.3) 51.5
Total 198.4 12.5 (0.5) (8.7) (1.3) 200.4
2011 Change
Net value(€Mn) 31/12/2010
Acquisitions and
capitalised expenses
Changes in the scope of
consolidation Disposals AmortisationOther
movements 31/12/2011
Operating assets 150.3 0.8 – – (3.5) – 147.7
Furniture and equipment 49.4 9.9 2.9 (1.0) (10.3) (0.1) 50.8
Total 199.8 10.7 2.9 (1.0) (13.8) (0.1) 198.4
NOTE 3 – GOODWILL
2012 Change
(€Mn) 31/12/2011 Decrease Impairment Reclassifi cation(1) 31/12/2012
Gross value 1,912.8 (0.1) – 0.8 1,913.5
Impairment (1,616.0) – (28.1) – (1,644.1)
Total 296.8 (0.1) (28.1) 0.8 269.4
(1) Reclassifi cation of the D-Parking goodwill following the change in method of consolidation from equity to proportional.
The goodwill at December 31, 2012 breaks down as follows:
• €117.7 million correspond to the value of tax optimisation
on Rodamco assets at the date of the combination adjusted
for the cumulative impairments through to year-end 2012;
• the remaining amount corresponds mainly to the goodwill
booked on the acquisition of Shopping City Süd in Vienna,
on the acquisition of additional stakes and full consolidation
of the shopping centres Galeria Mokotow in Warsaw and
Aupark in Bratislava (Slovakia), on the acquisition of the
Simon Ivanhoe assets and on the creation of Viparis. The
goodwill is justifi ed by the tax optimisation expected on
these assets.
The impairment test consists of comparing the net value
of this goodwill with the amounts of tax optimisation as
determined at the date of reporting.
Following the entry into the SIIC regime of some French
assets of the Simon Ivanhoe portfolio in 2012, the expected tax
optimisation on these assets was realised and consequently
the corresponding goodwill was impaired for a total amount
of €26.1 million. This impairment was recorded in “income
tax expenses” in the consolidated interim statement of
comprehensive income.
An impairment of €2 million was also recognised in Spain
following the acquisition at the end of 2011 of Glorias Parking.

REPORT OF THE CHAIRMAN OF THE SUPERVISORY BOARD
LEGAL INFORMATION
FINANCIAL REPORT 2012 - UNIBAIL-RODAMCO 148 • 149
2011 Change
(€Mn) 31/12/2010 Increase Decrease Impairment 31/12/2011
Gross value 1,867.6 73.2 (28.0) – 1,912.8
Impairment (1,602.0) – – (14.0) (1,616.0)
Total 265.6 73.2 (28.0) (14.0) 296.8
NOTE 4 – INTANGIBLE ASSETS
2012 Change
Gross value(€Mn) 31/12/2011 Acquisitions Disposals
Reclassifi cation and other
movements 31/12/2012
Rights and exhibitions 331.3 – – (0.7) 330.5
Other intangible assets 27.7 2.3 (2.5) (0.7) 26.8
Total 358.9 2.3 (2.5) (1.4) 357.3
Amortisation(€Mn) 31/12/2011 Charges Reversals
Reclassifi cation and other
movements 31/12/2012
Rights and exhibitions 123.4 5.0(1) – (0.7) 127.8
Other intangible assets 24.2 2.8 (2.5) (1.1) 23.4
Total 147.6 7.8 (2.5) (1.8) 151.2
(1) Relates to the amortisation of the Convention-Exhibition intangible assets.
Net value(€Mn) 31/12/2011 Acquisitions
Disposals and
reversals
Reclassifi cation and
amortisation 31/12/2012
Rights and exhibitions 207.8 – – (5.1) 202.7
Other intangible assets 3.4 2.3 – (2.4) 3.4
Total 211.3 2.3 – (7.5) 206.1
The intangible assets qualifi ed as “Rights and exhibitions” relate mainly to the Viparis’ entities and are valued by external
appraisers.
A change of +25 basis points of the yield and WACC of Viparis’ intangible assets as determined at the end of the year would result
in an adjustment of -€5.8 million (-3.8%).
2011 Change
Net value(€Mn) 31/12/2010 Acquisitions
Disposals and
reversals
Reclassifi cation and
amortisation 31/12/2011
Rights and exhibitions 165.6 39.0 7.4 (4.2) 207.8
Other intangible assets 5.2 2.5 – (4.2) 3.4
Total 170.8 41.5 7.4 (8.4) 211.3

CONSOLIDATED FINANCIAL STATEMENTS
CORPORATE SUSTAINABILITY
BUSINESS REVIEW AND 2012 RESULTS
PORTFOLIO
UNIBAIL-RODAMCO - FINANCIAL REPORT 2012 150 • 151
NOTE 5 – LOANS AND RECEIVABLES
(€Mn)
31/12/2012 31/12/2011
Gross Provision Net Gross Provision Net
Outstanding fi nance leasing 0.2 – 0.2 0.4 – 0.4
Finance leasing receivables 0.9 (0.7) 0.2 1.0 (0.7) 0.2
Advances to companies consolidated under the proportional or equity method(1) 111.6 – 111.6 33.6 – 33.6
Deposits paid 15.1 – 15.1 11.0 – 11.0
Prepayments(2) – – – 198.3 – 198.3
Other fi nancial assets 9.4 (9.4) – 10.4 (9.4) 1.0
Total 137.1 (10.1) 127.0 254.6 (10.1) 244.5
(1) The Group acquired 100% of the loans made by the developer to Zlote Tarasy including a portion corresponding to the stake in Zlote Tarasy owned by the City of Warsaw. This amount was consequently classifi ed in “Loans and receivables” (see section 2.4 “Highlights and comparability of the last two years”, in 2012 § “Zlote Tarasy complex”).(2) The change refers mainly to the investment in the Sub-Group Zlote Tarasy: Unibail-Rodamco’s participating loan granted to the developer in 2007 was repaid.
NOTE 6 – FINANCIAL ASSETS
In 2012, this item comprises a bond issued by the owner of
a shopping centre in France for €60 million (with an annual
interest rate of 6.50% and a maturity of 7 years) and the
shares of non-consolidated companies (€17 million).
In 2011, it comprises the shares of non-consolidated
companies.
NOTE 7 – SHARES AVAILABLE FOR SALE
Unibail-Rodamco has a 7.25% stake in Société Foncière
Lyonnaise which is classifi ed as “Shares available for sale”
for their stock market value. The positive fair value change of
€5.2 million was recognised in other comprehensive income.
A dividend of €7.1 million was received during the
period and booked in the net result on the line “Result from
non-consolidated companies”.
NOTE 8 – SHARES AND INVESTMENTS IN COMPANIES
CONSOLIDATED UNDER THE EQUITY METHOD
(€Mn) 31/12/2012 31/12/2011
Shares in shopping centres companies 491.9 1.3
Loan granted to shopping centres companies 282.5 –
Sub-total investment in shopping centres companies 774.4 1.3
Shares in Comexposium Group 54.5 55.7
Loan granted to Comexposium Group 124.6 149.6
Sub-total investment in Exhibitions organising companies 179.1 205.3
Total shares and investments in companies consolidated under the equity method 953.5 206.6
Shares in shopping centres companies comprise:
• a 51% stake in a holding company which owns 91.15% of
mfi AG (Germany’s second largest shopping centre operator,
investor and developer);
• a 50% stake in the company which owns the Ruhr-Park
shopping centre;
• a 76.85% stake in the Zlote Tarasy complex located in
Warsaw.
The value of the shares under equity includes the fair
value of the underlying investment properties, as well as
the recognition of the negative goodwill for an amount of
€48.1 million, related to the Zlote Tarasy complex.
The value of the stake in Comexposium Group includes
the value of the intangible assets (net of the deferred taxes)
recognised for these companies at the date of entry into the
scope of consolidation.
The result of the impairment tests on intangible assets
booked within the Comexposium Group led to the impairment
of intangible assets of €19.3 million and to a reversal of
impairment of €3.8 million.
The main items of the statements of fi nancial position
of companies consolidated under the equity method are
presented in the tables below. These items are stated on
a 100% basis including restatements for consolidation
purposes.

REPORT OF THE CHAIRMAN OF THE SUPERVISORY BOARD
LEGAL INFORMATION
FINANCIAL REPORT 2012 - UNIBAIL-RODAMCO 150 • 151
Shopping centres companies
(€Mn) 31/12/2012 31/12/2011
Investment properties 2,001.7 –
Other non current assets 179.3 –
Current assets 218.5 –
Total assets 2,399.5 –
Restated shareholders’ equity 838.6 –
External borrowings and debts to partners 1,150.5 –
Other non current liabilities 122.3 –
Current liabilities 288.1 –
Total liabilities 2,399.5 –
Comexposium Group
(€Mn) 31/12/2012 31/12/2011
Intangible assets(1) 370.9 369.5
Goodwill(1) 191.0 191.0
Other non current assets 6.2 13.0
Current assets 145.4 117.8
Total assets 713.5 691.4
Restated shareholders’ equity 137.7 133.4
Deferred tax liabilities 106.8 102.7
External borrowings and debts to partners 300.2 301.4
Other non current liabilities 5.5 8.1
Current liabilities 163.3 145.7
Total liabilities 713.5 691.4
(1) Intangible assets and goodwill are presented net of amortisation and impairment.
The main income statement items of companies
consolidated under the equity method are presented
below. These items are stated on a 100% basis including
restatements for consolidation purposes.
Shopping centres companies
(€Mn) 2012 (1) 2011
Rental revenues 58.3 –
Change in fair value of investment properties 59.5 –
Net income 42.1 –
(1) From the date of acquisition.
Comexposium Group
(€Mn) 2012 2011
Revenues from other activities 291.6 201.2
Net operating profi t before fi nancing cost 47.0 26.5
Net income 24.4 9.7
NOTE 9 – JOINT VENTURES
Joint ventures are those entities in which the Group has
joint control established by contractual agreement. Joint
ventures are proportionally consolidated based on Unibail-
Rodamco’s share of ownership.
The investments in joint ventures are detailed in section 2.3
“Scope of consolidation”.
2012 includes the Parly 2 sub-group consolidated under
the proportional method since July 26, 2012 (see section 2.4
“Highlights and comparability of the last two years”, in 2012 §
“Parly 2 shopping centre”).
The main items of the statements of fi nancial position
of joint ventures are presented in the tables below. These
items are stated on a 100% basis including restatements for
consolidation purposes.
(€Mn) 31/12/2012 31/12/2011
Investment properties 2,469.3 1,342.4
Other non current assets 107.4 9.0
Current assets 217.9 134.6
Total assets 2,794.6 1,486.0
Restated shareholders’ equity 1,710.4 756.3
Deferred tax liabilities 148.6 137.3
External borrowings and debts to partners 649.5 425.9
Other non current liabilities 19.0 8.6
Current liabilities 267.1 157.9
Total liabilities 2,794.6 1,486.0
The main income statement items of companies
consolidated under the proportional method are presented
below. These items are stated on a 100% basis including
restatements for consolidation purposes.
(€Mn) 2012 2011
Net rental income 112.6 70.9
Change in fair value of investment properties 141.1 44.6
Net income 202.3 96.9
NOTE 10 – TRADE RECEIVABLES FROM ACTIVITY
All of these receivables are due within one year, except
rent-free periods and step rents amortised over the fi rm term
of the lease.
Trade related receivables (€Mn) 31/12/2012 31/12/2011
Trade receivables 172.3 179.7
Doubtful accounts 53.2 51.0
Rent-free periods and step rents 94.6 95.7
Gross value 320.1 326.4
Provisions for doubtful accounts (41.5) (43.9)
Net 278.5 282.5

CONSOLIDATED FINANCIAL STATEMENTS
CORPORATE SUSTAINABILITY
BUSINESS REVIEW AND 2012 RESULTS
PORTFOLIO
UNIBAIL-RODAMCO - FINANCIAL REPORT 2012 152 • 153
Breakdown of trade receivables by business line (€Mn) 31/12/2012 31/12/2011
Shopping centres 131.8 142.0
Offi ces 61.3 69.1
Convention-Exhibition 66.0 58.8
Property services 12.3 9.1
Other 7.1 3.5
Total 278.5 282.5
Changes in provisions for doubtful accounts (€Mn) 2012 2011
As of January 1 (43.9) (40.4)
Currency translation adjustments (0.3) –
Change in scope of consolidation (0.1) 0.2
Reclassifi cations 0.1 0.4
Additions (12.1) (14.8)
Use and reversal 14.8 10.8
As of December 31 (41.5) (43.9)
NOTE 11 – OTHER TRADE RECEIVABLES
All of these receivables are due within one year, except
leaseholds.
Tax receivables (€Mn) 31/12/2012 31/12/2011
Value-Added Tax and other(1) 159.6 174.6
Corporate income tax 7.4 4.7
Total 167.0 179.3
(1) The decrease is mainly due to the reimbursement of the tax receivable due in 2011 following the acquisition of the shopping centre Splau in Spain.
Receivables on sales of property (€Mn) 31/12/2012 31/12/2011
Receivables on sales of property – 3.4
Total – 3.4
Other receivables (€Mn) 31/12/2012 31/12/2011
Receivables from suppliers 9.5 9.3
Service charges due 51.8 41.5
Other debtors(1) 128.7 96.8
Receivables from partners 10.9 8.9
Accrued income receivable on caps and swaps 0.4 0.8
Gross value 201.4 157.3
Provisions (0.6) (2.1)
Net 200.8 155.1
(1) The change relates mainly to the carried interest on the acquisition of mfi AG (see section 2.4 “Highlights and comparability of the last two years”, in 2012 § “Acquisitions of mfi AG and Ruhr-Park”).
Prepaid expenses (€Mn) 31/12/2012 31/12/2011
Leaseholds: payments made at the start of the contract(1) 41.1 41.6
Prepaid expenses 20.8 11.5
Total 61.9 53.1
(1) Straight-line depreciation over the life of the contracts. The balance of these prepaid expenses is deducted from the appraisal value of investment properties to determine their fair value in the statement of fi nancial position.
NOTE 12 – CASH AND CASH EQUIVALENTS
(€Mn) 31/12/2012 31/12/2011
Available-for-sale investments(1) 2.2 2.3
Cash 62.8 79.7
Current account to balance out cash fl ow 0.3 0.2
Total 65.3 82.3
(1) This item comprises investments in money-market SICAV (marketable securities). There were no unrealised capital gains or losses on the portfolio.
The level of cash at year-end is stable as the Group uses a
European cash pooling system optimising the use of liquidity
across the Group.
2.5.2. Notes to the consolidated liabilities
NOTE 13 – COMMITMENT TO PURCHASE NON-
CONTROLLING INTERESTS
Unibail-Rodamco has given commitments to purchase
the non-controlling interests in the shopping centre Donau
Zentrum in Vienna. This commitment has been paid in the
second half of 2012 for €10.7 million.
NOTE 14 – CURRENT AND NON CURRENT FINANCIAL
LIABILITIES
Net share settled bonds convertible into new and/or
existing shares (ORNANE)
In accordance with IAS 39 standard, the ORNANE of
Unibail-Rodamco are stated at fair value.
ORNANE issued in 2009
Almost all of the ORNANE were converted as at
December 31, 2012. The nominal value was repaid for a total
amount of €574.5 million. 2,013,012 new shares have been
created resulting in an increase of shareholder’s equity of
€362.1 million.
The ORNANE had been recognised at their fair value
until the date of reimbursement while generating a loss of
€179.4 million in the non-recurring result of the period. The
2,766 remaining ORNANE represent an amount of debt of
€0.4 million which was repaid early in January 2013.

REPORT OF THE CHAIRMAN OF THE SUPERVISORY BOARD
LEGAL INFORMATION
FINANCIAL REPORT 2012 - UNIBAIL-RODAMCO 152 • 153
ORNANE issued in 2012
In September 2012, the Group issued new ORNANE of
Unibail-Rodamco for €750 million.
The terms of issuance and accounting of the ORNANE are
presented in section 2.4 “Highlights and comparability of the
last two years”, in 2012 § “ORNANE”.
The obligations under the ORNANE are valued at
€794.7 million at December 31, 2012.
At December 31, 2012, the valuation at fair value (quoted
price) generated a loss of €44.7 million and issuance costs
write-off of €6.3 million, which were accounted for in the
income statement of the period.
Debt breakdown (including ORNANE)
Borrowings and other fi nancial liabilities(€Mn) 31/12/2012 31/12/2011
Net share settled bonds convertible into new and/or existing shares (ORNANE) 796.7 758.5
Debt at fair value 795.1 738.5
Accrued interest 1.6 20.0
Bonds and EMTNs 6,694.3 4,712.1
Principal debt 6,633.0 4,708.0
Accrued interest 88.8 45.4
Issuance costs (23.3) (30.3)
Mark-to-market of debt(1) (4.2) (11.0)
Bank borrowings 2,513.3 3,740.7
Principal debt 2,510.8 3,729.2
Accrued interest on borrowings 7.9 10.7
Borrowings issue fees (14.8) (9.5)
Bank overdrafts 6.0 3.5
Accrued interest on bank overdrafts (0.1) 1.3
Current accounts to balance out cash fl ow 3.0 5.4
Mark-to-market of debt(1) 0.4 0.1
Bonds redeemable for shares (ORA) 0.1 0.2
Other fi nancial liabilities 1,790.7 1,407.5
Interbank market instruments and negotiable instruments 1,130.8 728.1
Accrued interest on interbank market instruments and negotiable instruments – 1.1
Current accounts with non-controlling interests 659.9 678.4
Financial leases 123.9 125.4
Total 11,919.0 10,744.4
(1) Rodamco fi xed-rate debt has been marked-to-market at the date of its fi rst consolidation in 2007.
Unibail-Rodamco’s nominal fi nancial debt as at
December 31, 2012 breaks down as follows:
• €6,633 million in bonds, of which €6,133 million under the
Euro Medium Term Notes (EMTN) programme of Unibail-
Rodamco and €500 million under Rodamco Europe’s EMTN
programme;
• €750 million in ORNANE;
• €1,131 million in commercial paper (billets de trésorerie
and Euro Commercial Paper);
• €2,520 million in bank loans and overdrafts, including
€1,380 million in unsecured corporate loans, €1,130 million
in mortgage loans and €9 million in bank overdrafts.

CONSOLIDATED FINANCIAL STATEMENTS
CORPORATE SUSTAINABILITY
BUSINESS REVIEW AND 2012 RESULTS
PORTFOLIO
UNIBAIL-RODAMCO - FINANCIAL REPORT 2012 154 • 155
The following table shows a breakdown of outstanding duration to maturity of borrowings and fi nancial liabilities:
Outstanding duration to maturity(€Mn)
Current Non current Total
Less than 1 year
1 year to 5 years
More than 5 years 31/12/2012
Net share settled bonds convertible into new and/or existing shares (ORNANE) 2.0 – 794.7 796.7
Debt at fair value 0.4 – 794.7 795.1
Accrued interest 1.6 – – 1.6
Bonds and EMTNs 164.2 3,437.1 3,093.0 6,694.3
Principal debt 105.0 3,435.0 3,093.0 6,633.0
Accrued interest 88.8 – – 88.8
Issuance costs (23.3) – – (23.3)
Mark-to-market of debt (6.3) 2.1 – (4.2)
Bank borrowings 928.4 1,330.0 254.9 2,513.3
Principal debt 925.7 1,330.2 254.9 2,510.8
Accrued interest on borrowings 7.9 – – 7.9
Borrowings issue fees (14.8) – – (14.8)
Bank overdrafts 6.0 – – 6.0
Accrued interest on bank overdrafts (0.1) – – (0.1)
Current accounts to balance out cash fl ow 3.0 – – 3.0
Mark-to-market of debt 0.6 (0.2) – 0.4
Bonds redeemable for shares (ORA) 0.1 – – 0.1
Other fi nancial liabilities 1,130.8 429.6 230.2 1,790.7
Interbank market instruments and negotiable instruments 1,130.8 – – 1,130.8
Current accounts with non-controlling interests – 429.6 230.2 659.9
Financial leases 2.6 17.4 103.9 123.9
Total 2,228.2 5,214.1 4,476.7 11,919.0
Unibail-Rodamco’s main refi nancing operations over 2012
were as follows:
• the signing of €1,384 million medium to long term credit
facilities or bank loans with an average maturity of 4.2 years.
This amount includes the refi nancing of a €600 million
syndicated credit facility, due in 2013, and renegotiated and
extended to December 2017 in December 2012;
• the issue of three public EMTN bonds for a total amount of
€2,000 million;
• the issue of two private EMTN placements for a total of
€425 million, with a duration of 10 years;
In total €2,425 million was raised on the bond market in
2012 at an average duration of 6.7 years;
• the issue of a €750 million convertible bond (ORNANE) in
September 2012.
Unibail-Rodamco accessed the money market by issuing
commercial paper. The average amount of commercial paper
outstanding in 2012 was €989 million, including €964 million
of billets de trésorerie and €25 million of Euro Commercial
Paper (maturity of up to 3 months). Billets de trésorerie were
raised over 2012 at an average margin of 4 bps above Eonia
and Euro Commercial Paper nearly fl at to Euribor.
Maturity of current principal debt
(€Mn)
Current Total
Less than 1 month
1 month to 3 months
More than 3 months 31/12/2012
Bonds and EMTNs – – 105.0 105.0
Bank borrowings 1.3 3.5 920.8 925.7
Other fi nancial liabilities 910.8 220.0 – 1,130.8
Financial leases – – 2.6 2.6
Total 912.1 223.5 1,028.4 2,164.1
As at December 31, 2012, Unibail-Rodamco’s average debt
maturity was 4.9 years (4.5 years as of December 31, 2011),
after taking into account the confi rmed unused credit lines.
Unibail-Rodamco’s immediate debt repayment needs are
covered by the available undrawn credit lines: the amount of
bonds and bank loans outstanding as at December 31, 2012
and maturing or amortising within a year is €1,040 million
compared with €4,013 million of undrawn commited credit
lines as at December 31, 2012.

REPORT OF THE CHAIRMAN OF THE SUPERVISORY BOARD
LEGAL INFORMATION
FINANCIAL REPORT 2012 - UNIBAIL-RODAMCO 154 • 155
Characteristics of bonds and EMTN’s (excluding ORNANE)
Issue date Rate
Amount at31/12/2012
(€Mn) Maturity
October 2004 Fixed rate 4.375% 500.0 October 2014
July 2008 Constant Maturity Swap 10 years Euro +0.74% 105.0 July 2013
July 2009 Fixed rate 4.22% during 2 years then linked to infl ation 70.0 July 2019
August 2009 Fixed rate 5% during 3 years then Constant Maturity Swap 10 years (fl oored at 5%, capped at 7.5%) 50.0 August 2019
August 2009 Fixed rate 5% during 3 years then Constant Maturity Swap 10 years (fl oored at 5%, capped at 7.5%) 50.0 August 2019
September 2009 Fixed rate 4.8% 150.0 November 2017
September 2009 Fixed rate 4.625% 600.0 September 2016
March 2010 Fixed rate 3.375% 635.0 March 2015
May 2010 Structured coupon linked to CMS 10 year 50.0 May 2020
June 2010 Structured coupon linked to CMS 10 year 50.0 June 2020
September 2010 Fixed rate 3.35% 50.0 September 2018
September 2010 Fixed rate 3.35% 60.0 September 2018
November 2010 Fixed rate 4.17% 41.0 September 2030
November 2010 Fixed rate 3.875% 700.0 November 2020
June 2011 Float rate (Erb3M + 78bps) 50.0 June 2017
October 2011 Fixed rate 4.08% 27.0 October 2031
October 2011 Fixed rate 3.50% 500.0 April 2016
November 2011 Fixed rate 4.05% 20.0 November 2031
December 2011 Fixed rate 3.875% 500.0 December 2017
March 2012 Fixed rate 3.000% 750.0 March 2019
May 2012 Fixed rate 3.196% 425.0 May 2022
August 2012 Fixed rate 2.250% 750.0 August 2018
October 2012 Fixed rate 1.625% 500.0 June 2017
Total 6,633.0
Covenants
Bonds issued are not restricted by any covenant based on
fi nancial ratios which could lead to early repayment of the debt.
The bond issued by Rodamco under the EMTN program
and maturing in 2014 (€500 million as at December 31, 2012)
includes a restriction of the amount of indebtedness at the
level of Rodamco and its subsidiaries, which cannot exceed in
aggregate 30% of Total Group Assets. At December 31, 2012,
the Group has not exceeded this restriction.
No bank loans were subject to prepayment clauses linked
to the Group’s ratings, barring exceptional circumstances
such as change in control.
There are no fi nancial covenants (such as LTV or ICR) in
the EMTN and the Commercial Paper programs.
The majority of bank loans and credit facilities contains
fi nancial covenants such as LTV (Loan To Value) and ICR
(Interest Coverage Ratio) ratios, as well as, a prepayment
clause in case of occurrence of a material adverse change.
As at December 31, 2012, the Loan-to-Value ratio (LTV)
ratio calculated for Unibail-Rodamco stood at 37%, in line
with the level of 37% as at December 31, 2011.
The Interest Coverage Ratio (ICR) ratio for Unibail-
Rodamco came to 3.5x for 2012. It is in line with the solid
levels achieved in recent years and slightly decreased from
3.6x in 2011.
Those ratios show ample headroom vis-à-vis bank
covenants usually set at a maximum of 60% LTV and a
minimum of ICR of 2x, which the Group reports to the banks
twice a year.
As at December 31, 2012, 96% of the Group’s credit
facilities and bank loans allowed indebtedness amounting to
60% or more of the Group’s total asset value or of the value of
the asset of the borrowing entity, as the case may be.
Market value
The market value of Unibail-Rodamco’s fi xed-rate
and index-linked debt is presented in the table below.
The remainder of the Group’s outstanding debt is variable-
rate debt, which has its carrying value on the statement of

CONSOLIDATED FINANCIAL STATEMENTS
CORPORATE SUSTAINABILITY
BUSINESS REVIEW AND 2012 RESULTS
PORTFOLIO
UNIBAIL-RODAMCO - FINANCIAL REPORT 2012 156 • 157
fi nancial position as the sum of the nominal amount and
coupon accruals.
(€Mn)
31/12/2012 31/12/2011
Carrying value
Market value
Carrying value
Market value
Long term debt
Fixed-rate & index-linked borrowings, interbank instruments and negotiable market instruments 8,366.0(1) 8,861.8 6,065.6 6,248.6
(1) ORNANE included, at market value (see paragraph above on ORNANE).
NOTE 15 – HEDGING INSTRUMENTS
Derivative instruments owned by the Group are stated at
fair value and were recorded in the statement of fi nancial
position as at December 31, 2012, for €182.6 million as assets
and €625.3 million as liabilities.
Derivatives are valued by discounted estimated future
cash fl ows based on the interest rate curve at the end of
December 2012. The valuation has been cross-checked
against valuations by banks.
The mark-to-market of derivatives generated a net loss of
€214.5 million in 2012, including a loss of €19.2 million of
cancellation of swaps.
Cash fl ow hedges generated a loss of €5.0 million in the
net result of the period and a loss of €3.8 million in the other
comprehensive income.
NOTE 16 – DEFERRED TAX
2012 Change
(€Mn) 31/12/2011 Increase Decrease Reclassifi cationsCurrency
translation 31/12/2012
Deferred tax liabilities (1,055.8) (116.3) 86.5 – (9.6) (1,095.2)
Deferred tax on investment properties (985.1) (116.3) 84.8 – (9.6) (1,026.2)
Deferred tax on intangible assets (70.7) – 1.7 – – (69.0)
Other deferred tax 90.5 10.5 (25.1) 2.1 1.2 79.2
Tax loss carry-forward(1) 70.8 10.5 (24.4) 2.9 1.2 61.0
Others(1) 19.7 – (0.7) (0.8) – 18.2
Total Deferred tax liabilities (965.3) (105.8) 61.4 2.1 (8.4) (1,016.0)
Deferred tax assets
Other deferred tax assets 0.3 – – 0.8 – 1.1
Tax loss carry-forward 5.7 5.6 (4.5) (2.9) – 3.9
Total Deferred tax assets 6.0 5.6 (4.5) (2.1) – 5.0
(1) Deferred tax assets and liabilities within a same tax group are offset.
Deferred tax liabilities on properties refer to those countries where there is no tax effi cient status comparable to that of France
(SIIC), providing a tax exemption on recurring income and capital gains on property sales. The increase of deferred tax liabilities on
investment properties is mainly due to the increase of the valuation of the assets outside France.
The decrease of deferred tax liabilities on investment properties is mainly due to the reversal of deferred tax liabilities on the
French assets from the Simon Ivanhoe portfolio which entered the SIIC regime in 2012.

REPORT OF THE CHAIRMAN OF THE SUPERVISORY BOARD
LEGAL INFORMATION
FINANCIAL REPORT 2012 - UNIBAIL-RODAMCO 156 • 157
2011 Change
(€Mn) 31/12/2010 Increase Decrease Reclassifi cationsCurrency
translation
Changes in the scope of
consolidation 31/12/2011
Deferred tax liabilities (940.9) (101.2) 37.0 0.5 (1.3) (49.9) (1,055.8)
Deferred tax on investment properties (884.0) (98.6) 35.3 0.5 (1.3) (37.0) (985.1)
Deferred tax on intangible assets (56.9) (2.6) 1.7 – – (12.9) (70.7)
Other deferred tax 90.4 9.9 (15.9) 6.9 0.3 (1.1) 90.5
Tax loss carry-forward 77.3 3.2 (15.4) 5.4 0.3 – 70.8
Others 13.1 6.7 (0.5) 1.5 – (1.1) 19.7
Total Deferred tax liabilities (850.5) (91.3) 21.1 7.4 (1.0) (51.0) (965.3)
Deferred tax assets
Other deferred tax assets 0.3 – – – – – 0.3
Tax loss carry-forward 9.7 4.1 (0.7) (7.4) – – 5.7
Total Deferred tax assets 10.0 4.1 (0.7) (7.4) – – 6.0
Unrecognised deferred tax assets
(€Mn) 31/12/2012 31/12/2011
Temporary differences investment properties 9.9 24.4
Tax losses carry-forward not recognized(1) 278.3 253.5
Total unregognized assets 288.2 277.9
(1) This amount does not include Dutch tax losses.
The temporary differences and tax losses are mainly related to real estate operations in Germany (€62.5 million), in Poland
(€60.8 million) and in Spain (€32.6 million) and to negative fi nancial result on French SIIC entities (€117.8 million). Deferred tax
assets have not been recognised in respect of these items because it is not probable that future taxable profi t will be available to
be offset against these assets.
It is expected that the Dutch tax authorities will deny the FBI status for Unibail-Rodamco’s Dutch activities for 2010 onwards (see
section 2.1 “Accounting principles and consolidation methods” § 2.1.9 “Taxes”). The Group does not agree with this position. As at
December 2012, a deferred tax liability of €44.1 million was booked on the Dutch investment properties. A deferred tax asset for the
same amount based on tax losses was recognised. Both amounts were netted. In this context of uncertainty, no other deferred tax
asset has been recognised for signifi cant Dutch tax-loss carry forwards.
NOTE 17 – PROVISIONS
2012 Change
(€Mn) 31/12/2011 AllocationsReversals
usedReversals not used Discount
Other movements(2) 31/12/2012
Long term provisions 28.3 3.5 (1.9) (0.3) 0.3 0.3 30.2
Provisions for litigation 22.5 2.8 (1.6) (0.3) 0.3 (0.7) 23.0
Other provisions 5.9 0.7 (0.3) – – 1.0 7.2
Provisions for pension liabilities 10.9 0.4 – – – 8.7 20.0
Short term provisions 25.7 7.4 (5.7) (4.7) – (1.2) 21.5
Provisions for litigation(1) 21.0 4.9 (3.1) (3.9) – (0.5) 18.4
Other provisions 4.7 2.5 (2.6) (0.8) – (0.7) 3.1
Total 64.9 11.3 (7.6) (5.0) 0.3 7.8 71.7
(1) The allocations and reversals relate mainly to various litigations with tenants.(2) Other movements relate mainly to the allowance of provision for pension liability booked in “Other comprehensive income” and to a reversal of provision of litigation booked against investment property.
The Group is involved in legal proceedings in Austria where a tenant has obtained a court judgment limiting the amount of square
meters a certain category of retailers in the shopping centre may operate without its consent. The related risks have been taken into
account in provision for litigations and in the fair value calculation of the investment property.

CONSOLIDATED FINANCIAL STATEMENTS
CORPORATE SUSTAINABILITY
BUSINESS REVIEW AND 2012 RESULTS
PORTFOLIO
UNIBAIL-RODAMCO - FINANCIAL REPORT 2012 158 • 159
2011 Change
(€Mn) 31/12/2010 AllocationsReversals
usedReversals not used Discount
Change in scope of
consolidationOther
movements 31/12/2011
Long term provisions 24.9 6.1 (1.6) (0.8) 0.3 – (0.5) 28.3
Provisions for litigation 20.4 3.5 (1.1) (0.2) 0.3 – (0.5) 22.5
Other provisions 4.5 2.5 (0.5) (0.6) – – – 5.9
Provisions for pension liabilities 13.6 0.2 (2.0) (2.1) – 1.8 (0.6) 10.9
Short term provisions 20.1 6.6 (6.1) (5.9) – 1.0 9.9 25.7
Provisions for litigation 15.0 2.9 (2.7) (5.4) – 1.0 10.2 21.0
Other provisions 5.1 3.7 (3.4) (0.5) – – (0.3) 4.7
Total 58.6 13.0 (9.7) (8.8) 0.3 2.8 8.8 64.9
NOTE 18 – AMOUNTS DUE ON INVESTMENTS
As at December 31, 2012, the non current amounts due on
investments mainly comprised:
• the buyout of the ground lease of Le Forum des Halles in
Paris for a discounted amount of €48.1 million;
• the deferred payment of €16.4 million of the piece of land
related to the Mall of Scandinavia project near Stockholm
which was acquired in 2011;
• the deferred payment on acquisition of stake in mfi AG for a
discounted amount of €64.6 million.
During the period, two deferred payments, due within
one year, were reallocated from non current to current
(€64 million).
The current amounts due on investments correspond
mainly to amounts due on investments on development
pipeline projects.
NOTE 19 – AMOUNTS DUE TO SUPPLIERS
AND OTHER CURRENT DEBT
Trade payables by segment (€Mn) 31/12/2012 31/12/2011
Shopping centres 44.7 59.4
Offi ces 3.5 4.5
Convention-Exhibition 57.5 39.9
Property services 5.7 5.2
Others 15.6 8.3
Total 127.0 117.3
Sundry creditors (€Mn) 31/12/2012 31/12/2011
Due to customers(1) 65.3 41.4
Due to partners(2) 75.6 8.2
Other creditors 133.1 131.2
Total 274.0 180.8
(1) This item includes eviction costs.(2) The increase of sundry creditors consists mainly of a current account between Warsaw III BV and Unibail-Rodamco SE following the investment in the Zlote Tarasy complex in Warsaw.
Other liabilities (€Mn) 31/12/2012 31/12/2011
Prepaid income(1) 164.5 180.2
Total 164.5 180.2
(1) Mainly rents received in advance.
NOTE 20 – TAX AND SOCIAL SECURITY LIABILITIES
(€Mn) 31/12/2012 31/12/2011
Tax liabilities(1) 14.5 –
Total non current 14.5 –
Social security liabilities 41.1 37.6
Value-added tax 77.8 66.3
Income tax due 26.8 13.8
Other tax liabilities 0.7 4.4
Total current 146.4 122.2
(1) This item relates to the entry into the SIIC regime of some French assets of the Simon Ivanhoe portfolio.
2.5.3. Notes to the consolidated statement
of comprehensive income
NOTE 21 – GROSS RENTAL INCOME
Rental income consists of rents and similar income (e.g.
occupancy compensation, key money, parking revenues)
invoiced for Shopping centres and Offi ces properties over the
period. The effects of rent-free periods, step rents and key
monies are spread over the fi xed term of the lease.
The property management fees reinvoiced to the tenants
are classifi ed in gross rental income.
Rental income from the Convention-Exhibition segment
includes turnover generated by the rental of exhibition space
and the provision of unavoidable associated support services
to this space.
Charges invoiced to tenants are not included in rental
income but deducted from net service charge expenses.

REPORT OF THE CHAIRMAN OF THE SUPERVISORY BOARD
LEGAL INFORMATION
FINANCIAL REPORT 2012 - UNIBAIL-RODAMCO 158 • 159
NOTE 22 – GROUND RENTS PAID
Ground rents correspond to lease payments (or
straightlining of initial payments) for properties built on
land subject to a leasehold or operated under an operating
contract (concession). This item mainly applies to the French
conventions and exhibitions venues of Le Bourget and Porte
de Versailles and to some shopping centres, in particular
Euralille and Carrousel du Louvre in France.
NOTE 23 – NET SERVICE CHARGE EXPENSES
These expenses are net of charges re-invoiced to tenants
and relate mainly to vacant premises.
NOTE 24 – PROPERTY OPERATING EXPENSES
These expenses comprise service charges borne by the
owner, works-related expenses, litigation expenses, charges
relating to doubtful accounts and expenses relating to
property management.
NOTE 25 – ADMINISTRATIVE EXPENSES
This item comprises personnel costs, head offi ce and
Group administrative expenses, expenses relating to
development projects and depreciation charges for Unibail-
Rodamco’s headquarters.
NOTE 26 – ACQUISITION AND RELATED COSTS
These are costs incurred for business combinations.
In 2012, they represent mainly the costs incurred following
the creation of a 50-50 joint venture in Parly 2 shopping centre,
in Paris region (see section 2.4 “Highlights and comparability
of the last two years”, in 2012 § “Parly 2 shopping centre”).
NOTE 27 – NET OTHER INCOME
Revenues from other activities cover:
• fees for property services received by companies in the
Convention-Exhibition segment;
• fees for property management and maintenance services
provided to Offi ces and Shopping centres. These fees are
invoiced by property service companies for their property
management activities on behalf of owners outside the
Group;
• fees invoiced for leasing activity and for project development
and consulting services. These fees are capitalised by the
company owning the asset. The internal margins generated
on these leasing, construction and renovation operations
are eliminated;
• revenues from other property services, mainly invoiced by
Unibail Marketing & Multimedia in France;
• revenues from residual fi nancing leases, which comprise
lease payments net of related amortisation costs.
Other expenses comprise charges relating to property
services, general costs and depreciation charges for related
fi xed assets.
NOTE 28 – RESULT ON DISPOSAL OF INVESTMENT
PROPERTIES
Proceeds from the disposal of investment properties
correspond to the disposal price received net of disposal
costs. The carrying value of disposed assets corresponds
to the market value recorded on the closing statement of
fi nancial position for the previous fi nancial year, plus works
costs and capitalised expenses for the period and adjusted
for reversals of remaining amounts of rent-free periods and
step rents straightlined (see section 2.4 “Highlights and
comparability of the last two years”, in 2012 § “Disposals” ).
NOTE 29 – RESULT ON DISPOSAL OF SHARES
This item corresponds to the disposal of investment
properties through a share deal (see section 2.4 “Highlights
and comparability of the last two years”, in 2012 § “Parly 2
shopping centre”).
NOTE 30 – VALUATION MOVEMENTS
This item refl ects changes in market valuation of
investment properties and impairment on intangible assets.
(€Mn) 2012 2011
Shopping centres 1,284.0 776.8
Offi ces (105.9) (26.0)
Convention-Exhibition 25.1 78.4
Total 1,203.2 829.2
NOTE 31 – NET FINANCING COSTS
(€Mn) 2012 2011
Security transactions 1.5 0.5
Other fi nancial interest 11.9 20.8
Interest income on caps and swaps 80.2 60.5
Currency gains – 0.2
Total fi nancial income 93.6 81.9
Security transactions (3.0) (5.5)
Interest on bonds (248.2) (201.2)
Interest and expenses on borrowings (67.6) (100.4)
Interest on partners’ advances (25.2) (25.6)
Other fi nancial interest (4.1) (3.6)
Interest expenses on caps and swaps (128.9) (91.2)
Sub-total fi nancial expenses (477.1) (427.4)
Capitalised fi nancial expenses 55.0 44.4
Total fi nancial expenses (422.1) (383.0)
Net fi nancial expenses (328.6) (301.1)

CONSOLIDATED FINANCIAL STATEMENTS
CORPORATE SUSTAINABILITY
BUSINESS REVIEW AND 2012 RESULTS
PORTFOLIO
UNIBAIL-RODAMCO - FINANCIAL REPORT 2012 160 • 161
NOTE 32 – FAIR VALUE ADJUSTMENTS OF DERIVATIVES
AND DEBT
During 2012, fair value adjustments of derivatives and debt
mainly comprised:
• changes in fair value of derivatives (caps and swaps) which
generated a loss of €195.3 million;
• the derivatives cancellation which generated a loss of
€19.2 million;
• the amortisation of the fair value of the debt recognised at
the entry of Rodamco in 2007 for an amount of €7.2 million;
• the amortisation of the hedging reserve which generated a
profi t of €0.2 million;
• and other minor items for €2.1 million.
NOTE 33 – DEBT DISCOUNTING
This item records the discounting of long term provisions
and liabilities, according to their scheduled term.
NOTE 34 – SHARE OF THE RESULT OF ASSOCIATES
AND INCOME ON FINANCIAL ASSETS
This item breaks down as follows:
(€Mn)Recurring activities
Non-recurring activities Result
Income from stake in shopping centres companies consolidated under equity method 7.4 64.7(1) 72.1
Income from stake in Comexposium Group consolidated under equity method 14.8 (7.0)(2) 7.8
Total share of income from companies consolidated under the equity method 22.2 57.7 79.9
Interests on the loans granted to shopping centres companies 10.6 – 10.6
Interests on the loan granted to Comexposium Group 4.8 – 4.8
Total interests on receivables on companies consolidated under the equity method 15.4 – 15.4
(1) Including a recognition of negative goodwill in connection with the Zlote Tarasy acquisition for €48.1 million (see section 2.4 “Highlights and comparability of the last two years”, in 2012 § “Zlote Tarasy complex”).(2) Depreciation of the intangible assets.
NOTE 35 – INCOME TAX EXPENSES
(€Mn) 2012 2011
Deferred and current tax on:
• Change in fair value of investment properties and impairment of intangible assets (29.8) (64.2)
• Impairment of goodwill justifi ed by taxes (26.1) (25.2)
• Other non-recurring results (1) (61.7) (17.7)
• Other recurring results (13.9) (12.4)
Allocation/reversal of provision concerning tax issues (4.5) (1.4)
Total tax (136.0) (120.9)
Total tax due (65.5) (38.7)
(1) Including an amount of exit tax of €32.3 million in 2012.
Reconciliation of effective tax rate % 2012
Profi t before tax, impairment of goodwill and result of associates 1,742.5
Income tax using the average tax rate 29.1% (507.0)
Tax exempt profi ts (SIIC) -19.0% 331.0
Non deductible costs 1.1% (19.1)
Effect of tax provisions 0.2% (4.3)
Effect of non-recognised tax losses(2) -1.1% 19.4
Effect of change in tax rates(3) -2.0% 34.4
Effect of currency translation in tax -0.1% 1.3
Other(4) -2.0% 34.4
Impairment of goodwill justifi ed by taxes(4) 1.5% (26.1)
7.8% (1) (136.0)
(1) The tax rate of 7.8% is mainly due to tax exempt profi ts in France according to SIIC regime.(2) Relates to a large extent to the effect of non recognised tax losses in The Netherlands (see note 16 “Deferred tax”).(3) The effect of change in tax rates relates to Sweden where the tax rate decreased from 26.3% to 22%.(4) This item mainly includes part of the reversal of the deferred tax liabilities of the Simon Ivanhoe assets which entered the SIIC regime in 2012 and is offset by the impairment on the related goodwill (see note 3 “Goodwill”).
NOTE 36 – NON-CONTROLLING INTERESTS
In 2012 this item mainly comprised non-controlling
interests in the following entities:
i) Several shopping centres in France (€172.3 million, mainly
Les Quatre Temps for €103.2 million and Forum des Halles
for €50.9 million);
ii) Convention-Exhibition entities (€53.5 million). This amount
takes into account a dividend contractually defi ned between
the partners of €4.5 million attributed to Unibail-Rodamco,
over and above its percentage of interest.

REPORT OF THE CHAIRMAN OF THE SUPERVISORY BOARD
LEGAL INFORMATION
FINANCIAL REPORT 2012 - UNIBAIL-RODAMCO 160 • 161
NOTE 37 – OTHER COMPREHENSIVE INCOME
In 2012, the Group opted for an early adoption of IAS 19. An
amount of -€8.1 million was booked in “other comprehensive
income”. 2011 has been restated and €3.2 million were
reclassifi ed from the “net result of the period” to the “other
comprehensive income”.
2.5.4. Notes to the consolidated statement of cash fl ows
The income tax is classifi ed under cash fl ow from operating
activities.
Net fi nancial interest payments as well as cash fl ow
relating to the purchase or sale of derivative instruments are
classifi ed as cash fl ow from fi nancing activities.
Interests received on loans granted to associates are
classifi ed in cash fl ow from operating activities.
NOTE 38 – INCOME TAX PAID
The income tax of the period is €65.5 million, of which
€ 32.3 million of exit tax, payable on four years.
The amount of exit tax paid is shown in the cash fl ow
statement on the line “Exit tax payment”.
NOTE 39 – BREAKDOWN OF ACQUISITIONS AND
DISPOSALS OF CONSOLIDATED SUBSIDIARIES
(€Mn) 2012 2011
Acquisition price of shares (1) (400.7) (361.9)
Cash and current accounts acquired (2) (81.2) 4.8
Acquisitions net of cash acquired (481.9) (357.1)
Net price of shares sold 90.5 370.2
Cash and current accounts sold 64.6 133.2
Sales net of cash sold(3) 155.1 503.4
(1) For 2012, this item refers mainly to the acquisition of a 51% stake in a holding company which now owns 91.15% of mfi AG, the acquisition of a 50% stake in the company which owns the Ruhr-Park shopping centre, and to the investment in a limited partnership which owns through its subsidiary a stake in the Zlote Tarasy complex in Warsaw. These companies are consolidated under equity method (see section 2.4 “Highlights and comparability of the last two years”, in 2012 § “Zlote Tarasy complex” and “Acquisitions of mfi AG and Ruhr-Park”).(2) In 2012, corresponds mainly to the net cash acquired during the creation of the joint venture Parly 2 and to the acquisition of the net amount of the loans and current accounts existing in Zlote Tarasy at the date of acquisition.(3) In 2012, refers to the disposals of subsidiaries following the creation of a 50-50 joint venture in Parly 2 shopping centre, Paris Region (see section 2.4 “Highlights and comparability of the last two years”, in 2012 § “Parly 2 shopping centre”).
NOTE 40 – AMOUNTS PAID FOR WORKS AND ACQUISITION
OF PROPERTY ASSETS
It comprises acquisitions and transaction capitalised costs,
works and capitalised expenses adjusted for the changes on
amounts due on investments of the period.
NOTE 41 – PROPERTY FINANCING
The increase relates mainly to a bond issued by the owner
of a shopping centre in France.
NOTE 42 – DISPOSAL OF INVESTMENT PROPERTY
This amount consists of the cash received from the net
proceeds of the investment properties disposed during the
period. The difference with the amount of €615.3 million
shown in the consolidated statement of comprehensive income
corresponds to the part of the asset Parly 2 transfers in the new
joint venture without cash impact (see section 2.4 “Highlights
and comparability of the last two years”, in 2012 § “Parly 2
shopping centre”).
NOTE 43 – DISTRIBUTION PAID TO PARENT COMPANY
SHAREHOLDERS
On April 26, 2012, the Unibail-Rodamco SE combined
Ordinary and Extraordinary General Meeting resolved to
distribute a dividend of €735.4 million (€8.00 per share)
which was paid to the shareholders on May 10, 2012.
On May 10, 2011, in accordance with the Annual General
Meeting of April 27, 2011, €735.2 million was distributed. It
corresponds to €8.00 per share, which includes a dividend of
€5.30 and a complementary distribution of €2.70 deducted
from the “distributable reserves” and the “contribution
premium”.
NOTE 44 – BORROWINGS AND FINANCIAL LIABILITIES
New fi nancing transactions in 2012 include, mainly,
€2,425 million public EMTN bonds, a €750 million of ORNANE,
commercial papers for a net amount of €403 million and bank
loans or credit facilities for €486 million.
Repayments of existing fi nancing include primarily
€574.6 million of ORNANE issued in 2009, a €500 million public
EMTN bond issued in 2005 and bank loans or credit facilities for
€1,824 million.

CONSOLIDATED FINANCIAL STATEMENTS
CORPORATE SUSTAINABILITY
BUSINESS REVIEW AND 2012 RESULTS
PORTFOLIO
UNIBAIL-RODAMCO - FINANCIAL REPORT 2012 162 • 163
NOTE 45 – FINANCIAL INCOME AND EXPENSES
They correspond to cash amounts of fi nancial interest
paid and received during the period. The fi nancial income and
expenses as reported in the Consolidated Income Statement of
the period are restated from non-cash items such as accrued
interest, amortisation of issuance costs and fi nancial interest
expenses on the ORNANE which was almost fully converted in
2012 (see section 2.4 “Highlights and comparability of the last
two years”, in 2012 § “ORNANE”).
NOTE 46 – RECONCILIATION OF CASH AT PERIOD-END
ON THE STATEMENT OF CASH FLOWS AND
CASH ON THE STATEMENT OF FINANCIAL
POSITION
(€Mn) 2012 2011
Available-for-sale investments 2.2 2.3
Cash 63.1 80.0
Current accounts to balance out cash fl ow (3.0) (5.4)
Bank overdrafts (6.0) (3.5)
Cash at period-end 56.3 73.5
2.6. Financial instruments
2.6.1. Carrying value of fi nancial instruments
per category in accordance with IAS 39 standard
L&R: Loans and Receivables
AfS: Available for Sale fi nancial assets
FAFVPL: Financial Assets at Fair Value through Profi t and Loss
FLAC: Financial Liabilities measured At Cost
FLFVPL: Financial Liabilities Assets at Fair Value through
Profi t and Loss
Year-end 2012(€Mn)
Categories in accordance with IAS 39
Carrying Amount
31/12/2012
Amounts recognised in statement of fi nancial position according to IAS 39
Fair valueAmortised
cost
Fair value recognised
in equity
Fair value recognised in profi t &
loss
Assets
Loans L&R 127.0 127.0 – – 127.0
Financial assets L&R 77.0 77.0 – – 77.0
Shares available for sale AfS 118.1 – 118.1 – 118.1
Derivatives at fair value FAFVPL 182.6 – – 182.6 182.6
Trade receivables from activity(1) L&R 184.0 184.0 – – 184.0
Other receivables(2) L&R 149.0 149.0 – – 149.0
Cash and cash equivalents FAFVPL 65.3 – – 65.3 65.3
903.0 537.0 118.1 247.9 903.0
Liabilities
Financial debts (excluding ORNANE) FLAC 11,000.4 11,000.4 – – 11,496.2
Net share settled bonds convertible into new and/or existing shares (ORNANE) FLFVPL 794.7 – – 794.7 794.7
Derivatives at fair value FLFVPL 625.3 – 3.3 622.0 625.3
Guarantee deposits FLAC 192.2 192.2 – – 192.2
Non current amounts due on investments FLAC 134.7 134.7 – – 134.7
Amounts due to suppliers and other current debt(3) FLAC 784.8 784.8 – – 784.8
13,532.1 12,112.1 3.3 1,416.7 14,027.9
(1) Excluding rent-free periods and step rents.(2) Excluding prepaid expenses, service charges due and tax receivables.(3) Excluding prepaid income, service charges billed and tax liabilities.

REPORT OF THE CHAIRMAN OF THE SUPERVISORY BOARD
LEGAL INFORMATION
FINANCIAL REPORT 2012 - UNIBAIL-RODAMCO 162 • 163
Year-end 2011(€Mn)
Categories in accordance with IAS 39
Carrying Amount
31/12/2011
Amounts recognised in statement of fi nancial position according to IAS 39
Fair valueAmortised
Cost
Fair value recognised
in equity
Fair value recognised in profi t &
loss
Assets
Loans L&R 244.5 244.5 – – 313.5
Financial assets L&R 8.8 8.8 – – 8.8
Shares available for sale AfS 113.0 – 113.0 – 113.0
Derivatives at fair value FAFVPL 84.9 – 0.6 84.3 84.9
Trade receivables from activity(1) L&R 186.8 186.8 – – 186.8
Receivable on sale of property L&R 3.4 3.4 – – 3.4
Other receivables(2) L&R 113.6 113.6 – – 113.6
Cash and cash equivalents FAFVPL 82.3 – – 82.3 82.3
837.3 557.1 113.6 166.6 906.3
Liabilities
Financial debts (excluding ORNANE) FLAC 9,880.6 9,880.6 – – 10,063.6
Net share settled bonds convertible into new and/or existing shares (ORNANE) FLFVPL 738.5 – – 738.5 738.5
Derivatives at fair value FLFVPL 369.8 – – 369.8 369.8
Guarantee deposits FLAC 182.1 182.1 – – 182.1
Non current amounts due on investments FLAC 129.3 129.3 – – 129.3
Amounts due to suppliers and other current debt(3) FLAC 566.1 566.1 – – 566.1
11,866.3 10,758.1 – 1,108.3 12,049.4
(1) Excluding rent-free periods and step rents.(2) Excluding prepaid expenses, service charges due and tax receivables.(3) Excluding prepaid income, service charges billed and tax liabilities.
“Trade receivables from activity”, “Other receivables”,
“Cash and cash equivalents” and “Amounts due to suppliers
and other current debt” mainly have short term maturity.
Consequently, their carrying value at the reporting date
approximate the fair value.
2.6.2. Fair value hierarchy of fi nancial instruments
This table splits the fi nancial instruments in assets or
liabilities into three levels:
• level 1: fi nancial instruments quoted in an active market;
• level 2: fi nancial instruments whose fair value is evidenced
by comparison with other observable current market
transactions in the same instrument (i.e. without modifi cation
or repackaging) or based on a valuation technique whose
variables include only data from observable markets;
• level 3: fi nancial instruments whose fair value is
determined in whole or in part using a valuation technique
based on assumptions that are not supported by prices
from observable current market transactions in the same
instrument (i.e. without modifi cation or repackaging) and
not based on available observable market data.
(€Mn)
Fair value measurement at 31/12/2012
Total Level 1 Level 2 Level 3
Assets
Fair value through profi t or loss
Derivatives 182.6 – 182.6 –
Available-for-sale investments 2.2 2.2 – –
Fair value through equity
Shares available for sale 118.1 118.1 – –
Total 302.9 120.3 182.6 –
Liabilities
Fair value through profi t or loss
ORNANE 794.7 794.7 – –
Derivatives 622.0 – 622.0 –
Fair value through equity
Derivatives 3.3 – 3.3 –
Total 1,420.0 794.7 625.3 –

CONSOLIDATED FINANCIAL STATEMENTS
CORPORATE SUSTAINABILITY
BUSINESS REVIEW AND 2012 RESULTS
PORTFOLIO
UNIBAIL-RODAMCO - FINANCIAL REPORT 2012 164 • 165
Net gain/loss by category
2012(in €Mn)
From interest
From subsequent measurement
Net gain/lossAt fair value
Currency translation
Impairment/reversal of impairment
Loans & receivables 8,0 – – – 8,0
Available-for-sale fi nancial assets – 1,5 – – 1,5
Financial instruments at fair value through profi t or loss (48,7) – – – (48,7
Financial liabilities at amortised cost (344,4) – – – (344,4)
(385,1) 1,5 – – (383,6)
Capitalised expenses 55,0
Other -
Net fi nancial expenses (328,6)
2011(in €Mn)
From interest
From subsequent measurement
Net gain/lossAt fair value
Currency translation
Impairment/reversal of impairment
Loans & receivables 19,2 – – – 19,2
Available for sale fi nancial assets – 0,5 – – 0,5
Financial instruments at fair value through profi t or loss (30,7) – – – (30,7)
Financial liabilities at amortised cost (334,8) – – – (334,8)
(346,3) 0,5 – – (345,8)
Capitalised expenses 44,4
Other 0,2
Net fi nancial expenses (301,1)
Unibail-Rodamco closely monitors its fi nancial risk linked
to its activity and the fi nancial instruments it uses. The Group
identifi es and evaluates regularly its different risk exposures
(liquidity, interest rates, currency exchange rates) in order to
implement the adapted strategy when necessary.
2.6.3. Credit risk
Credit risk arises from cash and equivalents as well as
credit exposures with respect to rental customers. Credit
risk is managed on a Group level. The Group structures the
level of credit risk it accepts by placing limits on its exposure
to a single counterparty, or groups of counterparties, and to
geographical and industry segments. Such risks are subject
to at least an annual review, and often more frequently.
The Group has policies in place to ensure that rental contracts
are made with customers with an appropriate credit story.
The main tenants of Unibail-Rodamco’s offi ce properties
in France are blue-chip companies. The tenants profi le
minimises insolvency risks.
In the Shopping centres segment, the risk of insolvency is
spread widely across a large number of tenants.
When tenants sign their leasing agreements, they are
required to provide fi nancial guarantees, such as deposit,
fi rst-demand guarantee or surety bond amounting to between
three and six months’ rent.
Payments for ancillary services provided by the Convention-
Exhibition segment are generally received in advance, thereby
reducing the risk of unpaid debt.
Late payment reminders are automatically issued in
respect of late payments and penalties are applied. Such late
payments are monitored by a special “default” committee in
each business segment which decides on the pre-litigious or
litigious action to be taken.
The Group applies the following rules to calculate the
provision for doubtful accounts:
• 50% of receivables due for more than three months
(calculation after preliminary deduction of deposits and
bank guarantee);
• 100% of receivables due for more than six months.

REPORT OF THE CHAIRMAN OF THE SUPERVISORY BOARD
LEGAL INFORMATION
FINANCIAL REPORT 2012 - UNIBAIL-RODAMCO 164 • 165
2.6.4. Market risk
a. Liquidity risk
The following table shows the Group’s contractually agreed interest payments and repayments of the non derivative fi nancial
liabilities and the derivatives with positive and negative fair values. Amounts in foreign currency were translated at the closing
rate at the reporting date. The payments of the fl oating-rate interests have been calculated on the basis of the last interests rates
published on December 31, 2012. Lines drawn as at December 31, 2012 are considered as drawn until maturity.
Commercial paper has been allocated at the earliest period of redemption even if they are rolled over. All other borrowings have
been allocated by date of maturity.
(€Mn)
Carrying amount(1)
31/12/2012
Less than 1 year 1 year to 5 years More than 5 years
Interest Redemption Interest Redemption Interest Redemption
Bonds, borrowings and amounts due to credit institutions
Bonds and EMTN’s (7,383.4) (228.5) (105.4) (769.5) (3,435.0) (301.9) (3,843.0)
Bank borrowings and other fi nancial liabilities (4,301.5) (55.0) (2,088.9) (97.4) (1,727.5) (742.6) (2) (485.1)
Financial derivatives
Derivative fi nancial liabilities
Interest rate derivatives without a hedging relationship (615.2) (103.1) – (326.5) – – –
Currency and interest rate derivatives in connection with fair value and cash fl ow hedges (10.1) (3.1) – (7.5) (6.9) – –
Derivative fi nancial assets
Interest rate derivatives without a hedging relationship 182.6 47.2 – 99.3 – – –
(1) Corresponds to the amount of principal debt (see note 14 “Current and non current fi nancial liabilities”).(2) Includes an amount of €710.1 million of interests on current accounts with non-controlling interests of Viparis entities, whose term is in 2107.
Unibail-Rodamco’s long term refi nancing policy consists
of diversifying the Group’s expiry schedules and fi nancial
resources. Accordingly, bonds & EMTN issues represented
60% of fi nancial nominal debt at December 31, 2012, bank
loans and overdrafts 23%, commercial paper & billets de
trésorerie 10% and convertible bonds 7%.
The commercial paper programmes are backed by
confi rmed credit lines. These credit lines protect Unibail-
Rodamco against the risk of a temporary or more sustained
absence of lenders in the short or medium term debt markets
and were provided by leading international banks.
As at December 31, 2012 the total amount of undrawn
credit lines came to €4,013 million. Subsequently to this date,
the Group cancelled €350 million of undrawn credit line due
to its cost.
b. Counterparty risk
Due to its use of derivatives to minimise its interest
and exchange rate risk, the Group is exposed to potential
counterparty defaults. The counterparty risk is the risk of
replacing the derivative transactions at current market rates
in the case of default. To limit counterparty risk, Unibail-
Rodamco relies solely on major international banks for its
hedging operations.
c. Interest rate risk management
Unibail-Rodamco is exposed to interest rate fl uctuations
on its variable rate loans. Unibail-Rodamco’s strategy
regarding interest rate risk is to minimise the impact that
changes in rates could have on earnings and cash fl ow and
optimise the overall cost of fi nancing in the medium term.
In order to implement this strategy, Unibail-Rodamco
borrows at variable rates and uses derivatives (mainly caps
and swaps) to hedge its interest rate exposure. The Group’s
market transactions are confi ned exclusively to those interest
hedging activities. All transactions are managed centrally and
independently by the Group.
Average cost of Debt
Unibail-Rodamco’s average cost of debt came to 3.4% over
2012 (3.6% over 2011). This average cost of debt results from
low coupon levels achieved in 2012 on the fi xed rate debt, the
level of margins on existing borrowings, the Group’s hedging
instruments in place, the cost of carry of the undrawn credit
lines and to a lesser extent the low interest rate environment
in 2012.

CONSOLIDATED FINANCIAL STATEMENTS
CORPORATE SUSTAINABILITY
BUSINESS REVIEW AND 2012 RESULTS
PORTFOLIO
UNIBAIL-RODAMCO - FINANCIAL REPORT 2012 166 • 167
Interest rate hedging transactions
During 2012, interest rates came down in a deteriorating
macro-economic environment.
• After reviewing the interest rate exposure of the Group
as at December 31, 2011, and in particular following the
€500 million bond issued in December 2011 which has
been kept at fi xed rate, the Group cancelled €500 million of
swaps in January 2012.
• In view of interest rates levels and of its hedging position,
Unibail-Rodamco restructured its portfolio of hedges in
2012:
– €5,500 million of existing swaps in nominal amounts have
been restructured or extended beyond 2016 to extend the
duration of the hedges of the Group;
– €400 million of swaps maturing in January 2014 were
cancelled;
– the Group entered into forward collars to hedge in
advance the years 2013 to 2016 for a notional amount of
€750 million and cancelled collars with a notional amount
of €750 million and €500 million covering 2013 and 2014
respectively.
Measuring interest rate risk
As at December 31, 2012, net fi nancial nominal debt stood at €10,969 million, excluding partners’ current accounts and after
taking cash surpluses into account (€65 million).
Financial assets Financial liabilities Net exposure
Fixed rate Variable rate Fixed rate Variable rate Fixed rate Variable rate
Less than 1 year 62.8 2.5 (876.4) (1,294.5) (813.6) (1,292.0)
1 year to 2 years – – (589.8) (509.7) (589.8) (509.7)
2 years to 3 years – – (687.0) (168.4) (687.0) (168.4)
3 years to 4 years – – (1,105.4) (386.8) (1,105.4) (386.8)
4 years to 5 years – – (1,156.9) (161.2) (1,156.9) (161.2)
More than 5 years – – (3,743.0) (354.9) (3,743.0) (354.9)
Total 62.8 2.5 (8,158.6) (2,875.5) (8,095.7) (2,873.0)
The Group doesn’t have a micro-hedging strategy, except
when both currency exchange risk and interest rate risk are
hedged, which enables it not to correlate its liquidity risk and
interest rate risk management. Consequently, the maturities
of the debts and hedging instruments can be dissociated and
the outstanding derivatives instruments can hedge a part of
the fi xed rate debt maturing in the following years.
The outstanding nominal net debt was hedged at 98%
against an increase in variable rates through both:
• Debt kept at fi xed rate;
• Hedging in place as part of Unibail-Rodamco’s macro
hedging policy.
(€Mn)
Outstanding total at 31/12/2012
Fixed rateVariable
rate(1)
Financial liabilities (8,158.6) (2,875.5)
Financial assets 62.8 2.5
Net fi nancial liabilities before hedging programme (8,095.8) (2,873.0)
Hedging 2,780.7 (2,780.7)
Net fi nancial liabilities after micro-hedging(2) (5,315.1) (5,653.7)
Swap rate hedging(3) – 4,882.0
Net debt not covered by swaps – (771.7)
Cap and fl oor hedging – 500.0
Hedging balance – (271.7)
(1) Including index-linked debt.(2) Partners’ current accounts are not included in variable-rate debt.(3) Forward hedging instruments are not accounted for in this table.
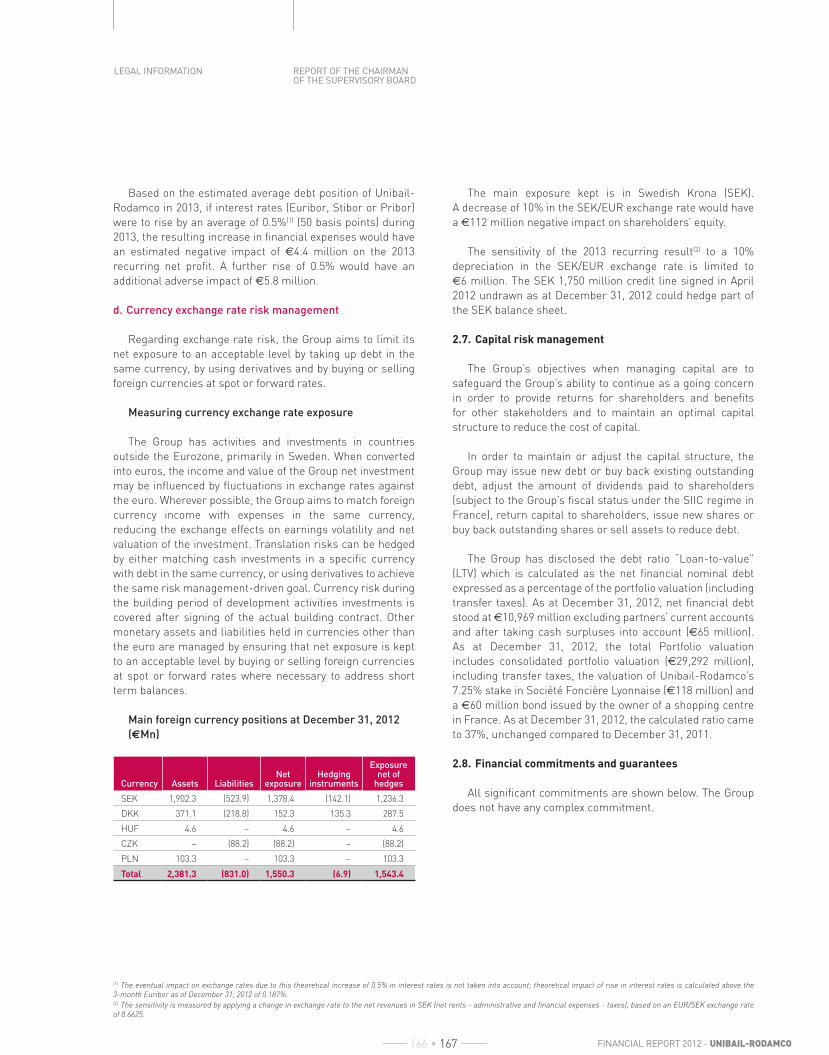
REPORT OF THE CHAIRMAN OF THE SUPERVISORY BOARD
LEGAL INFORMATION
FINANCIAL REPORT 2012 - UNIBAIL-RODAMCO 166 • 167
Based on the estimated average debt position of Unibail-
Rodamco in 2013, if interest rates (Euribor, Stibor or Pribor)
were to rise by an average of 0.5%(1) (50 basis points) during
2013, the resulting increase in fi nancial expenses would have
an estimated negative impact of €4.4 million on the 2013
recurring net profi t. A further rise of 0.5% would have an
additional adverse impact of €5.8 million.
d. Currency exchange rate risk management
Regarding exchange rate risk, the Group aims to limit its
net exposure to an acceptable level by taking up debt in the
same currency, by using derivatives and by buying or selling
foreign currencies at spot or forward rates.
Measuring currency exchange rate exposure
The Group has activities and investments in countries
outside the Eurozone, primarily in Sweden. When converted
into euros, the income and value of the Group net investment
may be infl uenced by fl uctuations in exchange rates against
the euro. Wherever possible, the Group aims to match foreign
currency income with expenses in the same currency,
reducing the exchange effects on earnings volatility and net
valuation of the investment. Translation risks can be hedged
by either matching cash investments in a specifi c currency
with debt in the same currency, or using derivatives to achieve
the same risk management-driven goal. Currency risk during
the building period of development activities investments is
covered after signing of the actual building contract. Other
monetary assets and liabilities held in currencies other than
the euro are managed by ensuring that net exposure is kept
to an acceptable level by buying or selling foreign currencies
at spot or forward rates where necessary to address short
term balances.
Main foreign currency positions at December 31, 2012
(€Mn)
Currency Assets LiabilitiesNet
exposureHedging
instruments
Exposure net of
hedges
SEK 1,902.3 (523.9) 1,378.4 (142.1) 1,236.3
DKK 371.1 (218.8) 152.3 135.3 287.5
HUF 4.6 – 4.6 – 4.6
CZK – (88.2) (88.2) – (88.2)
PLN 103.3 – 103.3 – 103.3
Total 2,381.3 (831.0) 1,550.3 (6.9) 1,543.4
The main exposure kept is in Swedish Krona (SEK).
A decrease of 10% in the SEK/EUR exchange rate would have
a €112 million negative impact on shareholders’ equity.
The sensitivity of the 2013 recurring result(2) to a 10%
depreciation in the SEK/EUR exchange rate is limited to
€6 million. The SEK 1,750 million credit line signed in April
2012 undrawn as at December 31, 2012 could hedge part of
the SEK balance sheet.
2.7. Capital risk management
The Group’s objectives when managing capital are to
safeguard the Group’s ability to continue as a going concern
in order to provide returns for shareholders and benefi ts
for other stakeholders and to maintain an optimal capital
structure to reduce the cost of capital.
In order to maintain or adjust the capital structure, the
Group may issue new debt or buy back existing outstanding
debt, adjust the amount of dividends paid to shareholders
(subject to the Group’s fi scal status under the SIIC regime in
France), return capital to shareholders, issue new shares or
buy back outstanding shares or sell assets to reduce debt.
The Group has disclosed the debt ratio “Loan-to-value”
(LTV) which is calculated as the net fi nancial nominal debt
expressed as a percentage of the portfolio valuation (including
transfer taxes). As at December 31, 2012, net fi nancial debt
stood at €10,969 million excluding partners’ current accounts
and after taking cash surpluses into account (€65 million).
As at December 31, 2012, the total Portfolio valuation
includes consolidated portfolio valuation (€29,292 million),
including transfer taxes, the valuation of Unibail-Rodamco’s
7.25% stake in Société Foncière Lyonnaise (€118 million) and
a €60 million bond issued by the owner of a shopping centre
in France. As at December 31, 2012, the calculated ratio came
to 37%, unchanged compared to December 31, 2011.
2.8. Financial commitments and guarantees
All signifi cant commitments are shown below. The Group
does not have any complex commitment.
(1) The eventual impact on exchange rates due to this theoretical increase of 0.5% in interest rates is not taken into account; theoretical impact of rise in interest rates is calculated above the 3-month Euribor as of December 31, 2012 of 0.187%.(2) The sensitivity is measured by applying a change in exchange rate to the net revenues in SEK (net rents - administrative and fi nancial expenses - taxes), based on an EUR/SEK exchange rate of 8.6625.

CONSOLIDATED FINANCIAL STATEMENTS
CORPORATE SUSTAINABILITY
BUSINESS REVIEW AND 2012 RESULTS
PORTFOLIO
UNIBAIL-RODAMCO - FINANCIAL REPORT 2012 168 • 169
2.8.1. Commitments given
Commitments given (€Mn) Description Maturities 31/12/2012 31/12/2011
1) Commitments related to the scope of the consolidated Group 423.7 191.1
Commitments for acquisitions • purchase undertakings and earn-out(1) 2013 380.9 157.4
Commitments given as part of specifi c operations • liability warranties 2013+ 42.8 33.8
2) Commitments related to Group fi nancing 1,130.3 1,077.1
Financial guarantees given • mortgages and fi rst lien lenders(2) 2013 to 2018 1,130.3 1,077.1
3) Commitments related to Group operational activities 1,379.4 1,624.9
Commitments related to development activities • properties under construction: residual commitments for works contracts and forward purchase agreements(3) 2013 to 2017 1,024.2 1,322.4
• residual commitments for other works contracts 2013 and 2014 25.5 19.6
• commitments with precedent conditions(4) 2013 and 2014 130.7 105.1
Commitments related to operating contracts • commitments for construction works(5) 2013 to 2026 138.9 144.9
• rental of premises and equipment 2013 to 2048 8.2 9.5
• others 51.9 23.4
Total commitments given 2,933.5 2,893.1
(1) This amount mainly relates to the acquisition of a 50,01% stake in the development project “Polygone Riviera”.(2) Discloses the outstanding balances at the reporting date of the debts and credit lines which are guaranteed by mortgages. The gross amount of mortgages contracted, before taking into account subsequent debt reimbursement and unused credit lines, was €1,253.1 million at December 31, 2012 (€1,353.6 million at December 31, 2011).(3) Includes commitments related to the construction of new or extension of existing shopping centres and offi ces, particularly the Majunga offi ce in La Défense, the shopping centres Forum des Halles in Paris, Aéroville in Paris region, as well as Mall of Scandinavia and Täby Centrum in Stockholm.(4) Mainly commitments given for purchase price for land acquisition in the Oceania project at Valencia in Spain, for Val Tolosa project in Toulouse and for the Majunga project in Paris-La Défense, in France.(5) Related to the commitment to carry out maintenance and refurbishment works under the contract of the exhibition site Porte de Versailles in Paris.
Other unquantifi able commitments given related
to the scope of the consolidated Group
• For a number of recent acquisitions of properties in
France, Unibail-Rodamco has committed to the French
tax authorities to retain these interests during at least fi ve
years, in accordance with the SIIC tax regime.
• As part of the agreements signed on November 29, 2010
between the CCIP and Unibail-Rodamco to create Viparis
and Comexposium, Unibail-Rodamco has committed to
retain its interests in shared subsidiaries until 2015. The
CCIP has a right of fi rst choice and a right of joint sale.
Other unquantifi able commitments given related to Group
operational activities
• As part of the Forum des Halles shopping centre project,
the Group’s 65% subsidiary SCI du Forum des Halles de
Paris has committed to pay to the City of Paris a conditional
earn-out in 2019.
• The Group’s 50% subsidiary SCI Propexpo has committed
that the Espace Champerret venue in Paris, France, will
continue to be used as an exhibition hall through to 2066.
• The French companies of the Group which are eligible
for SIIC tax status have opted for this regime. Recurring
income and capital gains are exempted from French tax but
companies are required to distribute 85% of their recurring
income, 50% of capital gains and 100% of dividends received
from SIIC subsidiaries. An amount of €500.3 million is due
in terms of dividend distribution obligation for 2012.
• The Group has committed until 2028 to purchase from
management and employees of the Comexposium Group,
which is consolidated under the Equity Method, preferred
shares which they may hold in Comexposium Holding SA
as a result of the Comexposium Group’s stock option plan.
The CCIP is also a party to this commitment.
• In connection with the acquisition of a limited partnership
owning through its subsidiary Warsaw III B.V. the
Zlote Tarasy complex (see section 2.4 “Highlights and
comparability of the last two years”, in 2012 § “Zlote Tarasy
complex”), the Group undertook to reimburse the developer
for payments the developer would be required to make to
the fund managed by CBRE Global Investors if Warsaw III
did not make such payments.
These payment obligations of Warsaw III to this fund
consist of:
– payment on a quarterly basis of the fund’s pro-rata share
of the net revenue of the retail premises and the parking,
– payment of the fund’s prorata share of the “Open Market
Value” of the Zlote Tarasy shopping centre and parking,
as determined by three independent experts no later than
December 31, 2016.
The obligation to the developer expires upon the earlier to
occur of (i) December 31, 2016 or (ii) repayment of the fund
participating loan by Warsaw III prior to December 31, 2016.

REPORT OF THE CHAIRMAN OF THE SUPERVISORY BOARD
LEGAL INFORMATION
FINANCIAL REPORT 2012 - UNIBAIL-RODAMCO 168 • 169
2.8.2. Commitments received
Commitments received (€Mn) Description Maturities 31/12/2012 31/12/2011
1) Commitments related to the scope of the consolidated Group 75.9 10.0
Commitments for acquisitions • sales undertakings 5.1 –
Commitments received as part of specifi c operations • liability warranties(1) 2013 and 2014 70.8 10.0
2) Commitments related to Group fi nancing 4,013.0 3,223.4
Financial guarantees received • refi nancing agreements obtained but not used(2) 2013 to 2017 4,013.0 3,223.4
3) Commitments related to Group operational activities 565.9 573.5
Other contractual commitments received related to operations • bank guarantees on works and others 2013+ 21.0 55.5
• others 2013 to 2020 106.4 60.2
Assets received as security, mortgage or pledge, as well as guarantees received
• guarantees received relating to Hoguet regulation 2013 100.7 111.7
• guarantees received from tenants 2013 to 2023 239.3 232.5
• guarantees received from contractors on works 2013 to 2015 98.5 113.5
Total commitments received 4,654.8 3,806.9
(1) Related to warranties received from vendors, mainly following the acquisition of a stake of 51% in the Holding company which owned 91.15% of mfi AG and, following the acquisition of an additional 50% stake in the company owner of the asset Aupark shopping and entertainment centre in Bratislava, Slovakia.(2) These agreements are usually accompanied by a requirement to meet specifi c target ratios based on revalued shareholders’ equity, Group portfolio valuation and debt. Certain credit lines are also subject to an early prepayment clause (in full or in part) in the event of a change in ownership or a series of disposals reducing portfolio assets below a given threshold. Based on current forecasts, excluding exceptional circumstances, these thresholds on target ratios are not expected to be attained during the current year. A total amount of €452 million is guaranteed by mortgages. Subsequently to December 31, 2012, the Group cancelled €350 million of undrawn credit line.
Other unquantifi able commitments received related
to the scope of the consolidated Group
• As part of the agreements signed on November 29, 2010
between the CCIP and Unibail-Rodamco to create Viparis
and Comexposium, the CCIP has committed to retain its
interests in shared subsidiaries until 2015. Unibail-Rodamco
has a right of fi rst choice and a right of joint sale. Finally, the
CCIP accorded to the SCI Propexpo, a 50% subsidiary of the
Group, a right of preferential purchase on its property rights
in the areas of the Palais des Congrès de Paris and the Parc
des Expositions de Paris-Nord Villepinte in France.
Commitments relating to operating leases
General overview of the main provisions of lease
agreements
In France, commercial lease agreements are covered by
articles L.145-1 to L.145-60 of the French Commercial Code.
The minimum term of the lease is nine years and the tenant
has the exclusive right to terminate the agreement at the end
of each optional three-year break period subject to giving six
months’ notice by extrajudicial agreement. However, lease
contracts can provide for waiving of this three-year break
provision.
Rents are usually received quarterly in advance and are
annually indexed to the INSEE retail rental index (ILC or ILAT) or
construction cost index (ICC). Rents may be stepped or constant
and can include rent-free periods or step rents. The level of rent
is determined at the time the lease agreement is signed and
remains in force for the term of the lease. All charges, including
land duties and offi ce tax, are usually paid by the tenant, unless
stated otherwise in the lease agreement. In the case of shopping
centres, rent is based on a minimum guaranteed rent, indexed
and established so that the variable turnover based part of rents
represents a small part of total rents. In 2012, variable rents
accounted for just 1.8% of total rents.
In Sweden, commercial lease agreements are covered
by Chapter 12 of the Code of Land Laws. There is no
minimum term of the lease, however three to fi ve years is
standard practice with a right to prolong the lease. Rents
are usually received quarterly in advance and historically
include all charges, such as tax and costs for the operation
of the shopping centre. However, new leases exclude services
charges which are invoiced separately.
In the Czech Republic, commercial lease agreements
are regulated mainly by Act No. 116/1990 Coll. on the lease
and sublease of non-residential premises. A commercial
lease can be entered into either for a defi nite term or for an
indefi nite term with a right to terminate. Unless such option is
granted, the lessee has no legal right to renewal.
Rents are expressed in euros, and are usually paid in CZK
quarterly in advance.
In Poland, commercial lease agreements are regulated by
articles 659-692 of the Polish Civil Code. Lease agreement
can be concluded for a specifi ed period of time (usually 5
years) or indefi nite period of time. Rents are expressed in
euros, and usually received in zloty monthly in advance and
are annually indexed to the European HICP index.

CONSOLIDATED FINANCIAL STATEMENTS
CORPORATE SUSTAINABILITY
BUSINESS REVIEW AND 2012 RESULTS
PORTFOLIO
UNIBAIL-RODAMCO - FINANCIAL REPORT 2012 170 • 171
In The Netherlands, commercial lease agreements are
covered by the regime set out in articles 290 and following of
book 7 of the Dutch Civil Code. By law, the lease agreement
in principle applies for a period of fi ve years. After expiry of
this fi ve year period, the lease is extended by operation of law
for another period of 5 years and thereafter implicitly on an
annual basis. A landlord has in principle very few rights to
terminate. A landlord requires the verdict of a cantonal court
for those terminations. Rents are usually received quarterly
in advance.
In Austria, commercial lease agreements are covered by
articles 1090 to 1121 of the Austrian Civil Code. The average
term of the lease agreement is 7-10 years and the agreement
expires at the end of this period without any need of action by
landlord or tenant. However, lease agreements can provide
for options which can be exercised by the tenant in order to
prolong the term of the lease agreement. Rents are received
monthly in advance.
In Spain, commercial lease agreements are covered mainly
by The Urban Lease Act, passed on November 24, 1994. In this
regard, parties may freely agree almost all the clauses of the
agreement except for the mandatory legal deposit delivered
by the tenant and amounting two months rent. The term of
most of the leases may be freely agreed by the parties and
usually comes to fi ve years in Unibail-Rodamco’s shopping
centres. The rents are usually received monthly in advance.
Minimum guaranteed rents under leases
As at December 31, 2012, minimum future rents due under
leases until the next possible termination date break down as
follows:
Minimum future rents per year (in €Mn)
YearShopping centres Offi ces Total
2013 1,002.1 171.4 1,173.4
2014 796.8 145.7 942.6
2015 563.5 121.7 685.2
2016 367.8 82.4 450.2
2017 267.1 72.6 339.6
2018 197.4 60.3 257.7
2019 132.4 24.8 157.3
2020 98.0 11.0 109.0
2021 73.1 6.7 79.8
2022 52.5 4.2 56.6
2023 37.4 1.5 38.9
Beyond 111.8 12.6 124.4
Total 3,699.8 714.9 4,414.8
2.9. Employee remuneration and benefi ts
2.9.1. Personnel costs
(€Mn) 2012 2011
Head and regional offi ce personnel costs 85.3 83.4
Personnel costs for property services activities 21.2 23.4
Personnel costs for Convention-Exhibition centre management activities 32.4 31.1
Employee benefi ts(1) 7.1 6.9
Total 146.0 144.8
(1) Expenses relating to the Company Savings Plan, stock options and performance shares, recognised with an equivalent increase in equity.
Employee profi t sharing
Employees belonging to the UES (Unité Économique et
Sociale - Social and Economic Group) comprising Unibail
Management and Espace Expansion, and employees of
Unibail-Rodamco SE benefi t from a common employee
profi t-sharing plan and a common profi t-sharing agreement
introduced in 2002 and renewed in 2011. The profi t-sharing
agreement is based on the annual growth of the net recurring
result, weighted for the activity in France and adjusted for
indexation.
Employees belonging to the UES Viparis benefi t from an
employee profi t-sharing plan and a profi t-sharing agreement
renewed in 2011 based on growth in net operating income.
The following amounts were allocated to these schemes:
(€Mn) 2012 2011
Regulated employee profi t-sharing plan 3.1 3.1
Employee profi t-sharing agreement 1.2 0.6
2.9.2. Number of employees
The average number of employees of the Group’s
companies breaks down as follows:
Regions 2012 2011
France(1) 1,046 1,015
Spain 147 135
Central Europe 74 76
Austria 68 67
Nordic countries 99 110
The Netherlands 62 61
Total 1,496 1,464
(1) Of which Viparis: 388/398.

REPORT OF THE CHAIRMAN OF THE SUPERVISORY BOARD
LEGAL INFORMATION
FINANCIAL REPORT 2012 - UNIBAIL-RODAMCO 170 • 171
2.9.3. Employee benefi ts
Pension Plan
The majority of the Group’s pension schemes are defi ned
contribution plans. The Dutch group companies have pension
plans with both defi ned benefi t as well as defi ned contribution
components.
The defi ned benefi t is based on a fi xed percentage of an
annual salary set at a certain amount as of April 1, 2012
and increased annually in line with consumer price index,
multiplied by the years of service. The employer strives to
revalue the accrued benefi ts and pensions in payment in line
with consumer price index. However, the revaluation will be
limited to the excess return of assets.
(€Mn) 31/12/2012 31/12/2011
Benefi t obligations 50.2 39.0
Fair value of plan assets (34.9) (31.3)
Net liabilities at year-end 15.3 7.7
Change in net liability (€Mn) 31/12/2012 31/12/2011
Net liability at the beginning of the year 7.7 10.4
Net expense recognised in profi t or loss 0.7 0.9
Gains/losses recognised in Other Comprehensive Income 7.5 (3.0)
Employer contributions (0.6) (0.6)
Net liability at the end of the year 15.3 7.7
Change in benefi t obligation (€Mn) 31/12/2012 31/12/2011
Benefi t obligation at the beginning of the year 39.0 40.5
Service cost 0.4 0.4
Interest cost 1.8 1.8
Plan members’ contributions 0.1 0.1
Actuarial loss 9.9 (2.7)
Benefi ts paid (1.0) (1.1)
Benefi t obligation at the end of the year 50.2 39.0
Change in plan assets (€Mn) 31/12/2012 31/12/2011
Fair value of plan assets at the beginning of the year 31.3 30.1
Expected return on plan assets (interest income) 1.4 1.4
Actuarial gain/loss 2.4 0.4
Employer contributions 0.6 0.6
Member contributions 0.1 0.1
Benefi ts paid from plan/company (1.0) (1.2)
Fair value of plan assets at the end of the year 34.9 31.3
Market value of each asset category (€Mn) 31/12/2012 31/12/2011
Equities 7.9 7.2
Bonds 27.0 24.2
Cash – –
Net assets 34.9 31.3
The portfolio is structured as a “separate account”. The
investment mandate with Aegon for Unibail-Rodamco has the
following Strategic Asset Allocation (periodically rebalanced):
• Strategic Allocation Fund Equity: 22.8%;
• Strategic Allocation Fund Fixed Income: 59.8%;
• Strategic Allocation Fund Income Long duration: 17.4%.
Main actuarial assumptions 31/12/2012 31/12/2011
Discount rate 3.50% 4.60%
Long-term rate of return on assets 3.50% 4.60%
Salary increase 3.25% 3.25%
Pension increase 2.25% 2.25%
Infl ation 2.25% 2.25%
Cost loading Service Costs 2.53% 2.53%
Cost loading Defi ned benefi t Obligation 1.25% 1.25%
Sensitivity of results to actuarial assumptions
This section illustrates the sensitivity of the defi ned
obligation at December 31, 2012 and the service cost at the
beginning of the fi nancial year ending December 31, 2013 to
the discount rate plus 0.50% and to the discount rate minus
0.50%. These same shifts have been applied in separate
sensitivity analyses to price infl ation/future pension increases
and future salary increases. The defi ned benefi t obligation
and the service cost under the base scenario are compared
to the corresponding amounts with the assumptions shifted
plus and minus 0.50% as shown in the following table.
(€Mn)
Total Defi ned Benefi t Obligation
31/12/2012Service
Cost – 2013
Base Scenario 50.2 0.7
Discount rate -/-0.50% 55.8 0.8
Discount rate +/+0.50% 45.3 0.6
Future pensions increase -/- 0.50% 44.9 0.6
Future pensions increase +/+ 0.50% 55.7 0.8
Future salaries increase -/- 0.50% 50.0 0.7
Future salaries increase +/+ 0.50% 50.3 0.7
Based on the discounts rate sensitivity shown above, the
duration of liabilities is approximately 21 years and the cost
duration approximately 33 years.
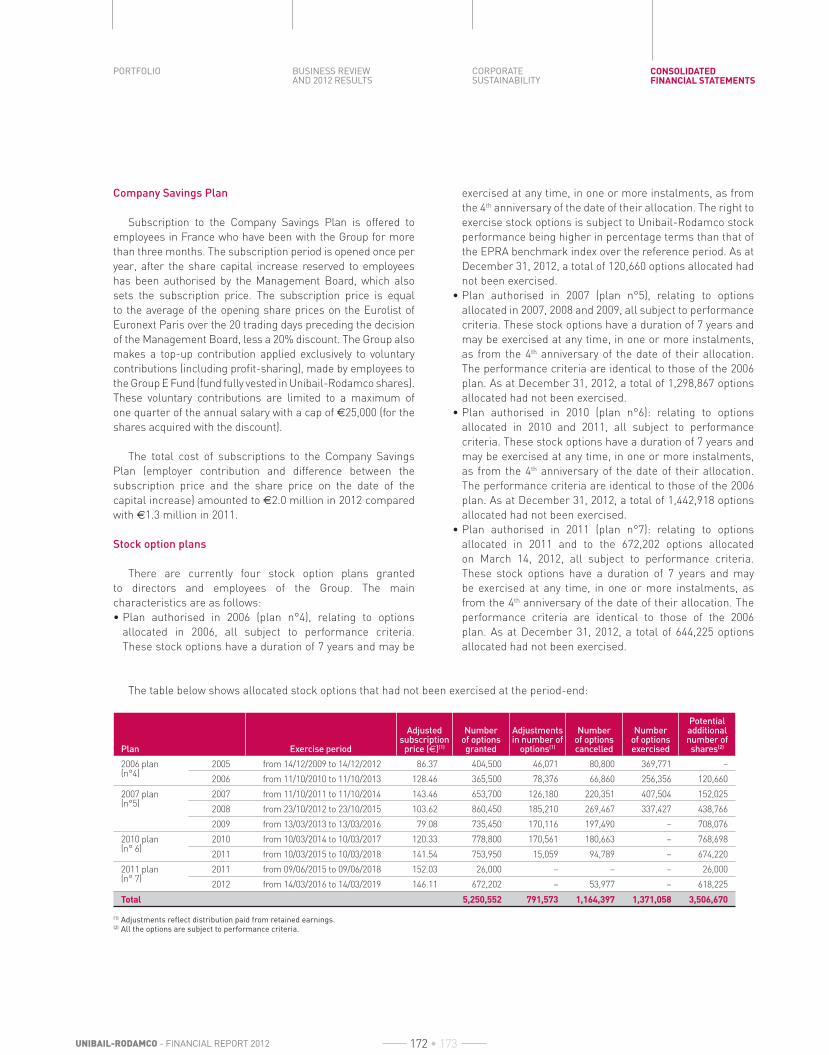
CONSOLIDATED FINANCIAL STATEMENTS
CORPORATE SUSTAINABILITY
BUSINESS REVIEW AND 2012 RESULTS
PORTFOLIO
UNIBAIL-RODAMCO - FINANCIAL REPORT 2012 172 • 173
Company Savings Plan
Subscription to the Company Savings Plan is offered to
employees in France who have been with the Group for more
than three months. The subscription period is opened once per
year, after the share capital increase reserved to employees
has been authorised by the Management Board, which also
sets the subscription price. The subscription price is equal
to the average of the opening share prices on the Eurolist of
Euronext Paris over the 20 trading days preceding the decision
of the Management Board, less a 20% discount. The Group also
makes a top-up contribution applied exclusively to voluntary
contributions (including profi t-sharing), made by employees to
the Group E Fund (fund fully vested in Unibail-Rodamco shares).
These voluntary contributions are limited to a maximum of
one quarter of the annual salary with a cap of €25,000 (for the
shares acquired with the discount).
The total cost of subscriptions to the Company Savings
Plan (employer contribution and difference between the
subscription price and the share price on the date of the
capital increase) amounted to €2.0 million in 2012 compared
with €1.3 million in 2011.
Stock option plans
There are currently four stock option plans granted
to directors and employees of the Group. The main
characteristics are as follows:
• Plan authorised in 2006 (plan n°4), relating to options
allocated in 2006, all subject to performance criteria.
These stock options have a duration of 7 years and may be
exercised at any time, in one or more instalments, as from
the 4th anniversary of the date of their allocation. The right to
exercise stock options is subject to Unibail-Rodamco stock
performance being higher in percentage terms than that of
the EPRA benchmark index over the reference period. As at
December 31, 2012, a total of 120,660 options allocated had
not been exercised.
• Plan authorised in 2007 (plan n°5), relating to options
allocated in 2007, 2008 and 2009, all subject to performance
criteria. These stock options have a duration of 7 years and
may be exercised at any time, in one or more instalments,
as from the 4th anniversary of the date of their allocation.
The performance criteria are identical to those of the 2006
plan. As at December 31, 2012, a total of 1,298,867 options
allocated had not been exercised.
• Plan authorised in 2010 (plan n°6): relating to options
allocated in 2010 and 2011, all subject to performance
criteria. These stock options have a duration of 7 years and
may be exercised at any time, in one or more instalments,
as from the 4th anniversary of the date of their allocation.
The performance criteria are identical to those of the 2006
plan. As at December 31, 2012, a total of 1,442,918 options
allocated had not been exercised.
• Plan authorised in 2011 (plan n°7): relating to options
allocated in 2011 and to the 672,202 options allocated
on March 14, 2012, all subject to performance criteria.
These stock options have a duration of 7 years and may
be exercised at any time, in one or more instalments, as
from the 4th anniversary of the date of their allocation. The
performance criteria are identical to those of the 2006
plan. As at December 31, 2012, a total of 644,225 options
allocated had not been exercised.
The table below shows allocated stock options that had not been exercised at the period-end:
Plan Exercise period
Adjusted subscription
price (€)(1)
Number of options granted
Adjustments in number of
options(1)
Number of options cancelled
Number of options exercised
Potential additional number of shares(2)
2006 plan(n°4)
2005 from 14/12/2009 to 14/12/2012 86.37 404,500 46,071 80,800 369,771 –
2006 from 11/10/2010 to 11/10/2013 128.46 365,500 78,376 66,860 256,356 120,660
2007 plan(n°5)
2007 from 11/10/2011 to 11/10/2014 143.46 653,700 126,180 220,351 407,504 152,025
2008 from 23/10/2012 to 23/10/2015 103.62 860,450 185,210 269,467 337,427 438,766
2009 from 13/03/2013 to 13/03/2016 79.08 735,450 170,116 197,490 – 708,076
2010 plan(n° 6)
2010 from 10/03/2014 to 10/03/2017 120.33 778,800 170,561 180,663 – 768,698
2011 from 10/03/2015 to 10/03/2018 141.54 753,950 15,059 94,789 – 674,220
2011 plan(n° 7)
2011 from 09/06/2015 to 09/06/2018 152.03 26,000 – – – 26,000
2012 from 14/03/2016 to 14/03/2019 146.11 672,202 – 53,977 – 618,225
Total 5,250,552 791,573 1,164,397 1,371,058 3,506,670
(1) Adjustments refl ect distribution paid from retained earnings.(2) All the options are subject to performance criteria.

REPORT OF THE CHAIRMAN OF THE SUPERVISORY BOARD
LEGAL INFORMATION
FINANCIAL REPORT 2012 - UNIBAIL-RODAMCO 172 • 173
The table below shows the number and weighted average
exercise prices of stock options:
2012 2011
Number
Weighted average price (€) Number
Weighted average price (€)
Outstanding at the beginning of the period 4,112,920 116.80 3,649,671 112.24
Allocated over the period 672,202 146.11 779,950 141.89
Adjusted over the period – – 84,472 116.36
Cancelled over the period (247,880) 123.10 (231,710) 113.02
Exercised over the period (1,030,572) 123.34 (169,463) 93.08
Average share price on date of exercise – 166.49 – 151.69
Outstanding at the end of the period 3,506,670 120.05 4,112,920 116.80
Of which exercisable at the end of the period(1) 711,451 116.35 978,093 134.15
(1) The right to exercise is subject to meeting the following performance condition: the overall market performance of Unibail-Rodamco must be higher in percentage terms than the performance of the EPRA reference index over the reference period.
Stock options are accounted for in accordance with IFRS 2
(see section 2.1 “Accounting principles and consolidation
methods” § 2.1.10). The expense recorded on the income
statement in relation to stock options came to €5.3 million in
2012 and €5.8 million in 2011.
The performance-related stock-options allocated in
March 2012 were valued at €9.86 using a Monte Carlo model.
This valuation is based on an initial exercise price of €146.11,
a share price at the date of allocation of €153.25, a vesting
period of four years, an estimated duration of 4.7 years, a
market volatility of 23.6%, a dividend representing 6.4% of the
share value, a risk-free interest rate of 1.6% and a volatility
of EPRA index of 25.2% with a correlation EPRA/Unibail-
Rodamco of 89.5%.
The performance-related stock-options allocated in
March and June 2011 were respectively valued at €10.33 and
€11.19 using a Monte Carlo model. This valuation is based on
an initial exercise price of €144.37 and €152.03, a share price
at the date of allocation of €147.60 and €153.15, a vesting
period of four years, an estimated duration of 4.7 years, a
market volatility of 23.5% and 23.7%, a dividend representing
6.4% of the share value, a risk-free interest rate of 2.7% and
2.6% and a volatility of EPRA index of 24.4% and 22.6% with a
correlation EPRA/Unibail-Rodamco of 87.6% and 87.5%.
The performance-related stock options allocated in 2010
were valued at €8.67 using a Monte Carlo model. This valuation
is based on an initial exercise price of €148.32, a share price
at the date of allocation of €154.10, a vesting period of four
years, an estimated duration of 4.7 years, a market volatility
of 24.2%, a dividend representing 6.4% of the share value, a
risk-free interest rate of 1.8% and a volatility of EPRA index
of 31.0% with a correlation EPRA/Unibail-Rodamco of 85.9%.
The performance-related stock options allocated in 2009
were valued at €6.50 using a Monte Carlo model. This valuation
is based on an initial exercise price of €99.42, a share price at
the date of allocation of €98.79, a vesting period of four years,
an estimated duration of 4.7 years, a market volatility of 23.3%,
a dividend representing 8% of the share value, a risk-free
interest rate of 2.8% and a volatility of EPRA index of 18.5%
with a correlation EPRA/Unibail-Rodamco of 84.5%.
The performance-related stock options allocated in
2008 were valued at €8.50 using a Monte Carlo model.
This valuation is based on an initial exercise price of €130.27,
a share price at the date of allocation of €113.88, a vesting
period of four years, an estimated duration of 4.7 years, a
market volatility of 22.4%, a dividend of €7, plus year-growth
of 8% in 2009 and 10% the following years, a risk-free interest
rate of 3.5% and a volatility of EPRA index of 17.6% with a
correlation EPRA/Unibail-Rodamco of 86.2%.
The performance-related stock options allocated in
2007 were valued at €14.70 using a Monte Carlo model.
This valuation is based on an initial exercise price of €180.36, a
share price at the date of allocation of €184.60, a vesting period
of four years, an estimated duration of 4.7 years, a market
volatility of 21%, a dividend of €7, plus year-growth of 10%, a
risk-free interest rate of 4.29% and a volatility of EPRA index
of 12.5% with a correlation EPRA/Unibail-Rodamco of 98.2%.
The performance-related stock options allocated in
2006 were valued at €11.70 using a Monte Carlo model.
This valuation is based on an initial exercise price of €161.50,
a share price at the date of allocation of €167.40, a vesting
period of four years, an estimated duration of 4.7 years, a
market volatility of 19.6%, a dividend of 3.85% of the value
of the share, a risk-free interest rate of 3.72% and a volatility
of EPRA index of 12.3% with a correlation EPRA/Unibail-
Rodamco of 98.2%.
Stock options allocated in 2005 were valued at €13.90
using a binomial model for the unconditional scheme and
€6.90 using a Monte Carlo model for performance-related
options.
Performance shares plan
On April 26, 2012, 44,975 performance shares were
allocated, all subject to performance criteria. After the
cancellation of 3,612 shares, 41,363 are outstanding at
December 31, 2012.

CONSOLIDATED FINANCIAL STATEMENTS
CORPORATE SUSTAINABILITY
BUSINESS REVIEW AND 2012 RESULTS
PORTFOLIO
UNIBAIL-RODAMCO - FINANCIAL REPORT 2012 174 • 175
These awards were valued, using a Monte Carlo model, at
€71.38 for the French tax residents benefi ciaries and €75.03
for the others benefi ciaries. This valuation is based on a share
price at the date of allocation of €143.25, a vesting period of
four years, a market volatility of 24.3%, a volatility of EPRA
index of 25.2% with a correlation EPRA/Unibail-Rodamco
of 85.9%, a dividend representing 6.4% of the share value
and risk-free interests rates of 0.87%, 1.73% and 2.21%
(respectively for 3, 5 and 7 years).
Performance shares are accounted for in accordance
with IFRS 2 (see section 2.1 “Accounting principles and
consolidation methods” § 2.1.10). The expense recorded on
the income statement in relation to performance shares
came to €0.4 million in 2012.
2.10. Related party disclosures
The consolidated fi nancial statements include all of
the companies in the Group’s scope of consolidation (see
section 2.3 “Scope of consolidation”).
The parent company is Unibail-Rodamco SE.
To the Group’s knowledge, there are neither shareholders’
pacts nor persons or groups of persons exercising or who
could exercise control over the Group.
The main related party transactions refer to transactions
with companies consolidated under the equity method.
(€Mn) 31/12/2012 31/12/2011
Comexposium Group
Loan 124.6 149.6
Recognised interests 4.8 6.0
Rents and fees invoiced(1) 69.0 44.3
Zlote Tarasy
Loans(2) 367.5 –
Recognised interests(2) 13.8 –
Current account (66.4) –
Interests on current account (0.9) –
Asset management fees invoiced 1.3 –
(1) Correspond mainly to rents and fees invoiced by Viparis entities to Comexposium and to rent invoiced by the SCI Wilson for the head offi ce of Comexposium.(2) Correspond to 100% of the fi nancing in the Zlote Tarasy investment.
All of these transactions are based on market prices.
No transactions with related parties have infl uenced
signifi cantly the consolidated fi nancial statements.
Transactions with other related parties
Remuneration of the Management Board
(€)Paid in: 2012 2011
Fixed income 2,916,380 2,943,267
Short term incentive 1,993,374 2,300,078
Other benefi ts(1) 851,633 849,929
Total 5,761,387(2) 6,093,274
(1) Mainly pension and company car.(2) The amounts indicated correspond to the periods during which the benefi ciaries were members of the Management Board.
In 2012, members of the Management Board were
allocated a total of 158,950 stock options, all subject to
performance criteria, subject to performance criteria, and
10,642 performance shares.
Regarding the 2012 results, the Management Board
members will receive in 2013 a total variable remuneration
of €2,313,111.
Remuneration of the Supervisory Board: €823,945.
Loans or guarantees granted to directors
None.
Transactions involving directors
None.
2.11. Relationship with Statutory Auditors
Statutory auditors are:
• Ernst & Young Audit
– Commencement date of fi rst term of offi ce: AGM of
May 13, 1975,
– Persons responsible: Christian Mouillon and Benoit
Schumacher designated in April 2011;
• Deloitte & Associés
– Commencement date of fi rst term of offi ce: AGM of
April 27, 2011,
– Person responsible: Damien Leurent designated in
April 2011.
Expiry of term of offi ce for both auditors at the AGM held
for the purpose of closing the 2016 accounts.

REPORT OF THE CHAIRMAN OF THE SUPERVISORY BOARD
LEGAL INFORMATION
FINANCIAL REPORT 2012 - UNIBAIL-RODAMCO 174 • 175
Fees of Statutory Auditors and other professionals in their networks for the 2012 and 2011 fi scal years, for the parent
company and fully consolidated subsidiaries
(€Mn)
Ernst & Young Deloitte Others
Amount % Amount % Amount %
2012 2011 2012 2011 2012 2011 2012 2011 2012 2011 2012 2011
Audit
Statutory audit, certifi cation, review of company and consolidated fi nancial statements
• Issuer(1) 0.3 0.3 17% 21% 0.3 0.3 21% 28% – – – –
• Fully consolidated subsidiaries 1.4 1.1 69% 67% 0.8 0.6 66% 64% – – 1% 18%
Other assignments and services directly related to the statutory audit assignment
• Issuer(1) 0.1 0.1 5% 7% 0.1 – 10% 2% – – – –
• Fully consolidated subsidiaries 0.2 0.1 9% 5% – 0.1 1% 6% – 0.1 20% 82%
Subtotal 2.0 1.6 100% 100% 1.2 0.9 99% 100% – 0.2 22% 100%
Other services rendered by the network to fully consolidated subsidiaries – –
• Legal, tax, employee-related – – – – – – 1% – – – 17% –
• Others – – – – – – – – 0,1 – 62% –
Subtotal – – – – – – 1% – 0.2 – 78% –
Total 2.0 1.6 100% 100% 1.2 0.9 100% 100% 0.2 0.2 100% 100%
(1) The issuer is the parent company.
Concerning the subsidiaries consolidated by the proportional or equity methods, the fees of Statutory Auditors and other
professionals in their networks for the 2012 fi scal year for the statutory audit, certifi cation and review of company fi nancial
statements amount to €1 million, of which €0.8 million for Ernst & Young, €0.1 million for Deloitte and €0.1 million for other audit
fi rms.
2.12. Post closing events
Acquisition
On January 10, 2013, Unibail-Rodamco acquired a 50.01% stake in the development project “Polygone Riviera” (a shopping
centre of 71,474 m² GLA with an expected delivery in H2-2015) in Cagnes-sur-Mer (Nice region, France).
mfi AG and Ruhr-Park
On January 21, 2013, the Group obtained the approval from the French Anti-trust authority to control jointly the mfi AG and
Ruhr-Park companies. This approval had already been obtained on December 18, 2012, from German Anti-trust authority.

CONSOLIDATED FINANCIAL STATEMENTS
CORPORATE SUSTAINABILITY
BUSINESS REVIEW AND 2012 RESULTS
PORTFOLIO
UNIBAIL-RODAMCO - FINANCIAL REPORT 2012 176 • 177
3. STATUTORY AUDITORS’ REPORT ON THE
CONSOLIDATED FINANCIAL STATEMENTS
Year ended December 31, 2012
To the Shareholders,
In compliance with the assignment entrusted to us by your
Shareholder’s General Meeting, we hereby report to you, for
the year ended December 31, 2012, on:
• the audit of the accompanying consolidated fi nancial
statements of Unibail-Rodamco;
• the justifi cation of our assessments;
• the specifi c verifi cation required by law.
These consolidated fi nancial statements have been
approved by the Management Board. Our role is to express
an opinion on these consolidated fi nancial statements based
on our audit.
I. Opinion on the consolidated fi nancial statements
We conducted our audit in accordance with professional
standards applicable in France; those standards require that
we plan and perform the audit to obtain reasonable assurance
about whether the consolidated fi nancial statements are
free of material misstatement. An audit involves performing
procedures, using sampling techniques or other methods of
selection, to obtain audit evidence about the amounts and
disclosures in the consolidated fi nancial statements. An audit
also includes evaluating the appropriateness of accounting
policies used and the reasonableness of accounting estimates
made, as well as the overall presentation of the consolidated
fi nancial statements. We believe that the audit evidence we
have obtained is suffi cient and appropriate to provide a basis
for our audit opinion.
In our opinion, the consolidated fi nancial statements give
a true and fair view of the assets and liabilities and of the
fi nancial position of the Group as at December 31, 2012 and
of the results of its operations for the year then ended in
accordance with International Financial Reporting Standards
as adopted by the European Union.
II. Justifi cation of our assessments
In accordance with the requirements of article L. 823-9 of
the French Commercial Code (code de commerce) relating
to the justifi cation of our assessments, we bring to your
attention the following matters:
• As stated in note 2.1.5. to the consolidated fi nancial
statements, the real estate portfolio is subject to valuation
procedures carried out by independent real estate appraisers.
We ensured that the fair value of investment properties as
stated in the consolidated statement of fi nancial position and
in note 2.5.1. to the consolidated fi nancial statements was
determined in accordance with the valuations carried out by
the aforementioned appraisers. We have also assessed the
reasonableness of theses valuations. Moreover, for investment
properties under construction for which the fair value could not
be reliably determined, we have assessed the reasonableness
of the data and assumptions used by your Group to carry out
the impairment tests of these assets maintained at cost. We
have ensured that necessary depreciations have been booked
following these impairment tests.
• As indicated in note 2.1.5. to the consolidated fi nancial
statements, your Group carries out on an annual basis
impairment tests for its intangible assets, most of them
based on external appraisals. We have notably assessed the
reasonableness of the data and assumptions used by your Group
to carry out these tests and we have ensured that necessary
depreciations required by these tests had been booked.
For those assessments we also ensured that appropriate
information was disclosed in the notes.
These assessments were made as part of our audit of
the consolidated fi nancial statements taken as a whole,
and therefore contributed to the opinion we formed which is
expressed in the fi rst part of this report.
III. Specifi c verifi cation
As required by law we have also verifi ed in accordance with
professional standards applicable in France the information
presented in the Group’s management report.
We have no matters to report as to its fair presentation and
its consistency with the consolidated fi nancial statements.
Neuilly-Sur-Seine and Paris-La Défense, March 14, 2013
DELOITTE ET ASSOCIES ERNST & YOUNG AUDIT
represented by Damien Leurent represented by Christian Mouillon and Benoit Schumacher
REPORT OF THE CHAIRMAN OF THE SUPERVISORY BOARD
LEGAL INFORMATION
FINANCIAL REPORT 2012 - UNIBAIL-RODAMCO 176 • 177

CONSOLIDATED FINANCIAL STATEMENTS
CORPORATE SUSTAINABILITY
BUSINESS REVIEW AND 2012 RESULTS
PORTFOLIO
UNIBAIL-RODAMCO - FINANCIAL REPORT 2012
Legal information
178 • 179
1. General information 1791.1. Company name 1791.2. Registered office 1791.3. Legal form and applicable law 1791.4. SIIC Regulation 1791.5. Term of the Company 1791.6. Corporate purpose 1791.7. Trade and Companies Register 1791.8. Access to legal information concerning
the Company 1791.9. Financial year 1791.10. Requirements pertaining to the distribution
of profits 1801.11. Corporate governance structure 1801.12. General Meeting of Shareholders 1801.13. Statutory shareholder registration threshold 180
2. Share capital – General information 1812.1. Statutory obligations pertaining to changes
in the Company’s share capital and categories
of share rights 1812.2. Authorised share capital – Form of shares 1812.3. Other securities granting access
to the share capital 1842.4. Share buy-back programme 1892.5. Pledged Company shares 1902.6. Escheat shares 1902.7. Other securities granting access
to the share capital 1902.8. Dividends/Distribution of profits 190
3. Share capital and voting rights 1923.1. Ownership of capital and voting rights 1923.2. Ownership threshold disclosures between
March 2, 2012(8) and March 1, 2013 1923.3. Shareholder agreement 1933.4. Code of conduct 193
4. Management Board and Supervisory Board 1934.1. Composition of the Management Board
as at December 31, 2012 193
4.2. Composition of the Supervisory Board
as at December 31, 2012 1974.3. Corporate Governance 1994.4. Remuneration of Management Board
and Supervisory Board members 2014.5. Prospectus regulations – Negative declaration 216
5. Other Information 2165.1. Details of top ten Stock-Options grants/
exercises (excluding Executive Officers)
in the 2012 fi nancial year (Art.L. 225-184
of the French Commercial Code) 2165.2. Details of top ten Performance Shares grants/
available (excluding Executive Officers)
in the Financial year 2012 (Art.L. 225-197-4
of the French Commercial Code) 2165.3. Information on share transactions
and Permanent Insiders 2165.4. Appraiser fees 2175.5. Insurance 2175.6. Supplier payment dates for the parent company,
Unibail-Rodamco SE 2185.7. Results for the parent company,
Unibail-Rodamco SE over the past 5 years 2186. Risk factors 219
6.1. Risks inherent in Unibail-Rodamco SE’s
business activities 2196.2. Legal,regulatory,tax,environmental
and insurance-related risks 2196.3. Risks associated with Unibail-Rodamco’s
financing policy and financial activities 2216.4. Risks related to the volatility in the price
of Unibail-Rodamco SE securities 2226.5. Risks related to the sovereign debt crisis 2226.6. Risks linked to key managers 2226.7. Risks related to Unibail-Rodamco’s
geographic presence 2226.8. Risks associated with possible conflicts
of interest 222

REPORT OF THE CHAIRMAN OF THE SUPERVISORY BOARD
LEGAL INFORMATION
FINANCIAL REPORT 2012 - UNIBAIL-RODAMCO 178 • 179
Legal information 1. GENERAL INFORMATION
1.1. Company name
Unibail-Rodamco SE
1.2. Registered office
7, place du Chancelier Adenauer – 75016 Paris (France)
1.3. Legal form and applicable law
European public limited-liability company governed by a
Management Board and Supervisory Board, pursuant to the
provisions of the European Council Regulation 2001/2157/EC
of October 8, 2001, applicable to European companies and the
current laws and regulations of France.
1.4. SIIC Regulation
In 2003, the Company and its eligible subsidiaries opted
for and became subject to the tax regime applicable to Listed
Property Investment Companies (SIIC) introduced by the
2003 French Finance Act (Article 208 C of the French General
Tax Code, Code général des impôts). This regime is based on
the principle of fiscal transparency. The tax is borne at the
shareholder level and not at the company level.
SIIC distribution obligation(1)
As the Company has opted for the SIIC regime, in France,
the net recurring results for eligible activities and the capital
gain on eligible asset divestments are exempt from tax
provided that:
• at least, 85% of the net recurrent results flowing from
eligible activities in year X are distributed to shareholders
in year X+1; and
• 100% of dividends received from subsidiaries and 50% of
eligible capital gain in year X is distributed to shareholders
(at the latest) in year X+2.
As of January 1, 2010, no shareholder is entitled to own
more than 60% of the capital and/or voting rights in a SIIC
company. The same applies to a group of shareholders
acting in concert. As at the date of filing of this Registration
Document, to the best of the Company’s knowledge, no
shareholder has reached this threshold.
1.5. Term of the Company
99 years from July 23, 1968. Expiry July 22, 2067.
1.6. Corporate purpose
The corporate purpose of the Company is (article 2 of the
by-laws) in France and abroad:
• investment through the acquisition, development,
construction and ownership of land, buildings, property
assets and rights, and the fitting out of property complexes,
with a view to renting them out;
• the management, rental, leasing, divestment or exchange
of the above assets, either directly, or through taking
investments or interest ownerships, or by creating
partnerships, companies or consortia;
• more generally, any fi nancial, securities or property
transactions directly or indirectly connected with the
foregoing purpose or likely to facilitate its achievement;
• the acquisition, ownership or divestment of assets in any
French or foreign legal entities with an activity directly or
indirectly linked to the corporate purpose of the Company
or which would favour its development.
1.7. Trade and Companies Register
682 024 096 RCS Paris – SIRET 682 024 096 00054 –
APE code: 6420Z
1.8. Access to legal information concerning the Company
The Articles of association and other public documentation
concerning the Company are available on the Company’s
website and/or at its registered office:
7, place du Chancelier Adenauer – 75016 Paris (France)
Tel: +33 (0)1 53 43 74 37
www.Unibail-Rodamco.com
1.9. Financial year
The financial year runs from January 1 to December 31.
(1) For more information on the SIIC regime, refer to page 125.

CONSOLIDATED FINANCIAL STATEMENTS
CORPORATE SUSTAINABILITY
BUSINESS REVIEW AND 2012 RESULTS
PORTFOLIO
UNIBAIL-RODAMCO - FINANCIAL REPORT 2012 180 • 181
1.10. Requirements pertaining to the distribution of profits
The distributable profit in any given year is equal to the
sum of the net profi t and any retained earnings, less: (1) any
accumulated loss; and (2) amounts transferred to reserves
(“Distributable Profits”). In addition to the Distributable
Profits, the general meeting of shareholders may expressly
resolve to distribute sums from other distributable reserves
and/or contribution premiums.
Pursuant to the SIIC regime, the payment of a dividend may
give rise to the imposition of a withholding tax (currently at a
rate of 20%) on the Company pursuant to Article 208-C-II-ter
of the French General Tax Code; calculated on the basis of
the total dividend paid to shareholders holding (directly or
indirectly) 10% or more of the share capital (“Shareholder
Concerned”)(2). This tax, where applicable, is borne by the
Shareholder Concerned i.e. the withholding amount is
reimbursed by the Shareholder Concerned (or offset against
its dividend).
1.11. Corporate governance structure(3)
The Company is managed under a two-tier governance
system (Management Board and Supervisory Board).
As at December 31, 2012, the Management Board is
composed of four members (appointed by the Supervisory
Board) and the Supervisory Board is composed of ten
members (appointed by the general meeting of shareholders).
The Supervisory Board on March 4, 2103, upon the
recommandation of the GN&RC, appointed Mr Christophe
Cuvillier as Chairman of the Management Board and Mr
Jean-Marie Tritant, Mr Olivier Bossard and Mr Fabrice
Mouchel as new members of the Management Board, effective
April 25, 2013. It renewed as well the current mandates of
Mrs Catherine Pourre and Mr Jaap Tonckens for a four-year
period as of April 25, 2013. Subsequent to these decisions,
the Management Board will be composed of six members as
at April 25, 2013.
1.12. General Meeting of Shareholders
A general meeting of shareholders is convened and
conducted pursuant to French law and European regulations.
All shareholders, evidencing the ownership of their shares,
have the right to participate, either in person or through a
representative, provided that they have been shareholders for
at least three business days prior to the date of the general
meeting.
There is one voting right per share. There are no preference
shares. For futher information, refer to Articles 18 and 19 of
the Articles of Association.
1.13. Statutory shareholder registration threshold
Pursuant to Article 9 of the Company’s Articles of
Association, a Shareholder Concerned(4) must register the
totality of its shares (owned directly or via an entity it controls)
and provide evidence to the Company by registered mail
within five trading days of reaching such threshold.
The declaration should confirm whether the Shareholder
Concerned is resident in France for taxation purposes; and,
if not, whether the Shareholder Concerned is subject, in its
country of residence, to a tax equal to at least 2/3rds the level of
taxation applicable in France. Any change in the Shareholder
Concerned’s position should be notified to the Company within
ten trading days prior to the payment of any distribution. A
Shareholder Concerned that fails to comply with the above
requirements may lose the right to participate in and/or vote
at general meetings of the Company.
Pursuant to Article 9(b) of the Company’s Articles of
Association, any shareholder that reaches a 2% shareholding
threshold or more in the Company (or any further multiple
thereof) must notify the Company by registered letter within
ten trading days of reaching such threshold.
A Shareholder that fails to comply with this requirement
may lose the voting rights attached to those shares exceeding
the said threshold for a period of two years from the date of
the (late) notification to the Company and upon the request
of one or more shareholders holding at least 2% of the
Company’s share capital.
(2) Refer to paragraphs “Requirements pertaining to the distribution of profits” and “Statutory shareholder registration threshold”. A “Shareholder Concerned” is any shareholder, other than a natural person, that owns, directly or through entities acting as intermediaries that it controls within the meaning of Article L. 233-3 of the French Commercial Code, the percentage of rights to a dividend specified in Article 208-C-II-ter (10%) of the French General Tax Code.(3) For full details, refer to the Articles of Association and the Supervisory and Management Board charters available on the Company’s website and at the Company’s registered office.(4) Ibid. 2.

REPORT OF THE CHAIRMAN OF THE SUPERVISORY BOARD
LEGAL INFORMATION
FINANCIAL REPORT 2012 - UNIBAIL-RODAMCO 180 • 181
2. SHARE CAPITAL – GENERAL INFORMATION
2.1. Statutor y obligations pertaining to changes
in the Company’s share capital and categories
of share rights
None.
2.2. Authorised share capital – Form of shares
As at December 31, 2012, the share capital is €474,459,900,
divided into 94,891,980 fully paid-up shares with a nominal
value of €5 each. Company shares may be registered or
bearer shares. The only exception applies to Shareholders
Concerned who must register their shares in accordance
with the requirements set out in Article 9 of the Articles of
Association.
Table summarising authorisations to increase the share capital (as at December 31, 2012)
Pursuant to the Article L. 225-100 of the French Commercial Code, the following table summarises current authorisations
granted to increase the share capital in the 2012 financial year and authorisations pre-dating 2012 which remain in force
Type of authorisationAmount authorized(1)
Date of general meeting
Authorisation expiry date
Potential Beneficiaries
Issue terms and conditions
Amount authorization used:number of shares or bonds issued/subscribed for or permanently allocated(2)
Outstanding authorisation (nominal value, number of shares/bonds, Stock-Options or performance shares) as at 31/12/2012(2)
Increase in the share capital by issue of ordinary shares to be subscribed for in cash or by issue of negotiable securities with PR(3)
€75,000,000 (nominal value) in ordinary shares and/or securities giving access to the share capital + €1,500,000,000 (nominal value) in debt instruments
26/04/2012 26/10/2013 Shareholders Fixed by Management Board pursuant to AGM authority.
0 Totality of the authorisation
Increase in the share capital by issue of ordinary shares to be subscribed for in cash or the issue of securities without PR(3)
€45,000,000 (nominal value) in ordinary shares and/or securities giving access to the share capital + €1,500,000,000 (nominal value) in debt instruments
26/04/2012 26/10/2013 Shareholders and/or third parties
Fixed by Management Board pursuant to AGM authority; including power to cancel pre-emptive rights and replace with a priority right. If the subscription exceeds 10% of the share capital, mandatory pre-emptive right.
Issuance of convertible bonds redeemable in cash and/or in new and/or existing shares (ORNANE) due 01/01/2018. The amount of the issuance is €749,999,933.76, representing 3,451,767 ORNANE.
Ordinary shares and/or securities giving access to the share capital: €36,370,580 (on the theoretical basis that the 3,451,767 ORNANE resulted in 1,725,884 potential shares) (4) €750,000,066.24 (nominal value) in debt instruments
Increase in the share capital with or without PR(3)
Maximum threshold of 15% for the first issue and within the global limit
26/04/2012 26/10/2013 Subscribers to the issue
Management Board has the power to make further issuances on the same terms and conditions as the initial issue.
0 Totality of the authorisation
Increase in the share capital without PR(3) by the issue of ordinary shares to be subscribed for in cash, or the issue of any negotiable security in consideration for capital
Capital contribution in the form of securities: 10% of the authorised share capital as at the issuance
26/04/2012 26/10/2013 Subscribers to the issue
Fixed by Management Board pursuant to AGM authority; including the power to cancel pre-emptive rights.
0 Totality of the authorisation

CONSOLIDATED FINANCIAL STATEMENTS
CORPORATE SUSTAINABILITY
BUSINESS REVIEW AND 2012 RESULTS
PORTFOLIO
UNIBAIL-RODAMCO - FINANCIAL REPORT 2012 182 • 183
Type of authorisationAmount authorized(1)
Date of general meeting
Authorisation expiry date
Potential Beneficiaries
Issue terms and conditions
Amount authorization used:number of shares or bonds issued/subscribed for or permanently allocated(2)
Outstanding authorisation (nominal value, number of shares/bonds, Stock-Options or performance shares) as at 31/12/2012(2)
Increase in the share capital reserved for employee savings plan participants
Maximum nominal value of €2,000,000 pursuant to the delegated powers
26/04/2012 26/10/2013 Participants in the Company Savings Plan
Fixed by Management Board pursuant to AGM authority. 20% discount applies based on the average share price over previous 20 trading days.
41,077 shares 358,923 shares
Increase in the share capital reserved for managers and employees eligible for the stock option plan (Plan no. 7 Performance (5))
Maximum: 1% of the fully diluted share capital per year (6)
27/04/2011 27/06/2014 Managers and employees of the Group
Fixed by Management Board pursuant to AGM authority.No discount applied. Performance condition is obligatory(5).
0.65% of the fully diluted share capital (i.e. 698,202 Stock-Options subject to the performance condition).
2.35% of the fully diluted share capital over the authorisation validity period.
Increase in the share capital reserved for employees and corporate offi cers eligible for the Performance Shares Plan – Plan no. 1 Performance(5)
Global limit: 0.8% of the fully diluted capital over the authorisation validity period(7)
26/04/2012 26/06/2015 Employees and corporate offi cers of the Group
Fixed by Management Board pursuant to AGM authority.
0.05% of the fully diluted share capital (i.e. 44,975 performance shares subject to the performance condition.
0.75% of the fully diluted share capital over the authorisation validity period.
(1) For more details, refer to the exact text of the resolutions.(2) After adjustments if applicable.(3) Pre-emption rights.(4) Please refer to the article 4.16.10 “Note d’Opération” registered under AMF visa n°12-440 dated September 11, 2012 (page 52 of the “Note d’Operation”).(5) The conditions of allocation, retention and, if applicable, performance are set by the Management Board for each allocation.(6) 3% of the total diluted capital over the authorisation validity period. The total number of (i) Stock-Options granted under this authorisation and of (ii) Stock-Options granted but not yet exercised and Performance Shares granted under previous authorisations cannot give rise to a number of shares exceeding 8% of the share capital on a fully diluted basis.(7) The total number of (i) Performance Shares granted under this authorisation approved by the General Meeting on April 26, 2012 and of (ii) Performance Shares that may be granted under the unused part of a previous authorisation still in force and of (iii) Performance Shares open but not yet exercised and Performance Shares granted under previous authorisations cannot give rise to a number of shares exceeding 8% of the share capital on a fully diluted basis.

REPORT OF THE CHAIRMAN OF THE SUPERVISORY BOARD
LEGAL INFORMATION
FINANCIAL REPORT 2012 - UNIBAIL-RODAMCO 182 • 183
Table summarising new authorisations to increase the share capital to be proposed to the Annual General Meeting of Shareholders for approval on April 25, 2013
Type of authorisation(1) Amount(2)
Date of General Meeting
Authorisation expiry date Beneficiaries
Issue terms and conditions
Effect on the previous authorisation
Increase in the share capital by the issue of ordinary shares to be subscribed in cash, or of any negotiable securities with PR(3). Resolution #10
€75,000,000 (nominal value) in ordinary shares and/or securities giving access to the share capital + €1,500,000,000 (nominal value) in debt instruments
25/04/2013 25/10/2014 Shareholders Fixed by Management Board pursuant to AGM authority.
The approval of this authorisation would revoke the remainder of the 26/04/2012 authorisation
Increase in the share capital by the issue of ordinary shares to be subscribed in cash, or of any other securities without PR(3). Resolution #11
€45,000,000 (nominal value) in ordinary shares and/or securities giving access to the share capital + €1,500,000,000 (nominal value) in debt instruments
25/04/2013 25/10/2014 Shareholders and/or third parties
Fixed by Management Board pursuant to AGM authority; including power to cancel pre-emptive rights and replace with a priority right. Mandatory pre-emptive right for shareholders holding 10% or more of the share capital.
The approval of this authorisation would revoke the remainder of the 26/04/2012 authorisation
Increase of the number of shares or securities to be issued in the case of an increase in the share capital with or without PR(3).Resolution #12
Maximum threshold of 15% for the first issue and within the global limit
25/04/2013 25/10/2014 Subscribers to the issue
Management Board has the power to make further issuances on the same terms and conditions as the initial issue.
The approval of this authorisation would revoke the remainder of the 26/04/2012 authorisation
Increase in the share capital without PR(3) by the issue of ordinary shares to be subscribed in cash, or of any negotiable securities as consideration for capital contributions in kind. Resolution #13
Capital contribution in the form of securities: 10% of the authorised share capital as at the issuance
25/04/2013 25/10/2014 Subscribers to the issue
Fixed by Management Board pursuant to AGM authority; including the power to cancel pre-emptive rights.
The approval of this authorisation would revoke the remainder of the 26/04/2012 authorisation
Increases in the share capital reserved for participants of employees savings plan.Resolution #14
Maximum nominal value of €2,000,000
25/04/2013 25/10/2014 Participants in the Company Savings Plan
Fixed by Management Board pursuant to AGM authority. 20% discount applies based on the average share price over previous 20 trading days.
The approval of this authorisation would revoke the remainder of the 26/04/2012 authorisation
(1) For more details, refer to the exact text of the resolutions.(2) Pursuant to French law, the AGM to be held on April 25, 2013, will be invited to fix a total maximum amount (included in Resolution #10) for all authorisations as follows: up to €122 million nominal amount of share capital increase; and up to €1.5 billion nominal amount for debt securities issues.(3) Pre-emption rights.(4) The conditions of allocation, retention and, if applicable, performance are fi xed by the Management Board with respect to each allocation.

CONSOLIDATED FINANCIAL STATEMENTS
CORPORATE SUSTAINABILITY
BUSINESS REVIEW AND 2012 RESULTS
PORTFOLIO
UNIBAIL-RODAMCO - FINANCIAL REPORT 2012 184 • 185
2.3. Other securities granting access to the share capital
2.3.1. Options to subscribe for and/or purchase shares
(“Stock-Options”)
Stock-Options are allocated by the Company to Group
managers and employees for exemplary performance, the
assumption of additional responsibilities or key roles within
the Group. The allocation of Stock-Options is by no means
automatic. As a consequence, the beneficiaries, frequency
and amount of Stock-Options allocated from year to year, may
vary. Pursuant to Group rules:
• no obligatory discount is applied to Stock-Options;
• Stock-Options are valid for a 7 year period; and
• Stock-Options may be exercised once or several times from
the fourth anniversary of the allocation date.
The detail of the various Stock Option plans in force (Plan
no. 4 to Plan no. 7) is provided below. A performance condition
is applicable to the exercise of all Stock-Options under the
various plans since 2003 for managers and since 2006 for
employees. To avoid any windfall effect, the performance
condition has remained in force and unchanged ever since.
Performance condition
The exercise of Stock-Options is conditional on the
Company’s overall stock market performance outperforming
the European Public Real Estate Association (“EPRA”) index
over the reference period. The reference period begins on the
date of allocation of the Stock-Options and ends on the last
trading day prior to the exercise of the said Stock-Options by
the beneficiary (inclusive):
(i) The overall market performance of the Company
is defined according to the evolution in its share price
(taking into account gross distributions, dividends or
interim dividends reinvested on the distribution date) over
the reference period. The gross dividend figures included
in the Company’s overall stock market performance are
those published by Bloomberg which is the reference for
the EPRA Euro Zone Total Return (”RPEU”) index;
(ii) The performance of the EPRA index is defined by the
evolution of the EPRA “RPEU” index over the reference
period. This index is composed of the main European
Public Real Estate companies and is a “total return” index
(including dividends paid).
General conditions applicable to the allocation of Stock-
Options (in force since March 2009)
• Pursuant to Afep-Medef recommendations, the allocation
date must fall within the one-hundred-and-twenty (120) day
period following the date of the publication of the Company’s
annual accounts.
• In accordance with Afep-Medef recommendations, the
Supervisory Board fixes a maximum percentage out of
the total number of Stock-Options that can be granted to
the Chairman of the Management Board and to the top six
beneficiaries under the plans.
• The number of Stock-Options allocated to individual
members of the Management Board is subject to the prior
approval of the Supervisory Board on the recommendation of
its Governance, Nomination and Remuneration Committee.
• In accordance with the Group remuneration policy, the
Company must not grant Stock-Options exceeding the annual
limit of 1% of the Company’s fully diluted share capital.
Plan no. 3 and Plan no. 3 Performance (collectively
referred to as “Plan no. 3”)
The Combined General Meeting held on June 17, 2003,
authorised the Board of Directors at the time to grant the Group’s
managers and employees Stock-Options up to a limit of 3%
of the fully-diluted share capital. On October 15, 2003, on the
recommendation of the Nomination and Remuneration Committee
at the time, the Board of Directors approved the terms of two Stock
Option plans: (i) Plan no. 3 for Group executives and employees
without performance conditions and (ii) Plan no. 3 Performance
limited to executives and high level managers with a performance
condition (as defined above).
A total of 1,147,000 Options were granted under Plan no. 3.
This may result in the creation of 1,416,058 new shares after
legal adjustments pursuant to Article R228-91-3° of the French
commercial code, notably: the adjustment ratio of 1.2726 following
the exceptional distribution of January 7, 2005 (applicable to 2004
tranche); the adjustment ratio of 1.02 following the exceptional
distribution of July 15, 2009; the adjustment ratio of 1.06 following
the exceptional distribution of May 10, 2010; the adjustment ratio of
1.14 following the exceptional distribution of October 12, 2010 and
the adjustment ratio of 1.02 following the exceptional distribution
of May 10, 2011 (for all tranches under Plan no. 3). As at March 4,
2013, a total of 1,318,393 Stock-Options were exercised under Plan
no. 3. There are no remaining Stock-Options to be exercised under
Plan no. 3.
Plan no. 4 Performance (“Plan no. 4”)
The Combined General Meeting held on April 27, 2006,
authorised the Board of Directors at the time to grant the Group’s
managers and employees Stock-Options up to a limit of 3%
of the fully-diluted share capital. On October 11, 2006, on the
recommendation of the Nomination and Remuneration Committee
at the time, the Board of Directors approved a new stock option
plan subject to the performance condition (Plan no. 4).
A total of 365,500 Stock-Options were granted under Plan
no. 4. This may result in the creation of 443,876 new shares
after legal adjustments pursuant to Article R228-91-3° of the
French Commercial code; notably: the adjustment ratio of
1.02 following the exceptional distribution of July 15, 2009; the
adjustment ratio of 1.06 following the exceptional distribution
of May 10, 2010; the adjustment ratio of 1.14 following the

REPORT OF THE CHAIRMAN OF THE SUPERVISORY BOARD
LEGAL INFORMATION
FINANCIAL REPORT 2012 - UNIBAIL-RODAMCO 184 • 185
exceptional distribution of October 12, 2010 and the adjustment
ratio of 1.02 following the exceptional distribution of May 10,
2011. As at March 4, 2013, 263,872 Stock-Options were
exercised under Plan no. 4. After the cancellation of Stock-
Options due to staff departures, the potential number of new
shares under Plan no. 4 is 113,144.
Plan no. 5 Performance (“Plan no. 5”)
The Combined General Meeting held on May 21, 2007,
authorised the Management Board to grant the Group’s
managers and employees Stock-Options up to a limit
of 3% of the fully-diluted share capital. On October 11,
2007, in agreement with the Supervisory Board and on
the recommendation the Governance, Nomination and
Remuneration Committee, the Management Board approved
a new stock option plan subject to the performance condition
(Plan no. 5). Plan no. 5 was extended to all Unibail and Rodamco
Europe Group subsidiaries following the formalisation of the
merger on June 21, 2007.
In agreement with the Supervisory Board (on the
recommendation of the Governance, Nomination and
Remuneration Committee), the Management Board granted
further allocations under Plan no. 5 on October 11, 2007,
October 23, 2008 and on March 13, 2009. A total of 2,249,600
Stock-Options were granted. This may result in the creation
of 2,731,106 new shares after legal adjustments pursuant
to Article R. 228-91-3° of the French commercial code;
notably: the adjustment ratio of 1.02 following the exceptional
distribution of July 15, 2009, the adjustment ratio of 1.06
following the exceptional distribution of May 10, 2010; the
adjustment ratio of 1.14 following the exceptional distribution
of October 12, 2010 and the adjustment ratio of 1.02 following
the exceptional distribution of May 10, 2011. As at March 4,
2013, after the cancellation of Stock-Options due to staff
departures, the potential number of new shares under Plan
no. 5 is 1,199,974.
Plan no. 6 Performance (“Plan no. 6”)
The Combined General Meeting held on May 14, 2009,
authorised the Management Board to grant the Group’s
managers and employees Stock-Options up to a limit of 3%
of the fully-diluted share capital on the condition that the total
sum of the Stock-Options granted under this and previous
authorisations, including performance shares previously
granted, do not exceed 5% of the Company’s authorised share
capital on a fully-diluted basis and subject to adjustments
under Articles R. 228-91-3° of the French Commercial Code.
In agreement with the Supervisory Board (on the
recommendation of the Governance, Nomination and
Remuneration Committee), on March 10, 2010, the
Management Board approved a new stock option plan subject
to the performance condition (Plan no. 6).
In agreement with the Supervisory Board (on the
recommendation of the Governance, Nomination and
Remuneration Committee), on March 10, 2010 and on
March 10, 2011, the Management Board granted a total
number of 1,532,750 Stock-Options. This may result in the
creation of 1,718,370 new shares after legal adjustments
pursuant to Article R. 228-91-3° of the French commercial
code; notably: the adjustment ratio of 1.06 following the
exceptional distribution of May 10, 2010; the adjustment ratio
of 1.14 following the exceptional distribution of October 12,
2010 (contribution premium reimbursement) and the
adjustment ratio of 1.02 following the exceptional distribution
of May 10, 2011. As at March 4, 2013, after the cancellation of
Stock-Options due to staff departures, the potential number
of new shares under Plan no. 6 is 1,438,196.
Plan no. 7 Performance – (“Plan no. 7”)
The Combined General Meeting held on April 27, 2011,
authorised the Management Board to grant the Group’s
managers and employees Stock-Options 3% of the fully-
diluted share capital in the Company (with an annual limit of
1% on a totally diluted basis) on the condition that the total
sum of Stock-Options granted under this authorisation,
and previous authorisations, including Performance Shares
previously granted, do not exceed 8% of the Company’s
authorised share capital on a fully-diluted basis and subject
to adjustments under Articles R. 228-91-3° of the French
Commercial Code.
On June 9, 2011, in agreement with the Supervisory Board
(on the recommendation of the Governance, Nomination and
Remuneration Committee), the Management Board approved
a new stock option plan subject to the performance condition
(Plan no. 7).
In agreement with the Supervisory Board (on the
recommendation of the Governance, Nomination and
Remuneration Committee), on June 9, 2011 and March 14,
2012, the Management Board granted a total number of
698,202 Stock-Options.
In agreement with the Supervisory Board (on the
recommendation of the Governance, Nomination and
Remuneration Committee), on March 4, 2013, the
Management Board granted 617,066 Stock-Options.
As at March 4, 2013, after the cancellation of Stock-Options
due to staff departures, the potential number of new shares
under Plan no. 7 is 1,258,528.

CONSOLIDATED FINANCIAL STATEMENTS
CORPORATE SUSTAINABILITY
BUSINESS REVIEW AND 2012 RESULTS
PORTFOLIO
UNIBAIL-RODAMCO - FINANCIAL REPORT 2012 186 • 187
Information about the Share Subcription or Purchase Options’ Allocations (Table n°8 of AMF/Afep-Medef recommendations)
Date of the plan
Plan n° 3 Plan n° 4 Plan n° 5 Plan n° 5 Plan n° 5 Plan n° 6Plan n° 6 et
Plan n°7 Plan n° 7 Plan n° 7
Tranche 2005 +
PerformanceTranche 2006 Performance
Tranche 2007 Performance
Tranche 2008 Performance
Tranche 2009 Performance
Tranche 2010 Performance
Tranche 2011 Performance
Tranche 2012 Performance
Tranche 2013 Performance
Date of Board14/12/2005
(1),(2),(3)11/10/2006
(1),(2),(3)11/10/2007
(1),(2),(3)23/10/2008
(1),(2),(3)13/03/2009
(1),(2),(3)10/03/2010
(1),(2),(3)10/03/2011
(3)14/03/2012 04/03/2013
Total number of shares that may be acquired through exercising Stock-Options, of which: 450,571 443,876 779,800 1,045,660 905, 566 949,361 795,009 672,202 617,066
By responsible offi cers 90,294 75,436 75,436 113,153 94 294 141,747 135,140 118,950 88,400
G. Poitrinal(4) 74,076 50,290 50,290 75,435 62 862 61,629 56,100 42,500 0
C. Cuvillier(5) 26,000 (A) 29,750 42,500
C. Pourre(6) 16,218 25,146 25,146 37,718 31,432 30,815 26,520 20,400 20,400
J. Tonckens(7) 49,303 26,520 25,500 25,500
End of lock-up period (at the end of the trading day) 14/12/2009 11/10/2010 11/10/2011 23/10/2012 13/03/2013 10/03/2014 10/03/2015 14/03/2016 04/03/2017
Expiry date 14/12/2012 11/10/2014 11/10/2014 23/10/2015 13/03/2016 10/03/2017 10/03/2018 14/03/2019 04/03/2020
Strike price (€) 86.37 128.46 143.46 103.62 79.08 120.33 141.54 146.11 173.16
Exercise terms (if the plan has more than one tranche)
See page 184
See page 184
See page 185
See page 185
See page 185
See page 185
See page 185
See page 185
See page 185
Number of Stock-Options subscribed 369,771 263,872 410,834 432,046 0 0 0 0 0
Number of Stock-Options cancelled 80,800 66,860 220,351 269,467 198,434 184,365 95,809 56,740 0
Outstanding Stock-Options 0 113,144 148,695 344,147 707,132 764,996 699,200 615,462 617,066
(1) After taking into account the adjustment applied on July 15, 2009.(2) After taking into account the adjustment applied on May 10, 2010 and on October 12, 2010.(3) After taking into account the adjustment applied on May 10, 2011.(4) Member of Unibail-Rodamco SE Management Board since June 2007. Mr Guillaume Poitrinal’s mandate as Chairman of the Management Board will expire on 25 April 25, 2013.(5) Member of Unibail-Rodamco SE Management Board since June 2011. Mr Christophe Cuvillier was appointed as Chairman of the Management Board by the Supervisory Board held on March 4, 2013, upon the recommendation of the GN&RC, with effect as of April 25, 2013.(6) Member of Unibail-Rodamco SE Management Board since June 2007. Mrs Catherine Pourre’s mandate was renewed by the Supervisory Board on March 4, 2013, upon the recommendation of the GN&RC, with effect April 25, 2013.(7) Member of Unibail-Rodamco SE Management Board since September 2009. Mr Jaap Toncken’s mandate was renewed by the Supervisory Board on March 4, 2013, upon the recommendation of the GN&RC, with effect April 25, 2013.(A) With the exception of Mr Cuvillier who had an exceptionnal grant subsequent to his appointment on June 1,2011. In the framework of an additional Plan (Plan no 7), the details of his allocation were fi xed as follows: allocation date = June 9, 2011; exercise period (at the end of the trading day) = June 9, 2015 to June 9, 2018; exercise price = €152,03.
2.3.2. Performance Shares
The Combined General Meeting held on April 26, 2012
authorized the Board of Directors at the time to grant the
Group’s managers and employees, Performance Shares. In
agreement with the Supervisory Board (on the recommendation
of the Governance, Nomination and Remuneration Committee
(GN&RC), the Management Board, on March 14, 2012, approved
a new Performance Share plan (Plan no. 1 – Performance), to
be effective from April 26, 2012 which has the following main
features:
• the total grant of Performance Shares under the authorisation
must not exceed 0.8% of the Company’s share capital on a
fully diluted basis over the 38 month validity period;
• the grant of Performance Shares is, on a mandatory basis,
conditional on performance and presence conditions;
• for French tax residents: a minimum vesting period of three
years, and a minimum holding period of two years once vested;
for non-French tax residents: a minimum vesting period of
four years without any requirement to hold the shares;
• for Management Board members: an obligation to acquire
one share for every two Performance Shares awarded, upon
their availability, in compliance with the Afep-Medef code.

REPORT OF THE CHAIRMAN OF THE SUPERVISORY BOARD
LEGAL INFORMATION
FINANCIAL REPORT 2012 - UNIBAIL-RODAMCO 186 • 187
Performance Shares are allocated to Group managers
and employees for exemplary performance, the assumption
of additional responsibilities or key roles within the Group.
The allocation of Performance Shares is by no means
automatic. As a consequence, the beneficiaries, frequency
and number of Performance Shares allocated from year to
year may vary.
Performance condition
The vesting of the Performance Shares is conditional on the
Company’s overall stock market performance outperforming
the European Public Real Estate Association (“EPRA”) index
over the reference period. The reference period begins on the
grant date and ends on the last day of the vesting period.
(i) The overall market performance of the Company is
defined according to the evolution in its share price
(taking into account gross distributions, dividends or
interim dividends reinvested on the distribution date) over
the reference period. The gross dividend figures included
in the Company’s overall stock market performance are
those published by Bloomberg which is the reference for
the EPRA Euro Zone Total Return (“RPEU”) index.
(ii) The performance of the EPRA index is defined by the
evolution of the EPRA “RPEU” index over the reference
period. This index is composed of the main European
Public Real Estate companies and is a “total return” index
(including dividends paid).
The Performance condition can only be restrictively tested,
at a maximum of four times (“restrictive tests”) during the
vesting period. If the performance condition is not met, at least
on one of the “restrictive tests”, all rights are definitively lost.
General conditions applicable to the allocation
of Performance Shares
• Pursuant to Afep-Medef recommendations, the allocation
date must fall within the 120-day period following the date
of the publication of the Company’s annual accounts;
• In accordance with Afep-Medef recommendations, the
Supervisory Board fixes a maximum percentage out of the
total number of Performance Shares that can be granted to
the Chairman of the Management Board and to the top six
beneficiaries under the plans;
• The number of Performance Shares allocated to individual
members of the Management Board is subject to the prior
approval of the Supervisory Board on the recommendation of
its Governance, Nomination and Remuneration Committee;
• The total number of: (i) Performance Shares granted under
the authorisation given by the General Meeting on April 26,
2012; (ii) Performance Options that may be granted under
the remainder of a previous authorisation still in force; and
(iii) Performance Options open but not yet exercised and
Performance shares granted under previous authorisations,
cannot give rise to a number of shares exceeding 8% of the
share capital on a fully diluted basis.
• With the prior approval of the Supervisory Board (on the
recommendation of the GN&RC), on March 14, 2012, the
Management Board granted 44,975 performance shares
with effect from April 26, 2012 and on March 4, 2013,
granted 36,056 Performance Shares.
As at March 4, 2013, after the cancellation of Performance
Shares due to staff departures, the potential number of new
shares under Plan no. 1 Performance is 77,235.

CONSOLIDATED FINANCIAL STATEMENTS
CORPORATE SUSTAINABILITY
BUSINESS REVIEW AND 2012 RESULTS
PORTFOLIO
UNIBAIL-RODAMCO - FINANCIAL REPORT 2012 188 • 189
Performance share information as at March 4, 2013 (Table no. 8 – AMF/Afep-Medef recommendations)
Date of the Plan 2012 2013
Date of Board 14/03/2012 04/03/2013
Total number of performance shares allocated: 44,975 36,056
By responsible offi cers
G. Poitrinal(1) 2,845 0
C. Cuvillier (2) 1,992 2,500
C. Pourre(3) 1,366 1,200
J. Tonckens(4) 1,707 1,500
Starting date of the vesting period 26/04/2012 04/03/2013
Allocation date and starting date of the holding period
• for French tax residents(5) 26/04/2015 04/03/2016
• for non-French tax residents(5) 26/04/2016 04/03/2017
End of lock-up period (at the end of the trading day)
• for French tax residents(6) 26/04/2017 04/03/2018
• for non-French tax residents(7) 26/04/2016 04/03/2017
Outstanding Performance shares 41,179 36,056
(1) Member of Unibail-Rodamco SE Management Board since June 2007, Mr Guillaume Poitrinal’s mandate as Chairman of the Management Board will expire on April 25, 2013.(2) Member of Unibail-Rodamco SE Management Board since June 2011, Mr Christophe Cuvillier was appointed Chairman of the Management Board by the Supervisory Board held on March 4, 2013, upon the recommendation of the GN&RC, with effect as of April 25, 2013.(3) Member of Unibail-Rodamco SE Management Board since June 2007. Mrs Catherine Pourre’s mandate was renewed by the Supervisory Board on March 4, 2013, upon the recommendation of the GN&RC, with effect April 25, 2013.(4) Member of Unibail-Rodamco SE Management Board since September 2009. Mr Jaap Toncken’s mandate was renewed by the Supervisory Board on March 4, 2013, upon the recommendation of the GN&RC, with effect April 25, 2013.(5) Subject to the completion of the Performance condition which shall be restrictively tested four times (“restrictive tests”) during the Vesting Period as of April 26, 2015 for the 2012 Plan and March 4, 2016 for the 2013 Plan. If the performance condition is not met on one of the “restrictive tests”, all rights are definitively lost on April 26, 2017 (Plan 2012) and on March 4, 2018 (Plan 2013).(6) Subject to the Performance condition being met on April 26, 2015 (Plan 2012) and on March 4, 2016 (Plan 2013). If not, the holding period will expire two years after the effective restrictive test.(7) Subject to the Performance condition being met before April 26, 2016 (Plan 2012) and March 4, 2017 (Plan 2013). If not, the lock-up period could be extended untill April 26, 2017 (Plan 2012) and March 4, 2018 (Plan 2013) at the latest.
2.3.3. Warrants to purchase existing shares
and/or subscribe for new shares
None.
2.3.4. ORA (Bonds redeemable in shares)
Pursuant to the Rodamco Europe NV Public Exchange
Offer, 9,363,708 ORA were issued in part consideration for
the shares contributed by Rodamco Europe NV shareholders.
As at December 31, 2012, 9,355,883 ORA had been redeemed
for shares. The remaining ORA, yet to be converted, as at
December 31, 2012, is 7,825. A total of 9,781(5) potential new
shares may be issued out of the exercise of the ORA based
on the redemption ratio of 1.25 following the exceptional
distribution of May 10, 2011. For full details on the ORA, please
refer to the “Note d’opération” approved by the Autorité des
marchés fi nanciers (AMF) (French financial markets authority)
under visa no. 07-152 dated May 18, 2007(6).
2.3.5. ORNANE (Bonds redeemable in cash
and/or in new and/or existing shares)
ORNANE issuance on April 29, 2009
On April 29, 2009, Unibail-Rodamco SE issued 3,928,670
ORNANE at a nominal value of €146.36 and for a total
amount of €575 million (The “Note d’opération” approved by
the Autorité des marchés fi nanciers (AMF) (French financial
markets authority) under visa no. 09-104 dated April 21, 2009).
On November 16, 2012, Unibail-Rodamco SE decided to
redeem all the 1,595,067 remaining ORNANE issued in 2009.
The remaining 2009 ORNANE were redeemed at the nominal
value plus accrued interest. As at January 2, 2013, all of the
2009 ORNANE have been redeemed.
(5) Subsequent to ORA holder entitlement to round up fractional shareholdings.(6) Available for free on the company’s website or on request.

REPORT OF THE CHAIRMAN OF THE SUPERVISORY BOARD
LEGAL INFORMATION
FINANCIAL REPORT 2012 - UNIBAIL-RODAMCO 188 • 189
ORNANE issuance on September 19, 2012
On September 19, 2012, Unibail-Rodamco SE issued
3,451,767 ORNANE at a nominal value per unit of €217.28,
representing a total amount of €750 million.
The 2012 ORNANE will be potentially convertible from
April 1, 2013. The rate of conversion is 1. For full details on
the 2012 ORNANE, please refer to the “Note d’opération”
approved by the Autorité des marchés fi nanciers (AMF) (French
financial markets authority) under visa no. 12-440 dated
September 11, 2012.
2.4. Share buy-back programme
Pursuant to Article L. 225-209 et seq. of the French
Commercial Code and the European Commission Regulation
no. 2273/2003 of December 22, 2003, the Combined General
Meeting held on April 26, 2012 authorised the Management
Board, for a period of eighteen months, to buy-back Company
shares up to the legal limit of 10% of the total number of
outstanding shares adjusted for any change in the share
capital during the authorisation period, with a view to:
(i) cancelling all or part of the shares purchased under
Article L. 225-209 of the French Commercial Code,
subject to the General Meeting’s authorisation to reduce
the Company’s share capital;
(ii) holding shares that may be allotted to its executive officers
and employees and to those of affiliated companies under
the terms and conditions provided by law pursuant to
the Company’s stock option schemes, free allotments of
existing shares or Company or inter-company employee
stock purchase plans;
(iii) holding shares that enable it to allot shares upon the
exercise of rights attached to negotiable securities
giving access to the share capital by way of redemption,
conversion, exchange, presentation of a warrant, or in any
other manner;
(iv) holding shares that may be retained and subsequently
used by way of exchange or payment in the context of
external growth operations (including the acquisition of
interests) without exceeding the limit laid down by Article
L. 225-209 of the French Commercial Code in the context
of mergers, spin-offs or contributions in kind;
(v) stimulating the market in and the liquidity of the shares
through an investment intermediary in the context of a
liquidity contract;
(vi) implementing any new market practice which might be
approved by the Autorité des marchés fi nanciers (AMF)
(French fi nancial markets authority) and, more generally,
carrying out any transaction permitted under the
regulations in force.
The maximum share buy-back purchase price is fixed at
€200 per share, excluding costs, based on a nominal value
of €5/share. The total cost of the share buy-back programme
must not exceed €1.83 billion.
At the General Meeting to be held on April 25, 2013, the
Management Board will propose to shareholders that they
renew this authorisation for a period of eighteen months
on the same terms and conditions, i.e a maximum share
buy-back purchase price at €200 per share, excluding costs,
based on a nominal value of €5/share. The total cost of the
share buy-back programme must not exceed €1.89 billion
pursuant to the share capital as at December 31, 2012 (i.e
94,891,980 shares).
This new authorisation, subject to shareholder approval,
would replace the authorisation granted on April 26, 2012.
Review of share buy-back programme (March 2, 2012
to March 1, 2013)
Between March 2, 2012 and April 26, 2012, the Company
did not buy back any shares pursuant to the General Meeting
authorisation of April 27, 2011.
From April 26, 2012 to March 1, 2013, the Company did
not buy back any shares pursuant to the General Meeting
authorisation of April 26, 2012.
As at March 1, 2013, the Company does not hold any of its
own shares.
Situation as at March 1, 2013
% of the treasury shares held directly or indirectly on the date of the publication of the programme 0%
Number of cancelled shares during the last 24 months 137,270
Number of shares held in the portfolio as at March 1, 2013 0
Accountant value of the portfolio €0
Market value of the portfolio €0

CONSOLIDATED FINANCIAL STATEMENTS
CORPORATE SUSTAINABILITY
BUSINESS REVIEW AND 2012 RESULTS
PORTFOLIO
UNIBAIL-RODAMCO - FINANCIAL REPORT 2012 190 • 191
Information on transactions between April 26, 2012 and March 1, 2013
Gross totals Open positions on prospectus filing date
BuySales/
Transfers Buy Sell
Purchased call options Forward buy
Sales call options
Forward sale
Number of shares – – – – – –
Average maximum maturity – – – – – –
Average transaction price (€/share) – – – – – –
Total amount – – – – – –
The Company has not entered into any market-making or
liquidity agreements.
The Company has not used any derivative products as part
of its share buy-back programme.
2.5. Pledged Company shares
As at March 1, 2013, 261,825 shares were pledged in
a registered custodian account (nominatif administré).
No standard registered shares (nominatif pur) were pledged.
2.6. Escheat shares
Within the framework of the procedure set forth in Article
L. 228-6 of the French Commercial Code, Company shares
unclaimed by shareholders for a period of two years following
the publication of a notice in the newspaper La Tribune on
July 8, 2005, were sold. The shareholders whose shares were
sold may claim the counter value from Caceis (the Company’s
share registrar).
2.7. Other securities granting access to the share capital
None.
2.8. Dividends/Distribution of profits
Dividends are paid out of profits, retained earnings and, if
necessary, distributable reserves.
In respect of the 2011 fi nancial year, the Company
made a distribution of €8.00 per share deducted from the
“distributable reserves” (as authorised by the General
Assembly on April 26, 2012), paid on May 10, 2012.
The total distribution with respect to the 2011 fi nancial
year was €735.35 million.
With respect to the 2012 fi nancial year, on the basis of
the consolidated recurring result of €9.60(7) per share, the
Management Board will propose to shareholders at the
General Meeting to be held on April 25, 2013, that they approve
the accounts for the financial year ending December 31, 2012
and the payment of a dividend of €8.40 per share to be paid
out of distributable profits, which is an increase of 5% in
relation to 2011. This represents a distribution rate of 88%
of the recurring net result per share which is in line with the
distribution rate of 2011.
Subject to the approval of the General Assembly, on
June 3, 2013 the shareholders of the Group will receive for
each owned Unibail-Rodamco share:
• €5.27 per share in cash paid from the Group’s tax exempt
real estate activities (dividend issued from the “SIIC” regime).
Such dividend, which corresponds to the distribution
obligation under the SIIC regime, will not be subject to
the new additional 3% tax payable by each company upon
the amount of dividend distributed, but will be subject to
French withholding tax for both French and foreign mutual
funds (OPCVM), and will not benefi t from the 40% rebate
for individual shareholders who are tax residents in France;
• €3.13 per share paid from the Group’s non-tax exempt
activities (dividend issued from the activities which are not
in the “SIIC» regime), for which the shareholders will have
the option to elect payment in either (i) new shares created
at a discount of 7%, or (ii) in cash. When paid in shares,
the Group will not be liable to pay the new additional 3%
tax on this part of the dividend. When paid in cash, this
dividend will generate a 3% tax expense payable directly by
the Group upon dividend distribution. Whether paid in cash
or in shares, this dividend issued from activities which are
not in the “SIIC” regime will not bear French withholding
tax for both French and foreign OPCVM and may benefi t
from the 40% rebate for individual shareholders who are tax
residents in France.
(7) Split based on the number of existing shares as at December 31, 2012.

REPORT OF THE CHAIRMAN OF THE SUPERVISORY BOARD
LEGAL INFORMATION
FINANCIAL REPORT 2012 - UNIBAIL-RODAMCO 190 • 191
For investors which are not OPCVM or individuals who are
French tax residents, withholding tax may apply as usual on
the whole dividend, regardless of the tax exempt or non-tax
exempt origin of the distribution.
Note: Dividends that remain unclaimed for a period of five
years from the date they are made available for payment are
paid to the French Treasury, in accordance with Article L. 27
of the French State Property Code (Code du domaine de l’État
au Trésor public).
Increases/decreases in Unibail-Rodamco‘s share capital during the past three years
Date Movements in the share capital Number of shares issuedTotal number
of shares Total share capitalPremium resulting from transaction
01/03/2010 Exercise of options (2002-2005) 42,410 91,306,959 €456,534,795 €3,139,535.78
07/05/2010 Exercise of options (2002-2005) 98,719 91,405,678 €457,028,390 €7,596,364.73
24/06/2010 Exercise of options (2002-2005) 7,771 91,413,449 €457,067,245 €494,678.35
24/06/2010 Reimbursement of ORA 4 91,413,453 €457,067,265 €665.60
24/06/2010 Company Savings Plan 30,579 91,444,032 €457,220,160 €3,175,626.15
11/10/2010 Exercise of options (2002-2005) 270,344 91,714,376 €458,571,880 €19,977,434.14
10/10/2010 Reimbursement of ORA 1,907 91,716,283 €458,581,415 €337,618.75
31/12/2010 Exercise of options (2004-2006) 19,509 91,735,792 €458,678,960 €1,608,693.75
31/12/2010 Reimbursement of ORA 10,132 91,745,924 €458,729,620 €1,568,825.35
10/03/2011 Exercise of options (2004-2006) 16,331 91,762,255 €458,811,275 €1,210,623.54
10/05/2011 Exercise of options (2004-2006) 128,134 91,890,389 €459,451,945 €11,267,171.04
30/06/2011 Exercise of options (2004-2006) 5,990 91,896,379 €459,481,895 €725,635.70
30/06/2011 Reimbursement of ORA 2 91,896,381 €459,481,905 €297.83
30/06/2011 Company Savings Plan 28,766 91,925,147 €459,625,735 €3,350,951.34
18/10/2011 Exercise of options (2004-2007) 13,603 91,938,750 €459,693,750 €1,289,413.54
18/10/2011 Reimbursement of ORA 4 91,938,754 €459,693,770 €613.80
19/10/2011 Cancellation of shares (128,370) 91,810,384 €459,051,920 €(15,567,844.45)
25/11/2011 Exercise of options (2005-2007) 146 91,810,530 €459,052,650 €18,025.16
25/11/2011 Cancellation of shares (8,900) 91,801,630 €459,008,150 €(1,083,085.50)
31/12/2011 Exercise of options (2005-2007) 5,259 91,806,889 €459,034,445 €427,924.83
05/09/2012 Exercise of options (2005-2007) 112,092 91,918,981 €459,594,905 €12,118,325.55
29/06/2012 Exercise of options (2005-2007) 880 91,919,861 €459,599,305 €82,128.10
29/06/2012 Reimbursement of ORA 435 91,920,296 €459,601,480 €66,241.80
29/06/2012 Company Savings Plan 41,077 91,961,373 €459,806,865 €4,236,051.16
31/08/2012 Exercise of options (2005-2007) 254,181 92,215,554 €461,077,770 €32,532,522.48
01/10/2012 Exercise of options (2005-2007) 21,415 92,236,969 €461,184,845 €2,887,718.20
31/12/2012 Exercise of options (2005-2008) 642,004 92,878,973 €464,394,865 €74,332,174.72
31/12/2012 Reimbursement of ORNANE 2,013,007 94,891,980 €474,459,900 N/A
Note: Increases in the share capital associated with the exercise of options and reimbursements of ORA and ORNANE are taken into account by a statement of the Management Board.
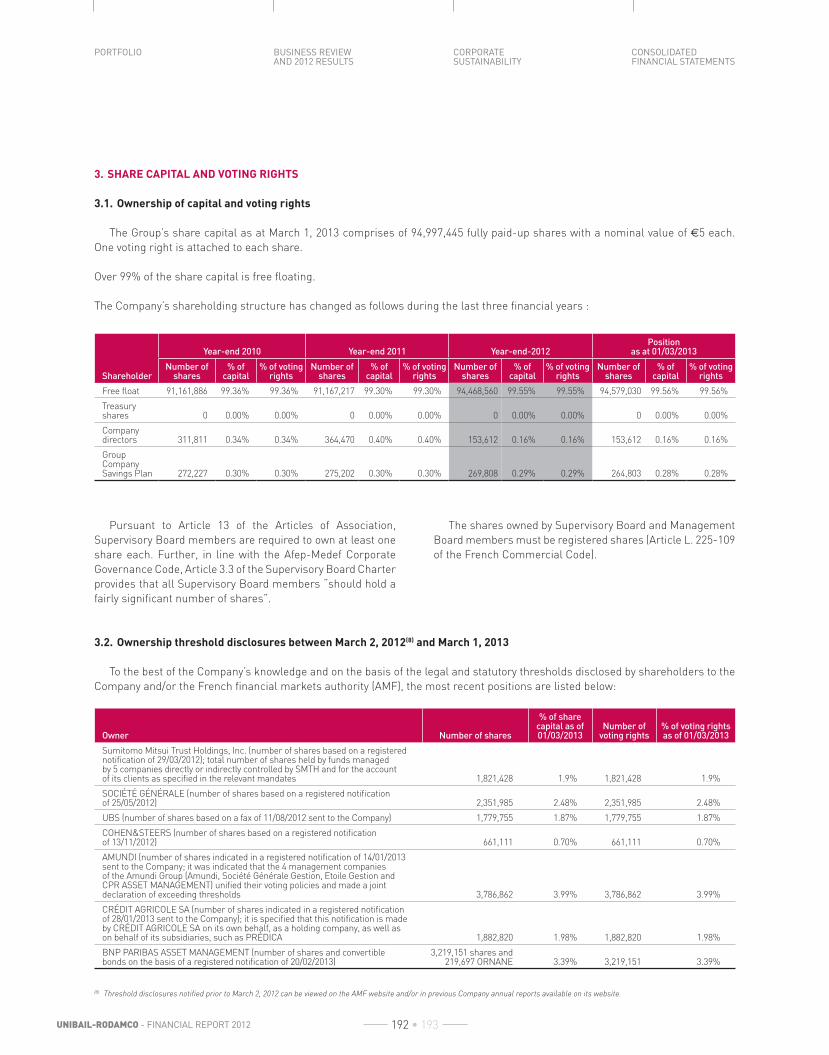
CONSOLIDATED FINANCIAL STATEMENTS
CORPORATE SUSTAINABILITY
BUSINESS REVIEW AND 2012 RESULTS
PORTFOLIO
UNIBAIL-RODAMCO - FINANCIAL REPORT 2012 192 • 193
3. SHARE CAPITAL AND VOTING RIGHTS
3.1. Ownership of capital and voting rights
The Group’s share capital as at March 1, 2013 comprises of 94,997,445 fully paid-up shares with a nominal value of €5 each.
One voting right is attached to each share.
Over 99% of the share capital is free floating.
The Company’s shareholding structure has changed as follows during the last three financial years :
Shareholder
Year-end 2010 Year-end 2011 Year-end-2012Position
as at 01/03/2013
Number of shares
% of capital
% of voting rights
Number of shares
% of capital
% of voting rights
Number of shares
% of capital
% of voting rights
Number of shares
% of capital
% of voting rights
Free float 91,161,886 99.36% 99.36% 91,167,217 99.30% 99.30% 94,468,560 99.55% 99.55% 94,579,030 99.56% 99.56%
Treasury shares 0 0.00% 0.00% 0 0.00% 0.00% 0 0.00% 0.00% 0 0.00% 0.00%
Company directors 311,811 0.34% 0.34% 364,470 0.40% 0.40% 153,612 0.16% 0.16% 153,612 0.16% 0.16%
Group Company Savings Plan 272,227 0.30% 0.30% 275,202 0.30% 0.30% 269,808 0.29% 0.29% 264,803 0.28% 0.28%
Pursuant to Article 13 of the Articles of Association,
Supervisory Board members are required to own at least one
share each. Further, in line with the Afep-Medef Corporate
Governance Code, Article 3.3 of the Supervisory Board Charter
provides that all Supervisory Board members “should hold a
fairly significant number of shares”.
The shares owned by Supervisory Board and Management
Board members must be registered shares (Article L. 225-109
of the French Commercial Code).
3.2. Ownership threshold disclosures between March 2, 2012(8) and March 1, 2013
To the best of the Company’s knowledge and on the basis of the legal and statutory thresholds disclosed by shareholders to the
Company and/or the French financial markets authority (AMF), the most recent positions are listed below:
Owner Number of shares
% of share capital as of 01/03/2013
Number of voting rights
% of voting rights as of 01/03/2013
Sumitomo Mitsui Trust Holdings, Inc. (number of shares based on a registered notifi cation of 29/03/2012); total number of shares held by funds managed by 5 companies directly or indirectly controlled by SMTH and for the account of its clients as specifi ed in the relevant mandates 1,821,428 1.9% 1,821,428 1.9%
SOCIÉTÉ GÉNÉRALE (number of shares based on a registered notification of 25/05/2012) 2,351,985 2.48% 2,351,985 2.48%
UBS (number of shares based on a fax of 11/08/2012 sent to the Company) 1,779,755 1.87% 1,779,755 1.87%
COHEN&STEERS (number of shares based on a registered notifi cation of 13/11/2012) 661,111 0.70% 661,111 0.70%
AMUNDI (number of shares indicated in a registered notification of 14/01/2013 sent to the Company; it was indicated that the 4 management companies of the Amundi Group (Amundi, Société Générale Gestion, Etoile Gestion and CPR ASSET MANAGEMENT) unifi ed their voting policies and made a joint declaration of exceeding thresholds 3,786,862 3.99% 3,786,862 3.99%
CRÉDIT AGRICOLE SA (number of shares indicated in a registered notification of 28/01/2013 sent to the Company); it is specifi ed that this notifi cation is made by CRÉDIT AGRICOLE SA on its own behalf, as a holding company, as well as on behalf of its subsidiaries, such as PRÉDICA 1,882,820 1.98% 1,882,820 1.98%
BNP PARIBAS ASSET MANAGEMENT (number of shares and convertible bonds on the basis of a registered notifi cation of 20/02/2013)
3,219,151 shares and 219,697 ORNANE 3.39% 3,219,151 3.39%
(8) Threshold disclosures notified prior to March 2, 2012 can be viewed on the AMF website and/or in previous Company annual reports available on its website.

REPORT OF THE CHAIRMAN OF THE SUPERVISORY BOARD
LEGAL INFORMATION
FINANCIAL REPORT 2012 - UNIBAIL-RODAMCO 192 • 193
3.3. Shareholder agreement
To the best of the Company’s knowledge, there is no
shareholders’ agreement, nor any person or group of persons
exercising or capable of exercising control over the Company.
3.4. Code of conduct
Unibail-Rodamco SE’s Supervisory Board and
Management Board members and all staff must comply
with the Unibail-Rodamco SE Group Compliance Book
(including a Code of Ethics and Insider Trading Rules)
applicable to individual dealings in the Company’s securities.
In particular, there is an obligation to refrain from dealing
in Unibail-Rodamco SE shares (or financial instruments
associated with such securities) during the 30-day period
preceding the publication of the annual and half-year results.
The Company’s Supervisory Board and Management Board
members and certain employees, who by reason of their
functions have access to insider information, are classified
as permanent or temporary insiders within the meaning of
Article 622-2 of the French financial market authority’s (the
AMF’s) general rules and regulations.
4. MANAGEMENT BOARD AND SUPERVISORY BOARD
4.1. Composition of the Management Board as at December 31, 2012
Mr Guillaume PoitrinalChairman of the Management BoardChief Executive Officer of Unibail-Rodamco SEBorn on December 22, 1967French nationalFirst Mandate: June 26, 2007Renewal of mandate: May 15, 2009Mandate expires: AGM 2013(1)
Other current Functions and Mandates outside of the Unibail-Rodamco Group• Representative of Unibail-Rodamco as Member of the European Public Real Estate Association (EPRA)• Representative of Unibail-Rodamco as Member of the French Fédération des Sociétés Immobilières et
Foncières (FSIF)• Member of the Ethics Committee of the MEDEF• Director of Pavillon de l’Arsenal• Representative of Unibail-Rodamco on the Boards of Directors of Société Paris – Île-de-France Capitale
Économique• Permanent representative of Unibail-Rodamco as a Director on the Board of Directors of SOPEXA• Permanent representative of Société Civile du Forum des Halles on the Board of Directors of SEMPARISEINEOther current intra-group Functions and Mandates French Companies• Vice-Chairman of the Supervisory Board of Salon International de l’Alimentation (SIAL) S.A.• Director of Comexposium Holding and Viparis HoldingForeign Companies• Director and Chairman of the Board of Directors of U&R Management B.V.• Member of the Board of the Unibail-Rodamco SE. Permanent Establishment in The Netherlands• Chairman of the Supervisory Board of Rodamco Europe N.V.Previous Mandates during the last 5 years• Representative of Unibail-Rodamco as Chairman of the European Public Real Estate Association (EPRA) • Permanent representative of Unibail-Rodamco Participations S.A.S. on the Supervisory Board of SEML
Nouvelle du Parc du Futuroscope• Chairman and CEO of Unibail-Rodamco S.A.• Chairman of Groupe Exposium Holding S.A.S. and Doria S.A.S.• Director of Viparis – Palais des Congrès Paris and of Viparis -Porte de Versailles• Representative of Unibail-Rodamco on the Board of Directors of Viparis Holding (formerly Unibail Rodamco
Finance)• Representative of Doria S.A.S. as the manager of Financières 5 MalesherbesCV• Graduate of HEC Business School• Started his career at Morgan Stanley in London and Paris with the M&A and Corporate Finance departments• Joined Unibail in 1995• Appointed the CEO of Unibail in April 2005 and took over the chairmanship of the Board of Directors
in June 2006• Chairman of the Management Board and CEO of Unibail-Rodamco since June 2007

CONSOLIDATED FINANCIAL STATEMENTS
CORPORATE SUSTAINABILITY
BUSINESS REVIEW AND 2012 RESULTS
PORTFOLIO
UNIBAIL-RODAMCO - FINANCIAL REPORT 2012 194 • 195
Mr Christophe CuvillierMember of the Management BoardChief Operating Officer of Unibail-Rodamco SEBorn on December 5, 1962 French nationalFirst Mandate: June 1, 2011 Mandate expires: AGM 2017
On March 4, 2013, the Supervisory Board, on the recommendation of the GN&RC, appointed Mr Christophe Cuvillier as Chairman of the Management Board to be effective from April 25, 2013
Other current Functions and Mandates outside of the Unibail-Rodamco GroupFrench Company• Director of Cariboom.comOther current intra-group Functions and Mandates Foreign Companies• Member of the Board of the Unibail-Rodamco SE. Permanent Establishment in The Netherlands• Member of the Board of Directors and Secretary of Unibail Rodamco Inversiones SLU and Unibail Rodamco
Ocio SLU.• Member of the Board of Directors and Chairman of Proyectos Inmobiliaros New Visions, S.L.U, Unibail
Rodamco Proyecto Badajoz S.L.U., Essential Whites, S.L.U, Promociones Inmobiliarias Gardiner, S.L.U, Unibail Rodamco Steam, S.L.U, Proyectos Inmobiliarios Time Blue, S.L.U
Previous Mandates during the last 5 yearsFrench Companies• Chairman and CEO of FNAC• Chairman and CEO of ConforamaCV• Graduate of HEC business school• Prior to joining Unibail-Rodamco, Mr Cuvillier held various positions within the PPR Group from 2000; notably,
CEO of FNAC from 2008 to 2010 and CEO of Conforama from 2005 to 2008.• Prior to PPR, he spent 14 years with the Luxury Products Division of the L’Oreal Group, both in France
and abroad
Mr Michel DessolainMember of the Management Board from June 26, 2007 to October 15, 2012Born on December 2, 1955 French national
Other current intra-group Functions and Mandates Foreign Companies• Member of the Board of U&R Management B.V.Previous Mandates during the last 5 years French Companies• Member of the Management Board and Chief Operating Offi cer (COO) of Unibail-Rodamco SE
until May 31, 2011• Member of the Management Board and Chief Strategy Offi cer (CSO) of Unibail-Rodamco SE from June 1, 2011
until October 15, 2012Foreign Companies• Member of the Board of Directors and Secretary of Unibail-Rodamco Parques Comerciales SLU, Unibail-
Rodamco Garbera SL, Unibail-Rodamco Vallsur SL and Unibail-Rodamco Levante SLU.• Member of the Board of Directors and Secretary of Unibail-Rodamco Inversiones SLU and Unibail-Rodamco
Ocio SLU.• Member of the Board and Chairman of Promociones Unibail-Rodamco Generales SLU• Member of the Board of Directors and Chairman of Proyectos Inmobiliaros New Visions, S.L.U, Unibail-
Rodamco Proyecto Badajoz S.L.U., Essential Whites, S.L.U, Promociones Inmobiliarias Gardiner, S.L.U, Unibail-Rodamco Steam, S.L.U and Proyectos Inmobiliarios Time Blue, S.L.U.
• Member of the Board of Rodamco Espana B.V.CV• Masters Degree in Law and Graduate of École Spéciale des Travaux Publics• Started his career with La Caisse des Dépôts et Consignations, then held international development positions
for the retail company Habitat • He joined Unibail in 1997 as Espace Expansion Deputy Managing Director

REPORT OF THE CHAIRMAN OF THE SUPERVISORY BOARD
LEGAL INFORMATION
FINANCIAL REPORT 2012 - UNIBAIL-RODAMCO 194 • 195
Mrs Catherine PourreMember of the Management BoardChief Resources Officer of Unibail-Rodamco SEBorn on February 2, 1957French nationalFirst Mandate: June 26, 2007Renewal of mandate: May 15, 2009Mandate expires: AGM 2017
On March 4, 2013, the Supervisory Board, on the recommendation of the GN&RC, renewed Mrs Catherine Pourre in her current position for a four-year period as from April 25, 2013.
Other current Functions and Mandates outside of the Unibail-Rodamco GroupFrench Company• Director, member of the Audit Committee and Chair of the Remuneration Committee of Neopost S.A.
(listed company)Other current intra-group Functions and Mandates French Companies• Chairman and CEO of Société de Tayninh (listed company)• Chairman of Doria S.A.S. and Unibail Management S.A.S.• Director of Comexposium Holding and Unibail-Rodamco Participations • Director and Chairman of the Audit Committee and of the Nomination and Remuneration Committee
of Viparis Holding• Supervisory Board Member of Uni-Expos• Chairman of the Audit Committee of SCI PropexpoForeign Companies• Management Board member of Rodamco Europe N.V.• Management Board member of Rodamco Europe Beheer B.V.• Director of U&R Management B.V.• Member of the Board of the Unibail-Rodamco SE. Permanent Establishment in The Netherlands• Representative of Unibail-Rodamco on Board of Directors of Crossroads Property Investors SA• Representative of Rodamco Europe N.V., itself director of 8 UR subsidiariesPrevious Mandates during the last 5 yearsFrench Companies• Chairman and CEO of Viparis Holding (formerly Unibail Rodamco Finance)• Deputy CEO of Doria S.A.S. and Groupe Exposium Holding• Permanent representative of Groupe Exposium Holding on the Supervisory Board of Salon International
de l’Alimentation (SIAL) S.A. and on the Board of Directors of Comexposium • Representative of Doria S.A.S. on the Boards of Directors of Viparis-Porte de Versailles, Exposima and Intermat• Director of Européenne de Salons, Viparis-Porte de Versailles, Viparis-Le Palais des Congrès de Paris• Manager of Espace Expansion Immobilière• Director of Union Immobilière InternationaleCV• Graduate from ESSEC Business School• CPA (Certified Public Accountant) degree and Masters degree in Law (Université Catholique de Paris)• Started her career at PricewaterhouseCoopers and was a Partner there from 1989 to 1999• Executive Director of Cap Gemini Ernst & Young France from 1999 • Joined Unibail SA in 2002 as Executive Vice President in charge of Finance, Human Resources, IT, Legal and
Property Engineering Departments and Member of the Executive Committee
Mr Peter van RossumMember of the Management Board from June 26, 2007 to June 30, 2012Born on May 31, 1956Dutch national
Other current Functions and Mandates outside of the Unibail-Rodamco GroupForeign Companies• Member of the Management Board and Chief Financial Offi cer of SBM offshore N.V.• Director of 23 subsidiaries of SBM offshore N.V.Other current intra-group Functions and Mandates Foreign Company• Member of the Board of Stichting RodamcoPrevious Mandates during the last 5 yearsFrench Companies• Member of the Management Board and Chief Financial Offi cer (CFO) of Unibail-Rodamco SE until June 30, 2012• Chairman of RE FRANCE Financing S.A.S. Foreign Companies• CFO and Management Board member of Rodamco Europe N.V • Representative of the Unibail-Rodamco SE. Permanent Establishment in The Netherlands• Member of the Board of Rodamco Europe Beheer B.V., Rodamco Europe Finance B.V., Rodamco Europe
Finance II B.V., Rodamco Central Europe B.V., Rodamco Austria B.V.,• Rodamco Czech B.V., Rodamco Russia B.V., Rodamco Hungary B.V., Rodamco Deutschland B.V., Rodamco
Project I B.V., Dotterzwaan B.V., Cijferzwaan B.V., Rodamco Nederland B.V., Rodamco España B.V., Unibail-Rodamco Poland 2 B.V., Rodamco Nederland Winkels B.V., Unibail-Rodamco Poland I B.V., Unibail-Rodamco Poland 4 B.V., Unibail-Rodamco Poland 5 B.V., Crystal Warsaw Real Estate B.V., U&R Management B.V.
• Member of the Board of Directors of New Tower Real Estate B.V and of Old Tower Real Estate B.V CV• Masters Degree in Business Economics at the Free University of Amsterdam• Chartered Accountant’s degree at the Free University of Amsterdam• Built extensive experience over 24 years in financial positions with Shell in Europe, Middle East, United States
and Asia, was Regional Finance Director for Shell’s Exploration and Production business in Asia/Pacific• Was CFO at NAM, the Dutch upstream joint venture between Shell and Exxon• Joined Rodamco Europe NV in 2006 as CFO

CONSOLIDATED FINANCIAL STATEMENTS
CORPORATE SUSTAINABILITY
BUSINESS REVIEW AND 2012 RESULTS
PORTFOLIO
UNIBAIL-RODAMCO - FINANCIAL REPORT 2012 196 • 197
Mr Jaap TonckensMember of the Management BoardChief Financial Officer of Unibail-Rodamco SEBorn on July 16, 1962Dual American/Dutch nationalFirst Mandate: September 1, 2009Mandate expires: AGM 2017
On March 4, 2013, the Supervisory Board, on the recommendation of the GN&RC, renewed Mr Jaap Tonckens in his current position for a four-year period as from April 25, 2013.
Other current intra-group Functions and Mandates French Companies• Chairman of Uni-Commerces S.A.S., itself Chairman of 20 UR subsidiaries and manager of 44 UR subsidiaries• Chairman of Immobilière Lidice S.A.S., itself Chairman of 12 UR subsidiaries and manager of 19 UR subsidiaries• Chairman of Rodamco-France• Chairman of the Board Committee of Chesnay Pierre 2Foreign Companies• Representative of the Unibail-Rodamco SE. Permanent Establishment in The Netherlands• Representative of Rodamco Europe NV, itself director of 8 UR subsidiaries• Representative of Rodamco Nederland BV, itself director of 1 UR subsidiary ,• Representative of Rodamco Nederland Winkels BV, itself director of 1 UR subsidiary,• Representative of Unibail-Rodamco Nederland Winkels BV, itself director of 1 subsidiary,• Representative of Unibail-Rodamco Poland 2 BV, itself director of 2 subsidiaries• Member of the Board of Directors of Unibail-Rodamco Austria Management GmbH, Unibail-Rodamco
Austria Verwaltungs GmbH, Shopping Center Planungs- und Entwicklungsgesellschaft mbH, SCS Motor City Süd Errichtungsgesellschaft mbH, SCS Liegenschaftsverwertung GmbH, DZ-Donauzentrum Besitz- und Vermietungs-GmbH, Unibail-Rodamco Invest GmbH, Unibail-Rodamco Liegenschaftserwerbs GmbH
• Member of the Board of Directors of Unibail-Rodamco Česká republika, s.r.o., Centrum Praha Jih-Chodov s.r.o., CENTRUM ČERNÝ MOST, a.s., Rodamco Pankrác, a.s., Moravská Obchodní, a.s., CENTRUM CHODOV, a.s.
• Member of the Board of Directors of Rodamco Deutschland GmbH• Member of the administrative Board (Verwaltungsrat) of Ring-Center I Berlin KG (formerly
Kommanditgesellschaft Schliebe & Co. Geschäftzentrum Frankfurter Allee (Friedrichshain)• Member of the Board of Directors of Euro-mall Kft• Representative of Rodamco Czech BV on Board of Directors of UNIBORC S.A.• Member of the Board of GSSM Warsaw Sp. zo.o., WSSM Warsaw Sp. z o.o., ,Gdansk Station Shopping Mall Sp.
z o.o., Wilenska Station Shopping Mall Sp. z o.o.,. Arkadia Centrum Handlowe Sp. z o.o., Wilenska Centrum Handlowe Sp. z o.o., Rodamco CH1 Sp. z o.o.,
• Member of the Board of Rodamco Europe N.V., Rodamco España B.V., Rodamco Europe Beheer B.V., Rodamco Central Europe B.V., Rodamco Russia B.V., Rodamco Austria B.V., Rodamco Hungary B.V., Rodamco Czech B.V., Rodamco Deutschland B.V., Dotterzwaan B.V., Cijferzwaan B.V., Unibail-Rodamco Poland 2 B.V., Unibail-Rodamco Poland 4 B.V., Unibail-Rodamco Poland 5 B.V., Rodamco Project I B.V., Rodamco Nederland Winkels B.V., Unibail-Rodamco Poland I B.V.,Unibail-Rodamco Nederland Winkels B.V. (formerly RRN Monumenten B.V.), Rodamco Nederland B.V., Crystal Warsaw Real Estate B.V., U&R Management B.V., Rodamco Europe Finance B.V., Rodamco Europe Finance II B.V
• Member of the Board of Directors and Chairman of Unibail-Rodamco Inversiones SLU and of Unibail-Rodamco Ocio SLU.
• Member of the Board of Directors and Secretary of Proyectos Inmobiliaros New Visions, S.L.U., Unibail-Rodamco Proyecto Badajoz S.L.U., Essential Whites, S.L.U., Promociones Inmobiliarias Gardiner, S.L.U., Unibail-Rodamco Steam, S.L.U., Proyectos Inmobiliarios Time Blue, S.L.U.
• Member of the Board of Directors of Aupark a.s., Aupark Property Holding a.s. and Aupark Bratislava spol. s r.o.• Member of the Board of Rodamco Sverige A.B., Fisketorvet Shopping Center, • Chairman of the Board of Rodamco Northern Europe A.B., Eurostop A.B., Eurostop Holding A.B., Rodamco
Management A.B., Fastighetsbolaget Grindtorp AB, Fastighetsbolaget Helsingborg Ostra A.B., Rodamco Projekt A.B., Fastighetsbolaget Helsingborg Vastra A.B., Rodamco Centerpool A.B., Knölsvanen Bostad A.B., Rodamco Solna Centrum A.B., Piren A.B., Rodamco A.B., Rodamco Väsby Centrum A.B., Rodamco Expand A.B., Rodamco Nova Lund 2 A.B., Rodamco Holding A.B., Rodamco Parkering A.B., Rodamco Invest A.B., Rodamco Fisketorvet A.B., Rodamco Nacka A.B., Rodamco Täby A.B., Rodamco Nova Lund 3 A.B., Rodamco Tumlaren A.B., Rodamco Garage A.B., Anlos Fastighets AB, Rodamco Scandinavia Holding AB, Fastighetsbolaget Anlos H AB, Fastighetsbolaget Anlos L AB, Rodamco Handel AB, Fastighetsbolaget Anlos K AB, Rodareal OY
Previous Mandates during the last 5 years• French Companies• Manager of Groupe BEG, Unibail-Rodamco SIF France, Unibail-Rodamco SIF Services, TC DESIGN,
Sarl Foncière Immobilière• Co-Managing Director of Foncière d’Investissement• Foreign Companies• Chairman and manager of Unibail-Rodamco SI B.V.• Chairman of Solna Torg Fastighets A.B,Trumpetsvanen Bostad AB, Rodamco Tyresö Centrum AB, Rodamco
Eneby AB, Väsby Handel Fastighet AB,Tyresö Hus Fastighet AB, Väsby Hus Fastighet AB, Fastighetsbolaget Älvringen AB, Haninge Handel Fastighets AB, Fastighetsbolaget ES Örebro AB
• Member of the Board of Directors and Chairman of Unibail-Rodamco Parques Comerciales S.L.U., Unibail-Rodamco Garbera SL, Unibail-Rodamco Vallsur SL, and Unibail-Rodamco Levante S.L.U.
• Member of the Board of Promociones Unibail-Rodamco Generales S.L.U.• Managing Director at Endurance Capital, U.S.A.• Managing Director at Morgan Stanley, Leverage & Acquisition Finance, New YorkCV• Law Degree from Leiden University, The Netherlands• Masters Degree in Law from Emory University, Atlanta, U.S.A.• Started his career as an Associate with Shearman & Sterling L.L.P. in New York and Paris• Associate, Vice-President and Executive Director at Morgan Stanley in London
(1) Mr Guillaume Poitrinal’s mandate as Chairman of the Management Board will expire on April 25,2013.

REPORT OF THE CHAIRMAN OF THE SUPERVISORY BOARD
LEGAL INFORMATION
FINANCIAL REPORT 2012 - UNIBAIL-RODAMCO 196 • 197
4.2. Composition of the Supervisory Board as at December 31, 2012
Mr Rob ter HaarChairman of the Supervisory BoardChairman of the Governance, Nomination & Remuneration CommitteeIndependent member* Attendance: 100% (SB and GN&RC)Born on February 13, 1950 Dutch nationalFirst Mandate: June 25, 2007Mandate renewed: April 27, 2011 SB term expires: AGM 2014Holds 350 U-R shares
Other Current Functions and Mandates• Chairman of the Supervisory Boards of Parcom Capital Management B.V. (NL) and VvAA Groep B.V. (NL)• Member of the Supervisory Boards of Maxeda Retail Group B.V. (NL), Sperwer Holding B.V. (NL), Spar
Holding B.V. (NL), Bergschenhoek Groep B.V. (NL) and advisory member to the Board of Univar Inc. (USA)Previous Mandates during the last 5 years• Member of the Audit Committee of Unibail-Rodamco SE until April 27, 2011• Supervisory Board member of Royal FrieslandCampina N.V. (NL)CV• Masters Degree in Commercial and Corporate Law from Leiden University,The Netherlands• Held the positions of CEO of Hagemeyer N.V.(NL) and CEO of De Boer Unigro N.V.(NL)• Former Board member of the Household & Personal Care division of Sara Lee/DE (NL) and former
General Manager of Mölnlycke (Benelux)
Mr François JaclotVice-Chairman of the Supervisory Board Chairman of the Audit CommitteeIndependent member* Attendance: 100% (SB and Audit Committee)Born on May 1, 1949 French nationalFirst Mandate: June 25, 2007Mandate renewed: April 28, 2010 SB term expires: AGM 2013Holds 335 U-R shares
Other Current Functions and Mandates• Director and CEO of Addax & Oryx Group (AOG) (MT)• Chairman of the Board of Directors of Financière du Bois du Roi (FR)• Managing Director of FJ Consulting (Be)Previous Mandates during the last 5 years• Chairman of the Boards of Directors of FACEO (FR) and SEREN (FR)• Member of the Board of Directors of Axmin (CAN) (listed)CV• Graduate of ENA and the Institut d’études Politiques, Masters Degree in mathematics
and graduate of the École Nationale de Statistiques et d’Administration Économique (ENSAE)• Inspecteur des Finances
Mr Frans CremersMember of the Supervisory Board Member of the Audit CommitteeIndependent member*Attendance: 100% (SB and Audit Committee)Born on February 7, 1952 Dutch nationalFirst Mandate: June 25, 2007Mandate renewed: April 28, 2010 SB term expires: AGM 2013Holds 325 U-R shares
Other Current Functions and Mandates• Vice-Chairman of the Supervisory Boards of Fugro N.V. (NL) (listed) and NS N.V. (NL – Dutch Railways)• Member of the Supervisory Boards of Royal Vopak N.V. (NL) (listed), Luchthaven Schiphol N.V. (NL),
Parcom Capital Management B.V. (NL) and SBM Offshore N.V. (NL) (listed)• Member of the Capital Market Committee of the AFM (The Netherlands Financial Markets Authority)Previous Mandates during the last 5 years• Member of the Committee investigating Fortis NV on behalf of the Enterprise Chamber
of the Amsterdam Court of appeal (2009-2010)CV• Masters Degree in Business Economics and a PhD in Business Finance from the Erasmus University
(Rotterdam – NL)• He was active in Royal/Dutch Shell for 21 years in financial and commercial positions all over the world
including Finance Director of Shell Expro (UK)• From 1997-2004 he was CFO and member of the Executive Board of VNU N.V. (NL)
Mr José Luis DuranMember of the Supervisory Board Member of the Governance, Nomination & Remuneration CommitteeIndependent member* Attendance: 100% (SB and GN&RC)Born on November 8, 1964 Spanish nationalFirst Mandate: April 27, 2011 SB term expires: AGM 2014Holds 350 U-R shares
Other Current Functions and Mandates• CEO of Devanlay S.A. (FR)• CEO and Board Member of Lacoste S.A. (FR)• Commercial VP of Maus Frères International Services S.A.S. (FR)• Chairman of the Board of Gant AB (SWEDEN)• Board member of France Telecom S.A. (FR) (listed)Previous Mandates during the last 5 years• Chairman and CEO of Carrefour S.A. (FR)• Board member of HSBC Holdings (UK)CV• Bachelor of Economics and Management, Universidad Pontifica Comillas de Madrid, Spain
Mrs Mary HarrisMember of the Supervisory Board Member of the Governance, Nomination & Remuneration CommitteeIndependent Member* Attendance: 100% (SB and GN&RC)Born on April 27, 1966U.K. nationalFirst Mandate: April 29, 2008Mandate renewed: April 26, 2012 SB term expires: AGM 2015Holds 600 U-R shares
Other Current Functions and Mandates• Member of the Supervisory Board, Audit committee and Chair of the Remuneration committee of TNT
Express N.V. (NL) (listed)• Non-executive director, Chair of the Remuneration committee and member of the Nomination
and Corporate Responsibility committees of J Sainsbury plc (UK) (listed)Previous Mandates during the last 5 years• Consultant and Partner at McKinsey & Co in London, Amsterdam, China and South East Asia• Member of advisory Board of Irdeto B.V. (NL)CV• Masters Degree in Politics, Philosophy and Economics from Oxford University and a Masters Degree
in Business Administration from Harvard Business School• Formerly held various positions at Pepsi Beverages, Goldman Sachs and at private equity/venture
capital firms
Mr Jean-Louis LaurensMember of the Supervisory Board Member of the Audit CommitteeIndependent member* Attendance: 100% (SB and Audit Committee)Born on August 31, 1954 French nationalFirst Mandate: June 25, 2007Mandate renewed: April 26, 2012 SB term expires: AGM 2015Holds 361 U-R shares
Other current Functions and Mandates• General Partner of Rothschild & Cie Gestion Paris (FR)Previous Mandates during the last 5 years• Chairman and CEO of AXA Investment Managers Paris (FR) and Deputy CEO of the AXA Investment
Managers Group (FR)• Member of the Board of Directors of AXA France Assurance (FR)• CEO of Robeco France (FR) and Global Head of Mainstream Investments of the Robeco Group (NL)CV• Graduate of the École des Hautes Études Commerciales (HEC)• He has a Doctorate in Economics and a Masters Degree in Law

CONSOLIDATED FINANCIAL STATEMENTS
CORPORATE SUSTAINABILITY
BUSINESS REVIEW AND 2012 RESULTS
PORTFOLIO
UNIBAIL-RODAMCO - FINANCIAL REPORT 2012 198 • 199
Mr Yves Lyon-CaenMember of the Supervisory Board Member of the Governance, Nomination & Remuneration CommitteeIndependent member* Attendance: 100% (SB and GN&RC)Born on June 29, 1950 French nationalFirst Mandate: June 25, 2007Mandate renewed: May 15, 2009 SB term expires: AGM 2014Holds 400 U-R shares
Other Current Functions and Mandates• Chairman of the Supervisory Board of Bénéteau S.A. (FR)• Chairman of the Supervisory Board of Sucres & Denrées (FR)Previous Mandates during the last 5 years• NilCV• Law graduate of the Institut d’Études Politiques and former student of the École Nationale
d’Administration (ENA)
Mrs Marella MorettiMember of the Supervisory Board Member of the Audit CommitteeIndependent member* Attendance: 100% (SB and Audit Committee)Born on November 4, 1965 Italian nationalFirst Mandate: April 27, 2011 SB term expires: AGM 2014Holds 120 U-R shares
Other Current Functions and Mandates• CFO of Fiat Finance et Services S.A. (FR)• CEO and Board Member of Fiat Industrial Finance France S.A. (FR)• General Manager and Member of the Internal Committee of CNH Financial Services S.A.S. (FR)• Member of the Board of Fiat Finance and Trade Ltd (LU)Previous Mandates during the last 5 years• NilCV• Graduate of “Amministrazione Aziendale” Business School, University of Turin, Italy
Mr Alec PelmoreMember of the Supervisory Board Member of the Audit CommitteeIndependent member* Attendance: 100% (SB and Audit Committee)Born on October 14, 1953U.K. nationalFirst Mandate: April 29, 2008Mandate renewed: April 26, 2012 SB term expires: AGM 2015Holds 500 U-R shares
Other Current Functions and Mandates• Senior Independent Director on the Board of Metric Property Investments plc (UK) (listed), Chairman
of its Audit Committee and member of its nomination and remuneration committeesPrevious Mandates during the last 5 years• NilCV• Degree in Mathematics from Cambridge University• He held positions as an equity investment analyst specialising in real estate companies mainly at
Dresdner Kleinwort Benson and Merrill Lynch. With partner Robert Fowlds, his team was voted no. 1 for real estate in Europe for 12 out of 13 years from 1995 to 2007
Mr Herbert SchimetschekMember of the Supervisory Board Member of the Audit CommitteeIndependent member* Attendance: 100% (SB and Audit Committee)Born on January 5, 1938 Austrian nationalFirst Mandate: April 27, 2011 SB term expires: AGM 2014Holds 350 U-R shares
Other Current Functions and Mandates• CEO of Hans Dujsik Privatstiftung (AT) (trust foundation)• Supervisory Board member of YAM Invest N.V. (NL)• Deputy Supervisory Board Chairman of Bank Gutmann AG (AT) and Donau-Chemie AG (AT)Previous Mandates during the last 5 years• Deputy CEO of ARION Immobilien & Development Privatstiftung (AT) (trust foundation)• CEO of Austria Versicherungsverein auf Gegenseitigkeit Privatstiftung (AT) (trust foundation), Executive
Board member of Austria Versicherungsverein Beteiligungs-Verwaltungs GmbH (a related entity) and “Graben 27-28” Besitzgesellchaft mbH (a related entity)
• Executive Board member of UNIQA Praterstraße Projekterrichtungs GmbH (AT)• Supervisory Board Chairman of the National Bank of Austria (AT) and DIE ERSTE österreichische
Spar-Casse Privatstiftung (AT) (trust foundation)• Deputy Supervisory Board Chairman of InnoPacking AG (AT)• Supervisory Board member of SCOR SE (FR) (listed)• Within the UNIQA Group (AT): Deputy Supervisory Board Chairman of UNIQA Versicherung A.G. (listed),
Supervisory Board Chairman of UNIQA Assurances SA, UNIQA Previdenza SpA, UNIQA Protezione SpA and UNIQA Assicurazioni SpA
• Chairman and Board Member of AUSTRIA Hotels Liegenschaftsbesitz AG (AT)
Mr Robert van OordtChairman of the Supervisory Board and Chairman of the Governance, Nomination & Remuneration Committee until April 26, 2012Independent member*Attendance: 100% until the end of his mandate on April 26, 2012 (SB and GN&RC)Born on March 26, 1936 Dutch nationalFirst Mandate: June 25, 2007Mandate renewed: May 15, 2009SB term expired: April 26, 2012
Other current Functions and Mandates• NilPrevious Mandates during the last 5 years• Chairman of the Supervisory Board and Chairman of the Nominating & Governance Committee
of Rodamco Europe N.V. (NL) (2001 until June 2007)• Member of the Board of Directors and Chairman of the Audit Committee of Nokia Corporation (FL)• Member of the Board of Directors and Chairman of the Audit Committee of S.A. Umicore N.V. (Be)• Member of the Board of Directors and Chairman of the Audit Committee of Fortis Bank S.A./N.V. (Be)• Member of the Board of Directors, Chairman of the Business Practices Oversight Committee and
member of the Nominating & Governance, Audit and Executive committees of Schering-Plough Corporation (USA), Lead Director during 2008
• Member of the Supervisory Board, Chairman of the Audit & Governance Committee and Member of the Nominating & Remuneration Committee of Draka Holding N.V. (NL)
CV• Masters Degree in Business and Economics from the University of Amsterdam
Mrs Rachel PicardMember of the Supervisory Board from April 26, 2012 to July 23, 2012Independent member*Attendance: 100% from April 26, 2012 to July 23, 2012 (SB)Born on December 11, 1966French nationalFirst Mandate: April 26, 2012SB term expires: AGM 2015End of mandate: July 23, 2012
Other current Functions and Mandates• Director of Stations and Connections at SNCF since 2012Previous mandates during the last 5 years• Chairman of Thomas Cook France (2011-2012)• Deputy CEO of Thomas Cook Tour Operating & Marketing (2010-2012)• CEO of Voyages-Sncf.com (2007-2010)CV• Graduate of the École des Hautes Études Commerciales (HEC)
* For full details concerning Supervisory Board independence, refer to the Supervisory Board Charter and the Report of the Chairman of the Supervisory Board on pages 225 to 236.

REPORT OF THE CHAIRMAN OF THE SUPERVISORY BOARD
LEGAL INFORMATION
FINANCIAL REPORT 2012 - UNIBAIL-RODAMCO 198 • 199
4.3. Corporate Governance
Unibail-Rodamco SE has a two-tier governance structure
with a Management Board and a Supervisory Board. There is
a clear distinction between their respective operational roles,
responsibilities and related tasks.
For full details, refer to the Report of the Chairman of the
Supervisory Board.
4.3.1. Supervisory Board and its Committees
As at December 31, 2012, the Supervisory Board has ten
members elected for a term of three years. The Supervisory
Board Chairman is Mr Rob ter Haar since April 26, 2012 and
the Vice-Chairman is Mr François Jaclot. The composition of
the Supervisory Board reflects a strong commitment to the
independence, diversity and expertise of its members.
The Supervisory Board’s role, responsibilities and related
tasks are clearly stated in part IV of the Company’s Articles of
Association and in a separate Supervisory Board Charter(11).
The Supervisory Board has two sub-committees
focusing on specifi c aspects of its overall responsibility:
the Audit Committee and the Governance, Nomination and
Remuneration Committee (GN&RC). Each committee has
a specific Charter(12), which describes the Committee’s
role, responsibilities, organisation, and functioning. The
Committees make recommendations and advise the
Supervisory Board within their scope of responsibility. The
Supervisory Board is, however, ultimately responsible for
all the decisions and actions taken on the Committees’
recommendations.
Audit Committee
The Audit committee is chaired by Mr François Jaclot and is
composed of six members who are independent, in accordance
with the criteria detailed in the Supervisory Board Charter and
have significant financial and accounting expertise.
The Audit Committee specifically focuses on the Company’s
financial performance-related accounts, financing, auditing
and associated risks. It examines and supervises the
Company’s publication of financial information. It also ensures
the relevance and efficiency of the Group’s accounting and
financial standards, tax and funding policies and internal
audit, risk-management and control procedures.
The Audit Committee deals with a number of recurring
issues, such as interim and annual fi nancial statements,
internal control and risk management relating to liabilities
and net asset value. In addition, the Committee may carry out
specific examinations on its own initiative or at the request
of the Supervisory Board. In addition to the regular contact
that the committee has with the Management Board and its
Statutory Auditors, it is free to interview experts in particular
fields (e.g. accounting, finance and audit managers)
without members of the Management Board being present.
The Committee has access to valuations carried out by
independent appraisers.
Governance, Nomination and Remuneration Committee
The GN&RC is chaired by Mr Rob ter Haar and is composed
of four independent members (as determined in accordance
with the Supervisory Charter).
The GN&RC examines and advises the Supervisory Board
on: (a) the profi le and selection criteria for the members of
the Management Board and the Supervisory Board; (b) the
Company’s human resources policies and related remuneration
policies; (c) the annual remuneration arrangements (fi xed
income, short-term incentive, long-term incentive and
other benefi ts) of the CEO and the other members of the
Management Board; (d) the scope, composition and functioning
of the Management Board and the Supervisory Board; (e) the
independence of the Supervisory Board members; (f) the (re)
appointment of members of the Management Board and/or
the Supervisory Board; (g) the Group’s corporate governance
practices and rules.
(11) Available on the Company’s website and the Company’s registered office.(12) Ibid. no.11.

CONSOLIDATED FINANCIAL STATEMENTS
CORPORATE SUSTAINABILITY
BUSINESS REVIEW AND 2012 RESULTS
PORTFOLIO
200 • 201
4.3.2. Management Board
The Management Board is the Company’s collective
decision-making body, overseen by the Supervisory Board,
and is chaired by Mr Guillaume Poitrinal, the Company’s
CEO. As at December 31, 2012, it consists of four members,
appointed by the Supervisory Board for a four-year term.
At the end of the General Assembly to be held on April
25, 2013, the mandate of the Chairman of the Management
Board, Mr Guillaume Poitrinal, will end. In accordance with
the succession plan prepared by Guillaume Poitrinal, on
March 4, 2013, on the recommendation of the GN&RC, the
Supervisory Board appointed Mr Christophe Cuvillier, a
current Management Board member and Chief Operating
Offi cer since June 2011, as Chairman of the Management
Board to be effective from April 25, 2013.
Upon the proposal of Christophe Cuvillier, the Supervisory
Board in the same meeting decided to:
• renew the mandates of Management Board members of
Mrs Catherine Pourre, Chief Resources Offi cer, and Mr
Jaap Tonckens, Chief Financial Offi cer, in their current
positions;
• appoint as Management Board members, Mr Jean-Marie
Tritant as Chief Operating Offi cer, Mr Olivier Bossard as
Chief Development Offi cer, and Mr Fabrice Mouchel as
Deputy Chief Financial Offi cer.
Mr Jean-Marie Tritant joined the Group in 1997 and held
various management positions including Head of Asset
Management, General Manager of the Offi ces Division,
Managing Director Retail France (2007) before becoming
Managing Director Retail and Offi ces France (2012). Mr Jean-
Marie Tritant is a graduate of ESC Dijon.
Mr Olivier Bossard joined the Group in 1998 as Portfolio
Manager, then Head of Asset Management (2003) and
Executive Vice President in charge of development and
strategy at Unibail (2006) before becoming Managing Director
of Offi ces France in 2007. Mr Olivier Bossard became Group
Director of Development in 2010. He is an architect and a
graduate of Ecole des Beaux-Arts and Sciences Po Paris.
Mr Fabrice Mouchel joined the Group in 2001 as Head of
Corporate Development, before becoming Head of Financial
Resources and Investor Relations (2002) and then Deputy
Chief Financial Offi cer (2007). Mr Fabrice Mouchel is a
graduate of HEC and holds a Master’s Degree in Law.
These appointments and renewals will be effective as of
April 25, 2013 for a four-year period following the Group’s
combined Ordinary and Extraordinary General Meeting taking
place on the same date, and subject to the Dutch Financial
Market Authority’s (AFM) approval.
As of April 25, 2013, Unibail-Rodamco’s Management
Board will be composed of 6 members. Chaired by Christophe
Cuvillier, it will include 5 other members (in alphabetical
order):
• Mr Olivier Bossard, Chief Development Offi cer;
• Mr Fabrice Mouchel, Deputy Chief Financial Offi cer;
• Mrs Catherine Pourre, Chief Resources Offi cer;
• Mr Jaap Tonckens, Chief Financial Offi cer;
• Mr Jean-Marie Tritant, Chief Operating Offi cer.
Management Board members are collectively in charge
of and responsible for the day-to-day management of the
Company. The Management Board’s duties include formulating
and carrying out the Company’s strategy, effectively structuring
and staffing the organisation and achieving and properly
reporting on the forecasted financial results.
The Management Board operates under its own Charter,
and has assigned responsibilities for particular operational
aspects of management to its individual members, based on
clearly determined authority limits. The Management Board
actively supervises the Company’s internal audit program.
Pursuant to the Afep-Medef Code, the Supervisory
Board conducts a yearly assessment of the functioning of
the Management Board (carried out during November and
December 2012 for 2012). For full details, refer to the Report
of the Chairman of the Supervisory Board.
4.3.3. Compliance with the Afep-Medef Corporate
Governance Code
Under article L. 225-68 of the French Commercial Code,
Unibail-Rodamco SE adheres to and enforces the Afep-Medef
Code as published in consolidated form by Afep-Medef and
adopts this code as its reference for corporate governance
matters.
As at the date of filing and since 2008, the Group complies
with all of the Code’s recommendations and applies all of
the Afep-Medef recommendations including those regarding
the remuneration of executive directors established for listed
French companies, of which the content was confi rmed
and completed by a recommendation of the AMF (Autorité
des marchés fi nanciers) with the sole exception relating to
the recommendation to review the CEO’s Fixed Income at
relatively long intervals. Since 2011, the CEO’s Fixed Income
is reviewed by the Supervisory Board, on the recommendation
of its Governance, Nomination and Remuneration Committee,
on an annual basis pursuant to the overall increase in fixed
salaries on a like-for-like basis across the Group as of
January 1 each year (for more information, please refer to
page 204). Following the recommendation of the GN&RC
and on the basis of the updated benchmark study carried out
by Towers Watson on executive remuneration practices of a

REPORT OF THE CHAIRMAN OF THE SUPERVISORY BOARD
LEGAL INFORMATION
200 • 201
panel of CAC 40, AEX 25 and major listed European real estate
companies (“Updated Benchmark”), on March 7, 2011 the
Supervisory Board, taking into account that the remuneration
of the Chairman of the Management Board at the time was
signifi cantly below the average amount of remuneration paid
to CEOs as indicated in the Updated Benchmark, decided to
review the remuneration of the Chairman of the Management
Board on an annual basis pursuant to the overall increase
in fi xed salaries on a like-for-like basis across the Group as
of January 1 each year. This is considered better governance
practice over the long term and compliant with the spirit of
the Afep-Medef Code although not in line with part of the
wording of Article 20.2.1 of the Afep-Medef recommendations.
However, taking into account the departure of Mr Guillaume
Poitrinal from the Group at the end of his mandate as
Chairman of the Management Board following the General
Assembly on April 25, 2013, his fi xed income for 2013 was not
be reviewed and will be maintained at the same amount as in
2012 and will be applied prorata temporis in 2013.
Compliance with the Afep-Medef Code is monitored by the
GN&RC and the Supervisory Board in close collaboration with
the Management Board. For more detail, refer to the Report
of the Chairman of the Supervisory Board (page 225).
4.3.4. Group Compliance Book and Code of Ethics
To ensure the highest standards of governance, in 2008
the Group established a comprehensive Compliance Book;
including (amongst other things) a Code of Ethics and insider
trading rules. The Compliance Book applies to all the Group
employees and executive officers throughout the regions in
which the Group operates.
The Code of Ethics(13) outlines the fundamental principles
and values governing the Company and provides employees
with rules and guidelines as to the behaviour they should
adopt in their working environment, in particular:
• respect for human dignity, employees’ work and
non-discrimination;
• respect for law and regulations;
• loyalty, integrity, and avoidance of conflict of interests;
• ethical ways of doing business and anti-corruption
measures;
• confidential information;
• operations on Unibail-Rodamco SE securities, including
insider trading rules;
• use of Unibail-Rodamco SE’s assets and services;
• respect for delegations of authority.
In addition, concerning the selection process of service
providers, the Group chooses to contract with those who agree
to provide their services in accordance with the principals and
values set out in the Group’s Code of Ethics.
The Group Compliance Offi cer formally reports to the
Management Board and to the Supervisory Board, through its
GN&RC, at least once a year on compliance (in the form of a
formal Compliance Report) including any incidents in respect
of the Code of Ethics. In this regard, the Group applies strict
standards and penalties, as applicable by law, according to
the seriousness of the breach.
The insider trading rules contain procedures that must
be followed regarding transactions in Company shares
(or related financial instruments) or the shares or related
financial instruments of its listed subsidiaries. There are
also rules prohibiting trading in shares during closed periods
(such as the 30-day period prior to the publication of the half-
year and annual accounts).
Group employees must disclose details of their official
positions (e.g. directorships) and must abstain from holding
a position, performing duties or holding a financial interest in
any of the Group’s competitors, clients, suppliers or business
partners. Employees must alert the Company to any conflict
of interest (including potential conflicts of interest), due to a
direct or indirect personal interest.
As a signatory to the UN Global Compact, Unibail-
Rodamco SE undertakes to promote the application of the
fundamental values with respect to human rights, labour
rights, the environment and anti-corruption.
4.4. Remuneration of Management Board and Supervisory
Board members
4.4.1. Remuneration policy for members of the
Management Board
The Governance, Nomination and Remuneration
Committee (GN&RC) held six meetings in 2012. This committee
is specifically instructed by the Supervisory Board to examine
and report to the Supervisory Board on Management
Board member remuneration matters. The GN&RC is also
responsible for preparing the annual Management Board
member remuneration proposals comprising of: Fixed Income
(FI); a short term incentive (STI) based on performance in the
previous year; a long term incentive (LTI) in the form of Stock-
Options and since 2012, in the form of performance shares
(the exercice of which is 100% performance based); and other
benefits such as a company pension plan, company car,
insurance, etc. The Stock-Options and Performance Shares
granted in 2012 to the members of the Management Board
represent 23.65% of the total number of stocks options and
performance shares granted in 2012. These proposals are
(13) Available on the Company’s website and at the Company’s registered office.

CONSOLIDATED FINANCIAL STATEMENTS
CORPORATE SUSTAINABILITY
BUSINESS REVIEW AND 2012 RESULTS
PORTFOLIO
202 • 203
reviewed in a totally independent manner by the Supervisory
Board, which deliberates and votes on each component.
In 2007, the Supervisory Board, on the recommendation
of the GN&RC, established the Management Board
remuneration policy with the assistance of Towers Watson
(Towers Perrin at the time) as independent external advisors.
This policy encompasses all components of the remuneration
of Management Board members and establishes a balance
between these components based on a comparative study of the
practices of the CAC 40, AEX25 companies, major European real
estate companies and best corporate governance practices.
Performance criteria are clearly established and reinforced
to determine the variable remuneration component (STI) and
the right to exercise granted Stock-Options and performance
shares (LTI).The policy also sets maximum thresholds for
STI and LTI components vis-a-vis the Management Board
members’ fixed income, to ensure the reasonableness of
the total compensation package in accordance with the
recommendations of the Afep-Medef Code.
At the end of 2009, and the GN&RC engaged Towers
Watson, to conduct a formal benchmark study of the executive
remuneration practices of a panel of CAC 40, AEX 25 and
major listed European real estate companies (“Benchmark”).
The Benchmark revealed that the maximum annual cash
compensation and LTI amounts of Unibail-Rodamco’s CEO
and other Management Board members were below average
against all panels. In addition, Unibail-Rodamco’s CEO
and other Management Board members’ pensions were
considerably below average compared to their CAC 40 peers.
As a result, on March 9, 2010, noting that the CEO and
other Management Board members’ fixed income had not
been adjusted in 2.5 years, the Supervisory Board, on the
recommendation of the GN&RC, adjusted the fixed income
component for the CEO and existing Management Board
members, effective January 1, 2010.
On March 7, 2011, in light of the results of the updated
Benchmark carried out by Towers Watson confi rming
the practice in France for executive pensions in 2010, the
Supervisory Board, on the recommendation of the GN&RC,
introduced an additional annual cash contribution with
pension purpose for the CEO and existing Management Board
members on the condition that the individual amounts be
invested (after tax and social charges) in a pension scheme
for the period that the individual is a corporate officer with
the Group.
During the same meeting, taking into consideration the
substantially below average level of fixed income of the CEO
compared to all panels, the Supervisory Board decided, from
this point onwards, to revise the CEO’s gross fixed income
annually on the basis of the increase in fixed salaries on a
like-for-like basis across the Group as of January 1 each year.
This is considered better governance practice over the long
term and compliant with the spirit of the Afep-Medef Code
although not in line with part of the wording of one of its
articles.
In order to diversify the long term incentives, the
Supervisory Board (on the recommendation of the GN&RC)
decided on March 5, 2012 to introduce a new long term
incentive plan in the form of Performance Shares.
On March 4 2013, in light of an updated Benchmark
performed by Towers Watson in 2012 and having considered
the Company’s 2012 full year results and the individual
performance of each Management Board member in 2012,
the GN&RC made its recommendation to the Supervisory
Board on the remuneration of the CEO and other Management
Board members.
The full details of the remuneration arrangements for the
CEO and each of the other Management Board members are
detailed in the following pages.

REPORT OF THE CHAIRMAN OF THE SUPERVISORY BOARD
LEGAL INFORMATION
202 • 203
a) Details of Management Board member remuneration (before income tax and social security charges)
Remuneration, Stock-Options and Performance Shares (before income tax and social security charges) allocated to Management Board members in respect of the referred years (Table no. 1 – AMF/Afep-Medef recommendations)
G. Poitrinal(1)
Chief Executive Offi cer(since June 26, 2007)
C. Cuvillier(2)
Chief Operating Offi cer(since June 1, 2011)
M. Dessolain(3)
Chief Strategy Offi cer(from June 26, 2007 to October 15,2012)
Year 2008 Year 2009 Year 2010 Year 2011 Year 2012Year 2008
Year 2009
Year 2010 Year 2011 Year 2012 Year 2008 Year 2009 Year 2010 Year 2011 Year 2012
Fixed income €700,000 €700,000 €800,000 €821,600 €850,438 n.m. n.m. n.m. €396,894 €620,000 €400,000 €400,000 €440,000 €440,000 €345,942
Short term incentive* €344,595 €320,068 €1,021,514 €642,331 €893,980 n.m. n.m. n.m. €306,499 €516,053 €210,000 €170,621 €317,141 €223,636 €229,438
Pension Contributions €77,384 €73,415 €73,456 €203,849 €203,542 n.m. n.m. n.m. €32,083 €55,000 €50,679 €47,842 €47,532 €119,691 €118,434
Other benefi ts €16,578 €16,729 €21,771 €29,040 €29,563 n.m. n.m. n.m. €18,323 €21,011 €12,929 €15,025 €19,070 €25,589 €24,537
Board fees n.m. n.m. n.m.
Remuneration due in respect of the Financial year €1,138,557 €1,110,212 €1,916,741 €1,696,820 €1,977,523 n.m. n.m. n.m. €753,800 €1,212,064 €673,608 €633,488 €823,743 €808,915 €718,351
Evolution year N vs year N-1 in % -2.5% 72.6% -11.5% 16.5% n.m. n.m. n.m. n.m. 60.8% -6.0% 30.0% -1.8% -11.2%
Options IFRS valuation allocated during the fi nancial year (detailed in table n°4)** €415,000 €221,000 €318,500 €385,550 €293,675 n.m. n.m. n.m. €197,600 €205,573 €207,600 €110,500 €159,250 €182,260 €140,964
Evolution year N vs year N-1 in % -46.7% 44.1% 21.1% -23.8% n.m. n.m. n.m. n.m. 4.0% -46.8% 44.1% 14.4% -22.7%
Performance shares IFRS valuation attributed during the fi nancial year (detailed in table n°6)** n.m n.m n.m n.m €142,335 n.m. n.m. n.m. n.m. €99,660 n.m. n.m. n.m. n.m. €68,341
Total €1,553,557 €1,331,212 €2,235,241 €2,082,370 €2,413,533 n.m. n.m. n.m. €951,400 €1,517,297 €881,208 €743,988 €982,993 €991,175 €927,656
Evolution year N vs year N-1 in % -14.3% 67.9% -6.8% 15.9% n.m. n.m. n.m. n.m. 59.5% -15.6% 32.1% 0.8% -6.4%
* Short Term incentive indicated in column “Year N” is Short Term incentive due in respect of Year N and paid in March Year N+1.** The value corresponds to the value of the options, performance shares and fi nancial instruments at the time they were attributed according to IFRS 2 requirements (based on the evaluation conducted by Towers Watson), notably after taking into account any discount related to performance criteria and the probability of presence in the company after the vesting period, but before taking into account the effect of the spread of the charge during the vesting period according to IFRS 2.(1) Mr Guillaume Poitrinal’s mandate as Chairman of the Management Board will expire on April 25, 2013.(2) Mr Christophe Cuvillier was appointed Chairman of the Management Board by the Supervisory Board held on March 4, 2013, upon the recommendation of the GN&RC, with effect as of April 25, 2013.(3) Mr Michel Dessolain resigned from the Management Board with effect as of October 15, 2012.
C. Pourre(4)
Chief Resources Offi cer(since June 26, 2007)
P. van Rossum(5)
Chief Financial Offi cer(from June 26, 2007 to June 30, 2012)
J. Tonckens(4)
Chief Financial Offi cer(since September 1, 2009)
Year 2008 Year 2009 Year 2010 Year 2011 Year 2012 Year 2008 Year 2009 Year 2010 Year 2011 Year 2012(6) Year 2008 Year 2009 Year 2010 Year 2011 Year 2012
Fixed income €400,000 €400,000 €440,000 €440,000 €440,000 €400,000 €400,000 €440,000 €440,000 €220,000 n.m. €172,937 €440,000 €440,000 €440,000
Short term incentive* €190,000 €180,621 €317,141 €223,636 €291,820 €190,000 €185,621 €317,141 €223,636 €100,000 n.m. €101,874 €327,141 €273,636 €381,820
Pension €51,366 €48,031 €47,541 €112,263 €111,284 €68,131 €66,863 €70,580 €135,647 €149,589 n.m. €14,688 €43,809 €108,782 €108,206
Other benefi ts €12,845 €13,060 €17,065 €23,583 €24,106 €15,001 €15,060 €17,505 €22,950 €12,950 n.m. €630 €7,633 €18,129 €18,652
Remuneration due in respect of the Financial year €654,211 €641,712 €821,747 €799,482 €867,210 €673,132 €667,544 €845,226 €822,233 €482,538 n.m. €290,129 €818,583 €840,546 €948,678
Evolution year N vs year N-1 in % -1.9% 28.1% -2.7% 8.5% -0.8% 26.6% -2.7% -41.3% n.m. n.m. n.m. 2.7% 12.9%
Options IFRS valuation allocated during the fi nancial year (detailed in table n°4)** €207,600 €110,500 €159,250 €182,260 €140,964 €207,600 €110,500 €159,250 €182,260 €0 n.m. €0 €254,800 €182,260 €176,205
Evolution year N vs year N-1 in % -46.8% 44.1% 14.4% -22.7% -46.8% 44.1% 14.4% n.m. n.m. n.m. -28.5% -3.3%
Performance shares IFRS valuation attributed during the fi nancial year (detailed in table n°6)** n.m n.m n.m n.m €68,341 n.m n.m n.m n.m €0 n.m n.m n.m n.m €85,401
Total €861,811 €752,212 €980,997 €981,742 €1,076,515 €880,732 €778,044 €1,004,476 €1,004,493 €482,538 n.m. €290,129 €1,073,383 €1,022,806 €1,210,284
Evolution year N vs year N-1 in % -12.7% 30.4% 0.1% 9.7% -11.7% 29.1% 0.0% -51.9% n.m. n.m. n.m. -4.7% 18.3%
* Short Term incentive indicated in column “Year N” is Short Term incentive due in respect of Year N and paid in March Year N+1.** The value corresponds to the value of the options, performance shares and fi nancial instruments at the time they were attributed according to IFRS 2 requirements (based on the evaluation conducted by Towers Watson), notably after taking into account any discount related to performance criteria and the probability of presence in the company after the vesting period, but before taking into account the effect of the spread of the charge during the vesting period according to IFRS 2.(4) The current mandates of Mrs Catherine Pourre and Mr Jaap Tonckens were renewed by the Supervisory Board on March 4, 2013, upon the recommendation of the GN&RC, with effect of April 25, 2013 each for a four-year period. (5) Mr Peter van Rossum resigned from the Management Board with effect as of June 30, 2012.(6) All Stock-Options and Performance Shares allocated to Peter van Rossum in 2012 were cancelled as of the date of his resignation on June 30, 2012.

CONSOLIDATED FINANCIAL STATEMENTS
CORPORATE SUSTAINABILITY
BUSINESS REVIEW AND 2012 RESULTS
PORTFOLIO
204 • 205
Remuneration of the Chairman of the Management Board
and Chief Executive Offi cer
As indicated in the Company’s 2011 Annual Report, on
March 5, 2012, the Supervisory Board, on the recommendation
of the GN&RC, revised the gross fixed annual income of the
Chairman of the Management Board to €850,438, effective
January 1, 2012. This amount is before income tax and social
security payments. It represents an increase of 3.51% in
comparison with his 2011 fixed remuneration; identical to the
increase in fixed salaries on a like-for-like basis across the
Group as of January 1, 2012.
On March 4, 2013, the Supervisory Board, based on the
proposal of the Chairman of the Management Board and on
the recommendation of the GN&RC, maintained the same
fi xed income for the Chairman of the Management Board
in 2013 as in 2012, which will be applied prorata temporis in
2013 up to the end of his current mandate on April 25, 2013.
Accordingly, the gross fixed annual income of the Chairman
of the Management Board remains fi xed at €850,438. This
amount is before income tax and social security payments.
According to the Management Board remuneration policy
in place since its approval by the Supervisory Board on June 26,
2007, the short-term incentive (STI) of the Chairman of the
Management Board due in respect of the 2012 financial year
is determined according to the achievement of quantitative
targets and is calculated according to a formula (that has not
been amended since 2007) that takes into consideration the
following key performance indicators:
• the recurring net profi t and recurring EPS growth above
inflation; and
• the value creation during the period, measured by the
growth (above inflation) of the net asset value per share
plus dividends distributed over the same period.
The STI for the Chairman of the Management Board is
capped at 150% of his annual fixed income.
The application of the formula in respect of the financial
year 2012 resulted in an STI for the Chairman of the
Management Board of € 893,980. This represents an increase
of 39.2%, essentially reflecting the strong results of the Group
in 2012 compared to the previous year as well as on the
recurring earnings per share and NAV. This STI remains lower
than the one for 2010, wich was a very strong year following
the 2009 crisis. In respect of the 2013 fi nancial year, the CEO
and Chairman of the Management Board is entitled to a
quantitative STI based on the same policy and formula. As the
mandate of the CEO will end on April 25, 2013, the Supervisory
Board, based on the recommendation granted of the GN&RC,
decided to grant to the CEO the same STI as in respect of year
2012 prorata temporis and rounded at €300,000.
The Chairman of the Management Board benefits from a
pension scheme with a contribution of €203,542 in 2012. He
does not benefit from any defined benefit pension scheme
(retraite chapeau Art. 39).
Overall, including LTI, the total compensation of the CEO
in 2012 increased by 15.9% compared with 2011, which is
essentially due to the increase in STI refl ecting the strong
result of the Group in 2012. It is noted that in 2011, the
Chairman of the Management Board’s remuneration was
reduced by 6.8%.
The Chairman of the Management Board benefi ts from
a company car, a health and life mutual insurance and
unemployment contribution (GSC type) and is eligible for
the Company Savings Plan without the benefit of the top-up
offered to employee participants. He does not benefit from:
the profit-sharing scheme (intéressement et participation)
available to employees. The Chairman of the Management
Board shall not receive an indemnity of any nature upon his
departure from the Group on April 25, 2013 and he will retain
neither a personal assistant, nor a chauffeur, nor an offi ce.
In accordance with Afep-Medef recommendations, the
Chairman of the Management Board has no employment
contract (contrat de travail).
On March 4, 2013, the Supervisory Board, on the
recommendation of the GN&RC, having appointed
Mr Christophe Cuvillier as the Chairman of the Management
Board to be effective from April 25, 2013 and after having
noted the updated Benchmark study of the executive
remuneration practices of CAC40 companies and a panel
of CAC40 companies with similar market capitalization in
February 2013, also determined his annual fi xed income with
respect to his new role at €820,000, which will be applied
prorata temporis in 2013. This amount is before income tax
and social security charges. This amount is positionned in the
lowest quantile of CAC40 companies as well as of the panel of
CAC40 companies with similar market capitalisation.
The remuneration policy for 2013 with respect to the
Chairman of the Management Board remains unchanged
with respect to the remuneration policy approved by the
Supervisory Board on June 26, 2007, in particular regarding
the short term incentive which will be determined according
to the same methods and conditions indicated above.

REPORT OF THE CHAIRMAN OF THE SUPERVISORY BOARD
LEGAL INFORMATION
204 • 205
Pursuant to the AMF recommendations of December 22,
2008 and the Afep-Medef recommendations of November 2008
concerning the compensation of executive officers of listed
companies, the tables on pages 203 and 206 present:
• gross remuneration received in respect of the financial
years 2008 through to 2012, i.e. including short term
incentive due in respect of financial year X and paid in Year
X+1 after the publication of the results of financial year X
(table no. 1); and
• gross remuneration paid during 2011 and 2012 respectively,
i.e. including the short term incentive that was paid in Year X
accrued in respect of the previous year (table no. 2).
Remuneration of the other members
of the Management Board
As indicated in the Company’s 2011 Annual Report, on March
5, 2012, the Supervisory Board, upon the recommendation of
the GN&RC, decided to maintain the same annual gross fixed
income of the non-CEO Management Board members for the
2012 financial year as for the 2011 financial year. Therefore,
the annual gross fi xed income of the other members of the
Management Board was maintained at €440,000 for the 2012
financial year, (no change since the 2010 financial year) and
the annual gross fi xed income of Mr Christophe Cuvillier,
appointed to the Management Board with effect June 1, 2011,
was maintained at €620,000 for the 2012 financial year which
was applied prorata temporis in 2011.
On March 4, 2013, the Supervisory Board, upon the
recommendation of the GN&RC, decided to increase the
annual gross fixed income of Mr Jaap Tonckens, Chief Financial
Offi cer, to €550,000, effective January 1, 2013 i.e. an increase
of 25% as his scope of responsibility has included Finance and
Investment since the resignation from the Management Board
of Mr Peter van Rossum on June 30, 2012; and the annual gross
fi xed income of Mrs Catherine Pourre, Chief Resources Offi cer,
to €465,000, effective January 1, 2013, i.e. an increase of 5.7%
as her scope of responsibilities has included Legal Affairs in
addition to her previous responsibilities since June 30, 2012.
According to the Management Board remuneration policy
approved by the Supervisory Board on June 26, 2007, the short-
term incentive (STI) of the other members of the Management
Board due in respect of 2012 financial year is determined
according to the achievement of two sets of objectives:
(i) Quantitative targets capped at 50% of fixed income
(capped at 60% of fi xed income in the case of Mr Cuvillier)
and calculated according to a formula that takes into
consideration two key performance indicators:
• the recurring net profi t and recurring EPS growth above
inflation;
• the creation of value during the period, measured by the
growth above inflation of the net asset value per share, plus
dividends distributed over the same period; and
(ii) Qualitative targets capped at 50% of fixed income (capped
at 60% of fixed income in the case of Mr Cuvillier), which
are defined by the GN&RC (based on proposals received
from the CEO), discussed with each Management Board
member, approved by the GN&RC/Supervisory Board,
and accepted by each Management Board member at the
beginning of each calendar year.
In application of this policy, on March 4, 2013, the Supervisory
Board fixed the STI of the other Management Board members in
respect of the 2012 financial year at the levels indicated in table
no. 1 (pages 203) on the basis of proposals received from the
GN&RC and the Chairman of the Management Board. The STI
fi gures represent a variation (from –55.3% to +68.3%) explained
by the non like-for-like effect of the changes in the composition
of the Management Board following the resignation from the
Management Board of Mr Peter van Rossum on June 30,
2012 and Mr Michel Dessolain on October 15, 2012, and the
appointment of Mr Christophe Cuvillier in June 2011.
All Management Board members have the benefit of a
company car, the Company’s health and life mutual insurance
as well as an unemployment contribution (GSC type for French
members) and the Company’s supplementary pension plan.
All non-CEO Management Board members can subscribe to
the Company Savings Plan without the benefit of the top-up
contribution offered to the employee participants. All non-CEO
Management Board members have the benefi t of defi ned
contribution pension scheme as from January 1, 2011. The
Management Board members do not benefit from: (i) the
profi t-sharing scheme (intéressement et participation) available
to employees; (ii) any contractual severance package; nor (iii)
any contractual indemnity clause in relation to non-competition
provisions.
None of the Management Board members have employment
contracts. Newly appointed members to the Management
Board will renounce to their employment contract from the
effective date of their appointment.
Overall, including long term incentives, the total
compensation of the other Management Board members in
2012 evolved by -51.9% to +59.5% compared to 2011, following
the resignation from the Management Board of Mr Peter van
Rossum on June 30, 2012 and Mr Michel Dessolain on October
15, 2012 and the appointment of Mr Christophe Cuvillier in
June 2011.
On March 4, 2013, the Supervisory Board, upon the
recommendation of the GN&RC, has appointed as from April 25,
2013, subject to the prior approval of the Dutch authority of
Financial market (Autoriteit Financiële Markten), Mr Jean-
Marie Tritant as a Member of the Management Board to replace
Mr Christophe Cuvillier as Chief Operating Offi cer, Mr Olivier
Bossard as a Member of the Management Board and Chief
Development Offi cer and Mr Fabrice Mouchel as a Member of

CONSOLIDATED FINANCIAL STATEMENTS
CORPORATE SUSTAINABILITY
BUSINESS REVIEW AND 2012 RESULTS
PORTFOLIO
206 • 207
the Management Board as Deputy Chief Financial Offi cer. The
Supervisory Board, upon the recommendation of the GN&RC,
decided to fi x the annual Gross Fixed Income of the newly
appointed Management Board members, effective from their
appointment date on April 25, 2013 at €450,000 for Mr Jean-
Marie Tritant, €400,000 for Mr Olivier Bossard and €320,000 for
Mr Fabrice Mouchel as Deputy Chief Financial Offi cer.
These amounts will be applied prorata temporis in 2013
and are before income tax and social security charges.
The remuneration policy for 2013 regarding the non-CEO
members of the Management Board, including Mr Jean-
Marie Tritant, Mr Olivier Bossard and Mr Fabrice Mouchel
from April 25, 2013, remains unchanged with regards to the
remuneration policy approved by the Supervisory Board on
June 26, 2007, in particular regarding the short term incentive
which will be determined according to the same methods and
conditions indicated above for non-CEO Management Board
members.
Pursuant to the AMF recommendations of December 22,
2008 and the Afep-Medef recommendations of November
2008 concerning the compensation of executive officers of
listed companies, the tables on pages 203 and 206 present:
• gross remuneration received in respect of the financial
years 2008 through to 2012, i.e. including short term
incentive due in respect of financial year X and paid in Year
X+1 after the publication of the results of financial year X
(table no. 1); and
• gross remuneration paid during 2011 and 2012 respectively,
i.e. including the short term incentive that was paid in Year X
accrued in respect of the previous year (table no. 2).
Details of the remuneration (before income tax and social security charges) of each Management Board member (Table n° 2 of AMF/Afep-Medef recommendations)
Mr Guillaume Poitrinal(1) Chairman of the Management Board and Chief Executive Offi cer
Financial year 2011 Financial year 2012
Amount earned Amount paid Amount earned Amount paid
Fixed income €821,600 €821,600 €850,438 €850,438
Short term incentive (STI) €642,331 €1,021,514 €893,980 €642,331
Pension €203,849 €203,849 €203,542 €203,542
Other benefi ts €29,040 €29,040 €29,563 €29,563
Total direct cash remuneration €1,696,820 €2,076,003 €1,977,523 €1,725,874
Long time incentive (LTI) – Stock-Options allocated IFRS valuation* €385,550 €385,550 €293,675 €293,675
Long time incentive (LTI) – performance shares allocated IFRS valuation* n.m n.m €142,335 €142,335
Total direct cash remuneration + LTI €2,082,370 €2,461,553 €2,413,533 €2,161,884
* The value corresponds to the value of the Stock-Options, Performance Shares and fi nancial instruments at the time they were attributed according to IFRS 2 requirements (based on the evaluation conducted by Towers Watson), notably after taking into account any discount related to performance criteria and the probability of presence in the company after the vesting period, but before taking into account the effect of the spread of the charge during the vesting period according to IFRS 2.(1) Mr Guillaume Poitrinal’s mandate as Chairman of the Management Board will expire on April 25, 2013.
Mr Christophe Cuvillier(1) Chief Operating Offi cer(since June 1, 2011)
Financial year 2011 Financial year 2012
Amount earned Amount paid Amount earned Amount paid
Fixed income €396,894 €396,894 €620,000 €620,000
Short term incentive (STI) €306,499 €0 €516,053 €306,499
Pension €32,083 €32,083 €55,000 €55,000
Other benefi ts €18,323 €18,323 €21,011 €21,011
Total direct cash remuneration €753,800 €447,301 €1,212,064 €1,002,510
Long time incentive (LTI) – Stock-Options allocated IFRS valuation* €197,600 €197,600 €205,573 €205,573
Long time incentive (LTI) - performance shares allocated IFRS valuation* n.m n.m €99,660 €99,660
Total direct cash remuneration + LTI €951,400 €644,901 €1,517,297 €1,307,743
* The value corresponds to the value of the Stock-Options, Performance Shares and fi nancial instruments at the time they were attributed according to IFRS 2 requirements (based on the evaluation conducted by Towers Watson), notably after taking into account any discount related to performance criteria and the probability of presence in the company after the vesting period, but before taking into account the effect of the spread of the charge during the vesting period according to IFRS 2.(1) Mr Christophe Cuvillier was appointed Chairman of the Management Board by the Supervisory Board on March 4, 2013, upon the recommendation of the GN&RC, with effect as of April 25, 2013.
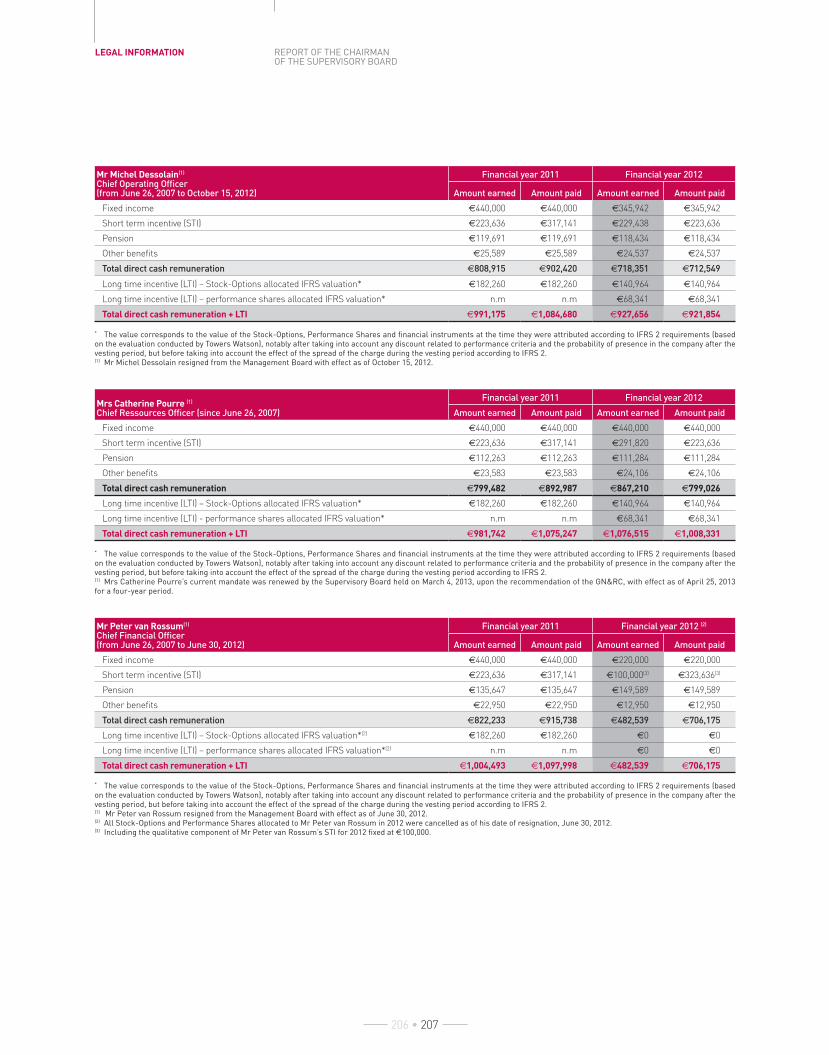
REPORT OF THE CHAIRMAN OF THE SUPERVISORY BOARD
LEGAL INFORMATION
206 • 207
Mr Michel Dessolain(1) Chief Operating Offi cer(from June 26, 2007 to October 15, 2012)
Financial year 2011 Financial year 2012
Amount earned Amount paid Amount earned Amount paid
Fixed income €440,000 €440,000 €345,942 €345,942
Short term incentive (STI) €223,636 €317,141 €229,438 €223,636
Pension €119,691 €119,691 €118,434 €118,434
Other benefi ts €25,589 €25,589 €24,537 €24,537
Total direct cash remuneration €808,915 €902,420 €718,351 €712,549
Long time incentive (LTI) – Stock-Options allocated IFRS valuation* €182,260 €182,260 €140,964 €140,964
Long time incentive (LTI) – performance shares allocated IFRS valuation* n.m n.m €68,341 €68,341
Total direct cash remuneration + LTI €991,175 €1,084,680 €927,656 €921,854
* The value corresponds to the value of the Stock-Options, Performance Shares and fi nancial instruments at the time they were attributed according to IFRS 2 requirements (based on the evaluation conducted by Towers Watson), notably after taking into account any discount related to performance criteria and the probability of presence in the company after the vesting period, but before taking into account the effect of the spread of the charge during the vesting period according to IFRS 2.(1) Mr Michel Dessolain resigned from the Management Board with effect as of October 15, 2012.
Mrs Catherine Pourre (1)
Chief Ressources Offi cer (since June 26, 2007)
Financial year 2011 Financial year 2012
Amount earned Amount paid Amount earned Amount paid
Fixed income €440,000 €440,000 €440,000 €440,000
Short term incentive (STI) €223,636 €317,141 €291,820 €223,636
Pension €112,263 €112,263 €111,284 €111,284
Other benefi ts €23,583 €23,583 €24,106 €24,106
Total direct cash remuneration €799,482 €892,987 €867,210 €799,026
Long time incentive (LTI) – Stock-Options allocated IFRS valuation* €182,260 €182,260 €140,964 €140,964
Long time incentive (LTI) - performance shares allocated IFRS valuation* n.m n.m €68,341 €68,341
Total direct cash remuneration + LTI €981,742 €1,075,247 €1,076,515 €1,008,331
* The value corresponds to the value of the Stock-Options, Performance Shares and fi nancial instruments at the time they were attributed according to IFRS 2 requirements (based on the evaluation conducted by Towers Watson), notably after taking into account any discount related to performance criteria and the probability of presence in the company after the vesting period, but before taking into account the effect of the spread of the charge during the vesting period according to IFRS 2.(1) Mrs Catherine Pourre’s current mandate was renewed by the Supervisory Board held on March 4, 2013, upon the recommendation of the GN&RC, with effect as of April 25, 2013 for a four-year period.
Mr Peter van Rossum(1) Chief Financial Offi cer(from June 26, 2007 to June 30, 2012)
Financial year 2011 Financial year 2012 (2)
Amount earned Amount paid Amount earned Amount paid
Fixed income €440,000 €440,000 €220,000 €220,000
Short term incentive (STI) €223,636 €317,141 €100,000(3) €323,636(3)
Pension €135,647 €135,647 €149,589 €149,589
Other benefi ts €22,950 €22,950 €12,950 €12,950
Total direct cash remuneration €822,233 €915,738 €482,539 €706,175
Long time incentive (LTI) – Stock-Options allocated IFRS valuation*(2) €182,260 €182,260 €0 €0
Long time incentive (LTI) – performance shares allocated IFRS valuation*(2) n.m n.m €0 €0
Total direct cash remuneration + LTI €1,004,493 €1,097,998 €482,539 €706,175
* The value corresponds to the value of the Stock-Options, Performance Shares and fi nancial instruments at the time they were attributed according to IFRS 2 requirements (based on the evaluation conducted by Towers Watson), notably after taking into account any discount related to performance criteria and the probability of presence in the company after the vesting period, but before taking into account the effect of the spread of the charge during the vesting period according to IFRS 2.(1) Mr Peter van Rossum resigned from the Management Board with effect as of June 30, 2012.(2) All Stock-Options and Performance Shares allocated to Mr Peter van Rossum in 2012 were cancelled as of his date of resignation, June 30, 2012.(3) Including the qualitative component of Mr Peter van Rossum’s STI for 2012 fi xed at €100,000.

CONSOLIDATED FINANCIAL STATEMENTS
CORPORATE SUSTAINABILITY
BUSINESS REVIEW AND 2012 RESULTS
PORTFOLIO
208 • 209
b) Details of long term incentive (Stock-Options)
granted to or exercised by the CEO and other
Management Board members (Article L. 225-184
of the French Commercial Code)
Stock-Options granted to the CEO and other Management
Board members in the 2012 financial year
All Stock Options granted in 2012 are without discount
and are subject to a performance condition. The 2012
grant compared with the 2011 grant represents a decrease
in value of 23.8% for the CEO and a decrease in value of
22.7% for the non-CEO Management Board members, with
the exception of Mr Jaap Tonckens whose grant decreased
by 3.3% and Mr Christophe Cuvillier whose the number of
Stock-Options granted on March 4, 2013, in the perspective
of his appointment as CEO and Chairman of the Management
Board, effective April 25, 2013, is identical to that granted in
2012 to Mr Guillaume Poitrinal. All Stock Options granted
to Mr van Rossum in 2012 were cancelled on the date of his
resignation on June 30, 2012.
The economic value(14) (as calculated in accordance with
IFRS requirements in the Group consolidated accounts) of
the total amount of Stock-Options and Performance Shares
to be granted to Management Board members ranges as at
the date of grant, between 0% and 150% of their fixed income
based on a qualitative discretionary evaluation by the GN&RC
and the Supervisory Board and on proposals received from
the CEO for the other Management Board members.
For Stock-Options granted in 2007 and thereafter,
all Management Board members must keep a personal
investment in Unibail-Rodamco SE shares, equivalent to
30% of the capital gain (net of tax) on the date of exercise of
the Stock-Options granted, until they leave the Company(15).
This rule applies to Unibail-Rodamco SE shares up to a value
equivalent to two years’ fixed income for other Management
Board members and three years’ fixed income for the CEO.
The rule applies to shares acquired in respect of all Unibail-
Rodamco SE stock option plans from which Management
Board members have benefited.
On the recommendation of the GN&RC, on March 5, 2012,
the Supervisory Board decided to maintain the following rule:
the top six grants of Stock-Options (collectively and including
the CEO) must not exceed 25% and the grant of Stock-Options
to the CEO alone must not exceed 8% of the total number
of Stock-Options granted. The same thresholds have been in
place since 2008.
Management Board members are formally prohibited
from using hedging instruments to cover options and shares
that are owned as a result of exercising Stock-Options.
The allocation of Stock-Options to Management Board
members is detailed in table no. 4 in the format recommended
by the AMF and the Afep-Medef.
(14) The value corresponds to the value of the Stock-Options, Performance Shares and fi nancial instruments at the time they were attributed according to IFRS 2 requirements (based on the evaluation conducted by Towers Watson), notably after taking into account any discount related to performance criteria and the probability of presence in the company after the vesting period, but before taking into account the effect of the spread of the charge during the vesting period according to IFRS 2.
(15) Supervisory Board decision pursuant to section L. 225-185 of the French Commercial Code.
Mr Jaap Tonckens(1)
Chief Financial Offi cer (since September 1, 2009)
Financial year 2011 Financial year 2012
Amount earned Amount paid Amount earned Amount paid
Fixed income €440,000 €440,000 €440,000 €440,000
Short term incentive (STI) €273,636 €327,141 €381,820 €273,636
Pension €108,782 €108,782 €108,206 €108,206
Other benefi ts €18,129 €18,129 €18,652 €18,652
Total direct cash remuneration €840,546 €894,051 €948,678 €840,494
Long time incentive (LTI) – Stock-Options allocated IFRS valuation* €182,260 €182,260 €176,205 €176,205
Long time incentive (LTI) - performance shares allocated IFRS valuation* n.m n.m €85,401 €85,401
Total direct cash remuneration + LTI €1,022,806 €1,076,311 €1,210,284 €1,102,100
* The value corresponds to the value of the Stock-Options, Performance Shares and fi nancial instruments at the time they were attributed according to IFRS 2 requirements (based on the evaluation conducted by Towers Watson), notably after taking into account any discount related to performance criteria and the probability of presence in the company after the vesting period, but before taking into account the effect of the spread of the charge during the vesting period according to IFRS 2.(1) Mr Jaap Tonckens current mandate was renewed by the Supervisory Board on March 4, 2013, upon the recommendation of the GN&RC, with effect as of April 25, 2013 for a four-year period.

REPORT OF THE CHAIRMAN OF THE SUPERVISORY BOARD
LEGAL INFORMATION
208 • 209
Share subscription or purchase options granted during fi nancial years 2009 to 2012 (Table no. 4 of AMF/Afep/Medef recommendations)
Plan Number Plan n° 5 performance Plan n° 6 performance Plan n° 6 performance Plan n° 7 performance
Date of grant March 13, 2009 March 10, 2010 March 10, 2011 March 14, 2012
Exercise period (at the end of the trading day)
March 13, 2013 to March 12, 2016
March 10, 2014 to March 10, 2017
March 10, 2015 to March 10, 2018
March 14, 2016 to March 14, 2019
Exercise Price per Stock-Option €99.42* €148,32* €144,37* €146,11*
Type of Stock-Options
Share subscription or purchase Stock-Options subject to performance conditions and with no
discount
Share subscription or purchase Stock-Options subject to performance conditions and with no
discount
Share subscription or purchase Stock-Options subject to performance conditions and with no
discount
Share subscription or purchase Stock-Options subject to performance conditions and with no
discount
Names of Management Board member
Number of Stock- Options
granted*
Value of Stock- Options
granted**
Number of Stock- Options
granted*
Value of Stock- Options
granted**
Variation 2010 vs 2009 in value
Number of Stock- Options
granted*
Value of Stock- Options
granted**
Variation 2011 vs 2010 in value
Number of Stock- Options
granted*
Value of Stock- Options
granted**
Variation 2012 vs 2011 in value
Mr G. PoitrinalChief Executive Offi cer(1) 50,000 €221,000 50,000 €318,500 44.1% 55,000 €385,550 21.1% 42.500 €293,675 -23.8%
Mr C. CuvillierChief Operating Offi cer(2) (a) n.m n.m n.m n.m n.m 26,000 €197,600(a) n.m 29,750 €205,573 4.0%
Mr M. DessolainChief Strategy Offi cer(3) 25,000 €110,500 25,000 €159,250 44.1% 26,000 €182,260 14.4% 20,400 €140,964 -22.7%
Mrs C. PourreChief Ressources Offi cer(4) 25,000 €110,500 25,000 €159,250 44.1% 26,000 €182,260 14.4% 20.400, €140,964 -22.7%
Mr P. van RossumChief Financial Offi cer(5) 25,000 €110,500 25,000 €159,250 44.1% 26,000 €182,260 14.4% 20.400,(b) €140,964,(b) -22.7%
Mr J. TonckensChief Investment Offi cer(6) n.m n.m 40,000 €254,800 n.m 26,000 €182,260 -28.5% 25,500 €176,205 -3.3%
* At the date of the grant and before adjustments.** The value corresponds to the value of the options and fi nancial instruments at the time they were attributed according to IFRS 2 requirements (based on the evaluation conducted by Towers Watson), notably after taking into account any discount related to performance criteria and the probability of presence in the company after the vesting period, but before taking into account the effect of the spread of the charge during the vesting period according to IFRS 2.(1) Mr Guillaume Poitrinal’s mandate as Chairman of the Management Board will expire on April 25, 2013. (2) Mr Christophe Cuvillier was appointed Chairman of the Management Board by the Supervisory Board on March 4, 2013, upon the recommendation of the GN&RC, with effect as of April 25, 2013.(3) Mr Michel Dessolain resigned from the Management Board with effect as of October 15, 2012.(4) Mrs Catherine Pourre’s current mandate was renewed by the Supervisory Board on March 4, 2013, upon the recommendation of the GN&RC, with effect as of April 25, 1013 for a four-year period.(5) Mr Peter van Rossum resigned from the Management Board with effect as of June 30, 2012.(6) Mr Jaap Tonckens current mandate was renewed by the Supervisory Board on March 4, 2013, upon the recommendation of the GN&RC, with effect as of April 25, 2013 for a four-year period.(a) With the exception of Mr Cuvillier who had an exceptional grant subsequent to his appointment on June 1, 2011. In the framework of an additionnal Plan (Plan n°7), the details of his allocation were fi xed as follow: allocation date = June 9, 2011; exercice period = June 9, 2015 to June 9, 2018; exercice price = €152,03.(b) All Stock-Options and Performance Shares allocated to Mr Peter van Rossum in 2012 were cancelled as of his date of resignation, June 30, 2012.
Stock-Options granted to the Management Board members
in the 2013 financial year
In accordance with Afep-Medef recommendations,
in order to avoid all windfall effects, the annual allocation of
Stock-Options is made in March, following the publication
of the fi nancial results. For more details, refer to page 184.
On March 4, 2013, a total of 617,066 Stock-Options,
representing 0.63% of the fully diluted share capital, were
allocated. All Stock-Options granted in 2013 under Plan
no. 7 Performance (refer to pages 185 for full details) have
the same characteristics as the Stock-Options allocated in
2012 i.e. there is no discount and they are subject to the same
performance condition. Allocations to Management Board
members are subject to the same conditions as in 2012 as
referred to above and as shown in the following table.

CONSOLIDATED FINANCIAL STATEMENTS
CORPORATE SUSTAINABILITY
BUSINESS REVIEW AND 2012 RESULTS
PORTFOLIO
210 • 211
Share subscription or purchase options granted to Management Board members in the 2013 fi nancial year (Table no. 4 bis of AMF/Afep/Medef recommendations)
Plan Number Plan n° 7 performance
Date of grant March 4 , 2013
Exercise period (at the end of the trading day) March 4, 2017 to March 4, 2020
Exercise Price per Stock-Option 173.16
Type of Stock-Options
Share subscription or purchase Stock-Options subject to performance conditions
and with no discount
Names of MB memberNumber of Stock-Options granted
Value of Stock-Options granted*
Mr G. Poitrinal – Chief Executive Offi cer(1) 0 0
Mr C. Cuvillier – Chief Operating Offi cer(2) 42,500 337,875
Mrs C. Pourre – Chief Ressources Offi cer(3) 20,400 162,180
Mr J. Tonckens – Chief Financial Offi cer(3) 25,500 202,725
* The value corresponds to the value of the Stock-Options and fi nancial instruments at the time they were attributed according to IFRS 2 requirements (based on the evaluation conducted by Towers Watson), notably after taking into account any discount related to performance criteria and the probability of presence in the company after the vesting period, but before taking into account the effect of the spread of the charge during the vesting period according to IFRS 2.(1) Mr Guillaume Poitrinal’s mandate as Chairman of the Management Board will expire on April 25,2013.(2) Mr Christophe Cuvillier was appointed Chairman of the Management Board by the Supervisory Board held on March 4, 2013, upon the recommendation of the GN&RC, with effect as of April 25, 2013.(3) The current mandates of Mrs Catherine Pourre and Mr Jaap Tonckens were renewed by the Supervisory Board on March 4, 2013, upon the recommendation of the GN&RC, with effect of April 25, 2013 each for a four-year period.
No Stock-Options were granted to Mr Poitrinal on March 4,
2013. The number of Stock-Options granted to Mr Cuvillier on
March 4, 2013 increased by 42.8% in light of his appointment
as Chief Executive Offi cer and Chairman of the Management
Board on April 25, 2013.
The number of Stock-Options granted on March 4, 2013 to
the other non-CEO Management Board members remained at
the same level as in 2012. The overall Stock Option allocation
to the Management Board members, including those granted
to Mr Jean-Marie Tritant, Mr Olivier Bossard and Mr Fabrice
Mouchel (who will become members of the Management
Board on April 25, 2013) subject to the prior approval of the
Dutch Financial Market Authority, represents 23.42% of the
total grant of Stock-Options within the Group in 2013.
Stock-Options exercised by Management Board members during the 2012 fi nancial year (Art. L. 225-184 of the French Commercial Code) (Table no. 5 of AMF/Afep-Medef recommendations)
Stock-options exercised by the Management Board MemberPlan number –
Tranche year and date
Number of Stock-Options exercised for
the fi nancial year(1)Exercise price
per Stock-Option(1)
Mr G. Poitrinal(2) Plan Performance n°3 – Tranche 2005 – 14/12/2005 2,152 €86.37
Plan Performance n°4 – Tranche 2006 – 11/10/2006 50,290 €128.46
Plan Performance n°5 – Tranche 2007 – 11/10/2007 50,290 €143.46
Mr P. van Rossum(3) Plan Performance n°5 – Tranche 2007 – 11/10/2007 44,003 €143.46
Plan Performance n°5 – Tranche 2008 – 23/10/2008 24,681 €103.62
Mrs C. Pourre(4) Plan Performance n°4 – Tranche 2006 – 11/10/2006 25,146 €128.46
Plan Performance n°5 – Tranche 2007 – 11/10/2007 25,146 €143.46
(1) After legal adjustment(s), if any.(2) Mr Guillaume Poitrinal’s mandate as Chairman of the Management Board will expire on April 25,2013.(3) Mr Peter van Rossum resigned from the Management Board with effect as of June 30, 2012.(4) The current mandates of Mrs Catherine Pourre and Mr Jaap Tonckens were renewed by the Supervisory Board on March 4, 2013, upon the recommendation of the GN&RC, with effect of April 25, 2013 each for a four-year period.

REPORT OF THE CHAIRMAN OF THE SUPERVISORY BOARD
LEGAL INFORMATION
210 • 211
c) Details of Performance Shares allocated and/or available
to Management Board members (Art. L. 225-194-4 of the
French Commercial Code)
Performance shares allocated to Management Board
Members during the 2012 fi nancial year
On March 14, 2012, a total of 44,975 performance shares
were granted, with effect from April 26, 2012, to corporate
offi cers and employees (of which 23.66% were granted to the
CEO and non-CEO members of the Management Board).
The details of the Performance Share Plan are outlined
on page 186. The grant of performance shares allocated to
Management Board members is presented in detail in table
no. 6 in accordance with the recommendations of the AMF/
Afep-Medef.
These performance shares are a 100% subject to
an external performance condition based on Unibail-
Rodamco SE’s overall stock market performance, taking into
account distributions reinvested, outperforming the EPRA
Total Return Benchmark index over the vesting period (a
minimum of three years).
The economic value(16) (as calculated in accordance with
IFRS requirements in the Group consolidated accounts) of
the total amount of Performance Shares and Stock-Options
granted to Management Board members must remain in the
range of 0% to 150% of their annual gross fixed remuneration
based on a discretionary qualitative evaluation by the GN&RC
and approved by the Supervisory Board (based on proposals
received from the CEO for the non-CEO Management Board
members).
The Supervisory Board, in the same meeting, decided that:
• all Management Board members must retain 30% of
the performance shares (once they become available)
as a personal investment, until the end of their mandate
as Management Board members of the Company. This
retention obligation, together with the retention obligation
for Stock-Options, applies up to a maximum of the equivalent
in Unibail-Rodamco shares of two years of Fixed income for
non-CEO Management Board members and three years of
fixed income for the CEO, until the end of their mandates as
Management Board members of the Company;
• in compliance with the Afep-Medef Code, all Management
Board members must acquire one share for every two
Performance Shares awarded, upon their availability. This
rule is, however, suspended for a period that a Management
Board member owns or comes to own a number of Unibail-
Rodamco shares equal to at least 50% of his or her annual
fixed income in any given year.
The grant of Performance Shares to Management Board
members is presented in detail in tables no. 6 and 7 in
accordance with the recommendation of the AMF/Afep-Medef.
(16) The value corresponds to the value of the Stock-Options, Performance Shares and fi nancial instruments at the time they were attributed according to IFRS 2 requirements (based on the evaluation conducted by Towers Watson), notably after taking into account any discount related to performance criteria and the probability of presence in the company after the vesting period, but before taking into account the effect of the spread of the charge during the vesting period according to IFRS 2.

CONSOLIDATED FINANCIAL STATEMENTS
CORPORATE SUSTAINABILITY
BUSINESS REVIEW AND 2012 RESULTS
PORTFOLIO
UNIBAIL-RODAMCO - FINANCIAL REPORT 2012 212 • 213
Details of the Performance Shares granted to Management Board members during the 2012 fi nancial year (Table no. 6 of AMF/Afep-Medef recommendations)
Management Board MemberPlan number
and date
Numbers of Performance Shares allocated during the 2012 fi nancial year
Shares valuation according to the reserved method
for consolidated fi nancial statements
Acquisition date(1)
Availability date (at the end
of the trading day) (1) (2)
Performance criteria
Mr G. Poitrinal(3)
Plan n° 1 Performance – 26/04/2012 2,845 €142,335 26/04/2015 26/04/2017 Yes
Mr C. Cuvillier(4)
Plan n° 1 Performance – 26/04/2012 1,992 €99,660 26/04/2015 26/04/2017 Yes
Mr M. Dessolain(5)
Plan n° 1 Performance – 26/04/2012 1,366 €68,341 26/04/2015 26/04/2017 Yes
Mrs C. Pourre(6)
Plan n° 1 Performance – 26/04/2012 1,366 €68,341 26/04/2015 26/04/2017 Yes
Mr P. van Rossum(7)
Plan n° 1 Performance – 26/04/2012 1,366 €71,838 26/04/2015 26/04/2017 Yes
Mr J. Tonckens(6)
Plan n° 1 Performance – 26/04/2012 1,707 €85,401 26/04/2015 26/04/2017 Yes
(1) Subject to the completion of the Performance condition which shall be restrictively tested four times (“restrictive tests”) during the Vesting Period as of April 26, 2015. If the performance condition is not met on one of the “restrictive tests”, all rights are definitively lost on April 26, 2017.(2) Expiring date of the 2 year-holding period running from the effective Acquisition date, being on April 26, 2019 at the latest.(3) Mr Guillaume Poitrinal’s mandate as Chairman of the Management Board will expire on April 25,2013.(4) Mr Christophe Cuvillier was appointed Chairman of the Management Board by the Supervisory Board on March 4, 2013, upon the recommendation of the GN&RC, with effect as of April 25, 2013.(5) Mr Michel Dessolain resigned from the Management Board with effect as of October 15, 2012.(5) The current mandates of Mrs Catherine Pourre and Mr Jaap Tonckens were renewed by the Supervisory Board on March 4, 2013, upon the recommendation of the GN&RC, with effect of April 25, 2013 each for a four-year period. (7) Mr Peter van Rossum resigned from the Management Board with effect as of June 30, 2012; all performance shares allocated to him in 2012 were cancelled as of his date of resignation, June 30, 2012.
Details of the Performance Shares available to Management Board members during the 2012 fi nancial year (Table no. 7 of AMF/Afep-Medef recommendations)
Management Board MemberPlan number
and date
Number of shares being available during the 2012 fi nancial year Acquisition condition
Mr G. Poitrinal(1)
Plan n° 1 Performance – 26/04/2012 0 Yes
Mr C. Cuvillier(2)
Plan n° 1 Performance – 26/04/2012 0 Yes
Mr M. Dessolain(3)
Plan n° 1 Performance – 26/04/2012 0 Yes
Mrs C. Pourre(4)
Plan n° 1 Performance – 26/04/2012 0 Yes
Mr P. van Rossum(5)
Plan n° 1 Performance – 26/04/2012 0 Yes
Mr J. Tonckens(4)
Plan n° 1 Performance – 26/04/2012 0 Yes
(1) Mr Guillaume Poitrinal’s mandate as Chairman of the Management Board will expire on April 25, 2013.(2) Mr Christophe Cuvillier was appointed Chairman of the Management Board by the Supervisory Board on March 4, 2013, upon the recommendation of the GN&RC, with effect as of April 25, 2013.(3) Mr Michel Dessolain resigned from the Management Board with effect as of October 15, 2012.(4) The current mandates of Mrs Catherine Pourre and Mr Jaap Tonckens were renewed by the Supervisory Board on March 4, 2013, upon the recommendation of the GN&RC, with effect of April 25, 2013 each for a four-year period. (5) Mr Peter van Rossum resigned from the Management Board with effect as of June 30, 2012; all performance shares allocated to him in 2012 were cancelled as of his effective date of resignation, June 30, 2012.

REPORT OF THE CHAIRMAN OF THE SUPERVISORY BOARD
LEGAL INFORMATION
FINANCIAL REPORT 2012 - UNIBAIL-RODAMCO 212 • 213
Performance Shares granted to Management Board
members in the financial year 2013
On March 4, 2013, the Supervisory Board, on the
recommandation of the GN&RC, decided to grant to
employees and corporate offi cers of the group a maximum of
36,056 performance shares, of which 23.57% is granted to the
CEO and the other non-CEO members of the Management
Board (including Mr Jean-Marie Tritant, Mr Olivier Bossard
and Mr Fabrice Mouchel who will become Management Board
members from April 25, 2013) subject to prior approval from
the Dutch Market Financial Authority and representing 0.04%
of the fully diluted share capital. No performance shares were
granted to Mr Poitrinal in 2013.
All the Performance Shares granted in 2013 (Plan no. 1
Performance 2013 Tranche – see details on page 188 have
the same features as the performance shares granted in 2012
and are strictly submitted to the same performance condition.
The 2013 allocations to Management Board members are
indicated in the table below:
(Table no. 6 bis of AMF/Afep-Medef recommendations)
Management Board Member
Plan number and date
Number of shares allocated during the 2013 fi nancial year
Shares valuation according to the
reserved method for consolidated
fi nancial statements Acquisition date
Availability date(at the end
of the trading day) (1)Performance
criteria
Mr G. Poitrinal(2)
Plan no. 1 Performance
04/03/2013 0 0 – – –
Mr C. Cuvillier(3)
Plan no. 1 Performance
04/03/2013 2,500 155,140 04/03/2016 04/03/2018 Yes
Mrs C. Pourre(4)
Plan no. 1 Performance
04/03/2013 1,200 74,467 04/03/2016 04/03/2018 Yes
Mr J.Tonckens(4)
Plan no. 1 Performance
04/03/2013 1,500 93,084 04/03/2016 04/03/2018 Yes
(1) First potential availibility date.(2) Mr Guillaume Poitrinal’s mandate as Chairman of the Management Board will expire on April 25, 2013.(3) Mr Christophe Cuvillier was appointed Chairman of the Management Board by the Supervisory Board on March 4, 2013, upon the recommendation of the GN&RC, with effect as of April 25, 2013.(4) The current mandates of Mrs Catherine Pourre and Mr Jaap Tonckens were renewed by the Supervisory Board on March 4, 2013, upon the recommendation of the GN&RC, with effect of April 25, 2013 each for a four-year period.
d) Number of Unibail-Rodamco SE shares/Stock-Options/Performance Shares held by Management Board members
as at March 4, 2013 (Art. 17 of Annex 1 of Regulation EC 809/2004) (including Stock-Options and Performance Shares granted
on March 4, 2013)
Management Board memberUnibail-Rodamco SE
shares ownedStock-Options non
exercised
Performance shares locked up in
retention period
Mr G. Poitrinal(1) 204,432 298,526 2,845
Mr C. Cuvillier(2) 0 98,250 4,492
Mrs C. Pourre(3) 71,030 167,285 2,566
Mr J.Tonckens(3) 450 126,823 3,207
(1) Mr Guillaume Poitrinal’s mandate as Chairman of the Management Board will end on April 25, 2013.(2) On March 4, 2013, the Supervisory Board, on the recommendation of the GN&RC, appointed Christophe Cuvillier as Chairman of the Management Board effective from April 25, 2013.(3) The current mandates of Mrs Catherine Pourre and Mr Jaap Tonckens were renewed by the Supervisory Board on March 4, 2013, upon the recommendation of the GN&RC, with effect of April 25, 2013 each for a four-year period.

CONSOLIDATED FINANCIAL STATEMENTS
CORPORATE SUSTAINABILITY
BUSINESS REVIEW AND 2012 RESULTS
PORTFOLIO
UNIBAIL-RODAMCO - FINANCIAL REPORT 2012 214 • 215
e) Information required by the AMF on the situation
of members of the Management Board (Table 10 –
Recommendation AMF)
The CEO’s employment contract was terminated in
accordance with the Afep-Medef recommendations on
December 31, 2008. Subsequently, the Management Board
decided to go beyond the Afep-Medef recommendations
by terminating all existing Management Board member
employment contracts during the course of 2009. This
disposition will also take force for new Management Board
Members on April 25, 2013.
The supplementary pension plans that are in place for the
members of the Management Board reflect the Franco-Dutch
character of the Group and the fact that normal practices and
standards in The Netherlands can differ from those in France.
For this reason, Management Board members benefit from
the Dutch supplementary pension plan, in accordance
with Dutch practice, connected to their activities in the
Netherlands.
Employment contract
Additionnal pension scheme (defi ned
contribution)
Additional pension scheme “chapeau” (defi ned benefi ts)
Contractual severance package
Severance related to non-competition
clause
Yes No Yes No Yes No Yes No Yes No
Mr G. Poitrinal – CEO(1)
Renewal of mandate: May 15, 2009 End of mandate: AGM 2013 x x x x x
Mr C. Cuvillier – Chief Operating Officer(2)
First mandate: June 1, 2011 End of mandate: AGM 2017 x x x x x
Mrs C. Pourre – Chief Resources Officer(3)
Renewal of mandate: May 15, 2009End of mandate: AGM 2017 x x x x x
Mr J. Tonckens – Chief Financial Officer (3)
First mandate: September 1, 2009End of mandate: AGM 2017 x x x x x
(1) Mr Guillaume Poitrinal’s mandate as Chairman of the Management Board will end on April 25, 2013.(2) On March 4, 2013, the Supervisory Board, on the recommendation of the GN&RC, appointed Mr Christophe Cuvillier as Chairman of the Management Board effective from April 25, 2013.(3) The current mandates of Mrs Catherine Pourre and Mr Jaap Tonckens were renewed by the Supervisory Board on March 4, 2013, upon the recommendation of the GN&RC, with effect of April 25, 2013 each for a four-year period.
Company supplementary pension plan
All pension contributions for 2012 are included in
“Pension” line of tables 1 and 2 and all Company costs related
to pension are shown on page 171.
Chairman of the Management Board (CEO)
The CEO benefits from the Company’s supplementary
pension plan (defined contribution scheme only). His level of
pension contributions for 2012 is included in the “Pension”
lines of tables 1 and 2. He does not benefit from any defined
benefit pension scheme (retraite chapeau, Art. 39).
Other Management Board members
All other Management Board members benefit from
the defined contribution plan within the framework of the
Company’s supplementary pension plan.
On March 4, 2013, the Supervisory Board, upon
recommendation of the GN&RC, decided to increase the
annual pension contribution of Mr Cuvillier to €200,000,
which is a level similar to the current CEO.

REPORT OF THE CHAIRMAN OF THE SUPERVISORY BOARD
LEGAL INFORMATION
FINANCIAL REPORT 2012 - UNIBAIL-RODAMCO 214 • 215
4.4.2. Remuneration of members of the Supervisory Board
a) Remuneration of the Chairman of the Supervisory Board
On March 9, 2009, taking into account his duties as
Chairman of the Supervisory Board and Chairman of the
Governance, Nomination and Remuneration Committee, the
Supervisory Board fixed his total annual gross remuneration
at €130,000 effective from January 1, 2009. This remuneration,
all inclusive, has remained unchanged since. It is paid
separately and in addition to the general envelope fixed by the
General Meeting.
b) Fees paid to the other members of the Supervisory Board
The total annual amount approved by the General Meeting
to be allocated towards Supervisory Board fees is €875,000
and has remained unchanged since 2007. The amounts paid to
the individual Supervisory Board members from this envelope
were fixed by the Supervisory Board during its May 14, 2009
meeting and amended on February 8, 2010 as detailed below.
The fee arrangements have remained unchanged since.
Supervisory Board fees in 2012
In 2012, the annual Supervisory Board fee remained
€52,000 per member (comprising of a fixed portion of 75%
and a variable portion of 25%, allocated according to member
attendance). The fixed portion was paid quarterly and the
variable portion was paid at year-end. The Vice-Chairman
of the Supervisory Board was paid a supplementary fee of
€15,000 for his services. An additional fee of €1,350 per day
was paid to Supervisory Board members attending a meeting
of the Supervisory Board and/or a Supervisory Board and a
committee meeting held outside their country of residence.
Supervisory Board Committee fees in 2012
In 2012, the annual fee for Audit Committee and GN&RC
members was maintained at €10,000. The Chairman of the
Audit Committee was paid a supplementary fee of €10,000 for
his services. An additional fee of €1,350 was paid to members
attending a Supervisory Board committee meeting and/or a
Supervisory Board committee meeting and a Supervisory
Board meeting held outside their country of residence. As
from January 1, 2010, 25% of the annual committee fee is
variable and allocated according to attendance at committee
meetings at year end.
Annual fees paid in the fi nancial years 2011 and 2012(1)
Supervisory Board Members 2011 fees 2012 fees
Mr Frans Cremers €67,265 €70,100
Mr José Luis Duran(2) €44,060 €63,350
Mr François Jaclot €96,450 €96,450
Mr Rob ter Haar (until 26/04/2012)(3) €71,450 €24,514.28
Mrs Mary Harris €71,450 €71,450
Mr Jean-Louis Laurens €63,350 €63,350
Mr Yves Lyon-Caen €58,060 €63,350
Mrs Marella Moretti(2) €44,310 €63,350
Mr Henri Moulard(4) €16,915 €0
Mr Bart Okkens(4) €20,965 €0
Mr Alec Pelmore €71,450 €71,450
Mrs Rachel Picard(5) €0 €13,464.28
Mr Herbert Schimetschek(2) €48,360 €71,450
Total SB members (excluding SB Chairman) €674,085 €672,278.56
Annual remuneration of the Supervisory Board Chairman in the fi nancial years 2011 and 2012
Mr Rob ter Haar (from 26/04/2012) €0 €86,666.67
Mr Robert van Oordt (until 26/04/2012) €130,000 €65,000
(1) Including the out of country fees, if any, and before withholding tax (30%) for non-French residents, where applicable.(2) Mandate as member of the Supervisory Board commenced on April 27, 2011.(3) Date upon which his appointment as Chairman of the Supervisory Board became effective.(4) Mandate expired on April 27, 2011.(5) Mandate from April 26, 2012 to July 23, 2012.

CONSOLIDATED FINANCIAL STATEMENTS
CORPORATE SUSTAINABILITY
BUSINESS REVIEW AND 2012 RESULTS
PORTFOLIO
UNIBAIL-RODAMCO - FINANCIAL REPORT 2012 216 • 217
4.5. Prospectus regulations – Negative declaration
To the best knowledge of the Company, the Management Board and Supervisory Board members are not subject to the situations
and restrictions referred to in article 14 of Annex 1 of the Regulation (EC 809/2004).
5. OT HER INFORMATION
5.1. Details of top ten Stock-Options grants/exercises (excluding Executive Officers) in the 2012 fi nancial year (Art.L. 225-184
of the French Commercial Code)
(Table 9 of the AMF/Afep-Medef recommendations)
Top ten of Stock-Options grants during the 2012 year
Top ten Stock-Options exercices during the 2012 year
Number of granted Stock-Options / and subscribed or purchased option(1) 113,475 217,896
Weighted average price €146.11 €120.43
Plan n°3 Tranche 2005(2) - 28,838
Plan n°4 Tranche 2006(2) - 54,680
Plan n°5 Tranche 2007(2) - 70,342
Plan n°5 Tranche 2008(2) - 64,036
Plan n°7 Tranche 2012(2) 113,475 -
(1) The number of top grants may exceed ten in the event more than 10 people own the same number of Stock-Options. Each year the Stock-Options holders list may vary.(2) For all the information about the different plans, see pages 184 to 185.
5.2. Details of top ten Performance Shares grants/available (excluding Executive Officers) in the Financial year 2012
(Art.L. 225-197-4 of the French Commercial Code)
Top ten of performance shares grants during the 2012 year
Top ten performance shares being available during the 2012 year
Number of Performance Shares(1) 7,597 0
(1) The number of top grants may exceed ten in the event more than 10 people own the same number of Performance Shares. Each year the Performance Shares holders list may vary.
5.3. Information on share transactions and Permanent
Insiders
Pursuant to AMF General Regulation disclosure
requirements, all persons with management responsibilities
in the Company (and persons with whom they have “a close
personal relationship”) are informed of the disclosure rules
that they must comply with in relation to any dealings in
the Company’s shares. In this regard, pursuant to Article
L. 621-18-4 of the French Monetary and Financial Code, the
Company has provided the French financial markets authority
(AMF) with a list of persons qualified as permanent insiders.

REPORT OF THE CHAIRMAN OF THE SUPERVISORY BOARD
LEGAL INFORMATION
FINANCIAL REPORT 2012 - UNIBAIL-RODAMCO 216 • 217
Transactions of Corporate Offi cers on Unibail-Rodamco shares (Article 223-26 of the AMF General Regulation)
Noms Date Nature de l’opération Quantité Prix unitaire
M. G. Poitrinal (1)
Chief Executive Offi cer14/03/12 Exercise of Stock-options 2,152 86.37 €
01/08/12 Exercise of Stock-options 50,290 128.46 €
01/08/12 Sale of shares 50,290 158.1985 €
16/11/12 Sale of shares by a related person 2,000 167.20 €
31/12/12 Exercise of Stock-options 50,290 143.46 €
31/12/12 Sale of shares 50,290 183.2744 €
M. C. Cuvillier (2)
Chief Operating Offi cer 29/06/12Subscription to units of the Company savings plan
(Unibail-Rodamco shares) 231.9970 107.76 €
M. M. Dessolain (3)
Chief Strategy Offi cer 29/06/12Subscription to units of the Company savings plan
(Unibail-Rodamco shares) 231.9970 107.76 €
Mme. C. Pourre (4)
Chief Resources Offi cer 29/06/12Subscription to units of the Company savings plan
(Unibail-Rodamco shares) 231.9970 107.76 €
26/07/12 Exercise of Stock-options 25,146 143.46 €
26/07/12 Sale of shares 25,146 154.9111 €
06/08/12 Sale of shares by a related person 611 161.9040 €
06/08/12 Sale of shares by a related person 611 161.8593 €
06/08/12 Sale of shares by a related person 611 161.9493 €
31/12/12 Exercise of Stock-options 25,146 128.46 €
31/12/12 Sale of shares 25,146 183.2744 €
M. J. Tonckens (4)
Chief Financial Offi cer 29/06/12Subscription to units of the Company savings plan
(Unibail-Rodamco shares) 231.9970 107.76 €
M.Yves Lyon CaenMember of the Supervisory Board 07/02/2012 Purchase of shares 200 144.55 €
Mme Marella MorettiMember of the Supervisory Board 27/12/2012 Purchase of shares 110 186.70 €
(1) Mr Guillaume Poitrinal’s mandate as Chairman of the Management Board will end on April 25,2013.(2) Mr Christophe Cuvillier was appointed Chairman of the Management Board by the Supervisory Board on March 4, 2013, upon the recommendation of the GN&RC, with effect as of April 25, 2013(3) Mr Michel Dessolain resigned from the Management Board with effect as of October 15, 2012(4) The current mandates of Mrs Catherine Pourre and Mr Jaap Tonckens were renewed by the Supervisory Board on March 4, 2013, upon the recommendation of the GN&RC, with effect of April 25, 2013 each for a four-year period.
5.4. Appraiser fees
The assets of each of the Group’s three business sectors
are valued twice a year by external appraisers.
The appraiser fees are fixed by agreement and amounted
to €1.1 million in 2012 (cf. €1.2 million in 2011). For each
appraiser, the invoiced fees represent less than 10% of the
appraiser’s overall turnover.
5.5. Insurance
Unibail-Rodamco SE is covered by a Group insurance
programme, which is underwritten by leading insurance
companies. This programme is actively monitored by the
Group Insurance Department in liaison with local teams and
insurance brokers.
Under the property damage and terrorism programmes,
the Group’s property assets are insured, for most of them,
for their full reconstruction value, which is regularly assessed
by external property insurance valuers, and for business
interruptions and loss of rents. The Group has also taken
out general liability insurances that cover financial damages
resulting from third parties’ claims.
Main construction projects and renovation works on
properties are covered by Contractor’s All Risks policies.
Defects affecting the works are covered by Decennial
insurance in France and by Contractors warranties for works
in every Region.
The 2012 premium amounted to €5.9 million, except
construction insurance premiums. Most of these premiums
were invoiced to tenants or to other co-owners in the context
of existing contracts and regulations in force.
There were no major losses in 2012.

CONSOLIDATED FINANCIAL STATEMENTS
CORPORATE SUSTAINABILITY
BUSINESS REVIEW AND 2012 RESULTS
PORTFOLIO
UNIBAIL-RODAMCO - FINANCIAL REPORT 2012 218 • 219
5.6. Supplier payment dates for the parent company, Unibail-Rodamco SE
As required by article D. 441-4 of the French Commercial Code, the table below shows the balances of outstanding supplier
accounts as at December 31, 2012 (according to the due date). This information is provided with comparative figures against the
preceding year.
Balance in thousands of euros
Due
Already due at year end
Without payment date Totalwithin 30 days
between 30 days and 60 days more than 90 days
31/12/2011 31/12/2012 31/12/2011 31/12/2012 31/12/2011 31/12/2012 31/12/2011 31/12/2012 31/12/2011 31/12/2012 31/12/2011 31/12/2012
Suppliers 1,440 180 0 0 0 0 807 770 0 0 2,247 950
Accruals 27,106 36,610 27,106 36,610
Others 1,547 1,561 1,547 1,561
France 1,440 180 0 0 0 0 807 770 28,653 38,171 30,900 39,121
Dutch Permanent Establishment 3,498 3,079
Total Unibail-Rodamco 34,398 42,200
“Other” are mainly amounts withheld as contractual guarantees.
5.7. Results for the parent company, Unibail-Rodamco SE over the past 5 years
2008 2009 2010 2011 2012
Capital at year-end
Share capital (in thousand of euros) 407,223 456,323 458,73 459,034 474,460
Number of shares outstanding 81,444,653 91,264,549 91,745,924 91,806,889 94,891,980
Number of convertible bonds outstanding 0 0 0 0 0
Results of operations (in thousands of euros)
Net sales 43,795 51,739 81,045 78,067 76,798
Income before tax, depreciation, amortization and provisions 849,432 419,645 683,22 776,181 667,782
Corporate income tax 36,806 0 0 146 -465
Net income 413,273 -833,641 1,336,079 1,067,499 1,469,245
Dividends 451,113 0 486,253 734,455 797,093(1)
Exceptional distribution 169,413 2,565,571 247,714 0 0
Per share data (in euros)
Income after tax, before depreciation, amortization and provisions 9.98 4.60 7.45 8.45 7.04
Earnings per share 5.07 -9.13 14.56 11.63 15.48
Dividend 5.50 0.00 5.30 8.00 8.40 (1)
Exceptional distribution 2.00 28.00 2.70 0 0
Employee data
Number of employees 11 11 10 11 5
Total payroll (in thousands of euros) 4,750 3,949 7,407 6,534 4,700
Total benefi ts (in thousands of euros) 2,969 2,063 2,658 2,506 2,560
(1) To be submitted to the General Assembly on April 25, 2013 on the basis of 94,891,980 shares as at December 31, 2012.

REPORT OF THE CHAIRMAN OF THE SUPERVISORY BOARD
LEGAL INFORMATION
FINANCIAL REPORT 2012 - UNIBAIL-RODAMCO 218 • 219
6. RI SK FACTORS
Internal control policies and arrangements of Unibail-
Rodamco Group (“the Group), which are based on reference
documents, charters, standards, procedures and best
practices, aim to create and maintain an organisation that
helps to prevent and/or mitigate and manage controllable risk
factors, in particular operational, financial, tax and legal risks
to which Unibail-Rodamco SE and its subsidiaries are or could
be exposed, even if these risks can never be totally eliminated.
The relevant Group monitoring procedures and
management components are largely detailed in the internal
control system section of the Report of the Chairman of the
Supervisory Board (see pages 231 to 236).
Investors’ attention is drawn to the fact that the risk factors
discussed in this section are not exhaustive and that there
may be other risks, either wholly or partly unknown and/
or of which the occurrence is not considered likely to have
a material adverse effect on the Unibail-Rodamco Group, its
operations, its financial situation and/or its results as at the
date of filing of this Registration Document.
6.1. Risks inherent in Unibail-Rodamco SE’s
business activities
6.1.1. Risks arising from trends in the property market
The Unibail-Rodamco Group is present in various sectors
of the commercial property sector, specifically shopping
centres, offices, convention-exhibitions and associated
services. Apart from risk factors specific to each asset, the
Group’s activities are exposed to factors beyond its control and
to specific systemic risks, such as the cyclical nature of the
sectors in which it operates. The Group’s strategy and policies
aim to curb the negative effects of these risks. However,
sudden changes in the economic (including domestic
consumption), financial, currency, regulatory, geopolitical,
political, social, health and/or ecological environment may
have a significant impact on the Group, the value of its assets,
its results, its distribution policy, its development plans and/
or its investment/divestment activities.
A long-term deterioration in economic conditions with
implications for the rental market may have a signifi cant impact
on the level of the Group’s activities, its results, the value of its
assets and its investment and development strategy.
The Group’s assets (with the exception of certain
development projects) are valued biannually using the fair
value method.The value of the Group’s assets is sensitive
to variation according to the valuers’ principal assumptions
(yield, rental value, occupancy rate) and is, therefore,
susceptible to material variations that may impact the Group,
its profile and/or its results.
Some of the Company’s real estate assets depend on
flagship stores to attract customers and could suffer a
material adverse impact if one or more of these tenants were
to terminate their respective leases or to fail to renew their
lease and/or in the event of consolidation among these retail
sector companies.
6.1.2. Risks arising from property asset construction
and refurbishment projects
Unibail-Rodamco conducts construction and refurbishment
activities in the offi ce, shopping centre and convention-
exhibition property segments, the principal risks of which are
linked to:
1) securing the requisite legal administrative authorisations
(building permits, commercial licences, opening and/or
operational licences, etc.);
2) controlling construction costs (staying on time and on
budget); and
3) achieving a good letting rate for properties (letting of all
surfaces at sufficient rent levels).
6.1.3. Tenant insolvency risks
Unibail-Rodamco’s ability to collect rents depends on the
solvency of its tenants. Tenant creditworthiness is taken into
consideration by Unibail-Rodamco before it enters into a
specific lease. Nevertheless, it is possible that tenants may
not pay rent on time or may default on payments, especially
in more difficult economic environments, and this could
materially affect Unibail-Rodamco’s operating performance
and/or its results. For information purposes, 1% of unpaid
rent represents €15.5 million.
6.2. Legal,regulatory,tax,environmental and insurance-
related risks
6.2.1. Legal and regulatory risks
Unibail-Rodamco has to comply with a wide variety of laws
and regulations, in particular: securities law and general
regulations of the competition authorities, urban planning
regulations, construction and operating permits and licences,
health and safety regulations (particularly for assets that are
open to the public), environmental regulations, lease laws,
labour regulations, and corporate and tax laws, in particular
the provisions of the SIIC(16) regime. Changes in the regulatory
framework and/or the loss of benefi ts associated with a status
or an authorisation could require Unibail-Rodamco to adapt
(16) Listed Property Investment Companies SIIC (Sociétés d’Investissements Immobiliers Cotées).

CONSOLIDATED FINANCIAL STATEMENTS
CORPORATE SUSTAINABILITY
BUSINESS REVIEW AND 2012 RESULTS
PORTFOLIO
UNIBAIL-RODAMCO - FINANCIAL REPORT 2012 220 • 221
its business activities, its assets or its strategy (including
geographical presence), possibly leading to a material
significant impact in the value of its property portfolio and/
or its results, an increase in its expenses, and/or a slowing
or even halting of the development of certain investment or
letting activities.
In the normal course of its business activities, the Group
could be involved in legal proceedings (for instance, regarding
contractual responsibility, employers’ liabilities, penal issues)
and is subject to tax and administrative audits. Associated
risks in addition to fi nancial risk include reputational damage
associated with the company’s image, ethics and way of doing
business. To the best of the Company’s knowledge, at the filing
date of this Registration Document Unibail-Rodamco is not
involved in, nor party to any government, judicial or arbitration
proceeding (including all proceedings which the Company
is aware of and which are either pending or threatening)
which could have or have had during the last twelve months
a material adverse effect on the results, the profi tability or
financial situation of the Company and/or the Group and are
not reflected in its financial statements.
For additional information relating to the measures taken
to mitigate legal risks, please refer to the Report of the
Chairman of the Supervisory Board (part IV “Internal Control
System”), page 231.
6.2.2. Tax risks linked to special tax regimes
General
Unibail-Rodamco is subject to tax in the countries in
which it operates. In some countries, a special tax regime for
real estate investors exists, leading to a lower tax burden at
Group level, the basic principle being that it distributes most
of its income, which subsequently is taxable at the level of
the shareholders. If and to the extent Unibail-Rodamco opts
to make use of such system, it will be obliged to meet the
conditions that are linked to the respective systems.
France
In France, Unibail-Rodamco is subject to the SIIC (Sociétés
d’Investissements Immobiliers Cotées) tax regime as set forth
in Section 208 C of the French General Tax Code. If Unibail-
Rodamco does not respect the required conditions, it would
become liable for standard corporate income tax which would
have a negative impact on its business activities and its
results. Furthermore, if one or more of Unibail-Rodamco SE’s
shareholders, acting separately or together, reaches the
60% ownership threshold for voting rights, this would cause
Unibail-Rodamco SE to lose its SIIC status.
In addition to the above, Unibail-Rodamco SE could be
faced with an additional 20% tax charge on distributions
paid out of the SIIC result to a tax-exempt shareholder
(excluding individuals) owning, directly or indirectly, 10% or
more of Unibail-Rodamco SE’s share capital (a Shareholder
Concerned) in the event that the Company is unable to off-set
this tax charge to the Shareholder Concerned. For more
details, refer to page 180.
The Netherlands
As reported in its press release of December 11, 2009,
Unibail-Rodamco expects that the Dutch tax authorities will
deny the status of FBI (Fiscale Beleggings Instelling) in The
Netherlands for Unibail-Rodamco’s Dutch activities for 2010
onwards. Unibail-Rodamco still qualifies as a SIIC under the
French SIIC regime. Differences between the French SIIC and
the Dutch FBI regime, although materially insignificant in the
Group’s case, proved to be irreconcilable for the Dutch tax
authorities.
Although Unibail-Rodamco does not agree with the
viewpoint of the Dutch tax authorities, it continues to apply a
prudent view in its 2012 accounts, based on the assumption
that the Dutch activities from 2010 onwards will be taxable. In
light of the significant Dutch tax loss carry forwards identified
by Group’s fiscal advisors in the Netherlands, this assumption
should have no impact on recurring result for 2012 nor for the
foreseeable future.
Future changes
In all countries it operates in, Unibail-Rodamco and its
subsidiaries remain exposed to changes in the tax rules that
are currently in force.
6.2.3. Environmental risks
As a property owner or manager, Unibail-Rodamco has
to comply with local environmental regulations in each
country where it is active. Failure to comply with these
local environmental regulations, or the need to comply
with significant new environmental regulations that may be
introduced, could lead to higher expenses or hamper the
development of the Group’s activities and could potentially
affect Unibail-Rodamco’s results or general liability.
Moreover, each of Unibail-Rodamco’s real estate assets
is potentially vulnerable to natural disasters (climate change,
health or ecological crises, etc.) that may have a negative
impact on the affected properties.
Each year, Unibail-Rodamco SE includes a chapter on
Sustainability in its Annual and Sustainable Development

REPORT OF THE CHAIRMAN OF THE SUPERVISORY BOARD
LEGAL INFORMATION
FINANCIAL REPORT 2012 - UNIBAIL-RODAMCO 220 • 221
Report. This report, also available on its website, deals
with environmental group policy, achievements and targets.
A specific section is dedicated to the Group policy for Health
and Safety risk management on its assets.
Unibail-Rodamco SE was included on the Dow Jones
Sustainability World and Europe Indexes 2012. No guarantee
can be given regarding the Company’s inclusion on these
indexes going forward.
6.2.4. Insurance-related risks
Insurers could face economic difficulties resulting in
them being unable to honour claims pursuant to the Group’s
insurance policies.
Unibail-Rodamco depends on the insurances markets and
their financial capacities to cover its risks. It could therefore
experience insurance shortfalls or find it impossible to cover
all or part of certain risks.
Some of Unibail-Rodamco’s potential losses may not be
covered, or may be partially covered. In such instances, Unibail-
Rodamco could lose all or a portion of the capital invested in an
asset, as well as the expected rents from the asset.
Unibail-Rodamco may be exposed to a situation where
the value (reconstruction cost) of one or more of its assets is
wrongly assessed by its external property insurance valuers.
In respect of assets which are managed by third parties,
Unibail-Rodamco may face a situation where insurance
policies taken out by these external management companies,
are not in force anymore or provide an insufficient coverage
in case of loss.
6.3. Risks associated with Unibail-Rodamco’s financing
policy and financial activities
6.3.1. Market risks
Unibail-Rodamco, through its activities, is exposed
to market risks which can generate losses as a result of
fluctuations in interest rates and/or currency exchange rates.
Unibail-Rodamco is exposed to interest-rate risks on the
loans it has taken out to finance its investments. An increase
or decrease in interest rates could have a negative impact on
Unibail-Rodamco’s results. Part of the Group’s exposure to
variable rates is hedged through derivatives but these hedges
could be insufficient to cover these risks. Moreover, changes
in interest rates could have a negative impact on Unibail-
Rodamco’s result by affecting the valuation of contracted
derivatives.
Unibail-Rodamco is exposed to foreign exchange risks
because it operates in countries outside the euro zone.
The value of assets, rents and revenues received in these
countries, as well as the value of operational and fi nancial
expenses, when translated into euros, may be affected by
fl uctuations in exchange rates. Additionally, changes in the
interest rates of countries outside the euro zone may also
impact the results and/or the statement of financial position.
Unibail-Rodamco’s foreign exchange risk is managed at a
corporate level by the Treasury department which monitors
the foreign exchange risk on a regular basis. To hedge part
of this risk, the Group uses derivatives and debt in foreign
currency. Such instruments may not hedge perfectly the
underlying assets or activities, and as a result changes in
the currency exchange and/or interest rates may have an
impact on the cash flows, the results and/or the statement of
financial position.
In addition, committees with several members of the
Management Board are held several times a year to decide
the appropriate hedging strategy which is then implemented
by the Treasury department. Procedures do not allow for
speculative positions to be put in place. Hedges processes
and the net interest rate and currency positions are described
in the paragraph “Market Risk Management” of the Financial
Resources in the Business Review section.
6.3.2. Liquidity risks
Unibail-Rodamco’s strategy depends on its ability to
raise financial resources, either in the form of debt (mainly
bank loans, bonds and credit lines) or equity capital, so
that it can finance its general operating requirements and
its investments. It is possible (for example in the event
of disruption in the bond or equity markets, a reduction
in the lending capacities of banks, changes affecting the
property market or investor appetite for property companies,
a downgrade in Unibail-Rodamco SE’s credit rating or
a change in business activities, financial situation or
Unibail-Rodamco SE’s ownership structure) that the Group
could – at any given point in time – encounter difficulties in
raising funds and, as a result, lack the access to liquidity
that it needs. These events could also affect the cost of its
fi nancing and lead to an increase of the financial expenses of
the Group. In this context, Unibail-Rodamco has put in place
undrawn back up facilities for an amount mentioned in the
paragraph “Funds raised” of the Financial Resources in the
Business Review section. Additionally, some of the Group’s
fi nancing contracts are subject to financial covenants and
the occurrence of material adverse changes. More details
on the Group’s covenants and ratio levels can be found in the
paragraph “Financial structure” of the Financial Resources in
the Business Review section.

CONSOLIDATED FINANCIAL STATEMENTS
CORPORATE SUSTAINABILITY
BUSINESS REVIEW AND 2012 RESULTS
PORTFOLIO
UNIBAIL-RODAMCO - FINANCIAL REPORT 2012 222 • 223
6.3.3. Counterparty risks
A large number of major international financial institutions
are counterparties to the interest rate and/or foreign
exchange rate and deposits contracted by the Group. In the
case of default by a counterparty, Unibail-Rodamco could
lose all or part of its deposits or may lose the benefit from
hedges signed with such counterparties. This could then
result in an increase in interest rate or currency exposure.
The Group’s policy to manage counterparty risks in relation
to derivative products is described in the paragraph “Market
Risk Management” of the Financial Resources in the Business
Review section.
6.4. Risks related to the volatility in the price of Unibail-
Rodamco SE securities
Stock markets may experience major fluctuations which
may or may not be related to the results of the companies
whose shares are traded on regulated markets. The price
of Unibail-Rodamco SE’s securities (including shares, ORA,
i.e. bonds redeemable in Unibail-Rodamco SE shares and
Ornane, i.e. convertible bonds in either cash or new or existing
Unibail-Rodamco SE shares) could be volatile and could be
affected by events affecting Unibail-Rodamco, its competitors
or the financial markets in general.
For instance, the price of Unibail-Rodamco SE’s securities
as well as the securities issued by Unibail-Rodamco SE
and/or fi nancial derivatives could fluctuate significantly in
response to various factors and events, which could include
changes in the liquidity of the market for Unibail-Rodamco SE
shares; changes in the expectations of volatility of shares;
variations in the Group’s financial results or its competitors
from one accounting period to another; differences between
Unibail-Rodamco’s financial or operating results and
those expected by investors and/or analysts; changes in
analysts’ recommendations or forecasts; changes in general
market conditions or in the economic environment; market
fluctuations; the promulgation of new laws or regulations or
changes in the interpretation of existing laws and regulations
relating to Unibail-Rodamco’s business.
6.5. Risks related to the sovereign debt crisis
Concerns about credit risk (including for Sovereigns) and
the Sovereign debt crisis and their potential impacts could
be detrimental to the Group and could negatively affect
the markets and business on which the Group operates.
This environment could also negatively affect the Group’s
operations and profi tability, its solvency and the solvency of
its counterparties and the value and liquidity of the securities
issued by Unibail-Rodamco and/or Unibail-Rodamco’s ability
to meet its commitments in respect of those securities and its
commitments with respect to its debt more generally.
6.6. Risks linked to key managers
The departure of a top management team member could
have a material adverse impact upon the business, fi nancial
situation and/or results of the Group. To control this risk, the
Group policy is, when possible, to set up a succession plan.
6.7. Risks related to Unibail-Rodamco’s
geographic presence
Although Unibail-Rodamco’s operations are currently
concentrated in Europe, part of the business is or may
be conducted in markets where Unibail-Rodamco may
be exposed to social, political, legal, tax and/or economic
instability, among other risks.
In relation to the risks related to Unibail-Rodamco’s
geographic presence, the Group operates in some countries
that have not joined the Euro zone. A depreciation in the local
currencies of such countries could have a negative impact
on Unibail-Rodamco’s cash flows in euros: 1) when rents
collected in local currency are converted into euros and where
the Group’s hedging policy is not sufficient; or 2) when rents
are collected in euros and this affects the tenants’ ability to pay.
A depreciation of the currency of countries outside the
euro zone may also reduce the value of Unibail-Rodamco’s
portfolio, despite the implementation of hedging policies.
6.8. Risks associated with possible conflicts of interest
Risks of conflicts of interest with companies
where Unibail-Rodamco SE is the majority shareholder
Unibail-Rodamco SE is the majority shareholder in several
companies which have one or more minority shareholders (see
pages 134 to 139). In certain circumstances, these situations
are likely to lead to potential conflicts of interest and/or
generate potential claims from the minority shareholders of
those subsidiaries despite the existing rules preventing such
situations and managing confl icts of interest.

REPORT OF THE CHAIRMAN OF THE SUPERVISORY BOARD
LEGAL INFORMATION
FINANCIAL REPORT 2012 - UNIBAIL-RODAMCO 222 • 223

CONSOLIDATED FINANCIAL STATEMENTS
CORPORATE SUSTAINABILITY
BUSINESS REVIEW AND 2012 RESULTS
PORTFOLIO
UNIBAIL-RODAMCO - FINANCIAL REPORT 2012
Report of the Chairman of the Supervisory Board 2251. Supervisory Board 2252. Remuneration of the Management Board members 2313. Corporate governance 2314. Internal control system 231
Report of the Chairmanof theSupervisory Board
224 • 225

REPORT OF THE CHAIRMAN OF THE SUPERVISORY BOARD
LEGAL INFORMATION
FINANCIAL REPORT 2012 - UNIBAIL-RODAMCO 224 • 225
Report of the Chairman of the Supervisory BoardOn the arrangements for planning and organising the work
of the Supervisory Board and on the Group’s internal control procedures for the fi nancial year ending December 31, 2012
(Article L. 225-68 of the French Commercial Code).
This report was prepared in close cooperation with Unibail-
Rodamco SE’s Management Board, the Group Director
of Legal and the Group Director of Internal Audit and Risk
Management. In addition, it was discussed with the Group’s
Statutory Auditors. On January 30, 2013, the Supervisory
Board approved this report pursuant to Article L. 225-68 of
the French Commercial Code.
1. SUPERVISORY BOARD
1.1. Functioning of the Supervisory Board
1.1.1. Purpose and powers
The Supervisory Board exerts permanent oversight and
control over the Management Board and the general affairs
of the Company. To that end, the Supervisory Board conducts
appropriate inspections and reviews and may obtain copies
of any document to fulfi l its duties. The Supervisory Board
functions under the Company’s Articles of Association and a
Supervisory Board specifi c Charter(1). It makes suggestions
and formulates recommendations to the Management Board
on the following in particular:
• company strategy and fi nancial performance;
• business risks;
• structure and administration of internal risk management
and control systems;
• fi nancial reporting procedures and compliance with relevant
laws and regulations.
In addition, the Supervisory Board makes decisions
concerning the Company’s corporate governance and
its implementation. It assesses the functioning of the
Management Board, the Supervisory Board (including its
committees) and their individual members. It handles and
settles any confl icts of interest and any discrepancies with
respect to the functioning of the Supervisory Board and/or
Management Board.
1.1.2. Limitations on the powers of the Management Board
and the purview of the Supervisory Board
Pursuant to Sub-article 11(5) of the Company’s Articles
of Association and the thresholds set out in the Supervisory
Board Charter, the Supervisory Board’s prior approval must
be obtained for certain Management Board decisions and
operations, in particular:
• acquisitions, investments (including capital expenditures
for internal development), acquisitions of shareholdings
and off-balance sheet commitments exceeding €25 million
(consolidated fi gure) concerning assets and/or activities
located outside European Union Member States or outside
the scope of the approved Group strategy. The threshold is
raised to €500 million(2) (consolidated fi gure) for assets and/
or activities located within European Union Member States
and within the scope of the Group’s strategy;
• asset disposals (including transfers of real estate or
shareholdings) in real estate exceeding €500 million(3)
(consolidated fi gure);
• indebtedness or guarantees in excess of €500 million
(consolidated fi gure), threshold raised to €1 billion for
corporate debt refi nancing purposes;
• transfers of all or part of the Company’s business to third
parties in excess of €500 million (consolidated fi gure);
• any signifi cant changes in the Group’s governance and/
or organisation, allocation of responsibilities within the
Management Board and any action affecting the Company’s
entitlement to the tax regime applicable to Listed Property
Investment Company (SIIC) tax treatment or any other real
estate tax-exempt status in a foreign country;
(1) Available on the Company’s website and at the Company’s registered offi ce.(2) This threshold is raised again to €700 million (consolidated fi gure) for urgent operations and decisions; subject to prior dialogue between the CEO, the Chairman and the Vice-Chairman of the Supervisory Board.(3) Ibid. 2.

CONSOLIDATED FINANCIAL STATEMENTS
CORPORATE SUSTAINABILITY
BUSINESS REVIEW AND 2012 RESULTS
PORTFOLIO
UNIBAIL-RODAMCO - FINANCIAL REPORT 2012 226 • 227
• any alterations to the Company’s dividend policy and
proposals by the Management Board in the distribution of
interim or full dividends.
The Supervisory Board must also, pursuant to its Charter,
be informed of transactions involving amounts in excess of
€300 million but below €500 million. The thresholds were
last amended by the Supervisory Board on February 9, 2011.
For full details and information, refer to the Supervisory
Board Charter(4).
1.1.3. Composition
Pursuant to the Articles of Association, the Supervisory
Board can consist of eight (minimum) to fourteen (maximum)
members, who are appointed by the Company’s shareholders.
Supervisory Board members are appointed for a three
year term and may be re-elected. Under the Supervisory
Board’s resignation and rotation rules, the resignation
and reappointment of members is staggered to prevent, to
the greatest extent possible, appointments/resignations
occurring simultaneously. The age limit for Supervisory
Board members is 75 and at all times at least two-thirds of its
members must be 70 or younger.
Each year, the Supervisory Board and its Gover nance,
Nomination and Remuneration Committee review the
Supervisory Board profi le and individual Supervisory Board
member independence. The Supervisory Board profi le
includes a commitment to diversity in its membership in
terms of gender, age and nationality.
The Supervisory Board was composed of ten members
in 2012(5). As at December 31, 2012, all members qualify
as independent pursuant to the criteria defi ned in the
Supervisory Board Charter based on the French Afep-Medef
corporate governance code (fi rst published in consolidated
form in December 2008 and last updated in April 2010). As at
December 31, 2012, two out of ten members are women, the
average age of members is 57.9 years and six nationalities
are represented. The varied skills and expertise of members
is summarised in the table below and are further specifi ed
in the detailed biographies provided in the Legal Information
chapter (page 197).
(4) Available on the Company’s website and at the Company’s registered offi ce.(5) At the April 26, 2012 Annual General Meeting: (1) Mr Robert van Oordt’s term ended in accordance with the provisions of the Articles of Association; (2) Mrs Mary Harris, Mr Jean-Louis Laurens and Mr Alec Pelmore were each reappointed for a three year term; and (3) Mrs Rachel Picard was appointed as a new member to the Supervisory Board, however she resigned on July 23, 2012 due to a confl ict of interest relating to her new executive role, decreasing the number of Supervisory Board members from 11 to 10.

REPORT OF THE CHAIRMAN OF THE SUPERVISORY BOARD
LEGAL INFORMATION
FINANCIAL REPORT 2012 - UNIBAIL-RODAMCO 226 • 227
Members of the Supervisory Board of Unibail-Rodamco SE as at December 31, 2012(6)
Name Age Main positions in addition to Unibail-Rodamco SE Supervisory Board membership
Year appointed to the Unibail-Rodamco SE Supervisory
Board
AGM at which Supervisory Board term
expires
Rob ter HaarChairmanIndependent memberDutch national
62 Chairman of the Supervisory Boards of Parcom Capital Management B.V. (NL) and VvAA Groep B.V. (NL)Supervisory Board member of Maxeda Retail Group B.V. (NL), Sperwer Holding B.V. (NL), Spar Holding B.V. (NL) and Bergschenhoek Groep B.V. (NL)Advisory member to the Board of Univar Inc. (USA)
2007 2014
François JaclotVice-ChairmanIndependent memberFrench national
63 Director and CEO of Addax and Oryx Group (MT) 2007 2013(1)
Frans J.G.M. CremersIndependent memberDutch national
60 Vice-Chairman of the Supervisory Boards of Fugro N.V.(NL) and N.S. N.V. (NL - Dutch Railways)Member of the Supervisory Boards of Parcom Capital Management B.V. (NL), Royal Vopak N.V. (NL), Luchthaven Schiphol N.V. (NL), and SBM Offshore N.V. (NL)
2007 2013(1)
José Luis DuranIndependent memberSpanish national
48 CEO of Devanlay S.A. (FR)CEO and Board Member of Lacoste S.A. (FR)Commercial VP of Maus Frères International Services S.A.S. (FR)Chairman of the Management Board of Gant AB (SWEDEN)Board member of France Telecom S.A. (FR)
2011 2014
Ma ry HarrisIndependent memberU.K. national
46 Member of the Supervisory Board, Audit committee and Chair of Remuneration committee of TNT Express N.V. (NL)Non-Executive Director, Chair of the Remuneration committee and member of the Nomination and Corporate Responsibility committees of J. Sainsbury plc (UK)
2008 2015
Jean-Louis Laurens Independent memberFrench national
58 General Partner of Rothschild & Cie Gestion, Paris (FR) 2007 2015
Yves Lyon-CaenIndependent memberFrench national
62 Chairman of the Supervisory Boards of Bénéteau S.A. (FR) and Sucres & Denrées (FR) 2007 2014
Marella MorettiIndependent memberItalian national
47 CFO of Fiat Finance et Services S.A. (FR)CEO and Member of the Board of Fiat Industrial Finance France S.A. (FR)General Manager CNH Financial Services S.A.S. (FR)Board Member of Fiat Finance and Trade Ltd (LU)
2011 2014
Alec PelmoreIndependent memberU.K. national
59 Senior Independent Director on the Board of Metric Property Investments plc. (UK), Chairman of its Audit committee and member of its Nomination and Remuneration committees
2008 2015
Herbert SchimetschekIndependent memberAustrian national
74 CEO of Hans Dujsik Privatstiftung (AT)Supervisory Board member of YAM Invest N.V. (NL)Deputy Supervisory Board Chairman of Bank Gutmann AG (AT) and Donau-Chemie AG (AT)
2011 2014(2)
(1) To be proposed for re-election at the 2013 Annual General Meeting.(2) To retire in accordance with the age considerations specifi ed in the Company’s Articles of Association at the 2014 Annual General Meeting.
(6) For full information, please consult the biographies in the Legal Information section
1.1.4. Meetings, attendance and information
Pursuant to its Charter, the Supervisory Board meets
at least fi ve times a year according to a pre-set schedule.
Extraordinary meetings may be held for specifi c reasons at
the written request of the Supervisory Board Chairman, or
one-third of the members of the Supervisory Board, or any
Management Board member. To encourage attendance at
Supervisory Board and committee meetings, attendance of
members is taken into consideration for the payment of the
variable portion of the annual Supervisory Board member
fee. The Statutory Auditors attend the year-end and half-
year meetings of the Supervisory Board where the fi nancial
statements for those periods are reviewed. A notice of
meeting is sent at least three days prior to Supervisory Board
meetings (except in unusual circumstances). The notice
includes a detailed agenda and comprehensive papers
enabling the Supervisory Board members to prepare for the
discussion or, if necessary, the approval of the matters on the
agenda. Whenever appropriate, Supervisory Board members
are sent materials prepared by the Company’s advisors and/
or risk managers. To ensure that Supervisory Board members
are fully informed of developments in the respective industry
segments and of events taking place within the Group,
operational and strategic matters and the Group’s corporate
sustainability performance are regularly discussed during
Supervisory Board meetings. Supervisory Board members
also receive press reviews and fi nancial reports on Unibail-
Rodamco SE and on industry matters. In addition, once a
year the Supervisory Board and Management Board take
the opportunity to visit a country where the Group is active to
discuss strategic matters and market developments in-depth.
CONSOLIDATED FINANCIAL STATEMENTS
CORPORATE SUSTAINABILITY
BUSINESS REVIEW AND 2012 RESULTS
PORTFOLIO
UNIBAIL-RODAMCO - FINANCIAL REPORT 2012 228 • 229
In 2012, the nature of the retreat was slightly altered to focus
on the operations, market developments, competition and
local strategy of the business in the country visited where the
Group operates (in 2012, this was in Warsaw, Poland).
1.1.5. Summary of Supervisory Board activities
The Supervisory Board of Unibail-Rodamco SE held
seven meetings in 2012 (including its meeting at the annual
Supervisory Board retreat). Overall attendance at these
meetings was 100%. In addition to the items and decisions
within its statutory scope, the Supervisory Board was briefed
on and discussed all major events in 2012, both internal
matters (e.g. organisation matters, key appointments within
the Group, internal audits, etc.) and external matters (e.g.
acquisitions, disposals, developments in the Group’s strategy,
development projects, fi nancial policy, etc.). The Supervisory
Board in particular approved:
• the election of Mr Rob ter Haar as Chairman of the
Supervisory Board and Chairman of the Governance,
Nomination and Remuneration Committee;
• the 2012 Budget;
• investment, development and divestment projects and
operations above its prior approval thresholds in force in 2012;
• the remuneration of the Management Board members;
• the total allocation of stock options for 2012, including the
allocations to Management Board members;
• the implementation of a Performance Share Plan in the
long term incentive remuneration policy and the allocation
of such shares to Management Board members;
• the appointment of Mr Jaap Tonckens, existing Management
Board member, as Chief Financial Offi cer;
• amendments to the Management Board Charter;
• the profi le and composition of the Supervisory Board and
the composition of its committees, including the proposal of
1 new Supervisory Board member appointed by the Annual
General Meeting on April 26, 2012;
• the formal evaluation of the functioning and effi ciency of
the Supervisory and Management Boards (Annual Self-
Assessment process);and
• the Company distribution payment policy and distribution
payment decisions.
In addition, the Supervisory Board examined/was informed
of the following matters:
• the quarterly Management Board reports for 2012;
• regular updates on the Group’s business activities, including
sustainability initiatives;
• regular updates on initiatives relating to the market
differentiation strategy, including aspects of the quality
program, “4 stars”;
• important investment, development and divestment
projects and signifi cant operational matters below its prior
approval thresholds in force in 2012;
• internal audit, risk management and compliance matters;
• the Company’s share buy-back programme;
• the full year 2011 and half year 2012 fi nancial statements;
• the 2012 fi ve-year Group business plan, including its
fi nancial results and fi nancing resources and needs;
• the implementation of the Company Savings Plan in 2012
for the French subsidiaries of the Group;
• the report on the Group’s Compliance program; and
• succession planning of the Supervisory and Management
Board.
Supervisory Board members were also informed of the
work and recommendations of its specialised committees
and that of the Statutory Auditors. The minutes of all the
meetings of the Audit Committee and the Governance,
Nomination & Remuneration Committee were systematically
made available to all members of the Supervisory Board.
The annual Self-Assessment exercise was performed by
the full Supervisory Board in accordance with the provisions
of the Afep-Medef Code by way of a written questionnaire.
The formal evaluation of the Supervisory Board was completed
with the fi lling out of a questionnaire regarding the functioning
of the Supervisory Board committees. Management Board
members were invited to participate in these assessments.
The conclusion of the three assessments was that the
current corporate governance structure and arrangements
are functioning well. It was decided from the results obtained
that additional time be dedicated to discussing strategy and
internal risk management at the Supervisory Board level and
that the Audit Committee be involved earlier in reviewing the
details of large transactions.
1.1.6. Supervisory Board Remuneration(7)
The Chairman of the Supervisory Board is paid a total gross
annual remuneration of €130,000 for his duties as Chairman
of the Supervisory Board and Chairman of the Governance,
Nomination and Remuneration Committee. This amount has
remained unchanged since January 1, 2009.
The annual fee paid to Supervisory Board members
(with the exception of the Supervisory Board Chairman) was
maintained at €52,000 per member in 2012 (unchanged
since 2007). The fee comprises of a 75% fi xed portion and
a 25% variable portion allocated according to attendance
at Supervisory Board meetings. The fi xed portion is paid
quarterly and the variable portion at year-end. The Vice-
(7) For full details, refer to the Legal Information section.

REPORT OF THE CHAIRMAN OF THE SUPERVISORY BOARD
LEGAL INFORMATION
FINANCIAL REPORT 2012 - UNIBAIL-RODAMCO 228 • 229
Chairman of the Supervisory Board is paid a supplementary
annual fi xed fee of €15,000.
An additional fee of €1,350 per day is paid to Supervisory
Board members (with the exception of the Supervisory
Board Chairman) who attend a meeting (or several related
meetings) of the Supervisory Board and/or a Supervisory
Board committee outside their country of residence.
1.2. Functioning of the specialised committees
of the Supervisory Board
Two specialised committees assist the Supervisory
Board: (1) the Audit Committee and (2) the Governance,
Nomination and Remuneration Committee. All Supervisory
Board members participate in one of these committees.
The committees function under separate Charters(8).
1.2.1. Audit Committee
Tasks
The Audit Committee’s main role is to oversee fi nancial
matters, internal control and risk management. In this
context and in accordance with its Charter(9), the Audit
Committee examines and reports to the Supervisory Board
on the following matters:
• quarterly fi nancial statements and consolidated accounts;
• business information, asset valuations, off-balance sheet
commitments and the Group’s overall cash position;
• internal management controls, risk control and the
implementation of Company-relevant fi nancial legislation;
• the Company’s fi nancial policy (accounting methods and
developments in the legislation, etc.), fi nance and tax planning;
• the evaluation and/or adoption of the Statutory Auditors’
recommendations;
• the relationship between the Company and its Statutory
Auditors.
Composition
Since April 27, 2011, the Audit Committee consists of
six independent members pursuant to the criteria defi ned
in the Supervisory Board Charter, including the Chairman
of the Audit Committee. All Audit Committee members are
fi nancially literate and, pursuant to French Commercial Code
requirements, at least one member has expertise in fi nancial
administration and accounting for listed companies or other
large companies exposed to IFRS accounting methods.
Typically, the Chairman of the Management Board (CEO), the
Chief Financial Offi cer (CFO) and the Chief Resources Offi cer
(CRO) attend Audit Committee meetings. Other Management
Board members may also attend meetings unless decided
otherwise by the Audit Committee. The Audit Committee may
decide to meet without the Management Board members or
to meet only with the CEO, the CFO or the Statutory Auditors.
The Deputy CFO, the Group’s Director of Consolidation and
Accounting, the Group’s Controller and the Group’s Director
of Internal Audit & Risk Management attend Audit Committee
meetings at the request of the Audit Committee.
Meetings and information
The Audit Committee meets at least on a quarterly
basis and whenever one or more Supervisory Board or
Management Board member(s) requests a meeting. The
Audit Committee meets at least once a year with the
Statutory Auditors without the members of the Management
Board being present. The Audit Committee may solicit the
advice of external advisers as it deems necessary. Members
receive notice convening meetings with an agenda and the
meeting documents at least three days prior to each meeting.
To allow for adequate preparation and consideration, the
Audit Committee usually meets at least 48 hours prior to the
Supervisory Board meeting at which the full year accounts
are reviewed. The Supervisory Board is informed of the
proceedings and recommendations of the Audit Committee
at its meeting directly following that of the Audit Committee.
Summary of Audit Committee activity
The Audit Committee met four times in 2012 (twice in the
presence of the Statutory Auditors). The member attendance
rate was 100%. In 2012, the Audit Committee considered and
reported to the Supervisory Board on:
• the revaluation of net assets, the Company’s fi nancial
statements and consolidated accounts for the 2011 full-
year accounts and the 2012 half-year accounts;
• the quarterly Management Board reports for 2012;
• the funding of the Group’s fi ve-year business plan, fi nancial
resources and borrowing requirements;
• taxation;
• the working terms and conditions of the Statutory Auditors
for the closing of the 2011 annual accounts;
• the organisation of human resources within the fi nance
departments throughout the Group;
• the Company dividend payment policy and the proposal to the
AGM regarding the annual allocation and distribution of profi ts;
• the internal audit charter, risk mapping and the internal
audit reports for 2012;
• the examination of the Company’s exposure to and
management of risks; and
• the annual evaluation of the functioning of the Audit
Committee.
(8) Available on the Company’s website and at its registered offi ce.(9) Ibid.8.

CONSOLIDATED FINANCIAL STATEMENTS
CORPORATE SUSTAINABILITY
BUSINESS REVIEW AND 2012 RESULTS
PORTFOLIO
UNIBAIL-RODAMCO - FINANCIAL REPORT 2012 230 • 231
Audit Committee Remuneration(10)
The annual Audit Committee fees were maintained in 2012
at €20,000 for the Audit Committee Chairman and €10,000
for the other Audit Committee members. An additional fee
of €1,350 per day is paid to members attending a meeting
(or several related meetings) of the Audit Committee and/or
the Supervisory Board held outside of a member’s country of
residence. As of January 2010, 25% of Audit Committee fees
are variable and allocated according to attendance at Audit
Committee meetings.
1.2.2. Governance, Nomination & Remuneration
Committee – GN&RC
Tasks
The GN&RC’s role is to examine all issues falling within its
scope of action under the GN&RC Charter(11) and to advise the
Supervisory Board accordingly. Its tasks specifi cally include
a constant review of the independence of the Supervisory
Board members against the criteria set out in the Supervisory
Board Charter. In relation to governance matters, the
GN&RC assesses the adequacy of the Company’s corporate
governance rules and practices, concerning the Company as
a whole as well as the Management Board, the Supervisory
Board and its committees. It continuously evaluates the
Company’s compliance against these rules. The GN&RC
also monitors the Group’s remuneration policy and related
remuneration arrangements (fi xed income, short-term
incentive, long-term incentive and pension) for Management
Board members and the remuneration and attendance fee
arrangements for Supervisory Board members. In relation
to nomination matters, it develops profi les and screening
criteria for Supervisory Board members and initiates
proposals for the renewal and appointment of Supervisory
Board and Management Board members. It also assesses the
performance of Supervisory Board and Management Board
members on a regular basis.
Composition
Since April 26, 2012, the GN&RC consists of four
members, including the Supervisory Board Chairman, all of
whom are independent pursuant to the criteria defi ned in the
Supervisory Board Charter based on the Afep-Medef Code.
In addition to GN&RC members, the Chief Executive Offi cer
and the Chief Resources Offi cer typically attend GN&RC
meetings. They are absented from matters concerning them,
where appropriate. Other persons may be invited to attend by
the GN&RC Chairman.
Meetings and information
The GN&RC meets at least two times a year and
whenever one or more Supervisory Board or Management
Board member(s) request a meeting. Members receive a
notice convening each meeting with an agenda and the
relevant documentation at least three days before each
meeting. The Supervisory Board is informed of the GN&RC’s
proceedings and recommendations at the meeting directly
following that of the GN&RC.
Summary of GN&RC activity
The Committee met six times in 2012. The member
attendance rate was 100%. In 2012, the GN&RC considered
and reported to the Supervisory Board on:
• Unibail-Rodamco SE’s governance practices compared to
the Afep-Medef Code;
• the annual review of the Supervisory Board’s profi le;
• the annual review of the independence of Supervisory Board
members;
• the expiration of mandates and reappointment of
Supervisory Board members pursuant to the resignation
and rotation rules;
• the remuneration of Management Board members;
• long term incentive arrangements, including the 2012
allocation of stock options to Management Board members;
• the implementation of a Performance Share Plan in the long
term incentive remuneration policy and the 2012 allocation
of performance shares under this plan to Management
Board members;
• the short-term incentive pay-out for Management Board
members for 2011 performance;
• the appointment of Mr Jaap Tonckens, existing Management
Board member, as Chief Financial Offi cer;
• the profi le and composition of the Supervisory Board and
the composition of its committees, including the proposal to
have one new Supervisory Board member appointed by the
Annual General Meeting on April 26, 2012;
• the succession plan of the Supervisory and Management
Boards;
• the report on the Group’s Compliance program;
(10) For full details, refer to the Legal Information section.(11) Available on the Company’s website and at its registered offi ce.

REPORT OF THE CHAIRMAN OF THE SUPERVISORY BOARD
LEGAL INFORMATION
FINANCIAL REPORT 2012 - UNIBAIL-RODAMCO 230 • 231
• the means by which the annual formal Self-Assessment
of the Supervisory Board and the Supervisory Board
Committees are to be performed and the implementation
of such processes;
• the annual evaluation of the GN&RC;
• the amendments to the Management Board Charter; and
• the implementation of the Group Company Savings Plan
for 2012.
GN&RC Remuneration(12)
The annual GN&RC fees in 2012 were maintained at
€10,000 per member (excluding the GN&RC Chairman who
is remunerated separately for his duties as Supervisory Board
and GN&RC Chairman)(13).
An additional fee of €1,350 per day is paid to members
attending a meeting (or several related meetings) of the
GN&RC and/or the Supervisory Board held outside of a
member’s country of residence. As of January 2010, 25% of
the GN&RC committee fee is variable and allocated according
to attendance at GN&RC meetings.
2. REMUNERATION OF THE MANAGEMENT
BOARD MEMBERS(14)
Unibail-Rodamco SE complies with all of the Afep-Medef
recommendations on executive offi cer remuneration as
incorporated into the latest version of the Afep-Medef Code
on December 2008 with the exception of one recommendation
regarding the absence of an annual review of fi xed remuneration
of the CEO(15). Further and going beyond these Afep-Medef
recommendations, none of the Management Board members
have employment contracts, as of the end of 2009.
The Management Board remuneration policy was
developed by the Governance Nomination & Remuneration
Committee prior to the merger of Unibail SA and Rodamco
Europe NV in 2007. It was approved by the Supervisory Board
in June 2007 and has remained unchanged since, with the
exception of the introduction of a Performance Share Plan
as part of the long term incentive remuneration policy which
was approved at the April 26, 2012 AGM. The remuneration
of each Management Board member continues to consist of
4 components: (i) Fixed Income (FI), (ii) Short Term Incentive
(STI), (iii) Long Term Incentive (LTI) comprised of stock
options and performance shares which are both subject to
performance conditions, and (iv) other benefi ts (pension,
company car, insurance, etc.).
3. CORPORATE GOVERNANCE
In accordance with Article L. 225-68 of the French
Commercial Code, Unibail-Rodamco SE hereby states that
it adheres to and enforces the French Afep-Medef corporate
governance code, as published in consolidated form by
Afep-Medef in December 2008 (Afep-Medef Code) and adopts
the Afep-Medef Code as its code of reference for corporate
governance matters. Unibail-Rodamco SE has analysed
its practices and procedures against the Afep-Medef Code.
As at the date of fi ling, the Company complies 100% with
the Afep-Medef Code’s principles with the exception of one
recommendation: the CEO’s Fixed Income is reviewed by the
Supervisory Board on the recommendation of its Governance,
Nomination and Remuneration Committee on an annual
basis pursuant to the overall increase in fi xed salaries on a
like-for-like basis across the Group as of January 1 each year
(for more information, please refer to page 200).
In line with the Group’s commitment to the highest
standards of corporate governance and its activities in The
Netherlands, the Group is also compliant with the vast majority
of the Dutch Corporate Governance Code(16) requirements,
even though the Company is not legally required to comply
with this code.
All shareholders have the right to attend shareholders’
meetings. The terms and conditions of participation in
shareholders meetings are set out in Article 18 of the
Company’s Articles of Association(17). All information pursuant
to Article L. 225-100 of the French Commercial Code that is
likely to have an effect in the event of a takeover, such as the
information specifi ed in Article L. 225-100-3, is included in
the annual report available to shareholders (see page 181).
4. INTERNAL CONTROL SYSTEM
The Unibail-Rodamco Group is active in the commercial
property sector, more specifi cally in the development,
management and regular refurbishment of shopping
centres and offi ces, and the management and organisation
of convention and exhibition venues and associated services.
Apart from general risk factors, the Group’s business is
subject to common exposure and systemic risks including,
in particular, the cyclical nature of the property sector.
(12) For full details, refer to the Legal Information section.(13) Ibid. 12.(14) Ibid. 12.(15) Ibid. 12.(16) As published by the Corporate Governance Code Monitoring Committee in December 2008.(17) Available on the Company’s website and at its registered offi ce.

CONSOLIDATED FINANCIAL STATEMENTS
CORPORATE SUSTAINABILITY
BUSINESS REVIEW AND 2012 RESULTS
PORTFOLIO
UNIBAIL-RODAMCO - FINANCIAL REPORT 2012 232 • 233
The Group’s strategy and policies aim to limit the negative
effects of these risks. However, sudden changes in the
geopolitical, political, social, economic, fi nancial, monetary,
regulatory, health and ecological environment could have a
negative impact on the Group, and result in, amongst other
things, a decrease in asset values, an increase in certain
costs, or investment/divestment operations being delayed or
even abandoned.
“Controllable” risks are identifi ed through a risk mapping
process which focuses on key risks and assesses them on
the basis of probability and magnitude. This risk mapping was
updated and discussed by the Group’s Audit Committee and,
subsequently the Supervisory Board, in April 2012. In addition,
the risk mapping was approved by the Management Board in
May 2012. These “controllable” risks are monitored through
the Group’s internal control system. This system covers all
activities of the Group in all regions, except those where
Unibail-Rodamco is not directly involved in the management,
notably Comexposium and Mfi . This system is based on a set
of principles that aim to provide reasonable assurance that
the following internal control objectives are met:
• transactions are executed effectively and optimised;
• property assets are protected;
• fi nancial information is reliable; and
• all operations comply with prevailing legislation, external
regulations and Unibail-Rodamco’s internal rules.
The Group’s internal control system is in line with the
general principles of the Internal Control System reference
framework drafted by the AMF working group and is based on:
• standardised procedures;
• the accountability of managers in charge of the business,
fi nance and control;
• a committee-based decision-making process for acquisitions,
disposals and refurbishment/construction projects; and
• a segregation of duties between the executive and control
functions.
Unibail-Rodamco SE is run by a Management Board,
composed of four members as at December 31, 2012, which
manages all of the Group’s activities. The Management
Board holds fortnightly meetings as well as ad hoc meetings
whenever required. It acts as the decision-making body for
any issues that, due to their fi nancial signifi cance or strategic
and/or cross-functional nature, require its involvement.
Its main focus areas are set out in the Management Board
Charter, which is available on the Group’s website.
The Group’s control environment includes the Compliance
Book for Governance, Organisation & Corporate Rules
(Compliance Book) which was updated once in 2012 and approved
by the Management Board. The Compliance Book details:
• the Group organisation structure: a matrix organisation with
a double reporting line at corporate and regional levels;
• the governance organisation for Unibail-Rodamco SE and
its subsidiaries;
• a framework of core processes and internal rules covering
investment & divestment, development, leasing activities
and support functions, notably Finance and Human
Resources; and
• a Code of Ethics covering the Group’s core values and rules
of conduct, with particular emphasis on ethical behaviour,
confl icts of interests, confi dentiality of information, and
transactions involving the Group’s shares.
In addition to the Compliance Book, the Group’s control
environment comprises of:
• job descriptions and an appraisal system based on
performance targets for the entire Group;
• a set of delegation of authority and responsibility rules and
limits that span all of the Group’s activities;
• specifi c procedures applicable at the corporate level and in
the different regions where the Group is present; and
• less formal instructions and recommendations that
nevertheless form an integral part of the internal control
system.
A description of the main risks monitored by this internal
control system follows.
4.1. Investment and Divestment Authorisation
Corporate business development or property acquisition
projects are always discussed by the relevant management team.
Any deal opportunity is presented to the Chief Executive Offi cer
and the Chief Financial Offi cer in order to determine whether
the transaction is worth pursuing and investigating. If it is worth
pursuing or investigating, a project manager is appointed.
A legal, fi nancial, technical and commercial review of
these transactions is subsequently presented to an ad hoc
committee comprising of the Chief Executive Offi cer, the
Chief Financial Offi cer, the Group Managing Director of
Development (for property development and re-development),
the Chief Operating Offi cer (for retail operations) and the
relevant Regional Managing Director and regional Investment
teams. This committee approves the value creation strategy,
the assumptions made and the offer price, subject to a more
in-depth audit (data room) and fi nal approval in compliance

REPORT OF THE CHAIRMAN OF THE SUPERVISORY BOARD
LEGAL INFORMATION
FINANCIAL REPORT 2012 - UNIBAIL-RODAMCO 232 • 233
with the Group’s authorisation rules. Various fi nancial models
(e.g. discounted cash fl ows, peer comparisons) are being
used and provide the basis for the committee’s assessment.
During the annual budget review within each region,
a disposal schedule is drawn up for mature properties.
These asset divestments are then prepared and analysed in
detail by the committee referred to above, which verifi es the
assumptions on which the disposal conditions are based.
Unibail-Rodamco’s property assets are valued twice a
year by external experts. This enables the Group to assess
the respective market values and to verify and validate the
internal assumptions that are used to determine the selling
price or rental value of its different properties. Most of the
teams involved in reviewing and managing these transactions
have experience in mergers and acquisitions acquired through
investment banks, law fi rms or other institutions specialising
in such areas of functional expertise. The Group calls upon
external experts, such as lawyers, tax specialists, auditors
and consultants, whenever necessary.
In accordance with the Group’s authorisation rules, any
transaction within the boundaries of the Group’s existing
strategy and/or in European Union member states is subject
to fi nal approval by the Management Board when exceeding
€100 million and is subject to the additional prior approval by
the Supervisory Board when exceeding €500 million.
For transactions outside the Group’s existing strategy and/
or in a country outside European Union member states, the
Management Board’s approval is required and the Supervisory
Board’s approval is required for such transactions exceeding
€25 million.
The Unibail-Rodamco Group has centralised the
documentation and management of legal matters relating to
all of its property assets in Austria, France, Spain, and in The
Netherlands. This centralised organisation makes it easier to
prepare data rooms when properties are being sold and helps
to improve the liquidity of the assets.
4.2. Risks Associated with the Management
of Construction and Refurbishment Projects
Unibail-Rodamco’s construction projects are carried out in
countries where the Group has a locally based team. A minimum
level of pre-leasing is required before launching a retail project
to secure each project from a fi nancial point of view.
Unibail-Rodamco, except in exceptional cases, selects
large, reputable contractors to work on its construction and
refurbishment projects by issuing invitations to tender based
on a set of clear specifi cations. The fi nal choice of contractors
is made once a comparative analysis of written offers has
been carried out. Any discrepancies in relation to the original
budget must be explained and justifi ed.
In addition, Unibail-Rodamco employs construction
experts within its own organisation. They act as project
managers and are responsible for ensuring that:
• the properties built by the Group’s contractors comply with
the design specifi cations;
• construction and renovation costs are kept under control
and remain in line with initial budgets; and
• buildings comply with the Group’s Environmental Quality
Charter and any regulations applicable to owners.
The progress of the works, the budget and internal rate of
return of each project is reviewed on a quarterly basis at Group
level by the Control Department and the Management Board.
This organisation is completed by the Director of Finance of
Unibail-Rodamco Development who is in charge of enhancing
the fi nancial, legal and tax structuring of Unibail-Rodamco
Development projects and optimising Development project
costs, controlling, budgeting and reporting.
To manage environmental risks, the Group has created
an International Environmental Performance Committee and
Regional Environmental Performance Committees, which
work to shape a common environmental performance policy
and monitor the way it is embedded in operating practices. The
Group has been a constituent of the Dow Jones Sustainability
Index since 2008.
Unibail-Rodamco SE publishes each year detailed
corporate sustainability information dealing with the Group’s
environmental and social policy, its targets and achievements.
4.3. Asset protection risks
Unibail-Rodamco is covered by a Group insurance
program that is underwritten by reputable leading insurance
companies. This program is monitored by the Group Insurance
Department in liaison with local teams and insurance brokers.
In addition, Unibail-Rodamco carries out a regular follow-up
of the solvency rating of its insurers.
For property damage and terrorism, most of the Group’s
property assets are insured for their full reconstruction value,
which is regularly assessed by external property insurance
valuers and for business interruption and loss of rents. The
Group has also taken out general liability insurance that
covers fi nancial damages incurred by third parties.
Most construction projects and renovation works on
properties are covered by Contractor’s All Risk policies in all

CONSOLIDATED FINANCIAL STATEMENTS
CORPORATE SUSTAINABILITY
BUSINESS REVIEW AND 2012 RESULTS
PORTFOLIO
UNIBAIL-RODAMCO - FINANCIAL REPORT 2012 234 • 235
regions. Defects affecting the works are covered by Decennial
Insurance in France and by Contractors warranties for works
in other regions (an inherent defect insurance is occasionally
taken out for large projects outside of France).
In addition, Unibail-Rodamco regularly arranges
inspections of technical facilities that could have an impact on
the environment and/or personal safety, such as fi re-fi ghting
equipment, ventilation and air conditioning systems, electric
installations and elevators.
As announced in 2011, a Health and Safety annual risk
assessment was implemented in 2012 for all managed assets
in all regions to mitigate health and safety risks. The risk
assessment is performed by an independent Health &
Safety inspector. This risk assessment provides a single and
comprehensive source of information on the management
of sanitary/environmental risks such as water, air, lead,
asbestos and Legionnaire’s disease.
This organisation is part of the group-wide policy on health
and safety risk management. This policy consists of group-
wide rules and guidelines and is complemented at the local
level by additional procedures mandated by local regulations
and are the responsibility of each Regional Managing Director.
4.4. Risks Associated with Property Leasing
and Ancillary Services
The marketing of assets is handled by dedicated teams
with, in the case of the Offi ce Division, additional support
from leading external brokers. Targets (e.g. prices, deadlines
and prospective tenants) are defi ned within each region in
collaboration with a team at Group level and are presented
to the Management Board for approval. Leases that are
particularly important in terms of value or special terms and
conditions (e.g. price, term, and security) must be approved in
advance at Management Board level by the Chief Operating
Offi cer (for shopping centres) or by the Chief Executive Offi cer
(for offi ces).
The large number of tenants in the Group’s shopping
centre portfolio is varied, and thus minimises the risks
associated in the event of the insolvency of any retailer.
The Group’s principal tenants in its offi ce portfolio are blue-
chip companies. When tenants sign their lease agreements,
most are required to provide fi nancial guarantees, such as a
deposit, fi rst-demand guarantee or surety bond equal to 2-6
months’ rent. The amounts due under the lease agreements
are invoiced by the Group’s property management companies.
In all regions, a set of procedures describes how invoicing
and the recovery of rents and service charges are organised
and monitored. Payments for ancillary services provided by
the Convention and Exhibition division are generally received
in advance, thereby reducing the risk of unpaid debts. Late
payment reminders are systematically issued in respect
of late payments and are monitored by local teams in each
region. These teams decide on the pre-litigation or actual
litigation action to be taken.
4.5. Financial risks
Sensitivity to interest rates, currency movements, liquidity
and counterparty risks is monitored by the Group Treasury
Department in line with the policy defi ned by the Group
Asset & Liability Management Committee (ALM Committee).
This committee has six members, including three members
of the Management Board (the Chief Executive Offi cer, the
Chief Financial Offi cer and the Chief Resources Offi cer).
The groundwork for this committee is prepared by the
Group Treasury Department, which regularly provides each
member with a comprehensive report on the Group’s interest
rate position, liquidity projections, bank covenant positions,
availability under the Group’s committed lines of credit,
proposed (re)fi nancing or hedging operations (if applicable),
the details of any (re)fi nancing operations or transactions
(hedging operations, share buybacks, etc.) completed since
the last ALM Committee meeting, and a report on counterparty
risks. Currency exposure is also reviewed on an ad hoc basis.
The ALM Committee met three times in 2012. Throughout
the year, the members of this committee received regular
updates on signifi cant changes in the fi nancial environment,
especially changes in interest rates, fi nancing conditions,
share prices or trade operations.
The Group’s market trading guidelines for hedging
operations and transactions involving Unibail-Rodamco
shares and its transaction control guidelines are formally set
out ensuring the segregation of duties between execution and
control functions.
In terms of cash management, a European cash
management system is in place in order to optimise the cost
and the use of liquidity across the Group and to enhance the
visibility of cash forecasts. This European cash management
system applies to all regions.
REPORT OF THE CHAIRMAN OF THE SUPERVISORY BOARD
LEGAL INFORMATION
FINANCIAL REPORT 2012 - UNIBAIL-RODAMCO 234 • 235
To reduce the risk of fraud and embezzlement, the
Group has implemented a secure payments procedure and
has formalised the rules for opening, changing and closing
bank accounts.
Unibail-Rodamco must comply with fi scal obligations
resulting from REIT-regimes in the countries where it
operates. These requirements are followed on a quarterly
basis by dedicated specialists within the Finance Department.
4.6. Legal risks
Legal risks are monitored by the Chief Resources
Offi cer, who oversees the deployment of the Group’s legal
philosophy, policies and procedures to protect the Group’s
interests and ensure that Unibail-Rodamco complies with the
regulations that govern its operations. The legal organisation
is composed of a central corporate department and regional
departments which are monitored by the Group Director of
Legal. These departments are charged with protecting the
Group’s interests in contractual matters, drawing up standard
contracts and supervising litigation.
The Group employs lawyers who are specialists in jurisdictions
in which the Group operates and who enlist the support of
external counsel and experts as required. In all regions,
the Group legal department has implemented systematic
information procedures to ensure senior management at Group
and regional levels is informed immediately of any new risks or
of any events likely to alter the assessment of an existing risk.
Every quarter, all local legal departments provide the Chief
Resources Offi cer and the Group Director of Legal with formal
progress reports on the Group’s main outstanding disputes.
There is a centralised procedure for registered mail that is
received at the Group’s French registered offi ce. Every day, a copy
of the fi rst page of these letters is automatically sent to the Chief
Resources Offi cer, the Group Director of Legal and the Group
Director of Internal Audit and Risk Management. An equivalent
procedure has been implemented in all of the regions.
4.7. Information technology (IT) risks
The IT Department of Unibail-Rodamco is in charge of
defi ning the IT strategy and implementing and operating the
shared IT systems for the Group.
Unibail-Rodamco’s information system relies on internally
designed & developed software dedicated to the effi ciency of
assets and leases management;
• software packages from well-known IT companies such as
SAP, SOPRA, CODA, and IGEL; and
• a set of data warehouses/datamarts enabling comprehensive
reporting on all functions with extracting controls to
guarantee data consistency and integrity.
Unibail-Rodamco’s IT risk management approach is
largely based on:
• Security policy: individual passwords are required to access
to computers and applications. In addition, the control of
access right requests ensures the security and integrity of
the Group’s information system;
• Change Management policy: IT development projects
are monitored through dedicated status committees
where planning, costs and key issues are addressed.
IT developments are approved by end users;
• Business Recovery management: the regular and
formalised backup of data is stored off site and ensures
the recovery of the activity in the event of a failure in the
information system. An outsourced data centre ensures
the high availability of the mailing and treasury systems,
being also a backup platform for the IT recovery system.
In addition, the Group Business Recovery Plan (BRP) has
been updated in 2012. This BRP provides a technical and
organizational action plan in case of a major breakdown
(temporary unavailability of Head Offi ces and\or computing
infrastructures).
4.8. Risks associated with the production of fi nancial
and accounting data
Accounting systems can be a source of fi nancial risk,
particularly in the context of end-of-period accounting, the
consolidation of accounts, and accounting for off-balance
sheet obligations.
Accounting processes are handled by local and corporate
teams using multiple information systems. Unibail-Rodamco
uses manuals for accounting procedures and instructions
which describe the segregation of duties between the
accounting execution and the control.
Unibail-Rodamco maintains analytical accounting
reporting on each property, event and exhibition which
enables it to monitor the realisation of its budgets closely.
A common process and reporting template, the Quarterly
Flash Report (QFR), is used. This report consists of a set of
quarterly (or half-yearly) data concerning valuations, pipeline
projects and operational Key Performance Indicators (KPIs),
as well as fi nancial data such as comparisons between actuals
and budget, actuals year by year, and full year forecasts
(Gross Rental Income, Net Rental Income, administrative
expenses, etc.). Reports are prepared and checked at the
regional level before being submitted to the Group Control
and Consolidation departments.

CONSOLIDATED FINANCIAL STATEMENTS
CORPORATE SUSTAINABILITY
BUSINESS REVIEW AND 2012 RESULTS
PORTFOLIO
UNIBAIL-RODAMCO - FINANCIAL REPORT 2012 236 • 237
Regional quarterly reports are double-checked and
challenged by the Group Control Department, which analyses
the KPIs as well as any discrepancies between the budget and
end-of-period actuals or forecasts. Group Control establishes
a Group Quarterly Flash Report which consolidates all Group
KPIs, valuations and pipeline projects. The QFRs are presented
to the Management Board by the country management teams
of each region and the consolidated QFR is provided to the
Audit Committee and the Supervisory Board.
Consolidated fi nancial statements are produced for
the Unibail-Rodamco Group The consolidation process is
centralised and carried out by a dedicated team in the Group
Consolidation department.
When consolidating the accounts, multiple checks are
carried out, of which:
• variations in the controlling shares of subsidiaries and
investments are tracked to ensure an appropriate method
of consolidation;
• consolidated packages received from regions are reconciled
with the QFRs;
• adjustments to consolidated fi gures are analysed and
explained in a report;
• reports from local external auditors are analysed; and
• variation analyses related to budgets and forecasts are
cross checked with Controlling.
Rules for off-balance sheet commitment recordings
have been laid down in specifi c procedures in order to
ensure that each commitment is centrally logged by the
Legal Department. Commitments given and received are
aggregated and brought to the attention of the Management
Board and the Supervisory Board.
Group fi nancial statements are reviewed by the Statutory
Auditors before being presented and explained to the
Management Board, the Audit Committee and, ultimately, to
the Supervisory Board.
The appraisal of the internal control system is carried
out by the Group Internal Audit Department (composed of
4 persons) which conducts regular assignments into all
of the Group’s business units in line with the annual audit
plan approved by the Management Board and the Group
Audit Committee.
Occasionally, the Chief Executive Offi cer or (the Chairman
of) the Audit Committee may ask the Group Internal Audit
Department to carry out one-off “fl ash” assignments in
order to provide a rapid response to urgent issues and/or the
treatment of new risks or problems. Final audit reports are
addressed to the Management Board and to each department
which has been involved in the audit. A summary of audit
fi ndings is sent to the Audit Committee on a quarterly basis.
Unibail-Rodamco’s Internal Audit Charter sets out the
different missions of the audit function. To ensure it remains
genuinely independent, the Internal Audit Department reports
directly to the Chief Executive Offi cer and to the Chairman of
the Audit Committee.
REPORT OF THE CHAIRMAN OF THE SUPERVISORY BOARD
LEGAL INFORMATION
FINANCIAL REPORT 2012 - UNIBAIL-RODAMCO 236 • 237
To the Shareholders,
In our capacity as Statutory Auditors of Unibail-Rodamco and
in accordance with Article L. 225-235 of the French commercial
code (Code de Commerce), we hereby report on the report
prepared by the Chairman of your company in accordance
with Article L. 225-68 of the French Commercial Code (Code de
Commerce) for the year ended December 31, 2012.
It is the Chairman’s responsibility to prepare and submit
for the Supervisory Board’s approval a report on internal
control and risk management procedures implemented by
the company and to provide the other information required
by Article L. 225-68 of the French Commercial Code (Code de
Commerce), particularly in terms of corporate governance.
It is our responsibility to:
• report on any matters as to the information contained in the
Chairman’s report in respect of the internal control and risk
management procedures relating to the preparation and
processing of the accounting and fi nancial information, and
• confi rm that the report also includes the other information
required by Article L. 225-68 of the French Commercial
Code (Code de Commerce). It should be noted that our role
is not to verify the fairness of this other information.
We conducted our work in accordance with professional
standards applicable in France.
Information on internal control and risk management
procedures relating to the preparation and processing
of accounting and fi nancial information
The professional standards require that we perform
the necessary procedures to assess the fairness of the
information provided in the Chairman’s report in respect of
internal control and risk management procedures relating
to the preparation and processing of the accounting and
fi nancial information. These procedures consist mainly in:
• obtaining an understanding of the internal control and
risk management procedures relating to the preparation
and processing of accounting and fi nancial information on
which the information presented in the Chairman’s report is
based and the existing documentation;
• obtaining an understanding of the work involved in
the preparation of this information and of the existing
documentation;
• determining if any material weaknesses in the internal
control procedures relating to the preparation and
processing of accounting and fi nancial information that we
would have noted in the course of our work are properly
disclosed in the Chairman’s report.
On the basis of our work, we have no matters to report
on the information relating to the company’s internal control
and risk management procedures relating to the preparation
and processing of the accounting and fi nancial information
contained in the report prepared by the Chairman of the
Supervisory Board in accordance with Article L. 225-68 of the
French Commercial Code (Code de Commerce).
Other information
We confi rm that the report prepared by the Chairman
of the Supervisory Board also contains other information
required by Article L. 225-68 of the French Commercial Code
(Code de Commerce).
Neuilly-Sur-Seine and Paris-La Défense, March 14, 2013
The Statutory Auditors French Original signed by
Deloitte & Associés Ernst & Young Audit
represented by Damien Leurent
represented by Christian Mouillon & Benoit
Schumacher
This is a free translation into English of the Statutory Auditors’ report issued in French prepared in accordance with Article L.225-235 of French company law on the report prepared by the Chairman of the Supervisory Board on the internal control and risk management procedures relating to the preparation and processing of accounting and fi nancial information issued in French and is provided solely for the convenience of English speaking readers.This report should be read in conjunction and construed in accordance with French law and the relevant professional standards applicable in France.
Statutory auditors’ report, prepared in accordance with article L. 225-235 of the French Commercial Code (code de commerce),
on the report prepared by the Chairman of the Supervisory Board of Unibail-Rodamco
CONSOLIDATED FINANCIAL STATEMENTS
CORPORATE SUSTAINABILITY
BUSINESS REVIEW AND 2012 RESULTS
PORTFOLIO
UNIBAIL-RODAMCO - FINANCIAL REPORT 2012 238 • 239
SCOPE OF INSTRUCTIONS
In accordance with your instructions we have undertaken
valuations of the various freehold and leasehold property
interests as at 31st December 2012 (the “valuation date”)
either held directly by Unibail-Rodamco (the “Company”) or
held in a Joint Venture where the Company holds a share,
as referred to in our valuation reports for each individual
property. This Overview letter has been prepared for inclusion
in the Company’s accounts.
The valuations have been undertaken by our local valuation
teams in each relevant country and have been reviewed by the
Pan European Valuation teams of all three valuation firms.
In arriving at an opinion of Fair Value for each property we
have taken into consideration European wide investment
transaction activity and not solely any investment activity in
the domestic market.
We can also confirm that our opinion of Fair Value has
been reviewed against other valuations conducted across
Europe for consistency of approach and consideration of the
evidence and sentiment in the market place.
The valuations have been based upon the discounted
cash- flow or yield methodologies that are regularly used for
these types of properties.
BASIS OF VALUATION AND ASSUMPTIONS
We set out below the basis and assumptions we have used
in preparing our Valuation.
We confirm that the valuations have been made in
accordance with the appropriate sections of the current
Practice Statements contained within the RICS Valuation -
Professional Standards, March 2012 (the “Red Book”). This is
an internationally accepted basis of valuation. Our valuations
are fully compliant with IFRS accounting standards and IVSC
valuation standards and guidance.
The valuations have been also prepared in accordance
with the AMF recommendations regarding the presentation
of valuation parameters of listed real estate companies,
published February 8, 2010.
We can confirm that we have prepared our valuations
as External Valuers as defined in the Royal Institution of
Chartered Surveyors Valuation Standards and our valuations
have been prepared in accordance with our General Principles.
Our valuations are prepared on the basis of Fair Value and
are reported as gross values (Fair value gross of any deduction
made for typical purchaser costs). We can confi rm that the
Market Value (as defi ned in the RICS Valuation – Professional
Standards, March 2012) of each property is the same as Fair
Value. The IVSB considers the defi nitions of Fair Value in IFRS
to be consistent with Market Value.
DATE OF VALUATION
The effective date of valuation is 31 December 2012.
INFORMATION
We have requested company management to confirm
that the information which it has supplied to us in respect
of the property and its lessees is both comprehensive and
correct in all material aspects. It follows that we have made
an assumption that details of all matters likely to affect
value within their collective knowledge such as operating
expenses, committed capital expenditure, financials including
any doubtful debtors, sales based rental levels, prospective
and signed leasing deals, lease incentives and all rent roll
information and vacant units have been made available to us
and that the information is up to date in all material aspects.
FLOOR AREAS
We have not measured the property and have relied on the
areas which have been supplied to us.
Overview of valuation reports prepared by Unibail-Rodamco’s independant external appraisers

REPORT OF THE CHAIRMAN OF THE SUPERVISORY BOARD
LEGAL INFORMATION
FINANCIAL REPORT 2012 - UNIBAIL-RODAMCO 238 • 239
ENVIRONMENTAL INVESTIGATIONS AND GROUND
CONDITIONS
We were not instructed to carry out a site survey or
environmental assessment nor have we investigated any
historical records, to establish whether any land or premises
are or have been, contaminated. Unless we have been provided
with information to the contrary, we assume that properties
are not, nor are likely to be, affected by land contamination
and that there are no ground conditions which would affect
their present or future use.
PLANNING
We have not seen planning consents and we assume that
properties have been erected and are being occupied and used
in accordance with all necessary consents and that there are
no outstanding statutory notices. We assume that buildings
comply with all statutory and Local Authority requirements
including building, fire and health and safety regulations. We
also assume that any extensions currently under construction
satisfy all planning regulations and all necessary permits are
in place.
TITLE AND TENANCIES
We have relied upon tenancy schedules, summaries of
additional income, non recoverable costs and capital expenditure
and business plans which have been supplied to us.
Our valuations assume that, other than disclosed in our
reports, there is good and marketable title to the properties
and that they are free of any undisclosed burdens, outgoings,
restrictions or charges. We have not read documents of title
and for the purposes of our advice have accepted the details
of tenure, tenancies and all other relevant information, which
have been supplied by the Company.
CONDITION
We have reflected the general condition of the property as
noted during our inspections. We were not instructed to carry
out a structural survey but we have reflected any apparent
wants of repair in our opinion of the value as appropriate.
The property has been valued on the basis of the Company’s
advice except where we have been specifically advised to the
contrary, that no harmful materials have been used in its
construction.
TAXATION
No allowance has been made in our valuations for
expenses of realisation or for any taxation, which may arise in
the event of a disposal. All rental and capital values stated are
exclusive of Valued Added Tax.
CONFIDENTIALITY AND PUBLICATION
Finally and in accordance with our normal practise we
confirm that our valuations are confidential to the party to
whom it is addressed for the specifi c purpose to which they
refer. No responsibility whatsoever is accepted to any third
party and neither the whole of our valuation reports, nor
any part, nor references thereto may be published in any
document, statement or circular, nor in any communication
with third parties without our prior written approval of the
form and context in which it will appear. In signing this
Overview, each appraiser does so on its behalf for its own
valuation work only.
Yours faithfully,
Christian Luft MRICS
Director
For and on behalf of Jones Lang
LaSalle Limited
Bryn Williams MRICS
Director
For and on behalf of DTZ Debenham
Tie Leung Limited
Marc Gerretsen
Partner
For and on behalf of
PricewaterhouseCoopers Corporate
Finance

CONSOLIDATED FINANCIAL STATEMENTS
CORPORATE SUSTAINABILITY
BUSINESS REVIEW AND 2012 RESULTS
PORTFOLIO
UNIBAIL-RODAMCO - FINANCIAL REPORT 2012 240 • 241
Persons responsible for the Registration Document(1)
(Document de Référence)
We confi rm, to the best of our knowledge, after having
taken all reasonable measures that the information contained
in this Registration Document gives an accurate and fair view
of the Company and the information contained within is free
from any material misstatement.
We confi rm, to the best of our knowledge, that the
fi nancial statements have been prepared in accordance with
the applicable accounting and fi nancial reporting standards
and give an accurate and fair view of the fi nancial situation
of the Company and of the entities taken as a whole included
in the scope of consolidation. The Business Review section
presents a fair view of the development and performance
of the business, the results and of the fi nancial situation of
the Company and of the entities taken as a whole included in
the scope of consolidation and describes the main risks and
uncertainties to which they are exposed.
We have obtained from the Statutory Auditors their
end-of-audit letter, which states that they have verifi ed the
information on the fi nancial position of the Company and the
fi nancial statements included in this Registration Document
and have read this Registration Document in its entirety.
The Statutory Auditors have issued a report on the historical
fi nancial information included in the fi nancial section of this
document.
It is reminded that, without qualifying the opinion expressed,
the Statutory Auditors drew the following comment for the
fi nancial year 2010: the attention is drawn to note 1 to the
consolidated fi nancial statements that describes the changes
in accounting methods applied by the Group starting 2010,
and in particular the application of revised IFRS 3 – Business
combinations and revised IAS 27 – Consolidated and separate
fi nancial statements.
Paris, March 19, 2013
On behalf of the Management Board
Guillaume Poitrinal
Chairman of the Management Board of Unibail-Rodamco SE
Jaap Tonckens
Chief Financial Offi cer
(1) The English version is a free translation of the Registration Document and does not include the Statutory accounts of the parent company.
Persons responsible for this document, for the fi nancial information and for auditing the accounts

REPORT OF THE CHAIRMAN OF THE SUPERVISORY BOARD
LEGAL INFORMATION
FINANCIAL REPORT 2012 - UNIBAIL-RODAMCO 240 • 241
Principal Statutory Auditors
Expiry of term of offi ce at the General Meeting (GM) held for
the purpose of closing the 2016 accounts
Ernst & Young Audit
1/2 place des saisons
92400 Courbevoie Paris La Défense 1
Christian Mouillon
Benoît Schumacher
Commencement date of the fi rst term of offi ce:
GM of May 13, 1975
Deloitte et Associés
185 avenue Charles de Gaulle
92200 Neuilly
Damien Leurent
Commencement date of the fi rst term of offi ce:
GM of April 27, 2011
Deputy Statutory Auditors
Expiry of term of offi ce at the General Meeting (GM) held for
the purpose of closing the 2016 accounts
Auditex
1/2 place des saisons
92400 Courbevoie Paris La Défense 1
Commencement date of the fi rst term of offi ce:
GM of April 27, 2011
BEAS
195 avenue Charles de Gaulle
92524 Neuilly-sur-Seine
Commencement date of the fi rst term of offi ce:
GM of April 27, 2011
Documents available to the public
The following documents are available on Unibail-Rodamco’s
website at www.unibail-rodamco.com:
• the registration documents in the form of annual reports, as
well as their updates, which are fi led at the AMF;
• the fi nancial press releases of the Group.
Unibail-Rodamco’s Articles of Association and parent
company accounts may be consulted at the headquarters of
the Company, 7, place du Chancelier Adenauer - 75016 Paris
and on the website www.unibail-rodamco.com or obtained on
demand.

CONSOLIDATED FINANCIAL STATEMENTS
CORPORATE SUSTAINABILITY
BUSINESS REVIEW AND 2012 RESULTS
PORTFOLIO
UNIBAIL-RODAMCO - FINANCIAL REPORT 2012 242 • 243
Concordance table of the registrationTHE TABLE BELOW SETS OUT THE PRINCIPAL CATEGORIES REQUIRED UNDER THE EUROPEAN REGULATION (CE) 809/2004.
Category of appendix 1 of European Regulation (CE) 809/2004Page number
of the registration document
1. Responsible persons
1.1. Persons responsible for the information included in the reference document 240-241
1.2. Declaration of the persons responsible for the reference document 240
2. Statutory auditors of accounts
2.1. Name and address of the statutory auditors 241
2.2. Resignation of the statutory auditors na
3. Selected information
3.1. Historic information 17(1)
3.2. Interim information 17(1)
4. Risk factors 47-48; 162-167; 219-222; 233-236
5. Information on the issuer
5.1. History and evolution of the Company
5.1.1. Corporate name and trade name 179
5.1.2. Registration centre and number 179
5.1.3. Date of incorporation and statutory length of life 179
5.1.4. Head office and legal form 179
5.1.5. Important events 140-145
5.2. Investments
5.2.1. Description of the year’s main investments 22-25
5.2.2. Description of investments in progress 28; 30-33
5.2.3. Description of future investments 30-33
6. Overview of activities
6.1. Main activities
6.1.1. Nature of the operations 18-26
6.1.2. New products or new developments 30-33
6.2. Main markets 42-47(1);
6.3 Exceptional events na
6.4. Possible dependencies na
7. Organisational chart
7.1. Description of the Group 17
7.2. List of significant subsidiaries 134-139
8. Property ownership
8.1. Significant fixed assets 3-14
8.2. Environmental issues possibly influencing the usage of property 51-82
9. Analysis of the financial position and results
9.1. Financial position 116
9.2. Operating profit 115; 128-129
9.2.1. Important elements 18-29
9.2.2. Important changes 18-29
9.2.3. Influencing factors na
10. Cash-flow and share capital
10.1. Share capital of the issuer 118; 191
10.2. Sources and cash-flow amounts 117
(1) Annual and sustainable development report.

REPORT OF THE CHAIRMAN OF THE SUPERVISORY BOARD
LEGAL INFORMATION
FINANCIAL REPORT 2012 - UNIBAIL-RODAMCO 242 • 243
Category of appendix 1 of European Regulation (CE) 809/2004Page number
of the registration document
10.3.Terms of borrowings and financial structure 45-49
10.4. Share capital restrictions that could affect the activities of the issuer na
10.5. Forecast of financial sources 45-49
11. Research and development patent licences na
12. Information on market trends
12.1. Principal trends which impacted production and revenues 18-26
12.2.Trends which may impact future activity 29
13. Forecasts or estimates of profit
13.1. Main assumptions underlying forecasts and estimates 29
13.2. Report of the independent statutory auditors na
13.3. Forecast or estimate of net profit 29
13.4. Forecast of profit included in an existing prospectus 29
14. Supervisory bodies, directors, control and executive management
14.1. Supervisory bodies and directors 193-198; 225-229
14.2. Conflicts of interest regarding supervisory bodies and directors na
15. Remuneration and benefits
15.1. Remuneration paid and benefits in kind 174; 201-215
15.2. Provisioned amounts for pensions, retirements, or other benefits 170-172
16. Functioning of supervisory bodies and directors
16.1. Expiry of current mandates 193-198
16.2. Service contracts linking members of supervisory bodies na
16.3. Information on the Audit Committee and the Remunerations Committee 199; 229-231
16.4. Corporate governance 12(1), 15(1); 199-201; 231
17. Employees
17.1. Number of employees 87-91; 170
17.2. Profit sharing and stock-options 170-174; 184-188
17.3. Agreements for employees to subscribe to the share capital 170-174
18. Main shareholders
18.1. Shareholders holding more than 5% of share capital 192
18.2. Different voting rights 192
18.3. Direct or indirect holding or control of the issuer 192
18.4. Known agreements with the issuer which could engender a change of control na
19. Related party transactions 174
20. Financial information concerning the portfolio, financial position and results
20.1. Background financial information 16-21(1)
20.2. Pro-forma financial information na
20.3. Financial statements 114-175
20.4. Verification of annual historic information
20.4.1. Audit certificate of annual historical information 176-177
20.4.2. Other information reviewed by the statutory auditors na
20.4.3. Sources of information not reviewed by the statutory auditors na
20.5. Dates of previous financial information
20.5.1. Most recent financial year for which the financial information has been audited 176
20.6. Interim financial information
20.6.1. Audited quarterly or half-yearly information na
20.7. Dividend distribution policy na
20.7.1. Amount of dividends per share 29; 190-191
20.8. Court proceedings and disputes 142; 157-158
20.9. Significant changes in financial position or business activity na
21. Supplementary Information
21.1. Company share capital
21.1.1. Subscribed capital 181
21.1.2. Non-representative shares na
21.1.3. Number, book value and nominal value of treasury shares 188-190
21.1.4. Amount of securities giving access to share capital 184-187
(1) Annual and sustainable development report.

CONSOLIDATED FINANCIAL STATEMENTS
CORPORATE SUSTAINABILITY
BUSINESS REVIEW AND 2012 RESULTS
PORTFOLIO
UNIBAIL-RODAMCO - FINANCIAL REPORT 2012 244 • 245
Category of appendix 1 of European Regulation (CE) 809/2004Page number
of the registration document
21.1.5. Information relating to the conditions applying to acquisition of shares issued but not yet paid up na
21.1.6. Information relating to the share capital of group companies subject to options na
21.1.7. Historical information on share capital 118-119; 191
21.2. Applied regulations and articles of association
21.2.1. Corporate purpose 179
21.2.2. Synopsis of the articles of association 179-180
21.2.3. Description of rights and privileges 179-180
21.2.4. Description of actions required to modify shareholders’ rights 179-180
21.2.5. Description of conditions for convening shareholders’ meetings 179
21.2.6. Change-of-control provisions na
21.2.7. Rules defining the thresholds for disclosure of shareholdings 180
21.2.8. Description of conditions governing changes in capital 181-183
22. Important contracts na
23. Information from third parties, expert statements and interest statements na
23.2. Expert statements 238-239
23.3.Third party information na
24. Documents publicly available 179; 241
25. Information on shareholdings 150-151
(1) Annual and sustainable development report.
In application of article 28 of European Regulation 809/2004 on prospectus documents, the following are included for reference
purposes:
• The Business Review and the consolidated accounts for the 2010 financial year prepared in accordance with IFRS accounting
standards, including reports pertaining to statutory auditors, that can be found on page 90-195, lodged at the AMF (Autorité des
Marchés Financiers) no. D.11-0144 on March 17, 2011.
• The Business Review and the consolidated accounts for the 2011 financial year prepared in accordance with IFRS accounting
standards, including reports pertaining to statutory auditors, that can be found on page 92-211, lodged at the AMF (Autorité des
Marchés Financiers) no. D.12-0208 on March 23, 2012.
(1) Excluding statutory accounts of the parent company.(2) Autorité des Marchés Financiers (The French Stock Market Authorities).
This is a free translation into English of the Registration Document(1) issued in French
and filed at the AMF(2) on March 19, 2013 and is provided solely for the convenience
of English-speaking users.
When consulting this document, and in the event of a conflict in interpretation,
reference should be made to the original French version.
This document has been prepared by the issuer under the responsibility of its signatories.

REPORT OF THE CHAIRMAN OF THE SUPERVISORY BOARD
LEGAL INFORMATION
FINANCIAL REPORT 2012 - UNIBAIL-RODAMCO 244 • 245
