unifi aif blend fund september 2021
TRANSCRIPT

1
UNIFI AIF – BLEND Fund
September 2021
Quarterly Review – August 2021
1 Private and Confidential – Circulation to Unit Holders only
UNIFI AIF – BLEND Fund
August 2021
Rethinking Risk
Do complex risk models reflect how humans behave?
Between estimating the fall of Kabul a few days back to the fall of the world’s financial system last year, analysts
have too often put complex risk models ahead of a simpler understanding of what is going on. Complex estimates
of odds create an envelope of confidence/fear. In truth, but mostly in hindsight, they are far removed from reality.
And subjective probabilities that are at the core of such analysis are often irrelevant in the real world.
What makes risk easier to theorize than predict is that it is in a constant state of disequilibrium. As we come off one
of the finest of market cycles, we ask ourselves a few questions:
- Will the outperformance of the small and mid-caps revert to mean?
- Is our current capitalization exposure across small, mid, and large caps optimal?
- Are the new names coming to our portfolio just representative of value or do they also offer the prospects of
growth that will capitalize on unlocking of the value?
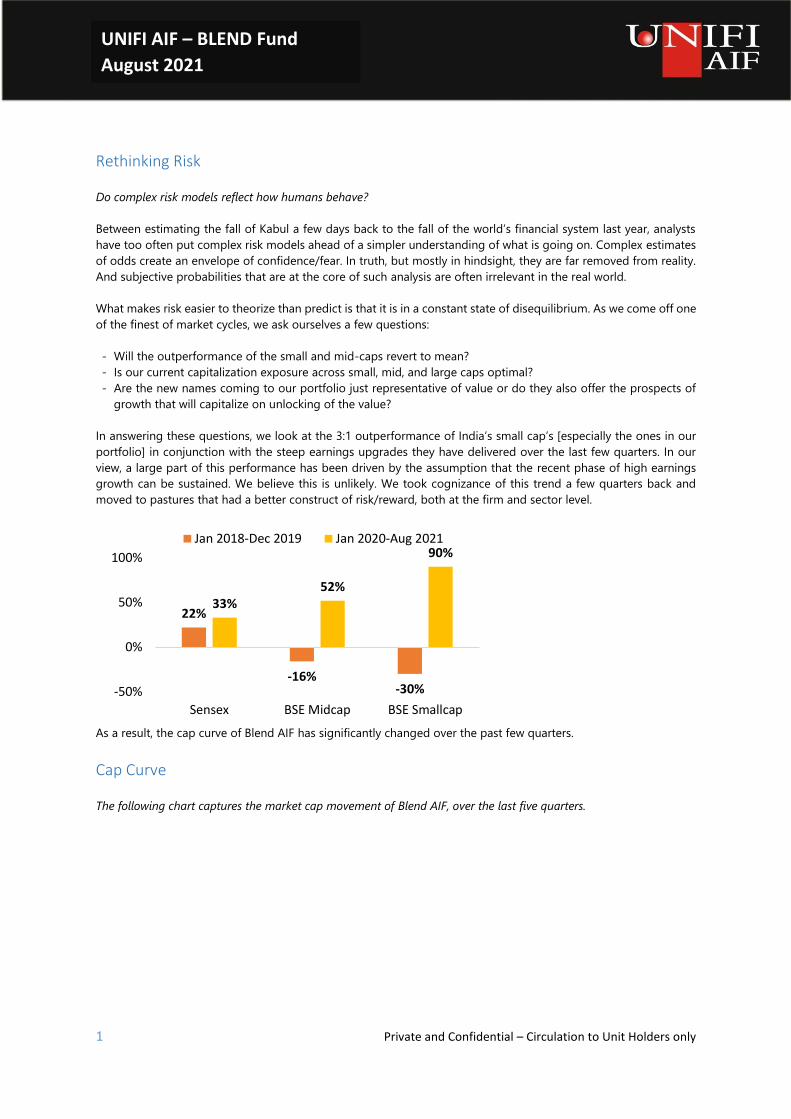
In answering these questions, we look at the 3:1 outperformance of India’s small cap’s [especially the ones in our
portfolio] in conjunction with the steep earnings upgrades they have delivered over the last few quarters. In our
view, a large part of this performance has been driven by the assumption that the recent phase of high earnings
growth can be sustained. We believe this is unlikely. We took cognizance of this trend a few quarters back and
moved to pastures that had a better construct of risk/reward, both at the firm and sector level.
As a result, the cap curve of Blend AIF has significantly changed over the past few quarters.
Cap Curve
The following chart captures the market cap movement of Blend AIF, over the last five quarters.
22%
-16%-30%
33%52%
90%
-50%
0%
50%
100%
Sensex BSE Midcap BSE Smallcap
Jan 2018-Dec 2019 Jan 2020-Aug 2021

2 Private and Confidential – Circulation to Unit Holders only
UNIFI AIF – BLEND Fund
August 2021
While our allocation to larger firms has grown significantly, our framework of seeking value has remained steady.
Given where we are in the cycle today, we see reasonably attractive upside in the larger companies relative to their
performance and valuations. The size of capitalization does not determine our cognitive slant and irrespective of
the cohort we are present in, our quest for value [risk/reward] is steadfast. As you may have already noticed in your
portfolios, stocks that have performed well in the 2020-21 cycle have given way to the new names, and we are now
seeding growth for the next cycle.
Review, Q1 FY-2022
The second wave meant curtailed operating conditions, and as a result, rendered both YoY and QoQ comparisons
unhelpful. However, an absolute reading of the numbers suggests strength in the franchise of the leaders, and
resilient domestic consumption demand. We are comfortable with the earnings salience of our portfolio companies
and what they are doing to seed leadership for the times to come. Our portfolios continue to build concentration
in seeking such leadership.
Corporate India is amid its finest earnings growth cycle witnessed in the last 12 years and our portfolios are
optimized to capture this in the best risk/reward possible. In constructing your portfolios today, we continue to
seek firms with the right to win in the new order.
Deep cloud adoption is critical for staying relevant today. Newer technologies and abundant computing power are
driving a new phase of technology consumption and the industry is in the midst of a multi-year demand cycle today.
At the consumption end of things, from groceries, savings, electronics, and now electricity, India is increasingly
emerging as a digital-first consumer. We are excited about the opportunities in this cohort as the financialization of
savings and the consumption of exchange-traded power break out into new territories. In other select industries [paper,
non-ferrous, building materials, etc] developments in the supply side are driving a very profitable cycle. They fall in a
very comfortable venn of value / growth, explaining their presence in the portfolio today.
The macro’s [rates, inflation, money supply] continue to be what they are – unpredictable. We defer to what Warren
Buffet summarized in a manner only he could: for a piece of information to be desirable, it has to satisfy two criteria;
it has to be important; it has to be knowable. The macros belong to the latter camp and to that extent while do not
seek to predict the unknown, we seek to prepare. Which loops us back to one of reasons why old names have given
way to the newer names, and sectors. And by way of repetition, this doesn’t come in the way of seeking, and
identifying value.
21% 27% 28% 34% 34%
79% 73% 72% 66% 66%
7,172 9,675
18,283
24,506
43,584
-
5,000
10,000
15,000
20,000
25,000
30,000
35,000
40,000
45,000
50,000
0%
20%
40%
60%
80%
100%
120%
Q1 FY21 Q2 FY21 Q3 FY22 Q4 FY21 Q1 FY22
Blend AIF Cap curve
Large Cap Allocation % Small & Mid Cap Allocation % Weighted Average Mcap Rs. Cr

3 Private and Confidential – Circulation to Unit Holders only
UNIFI AIF – BLEND Fund
August 2021
The strategy wise composition of the Blend AIF fund is as below:
The sector wise composition of the Blend AIF fund is as below:
42.4%
24.2%
11.2%
10.2%
10.5% 1.5%
Blend AIF - Theme Allocation
DVD ISF Spin-off BCAD APJ Cash
15.2%
12.9%
11.0%
10.9%
10.4%
8.4%
6.8%
6.6%
4.7%
4.6%
4.6%
2.4%1.5%
Blend AIF - Sector Allocation
Financials Pharmaceuticals Chemical and Fertilizers
IT Technical Textiles Consumer Durables
Fee-based Financials Paper Metals
Automobile Exchange Others
Cash

4 Private and Confidential – Circulation to Unit Holders only
UNIFI AIF – BLEND Fund
August 2021
Q1 FY22 | Result summary The Blend AIF Fund continues to draw from the best opportunities across all of Unifi’s investment themes. The
fund’s holdings are well diversified and poised to benefit from the normalization of the economy post the covid
second wave, with the investee firms consolidating their position and delivering industry-leading growth. Since our
last letter, the fund has taken fresh exposure towards industries such as Metals, Exchanges, and Auto-ancillaries.
At 15%, BFSI constitutes the largest sectoral exposure. The retail-focused institutions, ICICI and Axis Bank seem to
be having lower than anticipated asset quality challenges and are poised to emerge stronger. We also have
exposure to State Bank of India (SBI); we believe that these large banks are at the cusp of the upcycle in terms of
asset quality and credit growth rate would benefit from the revival in the credit.
Pharmaceuticals, at 13%, has the second highest weightage within the portfolio. While Suven Pharma continues to
form a core of our pharma exposure, we have trimmed JB Chemicals on the account of exposure management.
Other major sector exposure included Chemicals and Fertilizers [11%], Information Technology [11%], Technical
Textile [10%] and Consumer Durables [8%]. The underlying investments in each of these sectors have reported
good results in the Q1 FY22.
We have initiated 5% exposure to IEX, India's largest electricity exchange, as we believe it will be at the core of
India's power sector in the years to come as power trading moves to the exchange. We have initiated 5% exposure
to Hindalco based on a broadly constructive macro backdrop over the upcoming years allowing global aluminium
market to move into a strong profitable cycle. Hindalco is well poised to reap the sectoral tailwinds given the
significant forward integration they have achieved through Novelis. We have initiated 5% exposure to Suprajit,
a play on revival of the auto sector. In addition, the company has consolidated wallet share of strong clientele
and launched new products. The company, driven by conservative yet growth-oriented management, has a good
control on working capital and capital efficiency. We have also initiated exposure to GSFC, a Gujarat state PSU
company with a strong balance sheet and favourable business cycle.
To fund these purchases, we exited KEC and Cadila. Further, we trimmed Garware, JB Chem and Sheela foam aligned
with Unifi’s philosophy of constructing the portfolio with a favorable risk-reward equation.
The following annexure presents a brief on our top holdings:
Garware Tech Garware delivered revenue growth of 60% YoY and decline of 28% QoQ to Rs. 243cr. EBITDA and Operating PBT registered decline of 39% and 44% QoQ to Rs. 43cr and Rs. 35cr respectively. Domestic business growth has lagged the export business growth this quarter as the second wave has impacted the application segments severely. With raw material cost inflation pass through this quarter, Gross margin recovered 10% sequentially. EBITDA growth was affected by negative operating leverage. We remain positive on Garware given the company's focus towards value added products (which now forms 70% of overall business), its leadership position in technical textile segment, its relationship with international clientele built over the past decades and strong balance sheet with cash of Rs. 550cr. The company continues to win new patents and launch new products, which we believe will drive growth and profitability. Key risks: Decline in the prices of Salmon, sharp increase in raw material price and failure of newer products to garner higher market share.
ICICI Securities ICICI Securities delivered a good quarter, with the broking segment growing by 11% YoY to Rs.395cr despite the covid related challenges. The company surprised positively with strong client additions at 389,000 clients, primarily through the digital channel. The distribution revenue was up 58% YoY led by improvement in both mutual fund and non-mutual fund revenues. Several new initiatives such as open architecture to onboard

5 Private and Confidential – Circulation to Unit Holders only
UNIFI AIF – BLEND Fund
August 2021
different insurance partners and sell through channels beyond ICICI Bank continue to be on track. On the back of robust revenue growth and measured operating expenses, PBT was up 61% YoY at Rs.417cr., and PAT was up by 61% YoY at Rs.311cr. I-Sec is a leading tech-based securities player offering a range of financial services including brokerage, financial products distribution, and investment banking, with focus on both retail and institutional clients. As of June 2021, the proprietary electronic brokerage platform ICICI Direct had approx. 5.8 Mn operational accounts of whom about 2.2 Mn had traded on NSE in last 12 months. I-Sec is also the second largest non-bank MF distributor with an AUM of Rs.440 Bn. We like the business due to its absolute technology leadership, continuing consolidation of user base, high RoE of more than 50%+ and access to ICICI Bank’s franchise for customer acquisition. Key risks would arise from a prolonged downcycle in equity markets leading to lower turnover, and heightened competition leading to loss of market share.
JK Paper Given the lockdown induced operating environment, JK Paper reported revenue decline
of just 26% QoQ to Rs.661cr, supported by volume recovery and better realizations. Realizations improved by 13% QoQ leading to better EBITDA margins sequentially. As a result, EBITDA decline was lower at 17% QoQ to 190cr. The company continued to perform well and there is turnaround in the business at its subsidiary- Sirpur Paper Mills. Overall, PAT came at Rs.104cr compared to Rs. 136cr in Q4FY21 and Rs.3cr in the previous year. JK Paper is play on revival on domestic paper consumption driven by reopening of offices and educational institutions. Further the company is increasing its capacity from 4.36 lakh tonne to 7.42 lakh tonne driven by green field packaging board expansion in Gujarat with capacity of 1.7 lakh tonne and addition of 1.36 lakh tonne from inorganic acquisition of Sirpur paper mills. The medium-term earnings growth would be driven by volume increase, cost optimization and better realization. Key risks would be delay in capacity addition, decline in realization and extended impact of COVID-19.
Suven Pharma Suven Pharma reported revenue growth of 8% YoY to Rs. 264cr. The revenue growth was broad-based with CDMO Pharma and US formulation business growing at 11% and 113% respectively on a YoY basis. CDMO specialty chemicals declined by 24% YoY and is expected to recover in H2 FY22. US Formulation business is gaining traction gradually. Gross margins have recovered 5.5% sequentially with gradual raw material cost inflation pass through and a better product-mix. EBITDA and Standalone PBT were up 2% and 1% respectively on a YoY basis. Rising Pharma's [Associate] profit contribution has moved up from Rs. 10cr to Rs. 24cr YoY leading to consolidated PAT growth of 14% YoY to Rs. 105cr. Suven currently has seven commercially launched Pharma intermediates and specialty chemicals and is looking to add one more in FY 2022. In addition, the company has 6 phase-3 candidates where at least one could see a commercial launch in the next 12-18 months and 2-3 launches over the next 24-36 months. Suven has also diversified into formulations by building appropriate capacities and obtained USFDA approvals. Company had launched 4 ANDAs (formulation drugs) in FY21. It also targets to launch 4-5 ANDAs every year over the next 5 years. The company has filed 13 ANDAs till the end of Q1 FY22 and targets to file more 5-6 in the current financial year. The pace of additions to research projects has seen slowdown due to the second wave. The performance of

6 Private and Confidential – Circulation to Unit Holders only
UNIFI AIF – BLEND Fund
August 2021
Suven’s associate Rising Pharma (USA) is progressing well and opportunities for commercial contracts could arise in the future from them. Key risks - Management bandwidth (COO hiring delayed), slow acceptance of products in US formulation business and low traction in research activities due to covid are the key concerns.
Wipro Wipro delivered YoY Revenue/EBIT/PAT growth of 22%/ 30%/34% to Rs. 18,467 / 3,356 / 3,238cr. The organic growth of 4.9% QoQ was one of the highest in past many years. EBIT margins were lower by 100 bps QoQ at 17.2% due to the acquisition made earlier this year. The margins should rise going forward supported by tailwinds from efficiencies, offshoring and currency benefits. Except manufacturing, all other industry segments posted healthy growth of 2.6-22.4% QoQ in CC terms. For the quarter, PAT came in at Rs.3,238cr (34% YoY). Wipro’s focus on driving consistency in deal wins, sales growth and margin prospects is improving. Key risks: It is important to note that product sales cycles are binary in nature and conventional metrics of earnings over the short term is not the right measure of performance.
ICICI Bank ICICI Bank reported NII growth of 18% YoY and 5% QoQ at Rs.10,936cr, while the non-interest income was down 10% sequentially due to lower disbursements. Company's cost to income ratio fell to 40% from 41% in Q4 FY21, on the back of lower business volumes. Overall, operating profit was higher by 23% YoY at Rs.8,605cr. Advances were up 17% YoY & 1% QoQ at 7.4Tn with retail forming 62% of the same. The bank continues to enjoy a strong customer franchise with a CASA ratio of 44%, one of the highest in the banking industry. The stress in the corporate book has already been adequately provided for and the listed status of its subsidiaries has provided good liquidity window to the bank enabling higher provisions. The Bank is likely to manage its overdue and restructured book well in the coming cycle given its collection management standards. Key risks would include deterioration of asset quality, higher than expected credit costs and decline in NIMs due to falling yields
Axis Bank Axis Bank reported NII growth of 11% YoY and 3% QoQ to Rs.7,760cr on the back of healthy loan book growth and stable NIMs. Advances grew by 12% YoY to Rs.6.14Trillion with retail advances formed 54% of the same. Operating profit increased 10% YoY Rs.6,416cr. On the back of lower provisions [down by 20% YoY at Rs.3,532cr.], PAT was up 94% YoY at Rs.2,160cr. The bank's asset quality had slightly deteriorated with GNPA and NNPA at 4.22% and 1.28% respectively. The slippages were at 1.1% of the book, of which majority came from secured retail book, which is a comforting. The bank surprised positively on the restructured accounts, which was low at 0.3% of the loan book and have been adequately provided for at 23%. With an additional COVID-provision buffer of Rs.5,012cr, the bank is in a comfortable position to take care of any incremental stress in asset quality and get back to normalcy from FY22 onwards. Given the low cost of deposits and access to capital, the bank is expected to deliver on all parameters from the forthcoming year, and eventually migrate to higher double-digit ROEs. Key risks would include deterioration of asset quality in the covid second wave leading to higher-than-expected credit costs and decline in NIMs due to falling yields.

7 Private and Confidential – Circulation to Unit Holders only
UNIFI AIF – BLEND Fund
August 2021
CG Consumer Crompton Greaves Consumer reported revenue growth of 46% YoY to Rs.1,050cr. Both the segments, Lighting (up 34% YoY) and Consumer durables (up 48% YoY), delivered ahead of industry growth led by consolidation of the larger players. In each of the key product segments [Fans (63% YoY), Lighting, Pumps, and other Electric Appliances (99%YoY)], the company delivered ahead of industry growth rates, on the back of product innovation, premiumization and market reach initiatives. The company was able to mitigate commodity inflation through price hikes, product mix improvement and aggressive cost reduction. As a result, Gross margins expanded sequentially to 32% from 31% QoQ. We expect this trend to continue, along with headline growth that is ahead of the industry. EBITDA had grown by 24% YoY to Rs. 125cr as company increased the advertisement expenditure. PAT increased by 27% YoY to Rs. 95cr. Crompton is amongst India’s most profitable players in the consumer durables space with best-in-class growth, margins, and capital efficiency. We continue to like the company as we expect it to benefit from this phase of consolidation. Key risks to the investment could emanate from drop in consumer sentiment, and steep inflation in raw materials.
Tata Communication
Tata Comm's Q1FY22 revenues were flattish at Rs. 4,102cr (up 1% QoQ), led by 5.5% growth in the Voice business, while Data revenue was flat. Usage-based revenues were impacted by the lockdowns affecting collaboration traffic in the data segments. EBITDA declined 3% QoQ to Rs. 986cr, primarily due to the impact of Rs. 33cr worth of provisions on account of an 8% license fee. EBITDA margin contracted 90bps to 24%. Normalized for the provision impact, EBITDA would have been flat QoQ at Rs. 102cr. Tata Comm's PAT was at Rs. 296cr (-1% QoQ), whereas PAT adj for exceptional items stood at Rs. 290cr (down 3% QoQ). Data revenue/EBITDA remained flat sequentially at Rs. 3,104cr/ Rs. 931cr, with margins at 30%. Revenue was lower QoQ due to moderation in collaboration traffic, which had peaked in Q1FY21. Adjusted for provisions towards the newly implemented 8% license fee on ISP revenues, EBITDA was up 4% QoQ. Within Data, revenue/EBITDA for Core Connectivity (the Traditional segment) declined 2% QoQ to Rs. 2,230cr/Rs. 951cr. The EBITDA margin remained flat at 42.6%. Digital Platform & Services (the Growth segment) – which contributes just 8% to EBITDA – saw 3%/34% revenue/EBITDA growth to Rs. 836cr/Rs. 75cr. The EBITDA margin partly recovered 210bp to 9% (peak of 14–15% in 2Q/3QFY21). The deal funnel has improved and is expected to drive revenue. Besides competing for large transformation deals the company is also focusing on smaller margin neutral deals which should aid growth. As Covid retreats the company also expects to see traction in its growth segments including international travel (global SIM), IoT, live streaming of sports events etc. The capex guidance for FY22 stood at USD250mn driven by new orders, maintenance capex (2% of revenue), and strategic capex. It may spend higher to tap growth opportunities. Key risks would be slower to negative growth in the data segment on account of covid related stress and lower usage of Tata Comm's services e.g., data streaming of live sports or reduced international travel or delays in deal conversion or new technologies come in to replace fiber at reasonable cost.
Hindalco Hindalco reported revenues of Rs. 41,358cr (up 64% YoY and 2% QoQ) and EBIDTA of Rs. 6,790cr (up 187% YoY and 16% QoQ). PAT (continuing ops) for Q1 FY22 was at Rs. 3,254cr (up 67% QoQ) as against a loss in Q1 FY21. Novelis reported shipments of 973kT in Q1

8 Private and Confidential – Circulation to Unit Holders only
UNIFI AIF – BLEND Fund
August 2021
FY22 (up 22% yoy). Sales in Q1 FY22 were at USD 3.9Bn (up 59% YoY) and were driven by increased shipments, improved product mix and higher aluminium prices. EBIDTA was USD 555Mn for Q1 FY22, up 119% YoY. This included a USD 47 Mn gain related to Brazilian tax litigation. Adjusted EBIDTA per ton in Q1 FY22 was USD 570/ton up 75% YoY. Excluding the litigation, it is USD 522/ton (still at an all-time high). In the domestic operations Aluminium metal production in Q1 FY22 (319KT) was almost in line with previous quarter and up 9% YoY, Aluminium VAP (value added) production at 86KT higher 150% YoY in Q1 FY22. Domestic sales were 44% of total metal sales (vs 20% in Q1 FY21) while VAP sales 27% of total metals sales (vs 11% in Q1 FY21). AL India Q1 FY22 EBIDTA was a record Rs. 2,352cr up 142% YoY. EBIDTA margins were a record 37.5% vs 27% in Q4FY21. EBIDTA/ton in Q1 FY21 was about USD 990. For reference EBIDTA/t in Q4 was USD 660. FY21 EBIDTA/t was USD 518/t (and USD 399 in FY20). In the domestic copper business Q1 FY22 revenues were Rs. 7,094cr (up 134% YoY) on account of higher copper prices. Q1 FY22 EBIDTA was Rs. 261cr (as against Rs. 66cr in Q1FY21) Consolidated net debt increased to Rs. 51,913cr in Q1 FY22 from Rs. 47,419cr in Q4FY21 due to build-up of working capital led by higher metal prices. Leverage declined from 3.83X in Q1 FY21 to 2.36X in Q1 FY22. Standalone net debt stands at Rs. 11,100cr. Management expects demand for commodities like aluminium and copper to remain strong in CY21 on the back of stimulus driven economic recovery and expects commodities prices to sustain at current levels. It expects aluminium prices to sustain at higher levels due to supply side measures taken in China. Domestic aluminium/copper demand was impacted due to COVID in Q1 FY22, however, expected to improve in coming quarters. The company would focus management bandwidth on downstream VAP products rather than expanding upstream despite LME AL prices being elevated. Board has approved 170ktpa of FRP (Flat rolled products) capacity at Hirakud and Aditya at INR3000cr investment. Project is expected to be commissioned by FY25. Capex plan for India is about Rs. 2,700cr in the current financial year (last year capex was Rs1600cr). Key risks would a steep decline in LME AL prices, increase in used beverage can prices (leading to increased costs at Novelis) and continued chip shortage impacting auto volumes for Novelis.
Suprajit Suprajit reported revenue growth of 104% YoY and decline of 30% QoQ to Rs.362cr. The company maintained consistent performance in non-auto cables through its subsidiary - Wescon Controls in the US. In the domestic cables division, revenues were down 36% sequentially due to lower OE volumes which was impacted by global chip shortages, shipment delays and shutdown in operations. Despite these disruptions, the company was able to maintain margins in this segment, which was a positive surprise. Overall, PAT came at Rs.27cr compared to Rs.57cr in Q4FY21. Suprajit is a leading player in auto cables with 65% market share in 2-wheeler market and 35% market share in domestic auto (other than 2-wheler). In the last decade, the company has outperformed the auto industry by 5-10% and diversified its product portfolio to non-auto cables and halogen lamps through acquisitions. We remain positive on the revival in the auto sector and vendor consolidation resulting in higher market share for larger players. Key Risk: Raw material price inflation, shipment delays and supply chain challenges for OE vendors.
IEX IEX delivered revenue growth of 34%YoY on the back of strong volume growth across products to Rs.91cr. DAM and TAM volumes were up 7% and 60% YoY respectively. RTM, launched in June-20, formed 22% of volumes in Q1 FY22 growing at more than 22% on a

9 Private and Confidential – Circulation to Unit Holders only
UNIFI AIF – BLEND Fund
August 2021
sequential basis. EBITDA and PAT registered a growth of 56% YoY and 49% YoY to Rs.75cr and Rs.62cr respectively on the account of favourable operating leverage. IEX is India's largest electricity exchange, and we believe it will be at the core of India's Power sector in the times to come as SEB's move to consuming power from the exchanges vs bilateral contracts. The company has introduced many products such as Real-Time, Green Term Ahead Market, Cross Border Contracts and Gas Exchange over the last one year, which has helped the company in gaining market share from other short-term market players. In addition, the company plans to launch long duration contracts in this financial year. With the government's commitment towards power sector reforms to reduce the role of DISCOMs and optimize the cost of energy, IEX is likely to see a multi-year encouraging growth. Key risk: Unexpected regulatory environment and slowdown in industrial activity.

10 Private and Confidential – Circulation to Unit Holders only
UNIFI AIF – BLEND Fund
August 2021
Key Portfolio Metrics It is important to note that each investment in the fund has been made on its own merit and the portfolio characteristics are merely a by-product of the process. In sync with Unifi’s philosophy, the aggregate portfolio has low leverage, demonstrates potential for strong earning’s growth, and has reasonable valuations.
Valuation Parameters* (As on 30th Aug 2021)
FY2021 FY2022E
P/E Ratio 33.3 24.6
Earnings Growth 31.1% 47.6%
Debt Equity Ratio 0.08 0.07
ROE % 22.2% 24.5%
PE/ Growth Ratio 1.0 0.5
*Adjusted for one-off to make figures representative.
We are continually monitoring the environment for any opportunities that have potential to materially improve the portfolio composition. We will be writing to you again post the Q2FY22 results. In closing, we encourage you to write to us, or your relationship manager for a detailed review of the portfolio and understanding of our proposition in greater granularity. With best wishes, K. Sarath Reddy | Founder & CIO
218
170
60
80
100
120
140
160
180
200
220
Ince
pti
on
Fe
b'1
9
Mar
'19
Ap
r'1
9
May
'19
Ju
ne'
19
Ju
ly'1
9
Au
g'1
9
Se
p'1
9
Oct
'19
No
v'1
9
Dec
'19
Jan
'20
Fe
b'2
0
Mar
'20
Ap
r'2
0
May
'20
Ju
ne'
20
Ju
l'20
Au
g'2
0
Se
p'2
0
Oct
'20
No
v'2
0
Dec
'20
Jan
'21
Fe
b'2
1
Mar
'21
Ap
ril'2
1
May
'21
Ju
ne'
21
Ju
ly'2
1
Au
g'2
1
BLEND AIF Performance [As of 30-Aug-21]
Blend AIF NAV Midcap index

11 Private and Confidential – Circulation to Unit Holders only
UNIFI AIF – BLEND Fund
August 2021
Annexures: Financial Details of Portfolio Companies
BLEND AIF Market
Cap (Rs. cr) PBT (Rs.cr)
YoY (%) PAT (Rs. Cr) P/E ROE
Portfolio Weight
Company 30th Aug
2021 Q1 FY21 Q1 FY22 FY 21 FY 22E
FY 22E
FY 22E
Garware Tech 6,498 23 41 78.0% 158 200 32 23% 10.4%
ICICI Sec 23,317 259 417 61.0% 1,068 1,292 18 82% 6.8%
JK Paper 4,169 13 148 NA 240 450 9 17% 6.6%
Suven Pharma 13,734 118 133 13.0% 363 402 34 26% 6.1%
Wipro 3,45,302 3,095 3,860 25.0% 10,868 12,702 27 22% 6.0%
ICICI Bank 4,97,437 4,587 6,679 46.0% 16,193 21,710 23 14% 5.6%
Axis Bank 2,40,589 1,428 2,884 102.0% 6,588 14,142 17 13% 5.2%
CG Consumer 29,843 99 125 26.0% 541 645 46 30% 5.1%
Tata Comm 40,906 340 377 11.0% 1,251 1,481 28 NA 4.9%
Hindalco 1,01,937 -740 4,086 NA 4,815 10,746 9 8% 4.7%
Suprajit 4,523 -18 37 NA 143 179 25 17% 4.6%
IEX 15,204 57 83 46.0% 205 284 54 47% 4.6%
CLASSIFICATION OF MARKET CAP LIQUIDITY ANALYSIS
Segment Basis %
Large Cap > Rs. 37,750cr 33.0%
Mid Cap > Rs. 11,800 cr < Rs. 37,750 cr 30.5%
Small Cap < Rs. 11,800 cr 35.0%
Cash 1.5%
Total 100%
Risk Management
Risk Mitigants
Coronavirus
Impact
The impact from the ongoing Coronavirus outbreak in India and rest of the World can be
multifold. The lockdown related slowdown in consumption can affect several sectors. How
long it takes for sentiment to return in consumption remains to be seen. Our investee
companies have product & category leadership along the financial wherewithal to
withstand temporary phases of demand slowdown and lead consolidation of demand. The
BFSI sector could have heightened stressed assets for a certain period of time thereby
impacting their profitability.
Geo-political
risks
Any geopolitical tensions between India and neighbouring countries can disrupt supply
chain in the region. This might have a non-linear impact on business.
Raw material
inflation
India continues to be dependent on the supply of feedstock whose pricing is global in
nature. Key categories would be crude, metals, minerals, and natural commodities. Sharp
movement in their underlying prices will have a short-term financial impact on the
Segment % of portfolio
1 day 42.6%
Between 1 & 3 days 18.3%
Between 3 & 7 days 9.5%
Greater than 7 days 28.0%
Total 98.5%

12 Private and Confidential – Circulation to Unit Holders only
UNIFI AIF – BLEND Fund
August 2021
companies. The situation in China (Corona Virus, and political) has the potential to disrupt
the supply chain of a few of our investee companies.
Liquidity risk (in
case of NBFCs)
The NBFC led liquidity crisis in India has had a systemic effect on the entire economy. Our
investee companies have been able to tap diversified sources of liquidity on the back of
their long-term track record of comfortable asset quality and asset-liability-management
(ALM). However, sustained deterioration of the asset quality can continue to affect our
holdings in Banks and NBFCs.
Foreign Exchange
risk
The foreign exchange system continues to be guided by global developments spanning
Brexit, US-China trade war, OPEC related developments, and other geo-political issues. Our
investee companies in the IT sector are subject to sharp movements in the USD and GBP.
They mitigate the same via hedging, but there remains a portion of revenues that continue
to be subject to the vagaries in fx movements. Most of our non-IT exposure is to companies
that derive their revenues from the domestic market. The revenue from exports would be
minimal for each strategy as a whole, and where relevant, are adequately hedged. A sharp
depreciation in the INR will affect the import of feedstock (higher prices) which can lead to
a brief moment of earnings-related volatility.
Leverage risk Except for financial companies, most of the operating companies in the strategies carry nil
to moderate debt on their balance sheets with a track record of having managed leverage
well in the past. Their leverage is monitored regularly.
Technology
Obsolescence
Technological changes can render the products/services of a company obsolete and
thereby hurt its profitability and valuation. Such a risk is generally minimized by limiting the
aggregate exposure of portfolio to such investments to less than 10% of value.
Governance risk We avoid investing in companies with a known history of corporate governance issues.
Further, in case such issue arises in an existing investment, we stop additional purchases
and start optimally exiting the investment.
Concentration
risk
At the portfolio level, such risks are minimized by limiting the aggregate exposure of
portfolio to such investments to less than 10% of value at the time of investment.
Stock Illiquidity
risk
High Impact cost, due to thin trading at the time of buying or selling is endemic to small &
mid-caps. We plan our investment decisions, size of the investment and trading strategies
to minimize the costs due to illiquidity.
Key Man Risk Small and mid-caps are frequently managed by a key promoter / person on whom the
business is completely reliant and without whom the business would be materially inferior.
We generally avoid such names and in cases where we make any exceptions, the
aggregate exposure of portfolio to such investments is limited to less than 10% by value.
Slowdown in
global
consumption
The wallet-share of the investee companies in the global manufacturing value chain, does
not pose a significant risk of loss of business to their vendors. New and high growth areas
such as Lithium-Ion batteries, EV vehicles are in relative infancy stage and have a strong
growth curve ahead of them.
Softness in IT
product spends
The convergence to digital software solutions is a ‘must do’ proposition and our investee
companies have exhibited significant traction in competing in this space. A combination of
their recent deal wins, and current bid pipelines bode well for their future.