unified and non-parameterized statistical modeling of
TRANSCRIPT

Unified and Non-parameterized Statistical Modelingof Temporal and Spatial Traffic Heterogeneity
in Wireless Cellular NetworksMeisam Mirahsan, Ziyang Wang, Rainer Schoenen, Halim Yanikomeroglu, Marc St-Hilaire
Abstract—Understanding and solving performance-related is-sues of current and future (5G+) networks requires the avail-ability of realistic, yet simple and manageable, traffic modelswhich capture and regenerate various properties of real trafficwith sufficient accuracy and minimum number of parameters.Traffic in wireless cellular networks must be modeled in thespace domain as well as the time domain. Modeling traffic in thetime domain has been investigated well. However, for modelingthe User Equipment (UE) distribution in the space domain, eitherthe unrealistic uniform Poisson model, or some non-adjustablemodel, or specifc data from operators, is commonly used. In thispaper, stochastic geometry is used to explain the similarities oftraffic modeling in the time domain and the space domain. Itis shown that traffic modeling in the time domain is a specialone-dimensional case of traffic modeling in the space domain.Unified and non-parameterized metrics for characterizing theheterogeneity of traffic in the time domain and the space domainare proposed and their equivalence to the inter-arrival time,a well accepted metric in the time domain, is demonstrated.Coefficient of Variation (CoV), the normalized second-orderstatistic, is suggested as an appropriate statistical property oftraffic to be measured. Simulation results show that the proposedmetrics capture the properties of traffic more accurately than theexisting metrics. Finally, the performance of LTE networks undermodeled traffic using the new metrics is illustrated.
Index Terms—Traffic Modeling, Stochastic Geometry, PointProcess, Voronoi Tessellation, Wireless Cellular Network.
I. INTRODUCTION
The statistics of Signal-to-Interference-plus-Noise Ratio(SINR) are the key to the performance of wireless cellu-lar networks. The signal strengths and interference dependstrongly on the network geometry, i.e., the relative positionsof the transmitters and the receivers. So, in wireless cellularnetworks, spatial properties of traffic as well as temporal prop-erties of traffic have direct effects on network performance.Modeling traffic in the time domain has been investigatedwell in the literature [1–3]. In the space domain, on the otherhand, the unrealistic uniform Poisson modeling based on IMT-Advanced evaluation guidelines [4], non-adjustable models, ortraced data from specific service providers are commonly used.
M. Mirahsan, Z. Wang, R. Schoenen, H. Yanikomeroglu and M. St-Hilaire are with the Department of Systems and Computer Engineering,Carleton University, Ottawa, ON, Canada (e-mail: {mirahsan, wangzi, rs,halim}@sce.carleton.ca, marc st [email protected]).
This work is supported in part by Huawei Canada Co., Ltd., and in partby the Ontario Ministry of Economic Development and Innovations ORF-RE(Ontario Research Fund - Research Excellence) program.
Real UE distributions appear due to various reasons, butthey are never pure Poisson point processes. Studying UEdistributions of more extreme characteristics and their impacton performance is thus an important issue. Heterogeneousscenarios in space have been studied recently [5], but mainlyfocusing on the Base Station (BS) or small cell deployment,not on the UE statistics. The requirement is a continuouslyscalable model from zero heterogeneity (lattice) to extremecases (e.g., clustering).
Unlike existing models which require many parameters tospecify and thus lead to scientific work being incompara-ble, in this paper we come up with just two parametersto sufficiently describe a heterogeneous scenario. First, theuser density (homogeneous component). Second, the CoV ofinter-point distance metrics for specifying the deviations fromhomogeneity. This turns out to be the equivalent of the CoVin temporal traffic, known from traffic and queueing theory.
With these first and second order statistics, we are ableto specify scenarios which are then analyzed in a wirelesscontext. In order to get there, we propose a mapping andnormalization procedure, which allows existing methods forpoint process generation to be used, but hide their complexityso that only the CoV is required as parameter.
Figure 1 shows the traffic modeling procedure used inthis paper. Modeling traffic comprises of two main steps: 1)Generating a traffic pattern, and 2) Capturing and inferenceof the statistical properties of a given pattern. Different trafficgenerators receive different input parameters. So, a translationof the Traffic Generator Input Parameters (TGIP) to the desiredtraffic properties is essential. For statistical inference of traffic,two questions should be answered: a) what is the right metricto analyze? In the time domain, inter-arrival time is a wellaccepted and commonly used metric. In the space domain, onthe other hand, the equivalent of this metric doesn’t exist inthe literature. In this paper, equivalents of inter-arrival time inthe space domain are introduced. b) Which statistics of thechosen metric are to be characterized? First-order statisticslike the mean, and infinite-order statistics like probabilitydensity function can be considered. We suggest CoV (C),the normalized second-order statistic, defined as the ratio ofstandard deviation to mean, which is easy to calculate andat the same time appears to be sufficient to capture the maincharacteristics (heterogeneity) of the traffic.
The main contributions of this paper are as follows: 1)Stochastic geometry as a common tool is used to explain
ICC'14 - W8: Workshop on 5G Technologies
978-1-4799-4640-2/14/$31.00 ©2014 Crown 55

Fig. 1. Traffic modeling comprises of two main steps: 1) generating a traffic pattern, and 2) capturing the statistical properties of a given pattern. Differenttraffic generators receive different input parameters. So, a translation of the TGIP to the desired traffic properties is essential.
the similarities of traffic modeling in the time domain andthe space domain. 2) Unified, non-parameterized and accuratemetrics and models for capturing statistical properties of trafficin the space and time are proposed. 3) A continuously scalabletraffic model from zero heterogeneity to extreme clustering isproposed.
In Section II, existing models for modeling traffic in thetime domain and the space domain are investigated. In SectionIII, the proposed metrics and modeling for capturing statisticalproperties of traffic in time and space are introduced. SectionIV presents the simulation results and Section V concludes thepaper.
II. RELATED WORK
Packet arrivals in time domain can be modeled by a one-dimensional (1D) point process. A fixed inter-arrival time (iat)between packets generates maximum homogeneity (lattice).Exponentially distributed iat generates complete randomness(Poisson). For generating sub-Poisson patterns (patterns withmore homogeneity than Poisson) one way is to generate a per-fect lattice and apply a random displacement (perturbation) onits points [6, 7]. Various models for generating super-Poissonpatterns (patterns with more heterogeneity than Poisson) havebeen proposed in the literature which are mostly based onhierarchical randomness and Markov models [1–3].
A 1D point process in time domain can be measured math-ematically in many different ways. One may use the intervalcounts N(a, b] = Nb − Na which is a density-based metricand divide the whole domain into smaller windows and countthe number of process points in each window. A disadvantageof density-based metrics is that they are parameterized by thewindow size. Finding an appropriate window size is itself achallenging question and cannot be answered generally for allapplications. Inter-arrival time Ii = Ti+1 − Ti is the mostpopular and best-accepted metric because it is distance-basedrather than density-based and considers the distance betweenevery two neighboring points in domain. Considering CoV,for 1D-lattice, the constant iat has CI = 0. For a 1D-Poissonpattern, CI = 1 since for an exponential distribution with
parameter λ the standard deviation and the mean are bothµI = σI = λ. Sub-Poisson processes have 0 < CI < 1 andsuper-Poisson processes have CI > 1.
UE locations in a wireless cellular network in space do-main can be modeled by a two-dimensional (2D) or three-dimensional (3D) point process. A very inclusive review ofPoint processes in space domain is conducted in [8]. Fixeddistance between points generates perfect homogeneity (lat-tice). Poissonian distribution generates complete randomness.For generating sub-Poisson patterns, one way is to generate aperfect lattice and apply a random perturbation on its points[6, 7]. For generating super-Poisson patterns, hierarchicalrandomness based on doubly stochastic clustering perturbationcan be used. Clustering perturbation of a given (parent) processΦ consists of independent replication and displacement ofpoints of Φ, with the number of replications of a given pointx ∈ Φ having distribution Γ(x) and the replicas’ locationshaving distribution χ(x). All replicas of x form a cluster. Asurvey of super-Poisson processes in space domain can befound in [8].
As mentioned above, in time domain, distance-based met-ric inter-arrival time captures heterogeneity by one non-parameterized real value CI . In multi dimensions, however,there is no natural ordering of the points, so finding theanalogue of the inter-arrival time is not easy. There aremany density-based heterogeneity metrics in the literaturelike Ripley’s K-function and pair correlation function [8]but they are all parameterized. For introducing distance-basedmetrics, the problem is about defining the ’next point’ or the’neighboring points’ in multi-dimensional domains. The firstand simplest candidate for characterizing neighboring pointin multi-dimensional domain is the nearest-neighbor. Thisleads to nearest-neighbor distance metric [9]. However, thenearest-neighbor distance metric in 1D time domain is not theanalogue of the inter-arrival time because it is considering themin(Ii, Ii+1) for every point Ti. It is shown in our simulationresults that nearest neighbor fails to capture process statisticsin multi-dimensional domains because it only considers thenearest neighbor and ignores the other neighbors. The next
ICC'14 - W8: Workshop on 5G Technologies
56

candidate is the distance to kth neighbor. However, determin-ing k globally is not possible because every point may havedifferent number of neighbors.
III. UNIFIED AND SIMPLIFIED TRAFFIC METRICS
Given a point pattern P = {p1, p2, ..., pn} in d-dimensionalspace Rd, the Voronoi tessellation T = {cp1
, cp2, ..., cpn
} isthe set of cells such that every location, y ∈ cpi
, is closer topi than any other point in P . This can be expressed formallyas
cpi=
{y ∈ Rd : |y − pi| ≤ |y − pj | for i, j ∈ 1, ..., n
}. (1)
The Voronoi tessellation in Rd has the property that each ofits vertices is given by the intersection of exactly d+1 Voronoicells. The corresponding d+1 points define a Delaunay cell. Sothe two tessellations are said to be dual. Figure 2 demonstratesa pattern of points with its Voronoi tessellation (dashed lines)and Delaunay tessellations (solid lines).
Fig. 2. Voronoi (dashed lines) and Delaunay (solid lines) tessellations.
Every two points sharing a common edge in Voronoitessellation or equivalently every two connected points inDelaunay tessellation of a point process are called ’naturalneighbors’. This gives an inspiration of neighboring relationin multi-dimensional domains and leads us to analogues of thewell accepted inter-arrival time metric in multi dimensions.Various statistical inferences based on different properties ofcells generated by these tessellations can be considered formeasurement of a point pattern.
’Voronoi Cell Area’ or ’Voronoi Cell Volume’ V is the firstnatural choice. For a lattice process, all the cell areas in 2Dor cell volumes in 3D are equal and CV = 0. The statistics ofthe Voronoi cells for a Poisson point process (Poisson-VoronoiTessellation) are well investigated in the literature [10–14].Square rooted Voronoi cell area in 2D or cube rooted Voronoicell volume in 3D also can be considered.
The next proposed metric is the Delaunay edge length E.The statistics of Delaunay tessellations is investigated in [15–17]. The mean value of the lengths of Delaunay edges of everypoint M can also be considered.
A Delaunay tessellation divides the space to triangles ortetrahedrons in 2D and 3D, respectively. The area distributionof the triangles or the volume distribution of tetrahedrons Tcan determine the properties of the underlying pattern.
Voronoi and Delaunay tessellations can be applied on a 1Dprocess which models traffic in time domain. In this case,
the introduced distance-based metrics are converted to timedomain metrics. Basic statistics of these metrics for a Poissonpoint process in one, two and three dimensions and theiranalogues in time domain are summarized in Table I.
In order to use the above mentioned metrics as an analogueof inter-arrival time, one needs to normalize their CoV tothe CoV values of inter-arrival time in the time domain.For complete homogeneity case, the CoV values are alreadyzero like inter-arrival time. To normalize the CoV values ofcomplete random case to 1, it is required to divide the metricsby the values presented in Table I. Figure 3 demonstratesrealizations of processes with sub-Poisson, Poisson and super-Poisson characteristics.
IV. SIMULATION RESULTS
In a two dimensional 1000m × 1000m square field 1000points are distributed. For every configuration, the simulationsare repeated for 1000 ensemble drops. Simulation results forsub-Poisson and super-Poisson processes are presented in thefollowing sub-sections and the final sub-section illustratesthe performance of wireless cellular networks under modeledtraffic using the new proposed metrics.
Fig. 3. Realizations of processes with sub-Poisson (0 < C < 1), Poisson(C = 1) and super-Poisson (C > 1) characteristics respectively from left toright in time domain (top) and space domain (bottom).
A. Sub-Poisson Processes
To generate a sub-Poisson process, a hexagonal lattice isgenerated and then a symmetric Gaussian perturbation isapplied on its points with direction uniformly distributed in[0, 2π]. The perturbation distance is l ∼ Norm(0, αL) whereL is the original distance between every two neighboringpoints in the lattice. Figure 4 shows the CoV of the discusseddistance-based metrics. To cancel the field edge effects, theedge Voronoi and Delaunay cells are cut at the border. Withincrease in the perturbation distance, the resulting processconverges to the Poisson process [6, 7]. Various methods couldbe used to generate the primary lattice like square or hexagonallattice. Also various methods could be used for perturbationlike uniform or Gaussian distance from original location. Itis shown in [7] that the difference is only in the convergencebehavior. The CoV of all the metrics is normalized to be 1at the Poisson end (right edge) by dividing them by theirconvergence value. Figure 5 shows the normalized results. Thestandard deviation of any random variable is a good indicator
ICC'14 - W8: Workshop on 5G Technologies
57
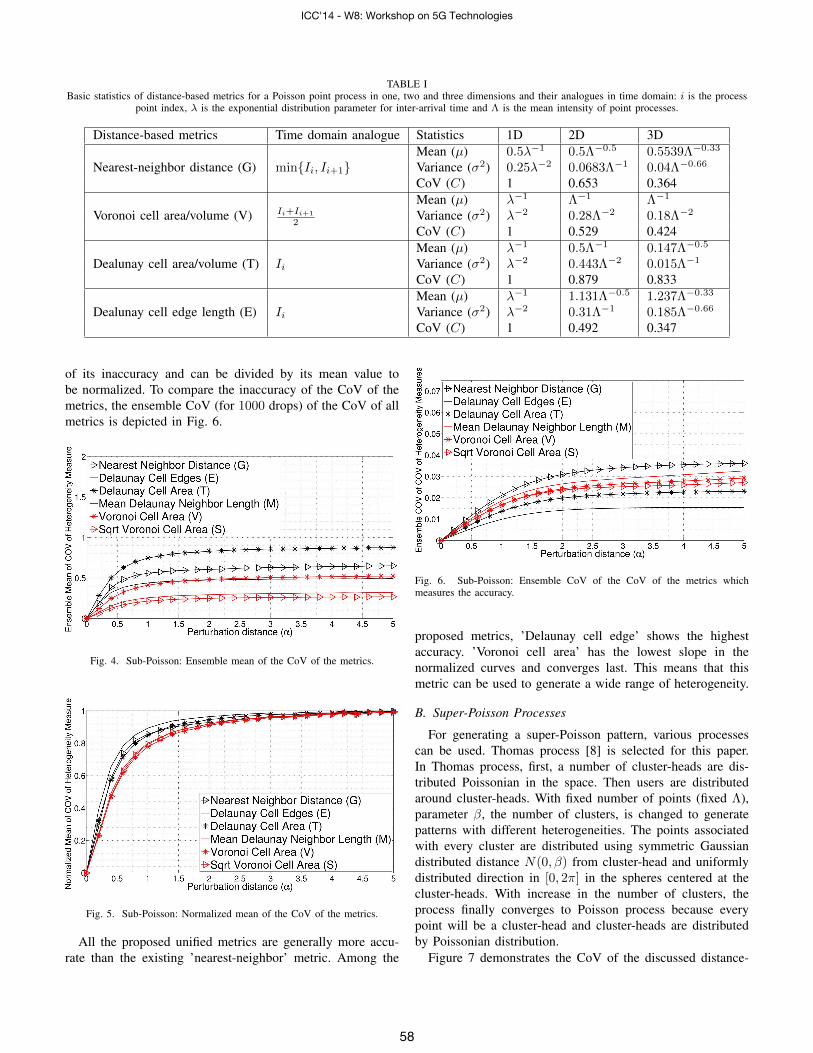
TABLE IBasic statistics of distance-based metrics for a Poisson point process in one, two and three dimensions and their analogues in time domain: i is the process
point index, λ is the exponential distribution parameter for inter-arrival time and Λ is the mean intensity of point processes.
Distance-based metrics Time domain analogue Statistics 1D 2D 3D
Nearest-neighbor distance (G) min{Ii, Ii+1}Mean (µ) 0.5λ−1 0.5Λ−0.5 0.5539Λ−0.33
Variance (σ2) 0.25λ−2 0.0683Λ−1 0.04Λ−0.66
CoV (C) 1 0.653 0.364
Voronoi cell area/volume (V) Ii+Ii+1
2
Mean (µ) λ−1 Λ−1 Λ−1
Variance (σ2) λ−2 0.28Λ−2 0.18Λ−2
CoV (C) 1 0.529 0.424
Dealunay cell area/volume (T) Ii
Mean (µ) λ−1 0.5Λ−1 0.147Λ−0.5
Variance (σ2) λ−2 0.443Λ−2 0.015Λ−1
CoV (C) 1 0.879 0.833
Dealunay cell edge length (E) Ii
Mean (µ) λ−1 1.131Λ−0.5 1.237Λ−0.33
Variance (σ2) λ−2 0.31Λ−1 0.185Λ−0.66
CoV (C) 1 0.492 0.347
of its inaccuracy and can be divided by its mean value tobe normalized. To compare the inaccuracy of the CoV of themetrics, the ensemble CoV (for 1000 drops) of the CoV of allmetrics is depicted in Fig. 6.
Fig. 4. Sub-Poisson: Ensemble mean of the CoV of the metrics.
Fig. 5. Sub-Poisson: Normalized mean of the CoV of the metrics.
All the proposed unified metrics are generally more accu-rate than the existing ’nearest-neighbor’ metric. Among the
Fig. 6. Sub-Poisson: Ensemble CoV of the CoV of the metrics whichmeasures the accuracy.
proposed metrics, ’Delaunay cell edge’ shows the highestaccuracy. ’Voronoi cell area’ has the lowest slope in thenormalized curves and converges last. This means that thismetric can be used to generate a wide range of heterogeneity.
B. Super-Poisson Processes
For generating a super-Poisson pattern, various processescan be used. Thomas process [8] is selected for this paper.In Thomas process, first, a number of cluster-heads are dis-tributed Poissonian in the space. Then users are distributedaround cluster-heads. With fixed number of points (fixed Λ),parameter β, the number of clusters, is changed to generatepatterns with different heterogeneities. The points associatedwith every cluster are distributed using symmetric Gaussiandistributed distance N(0, β) from cluster-head and uniformlydistributed direction in [0, 2π] in the spheres centered at thecluster-heads. With increase in the number of clusters, theprocess finally converges to Poisson process because everypoint will be a cluster-head and cluster-heads are distributedby Poissonian distribution.
Figure 7 demonstrates the CoV of the discussed distance-
ICC'14 - W8: Workshop on 5G Technologies
58
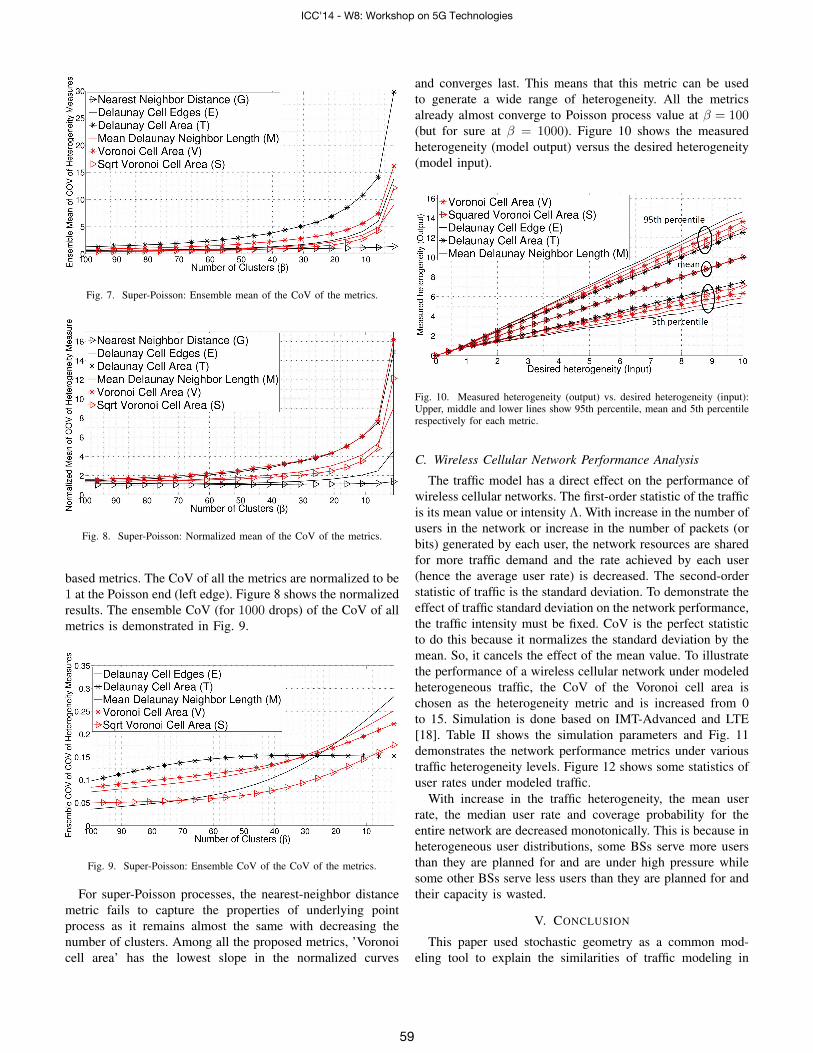
Fig. 7. Super-Poisson: Ensemble mean of the CoV of the metrics.
Fig. 8. Super-Poisson: Normalized mean of the CoV of the metrics.
based metrics. The CoV of all the metrics are normalized to be1 at the Poisson end (left edge). Figure 8 shows the normalizedresults. The ensemble CoV (for 1000 drops) of the CoV of allmetrics is demonstrated in Fig. 9.
Fig. 9. Super-Poisson: Ensemble CoV of the CoV of the metrics.
For super-Poisson processes, the nearest-neighbor distancemetric fails to capture the properties of underlying pointprocess as it remains almost the same with decreasing thenumber of clusters. Among all the proposed metrics, ’Voronoicell area’ has the lowest slope in the normalized curves
and converges last. This means that this metric can be usedto generate a wide range of heterogeneity. All the metricsalready almost converge to Poisson process value at β = 100(but for sure at β = 1000). Figure 10 shows the measuredheterogeneity (model output) versus the desired heterogeneity(model input).
Fig. 10. Measured heterogeneity (output) vs. desired heterogeneity (input):Upper, middle and lower lines show 95th percentile, mean and 5th percentilerespectively for each metric.
C. Wireless Cellular Network Performance Analysis
The traffic model has a direct effect on the performance ofwireless cellular networks. The first-order statistic of the trafficis its mean value or intensity Λ. With increase in the number ofusers in the network or increase in the number of packets (orbits) generated by each user, the network resources are sharedfor more traffic demand and the rate achieved by each user(hence the average user rate) is decreased. The second-orderstatistic of traffic is the standard deviation. To demonstrate theeffect of traffic standard deviation on the network performance,the traffic intensity must be fixed. CoV is the perfect statisticto do this because it normalizes the standard deviation by themean. So, it cancels the effect of the mean value. To illustratethe performance of a wireless cellular network under modeledheterogeneous traffic, the CoV of the Voronoi cell area ischosen as the heterogeneity metric and is increased from 0to 15. Simulation is done based on IMT-Advanced and LTE[18]. Table II shows the simulation parameters and Fig. 11demonstrates the network performance metrics under varioustraffic heterogeneity levels. Figure 12 shows some statistics ofuser rates under modeled traffic.
With increase in the traffic heterogeneity, the mean userrate, the median user rate and coverage probability for theentire network are decreased monotonically. This is because inheterogeneous user distributions, some BSs serve more usersthan they are planned for and are under high pressure whilesome other BSs serve less users than they are planned for andtheir capacity is wasted.
V. CONCLUSION
This paper used stochastic geometry as a common mod-eling tool to explain the similarities of traffic modeling in
ICC'14 - W8: Workshop on 5G Technologies
59
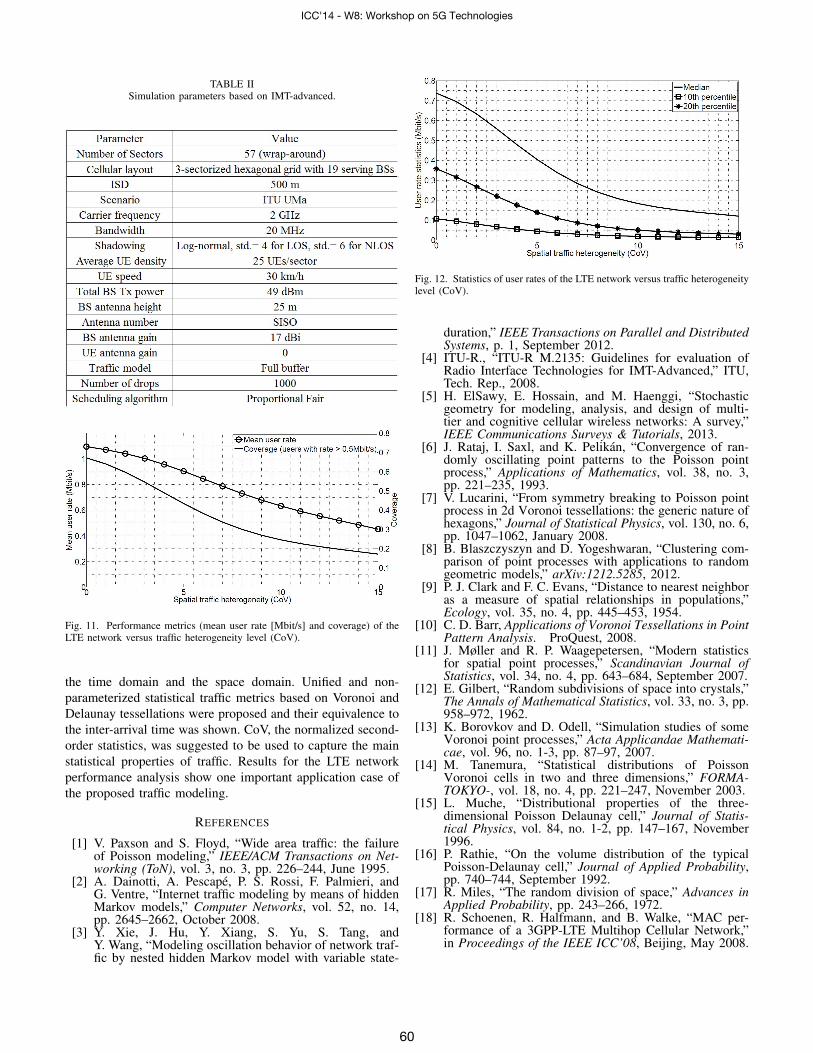
TABLE IISimulation parameters based on IMT-advanced.
Fig. 11. Performance metrics (mean user rate [Mbit/s] and coverage) of theLTE network versus traffic heterogeneity level (CoV).
the time domain and the space domain. Unified and non-parameterized statistical traffic metrics based on Voronoi andDelaunay tessellations were proposed and their equivalence tothe inter-arrival time was shown. CoV, the normalized second-order statistics, was suggested to be used to capture the mainstatistical properties of traffic. Results for the LTE networkperformance analysis show one important application case ofthe proposed traffic modeling.
REFERENCES
[1] V. Paxson and S. Floyd, “Wide area traffic: the failureof Poisson modeling,” IEEE/ACM Transactions on Net-working (ToN), vol. 3, no. 3, pp. 226–244, June 1995.
[2] A. Dainotti, A. Pescape, P. S. Rossi, F. Palmieri, andG. Ventre, “Internet traffic modeling by means of hiddenMarkov models,” Computer Networks, vol. 52, no. 14,pp. 2645–2662, October 2008.
[3] Y. Xie, J. Hu, Y. Xiang, S. Yu, S. Tang, andY. Wang, “Modeling oscillation behavior of network traf-fic by nested hidden Markov model with variable state-
Fig. 12. Statistics of user rates of the LTE network versus traffic heterogeneitylevel (CoV).
duration,” IEEE Transactions on Parallel and DistributedSystems, p. 1, September 2012.
[4] ITU-R., “ITU-R M.2135: Guidelines for evaluation ofRadio Interface Technologies for IMT-Advanced,” ITU,Tech. Rep., 2008.
[5] H. ElSawy, E. Hossain, and M. Haenggi, “Stochasticgeometry for modeling, analysis, and design of multi-tier and cognitive cellular wireless networks: A survey,”IEEE Communications Surveys & Tutorials, 2013.
[6] J. Rataj, I. Saxl, and K. Pelikan, “Convergence of ran-domly oscillating point patterns to the Poisson pointprocess,” Applications of Mathematics, vol. 38, no. 3,pp. 221–235, 1993.
[7] V. Lucarini, “From symmetry breaking to Poisson pointprocess in 2d Voronoi tessellations: the generic nature ofhexagons,” Journal of Statistical Physics, vol. 130, no. 6,pp. 1047–1062, January 2008.
[8] B. Blaszczyszyn and D. Yogeshwaran, “Clustering com-parison of point processes with applications to randomgeometric models,” arXiv:1212.5285, 2012.
[9] P. J. Clark and F. C. Evans, “Distance to nearest neighboras a measure of spatial relationships in populations,”Ecology, vol. 35, no. 4, pp. 445–453, 1954.
[10] C. D. Barr, Applications of Voronoi Tessellations in PointPattern Analysis. ProQuest, 2008.
[11] J. Møller and R. P. Waagepetersen, “Modern statisticsfor spatial point processes,” Scandinavian Journal ofStatistics, vol. 34, no. 4, pp. 643–684, September 2007.
[12] E. Gilbert, “Random subdivisions of space into crystals,”The Annals of Mathematical Statistics, vol. 33, no. 3, pp.958–972, 1962.
[13] K. Borovkov and D. Odell, “Simulation studies of someVoronoi point processes,” Acta Applicandae Mathemati-cae, vol. 96, no. 1-3, pp. 87–97, 2007.
[14] M. Tanemura, “Statistical distributions of PoissonVoronoi cells in two and three dimensions,” FORMA-TOKYO-, vol. 18, no. 4, pp. 221–247, November 2003.
[15] L. Muche, “Distributional properties of the three-dimensional Poisson Delaunay cell,” Journal of Statis-tical Physics, vol. 84, no. 1-2, pp. 147–167, November1996.
[16] P. Rathie, “On the volume distribution of the typicalPoisson-Delaunay cell,” Journal of Applied Probability,pp. 740–744, September 1992.
[17] R. Miles, “The random division of space,” Advances inApplied Probability, pp. 243–266, 1972.
[18] R. Schoenen, R. Halfmann, and B. Walke, “MAC per-formance of a 3GPP-LTE Multihop Cellular Network,”in Proceedings of the IEEE ICC’08, Beijing, May 2008.
ICC'14 - W8: Workshop on 5G Technologies
60