unilever pakistan ltd. ayesha arshad 08-arid-348
TRANSCRIPT

UNILEVER Pakistan Ltd.
Ayesha Arshad08-arid-348

Introduction of CompanyUnilever Pakistan is the largest FMCG and largest multinational Company in Pakistan. The town of Rahim Yar Khan was the site chosen for setting up a vegetable oil factory in 1958 and that is where the first UPL manufacturing facility developed. The Company is a limited liability Company incorporated in Pakistan. It is listed on the Karachi, Lahore and Islamabad Stock Exchanges. It manufactures and markets home and personal care products, beverages, ice cream and spreads. The registered office of the Company is situated at Avari Plaza, Fatima Jinnah Road, Karachi.

Unilever is one of the world’s leading suppliers of fast-moving consumer goods. They aim to provide people
the world over with products that are good for them and good for others.
Creating a better future every day

Company’s vision
● They work to create a better future every day.
● They help people feel good, look good and get more out of life with brands and services that are good for them and good for others.
● They will inspire people to take small everyday actions that can add up to a big difference for the world.
● They will develop new ways of doing business that will allow us to double the size of our company while reducing our environmental impact.

A global management team
Sandy Ogg
Chief HR Officer
Geneviève Berger
Chief R&D Officer
Michael Polk
President Global Foods, Home & Personal Care
Harish Manwani
President Asia, Africa and Central & Eastern Europe
Doug Baillie
President Western Europe
Dave Lewis
President AmericasPaul Polman
Chief Executive Officer
Pier Luigi Sigismondi
Chief Supply Chain Officer
Jean-Marc Huët
Chief Financial Officer
Keith Weed
Chief Marketing and Communications Officer

Board of Directors
Chairman
Michael Treschow
Paul PolmanChief Executive Officer
Jean-Marc HuëtChief Financial Officer
Executive Directors
Non-Executive Directors
The Rt Hon The Lord Brittan of
Spennithorne QC, DL
Wim Dik Louise Fresco
Ann Fudge Charles Golden
Byron Grote
Narayana Murthy
Hixonia Nyasulu
Kees Storm Jeroen van der Veer
Paul Walsh

Board of Directors of
Unilever Pakistan Limited
Mr. Ehsan A. Malik Chairman & Chief Executive/ managing director
Mr. Imran Husain Executive Director / CFOMr. M. Qaysar Alam Executive DirectorMs. Shazia Syed Executive DirectorMr. Amir R. Paracha Executive DirectorMr. Zaffar A. Khan Non - Executive DirectorMr. Khalid Rafi Non - Executive DirectorCOMPANY SECRETARYMr. Amar NaseerAUDIT COMMITTEEMr. Zaffar A. Khan ChairmanMr. Khalid Rafi MemberMr. M. Qaysar Alam MemberMr. Imtiaz Jaleel Head of Internal Audit & SecretaryAuditorsMessers A.F. Ferguson & Co. Chartered Accountants

Unilever’s portfolio of categories
Leading category positions
Ice Cream & Beverages
Personal Care
Homecare
Savoury, Dressings & Spreads
Strong category positions

Company’s Profile
Symbol
ULEVER
Currency
Pakistan Rupees
Fiscal Year end
December
Share type
Ordinary
Market capitalization
62,361,539,479
Exchanges
Karachi, Lahore, Islamabad
Share outstanding
13,293,869
Approx Held shares
10,016,338
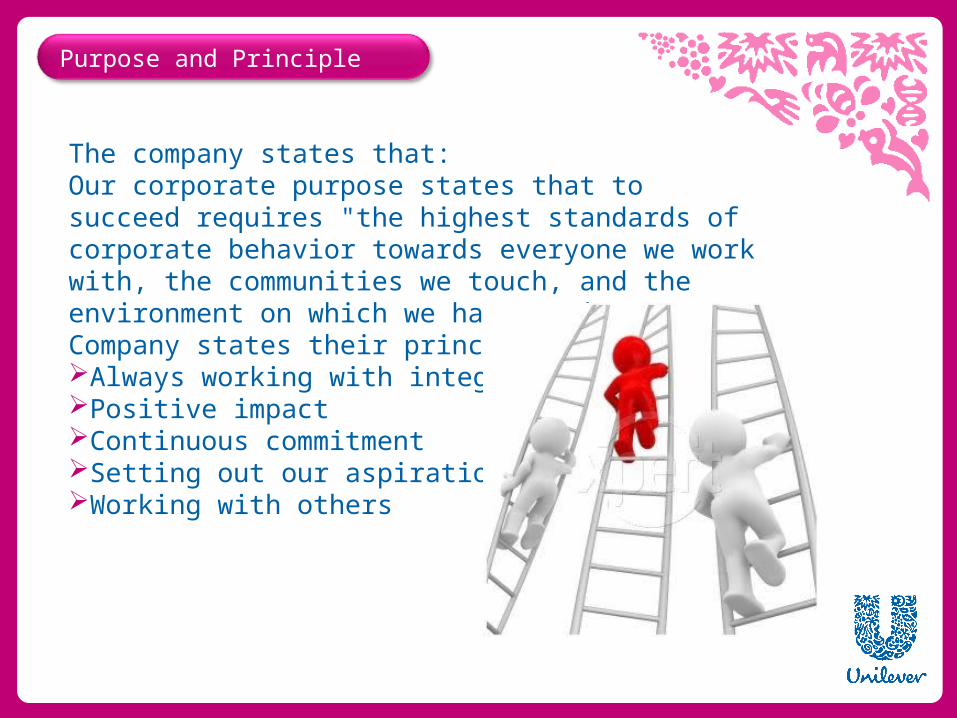
Purpose and Principle
The company states that: Our corporate purpose states that to succeed requires "the highest standards of corporate behavior towards everyone we work with, the communities we touch, and the environment on which we have an impact."Company states their principles as:Always working with integrityPositive impact Continuous commitmentSetting out our aspirations Working with others

Stock exchange Listed date
Karachi stock exchange 14th December 1980
Lahore stock exchange 1980
Islamabad stock exchange 1980
Date of Listing

● Good broad-based underlying sales growth of 3.5%
● volume growth of 2.3% – accelerating through the year
● Earning per share increases
● Profit (after taxation) increases
● Non current assets increase
● Current assets slightly decrease
● Non current liabilities increase
● Current liabilities decreases
● Equity increases
In 2009
Sales growth 3.5%
Volume growth 2.3%

Other facts..
North America
23%
Western Europe
38%
D&E 36%
North America
16%
Western Europe
30%
D&E 50%
Incorporation year 1958
Authorized capital 800 million in Rs.
Method of depreciation Straight line method
Valuation policy (in general) Historical cost
Inventory Method Average cost method

Share prices Rs.
2009
High 2475
Low 1725
Average 2100

Distribution
2009
Cash dividend %age 458
Stock dividend %age 0
Total 458

FINANCIAL STATEMENTS

Assets 2009 2008 2007 2006Non current assets Property, plant and equipment 4,736,619 4,428,278 3,513,499 2,137,350Intangible assets 2,433 7,303 12,173 17,043Long term loans 98,117 120,545 115,388 96,417Long term investments 95,202 95,202 95,202 95,202Long term payments 392896 540,027 4,920 25,357Retirement benefits - prepayments 188054 205,355 250,878 372,638 5,513,321 5,396,710 3,992,060 2,744,007Current assets Store and spares 265,420 231,897 180,355 206,021Stock in trade 3,649,070 4,261,770 2,726,064 2,156,472Trade debts 506,357 228,763 239,313 174,722Loans and advances 131,852 123,904 122,888 173,960Accrued interest / mark up 1,115 4,605Trade deposits and short term prepayments
682,949 516,443236,064 101,680
Other receivables 82,141 218,329 249,139 96,232Taxation-payments less provision 355,052 301,813 148,496 186,287Cash and bank balances 239,553 106,789 188,682 585,860 5,912,394 5,989,708 4,092,116 3,685,839Total assets 11,425,715 11,386,418 8,084,176 6,429,846
Balance sheet

Equity and liabilities 2009 2008 2007 2006Capital and reserves Share capital 669,477 669,477 669,477 669,477Reserves 2,621,643 1,546,281 1,310,350 1,160,685 3,291,120 2,215,758 1,979,827 1,830,162Surplus on revaluation of fixed assets
12,965 13,613
14,261 14,909Liabilities Non current liabilities Liabilities against assets subject to finance leases 56762 77327 52,932 14,273Retirement benefits-obligation 327,060 239,794 140,463 129,799Deferred taxation 636,130 369,653 309,044 203,595 1,019,952 686,774 502,439 347,667Current liabilites Trade and other payables 5,785,776 4,547,794 4,750,490 3,987,437Taxation - provisions less payments 21,633 120,611Accrued interest/ mark up 28892 64,075 3,669 1,898current maturity of liabilities against assets subject to finance leases 28419 32,322 17,273 16,962Short term borrowings 1,037,911 3,232,523 423,557 200Provisions 220,680 593,559 371,027 110,000 7,101,678 8,470,273 5,587,649 4,237,108Total liabilities 8,121,630 9,157,047 6,090,088 4,584,775Commitments Total equity and liabilities 11,425,715 11,386,418 8,084,176 6,429,846

2009 2008 2007 2006
Sales 38,187,582 30,956,839 23,331,666 20,987,885Cost of sales 24852625 20021159 14248581 13244679 Gross profit 13,334,957 10,935,680 37,580,247 34,232,564Distribution cost (7179694) (5837582) (5021177) (4153147)Administrative expenses (1030478) (1210502) (1007599) (903646)Other operating expenses (373785) (247266) (233857) (229664)Other operating income 192,313 239,918 190,588 202,923 4,943,313 3,880,248 3,011,040 2,659,672Restructing cost
-489280 (372,234) (110,000)Profit from operations 4,943,313 3,390,968 2,638,806 2,549,672Finance cost 427,708 466,166 109,208 63,946 Profit before taxation 4,515,605 2,924,802 2,529,598 2,485,726Taxation -1,459,865 -940,476 (842,240) (853,242)Profit after taxation 3,055,740 1,984,326 1,687,358 1,632,484Earnings per share-rupees 230 149 127 123
Income Statement
FINANCIAL RATIOS
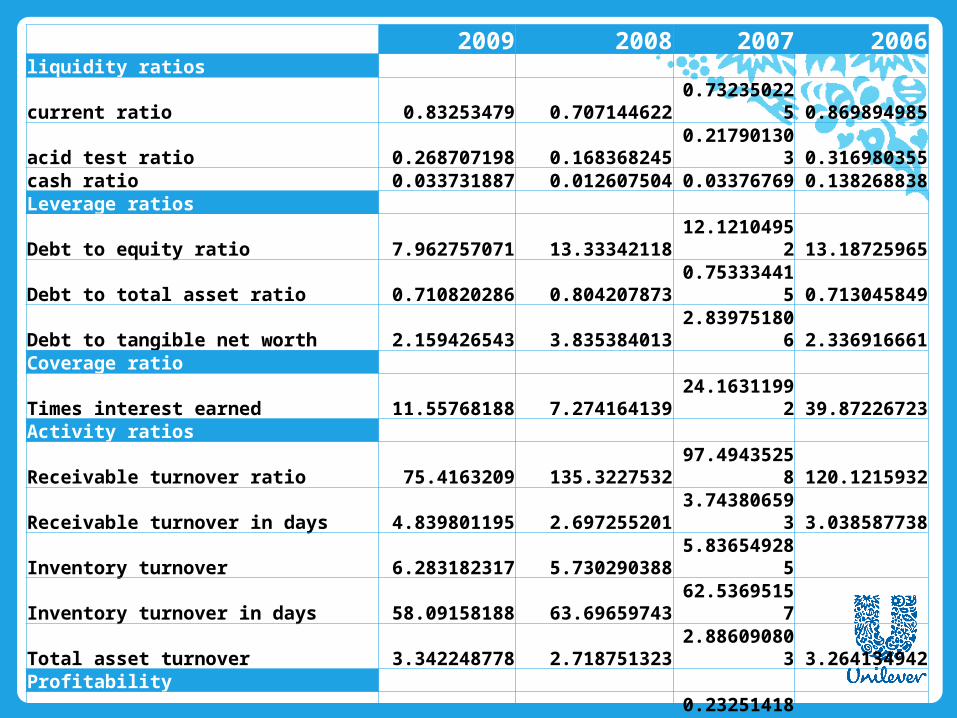
2009 2008 2007 2006liquidity ratios current ratio 0.83253479 0.707144622 0.732350225 0.869894985acid test ratio 0.268707198 0.168368245 0.217901303 0.316980355cash ratio 0.033731887 0.012607504 0.03376769 0.138268838Leverage ratios Debt to equity ratio 7.962757071 13.33342118 12.12104952 13.18725965Debt to total asset ratio 0.710820286 0.804207873 0.753334415 0.713045849Debt to tangible net worth 2.159426543 3.835384013 2.839751806 2.336916661Coverage ratio Times interest earned 11.55768188 7.274164139 24.16311992 39.87226723Activity ratios Receivable turnover ratio 75.4163209 135.3227532 97.49435258 120.1215932Receivable turnover in days 4.839801195 2.697255201 3.743806593 3.038587738Inventory turnover 6.283182317 5.730290388 5.836549285 Inventory turnover in days 58.09158188 63.69659743 62.53695157 Total asset turnover 3.342248778 2.718751323 2.886090803 3.264134942Profitability Return on asset 0.267904803 0.203827988 0.232514185 Return on total equity 1 0.945911476 0.885754788 Operating income margin 0.12944818 0.109538574 0.113099768 0.121483037Operating assets turnover 8.333444882 7.795947683 8.257755958 Return on operating assets 1.078749276 0.853956992 0.933950279 Du pont Return on operating assets 0.139642131 0.093541231 0.105629559 Sales to fixed assets 7.000453436 5.736242822 6.927385372 Gross profit margin 0.34919616 0.353255705 1.61069711 1.631063063Net profit margin 0.080019206 0.064099762 0.072320511 1.631063063Net working capital -1,189,284 -2,480,565 -1,495,533 -551,269Sales to working capital -32.10972484 -12.4797532 -15.6009035 -38.07194854

FINANCIAL RATIOS ANALYSIS

LIQUIDITY RATIO
Current and acid test ratios were high in 2006 but declined in 2007 and 2008 that shows that Company was more liquid in 2006 than in the coming years. But in 2009, both ratios became high again. Cash ratio shows the highest figure in 2009 and 2007 indicates that company current assets have more value in terms of cash. In 2006 company has low value in cash as compared to 2009 and 2007 but higher than in 2008.
COMMON SIZE ANALYSIS
In 2006 , company has high cash and loans amount but it declines in 2007 and 2008. But in 2009, again it increases. The plant and equipment goes on increasing from 2006 to 2009, this show that the company invest more on plant and equipment. Earnings per share also increases. profit before taxation is increasing in these 4 years, as the operating income is increasing.

INDEX ANALYSIS
Current assets are increasing in these 4 years, but in a 2009, there is a little bit decline in it. And the fixed assets are increasing.
LEVERAGE RATIO
Leverage ratios shows a declining trend over these four years that indicates that company is using less finance resources in current year as compared to previous years.

ACTIVITY RATIO
Activity ratios show that company is managing its receivables efficiently and collecting it in lesser days as compared to last three years.
PROFITABILITY RATIO
Profitability ratios also shows an increasing trend over the last three years that indicates that company is running profitable operations and using its operating assets efficiently to generate profits.

THANKS