unions and public pension benefits - boston...
TRANSCRIPT

R E S E A R C HRETIREMENT
State and Local Pension Plans Number 19, July 2011
UNIONS AND PUBLIC PENSION BENEFITS
By Alicia H. Munnell, Jean-Pierre Aubry, Josh Hurwitz, and Laura Quinby*
* Alicia H. Munnell is the director of the Center for Retirement Research at Boston College (CRR) and Peter F. Drucker Profes-sor of Management Sciences in Boston College’s Carroll School of Management. Jean-Pierre Aubry is the assistant director of state and local research at the CRR. Josh Hurwitz and Laura Quinby are research associates at the CRR. The authors would like to thank Beth Almeida, David Blitzstein, Frank Caine, Beth Kellar, Steven Kreisberg, and Nathan Scovronick for help-ful comments.
Introduction
State and local pensions have been headline news since the 2008 financial collapse reduced the value of their assets, leaving a substantial unfunded liabil-ity. The deterioration in the funded status of these plans raised pension costs at the same time that the ensuing recession wreaked havoc with state and local budgets. Legislatures across the country have responded by reducing pension benefits – primarily for new employees – and increasing employer and employee contributions.1 As part of that process, governors in several states have launched initiatives to curb collective bargaining in the public sector.2 One possible implication is that governors view unions as responsible for pushing up state and local pension benefits. This brief identifies the impact of public sec-tor unions and other factors on benefit levels, wages, and employment.
The brief is organized as follows. The first section summarizes what is known about pensions, wages, workers, and unionization in the public sector. The second section reports on a series of empirical exer-cises to determine the role of unions in explaining public pensions and wages. The results show that unions have no measurable effect on plan generosity or rate of growth in pension benefits, but do have a quantifiable impact on wage levels and perhaps num-ber of workers. The third section presents a possible reason for this outcome. Public sector pensions are legislated, not bargained, so the articulateness and acumen of the lobbyists may be more important than the number of union members; in contrast, wages are bargained and union strength could have a more di-rect effect. The final section concludes that this area is ripe for further research because the results appear to contradict the general perception of commentators and politicians.
LEARN MORE
Search for other publications on this topic at:crr.bc.edu

Center for Retirement Research2
What We Know
While many aspects of the public sector labor market are a source of great controversy, other aspects are undisputed. This section presents some of the facts. The focus here is public sector workers; any compari-son to private sector workers is used only as a metric for assessing public sector compensation and union-ization.
Public Sector Pensions are More Generous
Pensions are more generous in the public sector as evidenced by the fact that, despite significant employee contributions, public employer costs are higher than private employer costs (see Figure 1). In addition, a greater percent of workers – 76 percent vs. 43 percent – have an employer-sponsored plan in the public sector than the private sector.
Figure 1. Employer and Employee Pension Cost, by
Sector, 2009
7.0%
5.2%
3.0%
4.9%
0.0%
7.0%
0%
2%
4%
6%
8%
State and local defined benefit
Private sector defined benefit
Private sector defined contribution
Employer - solid Employee - striped
Note: State and local rates are for Social Security eligible employees. The rates for those without Social Security aver-aged 7.1 percent (employer) and 7.6 percent (employee). Sources: Public Plans Database (PPD) (2009); Towers Watson (2009); and Vanguard (2010).
Public Sector Workers Are Different
The public workforce looks different than the private workforce. The share of those with at least a college degree is 52 percent in the public sector compared to 35 percent in the private sector. The percent over age 45 is 51 percent in the public sector and 44 percent in the private sector. And the percent female is 57 per-cent in the public sector and 42 percent in the private sector (see Figure 2). Median tenure in the public
sector is seven years compared to four in the private sector.3 These characteristics are likely driven by teachers, who comprise a large portion of the public workforce.
Figure 2. Percent With At Least a College
Degree, Over Age 45, and Female, by Sector, 2010
52% 51%57%
35%44% 42%
0%
20%
40%
60%
80%
100%
With at least a college degree
Over age 45 Female
State and local
Private
Source: Authors’ calculations from the U.S. Census Bureau, Current Population Survey (CPS) (2010).
Public Sector Wages Are Lower
Whether public sector workers have higher or lower total compensation is an extremely contentious is-sue. It requires careful comparisons of people doing similar jobs in each sector. But the fact is that average wages in the public sector are lower than those in the private sector, and the ratio of public to private sector wages has declined over time (see Figure 3).
Figure 3. Ratio of Average Public to Private
Sector Hourly Wages, 1990-2010
0.84
0.92
1.00
1.08
1990 1995 2000 2005 2010
Source: Authors’ calculations from CPS (2010).

Issue in Brief 3
Public Sector Unions Are More Important
The union picture for the public and private sectors is very different. While union membership in the private sector fell from 35 percent of the workforce in the 1950s to 7 percent in 2010, the rate in the public sector increased from about 10 percent in the 1950s to 38 percent today (see Figure 4). Union membership varies by region and type of job – for example, public safety employees tend to be more unionized than general employees.
Figure 4. Percent of Wage and Salary Workers in
Unions, 1940-2010
0%
10%
20%
30%
40%
1940
19
50
1960
19
70
1980
19
90
2000
20
10
State and local Private
Note: The percent in unions for state and local workers prior to 1962 includes federal workers. The jump in 1962 is due to the inclusion of associations.Sources: Troy and Sheflin (1985); the U.S. Department of La-bor (1939-1983); and Hirsch and Macpherson (1983-2010).
Sorting Out the Reasons
This section attempts to sort out the interactions of the facts presented above, with a special emphasis on the role of unions in influencing the growth of pen-sion benefits, normal cost, wages, and the size of the workforce.
Growth in Pension Benefits
Figure 5 shows the average pension benefit over the period 1993-2008. Two interesting facts emerge. First, the average annual benefit in 2008 was $23,000, a figure substantially lower than most commentary would suggest. Second, the trend suggests a period of slower growth (1993-1998), a period of rapid growth (1999-2003), and then a period of stability (2004-2008).
Figure 5. Average State-Local Pension Benefit,
1993-2008, Thousands of 2010 Dollars
$0
$5
$10
$15
$20
$25
Source: Authors’ calculations from the U.S. Census Bureau, State and Local Government Public-Employee Retirement Systems (1993-2008).
To figure out what was going on, we estimated an equation to explain the average annual rate of growth in each state over each of these three periods. Focus-ing on states, as opposed to plans, was necessary because consistent plan data are not available going back to the 1990s. Five variables were thought to be important:
Unionization. The recent actions by governors would suggest that union power led to increases in pension benefits. But pension benefits are generally set by the legislature, which suggests that lobbying expertise, rather than the percent of the public workforce that is a member of a union, may be the key factor.4 (See Appendix A for an explanation of the union variable.) If union strength were an important factor, the coef-ficient would be positive.
Growth in the funded ratio. Stories abound about how over-funding can result in a push to liberalize ben-efits.5 Indeed, much of the expansion in California in the late 1990s is attributed to their reporting funded ratios in excess of 100 percent.6 However, the effect is not symmetric because most states cannot reduce benefits for current employees. Thus, the variable representing the change in the funded ratio is equal to 1 if the ratio increased and zero otherwise. This change is calculated over the four years prior to the relevant benefit growth period. That is, for 2004-2008, the funded variable reflects the change over the period 2000-2003. The coefficient should be positive.

Center for Retirement Research4
Mean reversion. Some experts suggest that changes in states’ pension policies are driven by what is going on around them. If neighboring states are raising benefits, then the lagging state will follow. To capture this phenomenon, this variable takes on a value of 1 if the state’s pension benefit is lower than the average for the region in the four years prior to the relevant growth period. The coefficient of this variable should be positive. That is, if a state starts behind, it is more likely to raise benefits.
Debt to revenue. For politicians to expand pension ben-efits, the state’s financial accounts, as well as the pen-sion fund, have to be in good order. One key to fiscal well-being is the state’s debt burden. To standardize for the size of the state, debt is measured relative to revenue. This variable is the average ratio of debt to revenue for the four years prior to the relevant benefit growth period. If a larger debt burden does restrain benefit growth, the coefficient would be negative.
Closed plan. Some states have closed one or more of their defined benefit plans to new entrants. One would not expect benefits to increase under these circumstances. The variable is set equal to 1 if the state has a closed plan in the four years preceding the benefit growth period. The coefficient should be negative.
The bars in Figure 6 show the impact of each vari-able on the average annual growth rate of benefits. For “0/1” variables, such as growth in the funded ratio, starting below the mean, and closed plan, the bars represent the relationship between the character-istic and the growth rate; for continuous variables, the bars represent the impact of a one-standard-deviation change on the growth rate. The results suggest that an increase in the funded ratio and catching up with the neighbors – that is, mean reversion – are impor-tant factors in explaining the growth in public sector benefits. In addition, states with a higher ratio of debt to revenue and with a closed plan experience less benefit growth. But union strength does not have a statistically significant effect.7 (See Appendix B for
Figure 6. Impact of Selected Factors on the Average Annual Growth Rate of State-Local Pension Benefits, 1994-1998, 1999-2003, and 2004-2008
-2.38
-0.32
0.81
1.23
0.11
-3 -2 -1 0 1 2 3
Percent unionized
Funded ratio growth
Mean reversion
Debt as percent of revenue
Closed plan
Statistically significantNot statistically significant
Mean Average Annual Growth: 2.29
-0.47
-0.32
0.41
0.60
0.11
-1 -0.5 0 0.5 1
Note: Solid bars indicate the coefficient is statistically significant at the 10-percent level or better. Standard errors have been adjusted for state-level clustering.Sources: Authors’ calculations from Hirsch and Macpherson (1990-2008); PPD (2001-2003); Public-Employee Retirement Systems (1993-2008); U.S. Census Bureau, State and Local Government Finance (1990-2003); and Zorn (1990-2000).
full regression results.)
Normal Cost
It could be possible that unions do not affect the growth in benefits because states with high levels of unionization always had a more generous benefit formula. In other words, unions pressed for high benefit factors early and therefore did not need to push for rapid growth. To test this hypothesis, we ran another regression to identify the factors that affect the generosity of benefits. Generosity is measured

Issue in Brief 5
as normal cost – the amount needed to be put aside in a given year to cover benefits earned that year – as a percent of payrolls. By controlling for payrolls, the analysis focuses on the differences in benefits due to a more generous formula as opposed to the effect of higher wages feeding into the formula. The following variables are included in this equation:
Unionization. Unionization is measured slightly dif-ferently for this exercise. Because normal cost data are available only for those plans included in our Public Plan Database (PPD), the degree of unioniza-tion pertains only to plans included in the sample rather than the state’s entire public sector workforce.8 Again, if union strength affects the level of benefits, the coefficient would be positive.
Social Security coverage. Roughly 30 percent of public sector workers are not covered by Social Security. The plans for these workers would be expected to be more generous because these public employees have no other source of retirement income. Social Security coverage is measured as the percent of workers cov-ered, so the coefficient would be negative – the more workers covered by Social Security, the less need for higher benefits.
Police & Fire. Plans for police and fire employees are considerably more expensive than those for teachers or general employees, because public safety workers retire at a much younger age. Therefore, states with more workers in police and fire plans would have a higher average normal cost, and the coefficient would be positive.
Number of systems. The normal cost of plans at the local level tends to be higher than those administered by the state.9 Therefore, states with many local plans would tend to have higher normal cost, and the coef-ficient would be positive.
Closed plan. If the state has closed the plan to new entrants, it has probably not increased benefits over time. As a result, normal cost would be expected to be lower and the coefficient negative.
This simple equation explains more than one-third of the variation in normal cost for the 50 states over the 2001-2008 period. And Social Security coverage, number of systems, percent in police and fire plans, and whether the plan is closed all have the expected effects and are statistically significant (see Figure 7). But union strength does not appear to have a direct impact on the generosity of benefits.
Figure 7. Impact of Selected Factors on Normal Cost as a Percent of Payroll, 2001-2008
-0.40
0.48
0.35
-1.32
-0.20
-2 -1 0 1 2
Percent unionized
Percent in Social Security
Number of systems
Percent in police & fire plan
Percent in a closed plan
Statistically significantNot statistically significant
Mean Normal Cost/Payroll: 11.70
-0.47
-0.32
0.41
0.60
0.11
-1 -0.5 0 0.5 1
Note: Solid bars indicate the coefficient is statistically significant at the 10-percent level or better. The results shown are for a one-standard-deviation change. Standard errors have been adjusted for state-level clustering. Additional controls not depicted include a vector of year dummy variables. “Percent unionized” reflects the percent of those state and local workers captured in the PPD who are allowed to collectively bargain under state law. West Virginia is omitted from 2001 through 2003 due to data unavailability.Sources: Authors’ calculations from Freeman and Valletta (1987); PPD (2001-2008); and Public-Employee Retirement Systems (2001-2008).
Center for Retirement Research6
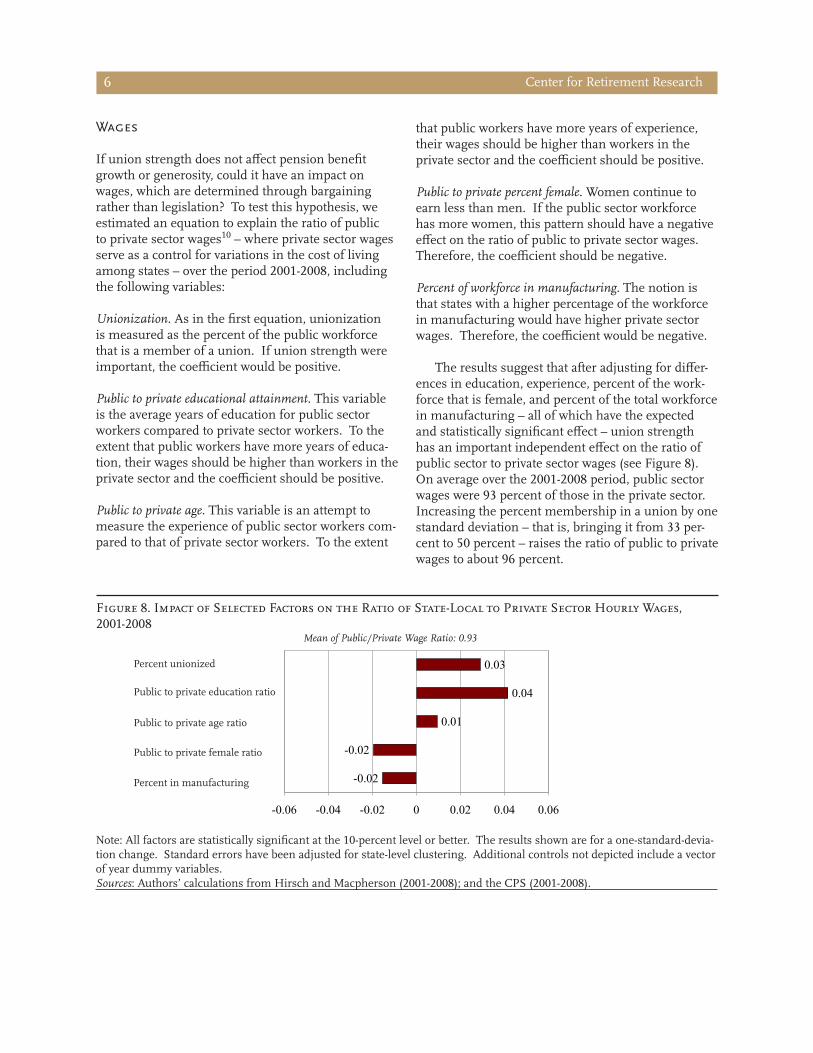
Wages
If union strength does not affect pension benefit growth or generosity, could it have an impact on wages, which are determined through bargaining rather than legislation? To test this hypothesis, we estimated an equation to explain the ratio of public to private sector wages10 – where private sector wages serve as a control for variations in the cost of living among states – over the period 2001-2008, including the following variables:
Unionization. As in the first equation, unionization is measured as the percent of the public workforce that is a member of a union. If union strength were important, the coefficient would be positive.
Public to private educational attainment. This variable is the average years of education for public sector workers compared to private sector workers. To the extent that public workers have more years of educa-tion, their wages should be higher than workers in the private sector and the coefficient should be positive.
Public to private age. This variable is an attempt to measure the experience of public sector workers com-pared to that of private sector workers. To the extent
that public workers have more years of experience, their wages should be higher than workers in the private sector and the coefficient should be positive.
Public to private percent female. Women continue to earn less than men. If the public sector workforce has more women, this pattern should have a negative effect on the ratio of public to private sector wages. Therefore, the coefficient should be negative.
Percent of workforce in manufacturing. The notion is that states with a higher percentage of the workforce in manufacturing would have higher private sector wages. Therefore, the coefficient would be negative.
The results suggest that after adjusting for differ-ences in education, experience, percent of the work-force that is female, and percent of the total workforce in manufacturing – all of which have the expected and statistically significant effect – union strength has an important independent effect on the ratio of public sector to private sector wages (see Figure 8). On average over the 2001-2008 period, public sector wages were 93 percent of those in the private sector. Increasing the percent membership in a union by one standard deviation – that is, bringing it from 33 per-cent to 50 percent – raises the ratio of public to private wages to about 96 percent.
Figure 8. Impact of Selected Factors on the Ratio of State-Local to Private Sector Hourly Wages, 2001-2008
-0.02
-0.02
0.01
0.04
0.03
-0.06 -0.04 -0.02 0 0.02 0.04 0.06
Percent unionized
Public to private education ratio
Public to private age ratio
Public to private female ratio
Percent in manufacturing
Mean of Public/Private Wage Ratio: 0.93
Note: All factors are statistically significant at the 10-percent level or better. The results shown are for a one-standard-devia-tion change. Standard errors have been adjusted for state-level clustering. Additional controls not depicted include a vector of year dummy variables.Sources: Authors’ calculations from Hirsch and Macpherson (2001-2008); and the CPS (2001-2008).

Issue in Brief 7
Workforce
One last thought. Some of the literature for the private sector – albeit not for the public sector – sug-gests that unions try to protect their existing workers by limiting the number of employees. The notion here is that the smaller the workforce, the easier it is to preserve wages and benefits.11 To test this hypoth-esis, we estimated an equation to explain the percent of the workforce that is comprised of state and local workers using the following variables:
Unionization. Unionization is again measured as the percent of the public workforce that is a member of a union. If unions do attempt to hold down the num-ber of state and local workers, the coefficient would be negative.
Unemployment rate. Because public sector jobs tend to be more secure than private sector jobs, they are somewhat less affected by economic fluctuations. Thus, when the unemployment rate is high, public workers as a share of the state’s workforce would be greater and the coefficient positive.
Percent of workforce in manufacturing. The notion is that states with a higher percentage of the work-force in manufacturing would have a more extensive private sector. Therefore, the coefficient would be negative.
The results in Figure 9 show some support for the hypothesis that unions hold down the number of public sector workers. On average, state and local workers accounted for 13.5 percent of the workforce. Increasing the percent membership in a union by one standard deviation – that is, bringing it from 33 per-cent to 50 percent – is associated with a 0.82 reduc-tion in that percent.
A Possible Story
The empirical analysis presented above is by no means definitive; rather, it should be viewed as the be-ginning of a conversation. That said, what is the best way to explain what could be going on?
One known fact is that pensions in the public sector are more generous than those in the private sector. That outcome could be the result of pensions being the avenue of least resistance when public employees deal with state and local employers. It is simply easier to offer employees a dollar of future pension benefits than to pay a dollar of wages, given the flexibility that public sector employers have in terms of funding their pension obligations. Interest-ingly, within the public sector, the generosity of the pension formula does not appear to differ between states with high levels of unionization and those with low levels. This result is most likely explained by the fact that pensions are legislated, not bargained,
Figure 9. Impact of Selected Factors on the Percent of the Workforce Employed by the State-Local Sector, 2001-2008
-1.14
0.30
-0.82
-1.5 -1.0 -0.5 0.0 0.5 1.0 1.5
Percent unionized
Unemployment rate
Percent in manufacturing
Statistically significantNot statistically significant
Mean Percent in State/Local Sector: 13.47
-0.47
-0.32
0.41
0.60
0.11
-1 -0.5 0 0.5 1
Note: Solid bars indicate the coefficient is statistically significant at the 10-percent level or better. The results shown are for a one-standard-deviation change. Standard errors have been adjusted for state-level clustering. Additional controls not depicted include a vector of year dummy variables.Sources: Authors’ calculations from Hirsch and Macpherson (2001-2008); and the CPS (2001-2008).
Center for Retirement Research8
and the power to influence legislators is not simply related to membership figures. Particular groups can have disproportionate influence if they are articulate, politically active, locally well-respected, and organized, even if their numbers are small when measured on a statewide basis.
In contrast to pensions, public sector wages are bargained. And the known fact here is that the average wage in the public sector is below that in the private sector, even though public sector workers have more education and experience. Public sector workers likely face substantial resistance to wage in-creases. Such increases are very visible to taxpayers, and politicians may be unwilling to use their capital to argue the case for higher wages. Thus, the degree of success in the bargaining arena may well depend on the strength of union membership.
The last piece of the story is even more tentative – that is, an increase in union membership is associ-ated with a decrease in the relative number of public sector workers. Such a finding would not be surpris-ing in the private sector where, under a monopolistic model of price and quantity setting, studies have shown that unions hold down the number of workers in order to extract wage concessions from employ-ers.12 The results in the public sector, however, are less consistent.13 And union representatives main-tain that they never deliberately try to restrict hiring, and often argue for more adequate staffing to meet program objectives. But given that unions appear to raise wages, reductions in employment would not be unexpected.
Conclusion
This brief has attempted to explain trends in the level of public pension benefits. First, it is instructive to note that the average annual pension benefit in the public sector is $23,000. So while occasional abuses receive a lot of attention, many public employees end up with relatively modest amounts. Second, the extent of public sector union membership appears to have no measurable impact on the generosity of the benefit formula or the trend in benefits over time. This result likely reflects the fact that pensions are legislated, not bargained, and the power to influ-ence legislators depends more on the articulateness and political acumen of the lobbyists than on union membership figures. In contrast, union member-ship appears to have a significant impact on the wage front, where increasing the percent unionized from one-third to one-half raises the ratio of public to private wages by about 3 percentage points. Finally, the results also suggest that unions hold down the number of public sector workers as a share of the workforce.
The big conclusion is that, despite all the recent hoopla, we really know relatively little about the workings of the public sector. In part, this ignorance reflects the fact that state and local activity has never been a sexy subject for academics because the data collection efforts and the need for knowledge of institutional detail are daunting. This brief should be viewed as the first pass at a story; much more work is required to understand the relationship between pen-sion benefits and the role of unions.

APPENDICES

Center for Retirement Research10
Appendix A. Measuring Union Power
Studies looking at collective bargaining in the public sector have traditionally relied on two broad measures of union strength.14
The first is membership, which can be measured in two ways: • Percent of the public workforce that has membership in a union, and;• Percent of the public workforce covered by a union contract.
The first variable only includes workers who pay union dues, while the second captures those who do not pay dues but still benefit from the union contract. Both of these variables come from tabulations of the Current Population Survey’s outgoing rotation files.15
The second broad measure of union strength is labor law. Recent studies have defined this measure by four variables listed in descending order of union strength:• Duty to collectively bargain;• Right to collectively bargain;• Right to work; and• Prohibited from collectively bargaining.
“Duty” states are required by law to negotiate contracts with the union, while “Right” states are allowed, but not required, to bargain. In both cases, the state can either allow or disallow strikes. Right to work states allow public employees the choice of whether or not to join a union and preclude penalties for those who do not join. The most stringent law prohibits any collective bargaining whatsoever. These four variables are reported in the National Bureau of Economic Research’s Public Sector Collective Bargaining Law Data Set.16
A recent study found a strong correlation between membership and labor law. Specifically, union mem-bership is much higher in states where the legal environment is favorable toward unions.17 As data on union membership are available annually, while the legal variables have been collected only until 1996, our analysis uses the simple union membership variable instead of the more complicated legal variables.

Issue in Brief 11
Appendix B. Regression Results
Table B1a. Regression Results on the Average Annual Growth Rate of State-Local Pension Benefits, 1994-1998, 1999-2003, and 2004-2008
Variable Coefficient
Percent unionized 0.01
(0.01)
Funded ratio growth 1.23 ***
(0.39)
Mean reversion 0.81 **
(0.40)
Debt as percent of revenue -0.02 *
(0.01)
Closed plan -2.38 ***
(0.41)
Constant 2.53
(0.71)
R-squared 0.11
Number of observations 150
Notes: Standard errors clustered at the state level are in pa-rentheses. Coefficients are significant at the 10-percent level (*), 5-percent level (**), or 1-percent level (***).Sources: Authors’ calculations from Hirsch and Macpherson (1990-2008); PPD (2001-2003); Public-Employee Retirement Systems (1993-2008); U.S. Census Bureau, State and Local Government Finances (1990-2003); and Zorn (1990-2000).
Table B1b. Summary Statistics for Regression on the Average Annual Growth Rate of State-Local Pension Benefits, 1994-1998, 1999-2003, and 2004-2008
Mean Standard deviation Min Max
Benefit growth 2.29 2.61 -3.08 11.37
Percent unionized 33.68 17.15 7.90 70.48
Funded ratio growth 0.39 0.49 0.00 1.00
Mean reversion 0.49 0.50 0.00 1.00
Debt as a percent of revenue 79.89 20.49 41.79 138.20
Frozen plan 0.04 0.20 0.00 1.00
Sources: Authors’ calculations from Hirsch and Macpherson (1990-2008); PPD (2001-2003); Public-Employee Retirement Sys-tems (1993-2008); U.S. Census Bureau, State and Local Government Finances (1990-2003); and Zorn (1990-2000).

Table B2a. Regression Results on Normal Cost as a Percent of Payroll, 2001-2008
Variable Coefficient
Percent unionized -0.01
(0.01)
Percent in Social Security -0.04 ***
(0.01)
Percent in police & fire plan 0.12 *
(0.06)
Number of systems 0.00 ***
(0.00)
Percent in a closed plan -0.04 ***
(0.01)
Constant 14.39 ***
(0.77)
R-squared 0.35
Number of observations 397
Notes: Standard errors clustered at the state level are in pa-rentheses. Coefficients are significant at the 10-percent level (*) or 1-percent level (***). “Percent unionized” denotes the percent of those state and local workers captured in the PPD who are allowed to collectively bargain under state law. West Virginia is omitted from 2001 through 2003 due to data unavailability. Sources: Authors’ calculations from Freeman and Valletta (1988); PPD (2001-2008); and Public-Employee Retirement Systems (2001-2008).
Table B2b. Summary Statistics for Regression on Normal Cost as a Percent of Payroll, 2001-2008
Mean Standard deviation Min Max
Normal cost 11.70 2.61 1.68 21.31
Percent unionized 71.85 44.96 0.00 100.00
Percent in Social Security 80.77 35.50 0.00 100.00
Number of systems 50.90 136.08 1.00 903.00
Percent in police & fire plan 1.09 2.82 0.00 12.05
Percent in a closed plan 1.64 11.28 0.00 100.00
Sources: Authors’ calculations from Freeman and Valletta (1988); PPD (2001-2008); and Public-Employee Retirement Systems (2001-2008).
Center for Retirement Research12

Issue in Brief 13
Table B3a. Regression Results on the Ratio of State/Local to Private Sector Hourly Wages, 2001-2008
Variable Coefficient
Percent unionized 0.00 ***
(0.00)
Public to private education ratio 1.70 ***
(0.24)
Public to private age ratio 0.30 **
(0.13)
Public to private female ratio -0.13 ***
(0.03)
Percent in manufacturing -0.00 *
(0.00)
Constant -1.12 ***
(0.29)
R-squared 0.32
Number of observations 400
Notes: Standard errors clustered at the state level are in pa-rentheses. Coefficients are significant at the 10-percent level (*), 5-percent level (**) or 1-percent level (***).Sources: Authors’ calculations from Hirsch and Macpherson (2001-2008); and CPS (2001-2008).
Table B3b. Summary Statistics for Regression Results on the Ratio of State/Local to Private Sector Hourly Wages, 2001-2008
Mean Standard deviation Min Max
Public/private wage 0.93 0.09 0.74 1.30
Percent unionized 33.06 17.54 5.20 71.90
Public to private education ratio 1.09 0.02 1.00 1.17
Public to private age ratio 1.04 0.03 0.91 1.15
Public to private female ratio 1.38 0.16 0.93 1.88
Percent in manufacturing 8.39 6.05 0.00 20.43
Sources: Authors’ calculations from Hirsch and Macpherson (2001-2008); and CPS (2001-2008).

Center for Retirement Research14
Table B4a. Regression Results on the Percent of the Workforce Employed by the State and Local Sectors, 2001-2008
Variable Coefficient
Percent unionized -0.05 ***
(0.02)
Unemployment rate 0.23
(0.30)
Percent in manufacturing -0.19 *
(0.10)
Constant 13.73 ***
(1.65)
R-squared 0.18
Number of observations 400
Notes: Standard errors clustered at the state level are in pa-rentheses. Coefficients are significant at the 10-percent level (*) or 1-percent level (***).Sources: Authors’ calculations from Hirsch and Macpherson (2001-2008); and CPS (2001-2008).
Table B4b. Summary Statistics for Regression Results on the Percent of the Workforce Employed by the State and Local Sectors, 2001-2008
Mean Standard deviation Min Max
Percent state/local 13.47 2.52 7.89 23.80
Percent unionized 33.06 17.54 5.20 71.90
Unemployment rate 5.13 1.32 2.30 10.60
Percent in manufacturing 8.39 6.05 0.00 20.43
Sources: Authors’ calculations from Hirsch and Macpherson (2001-2008); and CPS (2001-2008).

Issue in Brief 15
Endnotes
1 On the benefit side, 20 states have adjusted the benefit formula and/or the retirement age for new employees. These changes are limited to new em-ployees because states’ case law or their constitution, as well as political considerations, generally precludes reducing future benefits for current employees. A handful of states have attempted to cut the cost-of-living adjustment (COLA) for current retirees. These actions have resulted in lawsuits; judges in Colorado and Minnesota recently ruled that such cuts were permissible in their states. Meanwhile, 24 states have raised employer and/or employee contributions. See National Conference of State Legislatures (2008-2011) for more details.
2 Wisconsin, Michigan, and Oklahoma have passed laws in 2011 eliminating or curtailing collective bar-gaining of wages and/or benefits. Similar legislation is under discussion in Alaska, Indiana, Iowa, Kan-sas, Massachusetts, Nevada, New Hampshire, Ohio, Tennessee, and Washington. Anti-union bills were recently defeated in Colorado, Nebraska, and New Mexico. See National Conference of State Legisla-tures (2011).
3 U.S. Bureau of Labor Statistics (2010).
4 Zorn (1990-2000).
5 For example, see the history of pension changes in the Arizona State Retirement System (2010); the Teacher Retirement System of Texas (1999); the Tennessee Consolidated Retirement System (2010); and the Wyoming Retirement System (2005).
6 Little Hoover Commission (2011).
7 This finding is consistent with another recent study that also was unable to detect any impact of unions on pensions (Schieber 2011).
8 Because the PPD does not contain information on the unionization of plan members, we rely on the NBER’s Public Sector Collective Bargaining Law Data Set, which can be merged with the PPD based on oc-cupation (general employees, teachers, or police and fire) and jurisdiction (state or locally-administered plan). Plans where members are allowed to collec-tively bargain are assumed to be fully unionized.
9 Munnell et al. (2011).
10 The wage ratio variable is for full-time workers only.
11 See Freeman and Medoff (1984); Freeman and Valletta (1987); and Ehrenberg (1973).
12 See Freeman and Medoff (1984); and Freeman and Valetta (1987).
13 One study finds that the more favorable the legal environment for unions, which the author defines as the adoption of a union contract, the higher the public sector wages and employment (Zax 1985). However, a second study looks at the legal environment and the presence of a union contract separately (Freeman and Valetta 1987). Again, it finds that municipalities with union contracts have higher public wages and a greater number of public employees. But among those municipalities with contracts, strong unions exercise monopoly power, trading lower employment for higher wages. Thus, some precedent exists for the finding of a negative impact of unions on employ-ment, but the results still need more explaining.
14 See Ashenfelter (1971); Belman, Heywood, and Lund (1997); Farber (2005); Freeman (1986); Freeman and Valletta (1987); and Zax (1985).
15 Hirsch and Macpherson (1983-2010) perform these tabulations annually and make them available online.
16 The dataset was originally collected by Valletta and Freeman (1988) for the years 1955 and 1984, and the data were updated through 1996 by Kim Reuben of the Urban Institute. The data contain nuanced infor-mation on the four basic variables described here. 17 Farber (2005) looks at averages across states from 1983 to 2004 and finds that union coverage is 17 percent in states that prohibit collective bargaining versus 50 to 75 percent in states that are required to bargain.
Center for Retirement Research16
References
Ashenfelter, Orley. 1971. “The Effect of Unionization on Wages in the Public Sector: the Case of Fire Fighters.” Industrial and Labor Relations Review 24(2): 191-202.
Arizona State Retirement System. 2010. Comprehen-sive Annual Financial Report for Fiscal Year Ended June 30, 2010.
Belman, Dale, John S. Heywood, and John Lund. 1997. “Public Sector Earnings and the Extent of Unionization.” Industrial and Labor Relations Review 50(4): 610-628.
Ehrenberg, Ronald G. 1973. “The Demand for State and Local Government Employees.” The American Economic Review, 62(3): 366-379.
Farber, Henry S. 2005. “Union Membership in the United States: The Divergence between the Public and the Private Sectors.” Working Paper 503. Princeton, NJ: Industrial Relations Section, Princeton University.
Freeman, Richard B. 1986. “Unionism Comes to the Public Sector.” Working Paper No. 1452. Cambridge, MA: National Bureau of Economic Research.
Freeman, Richard B. and James L. Medoff. 1984. What Do Unions Do? New York, NY: Basic Books.
Freeman, Richard B. and Robert G. Valletta. 1987. “The Effect of Public Sector Labor Laws on Collec-tive Bargaining, Wages, and Employment.” Work-ing Paper No. 2284. Cambridge, MA: National Bureau of Economic Research.
Hirsch, Barry T. and David A. Macpherson. 1983-2010. Union Membership and Coverage Database. Available at: http://www.unionstats.com.
Little Hoover Commission. 2011. Public Pensions for Retirement Security. Milton Marks Commission on California State Government Organization and Economy. Available at: http://www.lhc.ca.gov/studies/204/Report204.pdf.
Munnell, Alicia H., Jean-Pierre Aubry, Josh Hur-witz, and Laura Quinby. 2011. “An Update on Locally-Administered Pension Plans.” Issue in Brief SLP-18. Chestnut Hill, MA: Center for Retirement Research at Boston College.
National Conference of State Legislatures. 2008-2011. “State Pensions and Retirement Legisla-tion 2008-2011.” Washington, DC. Available at: http://www.ncsl.org/Default.aspx?TabID=756&tabs=951,69,140#140.
National Conference of State Legislatures. 2011. “Col-lective Bargaining and Labor Union Legislation Database.” Washington, DC. Available at: http://www.ncsl.org/default.aspx?tabid=22275.
Public Plans Database. 2001-2009. Center for Retire-ment Research at Boston College and Center for State and Local Government Excellence.
Schieber, Sylvester J. 2011. “Political Economy of Public Sector Retirement Plans.” Journal of Pension Economics and Finance 10(2): 269-290.
Teacher Retirement System of Texas. 1999. Compre-hensive Annual Financial Report: Fiscal Year Ended August 31, 1999.
Tennessee Consolidated Retirement System. 2010. Comprehensive Annual Financial Report for Fiscal Year Ended June 30, 2010.
Towers Watson. 2009. “Employer Commitment to Retirement Plans in the United States.” Available at: http://www.towerswatson.com/assets/pdf/649/Employer%20Commitment%20to%20Retire-ment%20Plans%20in%20the%20United%20States%281%29.pdf.
Troy, Leo and Neil Sheflin. 1985. “Union Sourcebook: Membership, Finances, Structure, Directory.” West Orange, NJ: Industrial Relations Data and Information Services.
U.S. Bureau of Labor Statistics. 2010. “Economic News Release: Median Years of Tenure with Cur-rent Employer for Employed Wage and Salary Workers by Industry, Selected Years, 2000-10.” Washington, DC. Available at: http://www.bls.gov/news.release/tenure.t05.htm.

Issue in Brief 17
U.S. Census Bureau. State and Local Government Public-Employee Retirement Systems, 1993-2008. Washington, DC. Available: at http://www.census.gov/govs/retire.
U.S. Census Bureau. State and Local Government Finance, 1990-2008. Washington, DC. Available at: http://www.census.gov/govs/estimate.
U.S. Department of Labor. Current Employment Statis-tics Survey, 1939-1983. Washington, D.C.
Valletta, Robert G. and Richard B. Freeman. 1988. “The NBER Public Sector Collective Bargaining Law Data Set.” Appendix B in Richard B. Freeman and Casey Ichniowski, editors, When Public Em-ployees Unionize. Chicago: NBER and University of Chicago Press.
Vanguard. 2010. “How America Saves 2010: A Report on Vanguard 2009 Defined Contribution Plan Data.” Valley Forge, PA.
Wyoming Retirement System. 2005. Comprehensive Annual Financial Report for Fiscal Year Ended De-cember 31, 2005.
Zax, Jeffrey S. 1985. “Municipal Employment, Munici-pal Unions, and Demand for Municipal Services.” Working Paper No. 1728. Cambridge, MA: Na-tional Bureau of Economic Research.
Zorn, Paul. 1990-2000. Survey of State and Local Government Retirement Systems: Survey Report for Members of the Public Pension Coordinating Council. Chicago, IL: Government Finance Officers Association.

About the CenterThe Center for Retirement Research at Boston Col-lege was established in 1998 through a grant from the Social Security Administration. The Center’s mission is to produce first-class research and educational tools and forge a strong link between the academic com-munity and decisionmakers in the public and private sectors around an issue of critical importance to the nation’s future. To achieve this mission, the Center sponsors a wide variety of research projects, transmits new findings to a broad audience, trains new schol-ars, and broadens access to valuable data sources. Since its inception, the Center has established a repu-tation as an authoritative source of information on all major aspects of the retirement income debate.
Affiliated InstitutionsAmerican Enterprise InstituteThe Brookings InstitutionMassachusetts Institute of TechnologySyracuse UniversityUrban Institute
Contact InformationCenter for Retirement ResearchBoston CollegeHovey House140 Commonwealth AvenueChestnut Hill, MA 02467-3808Phone: (617) 552-1762Fax: (617) 552-0191E-mail: [email protected]: http://crr.bc.edu
© 2011, by Trustees of Boston College, Center for Retirement Research. All rights reserved. Short sections of text, not to exceed two paragraphs, may be quoted without explicit permission provided that the authors are identified and full credit, including copyright notice, is given to Trustees of Boston College, Center for Retirement Research.
The CRR gratefully acknowledges the Center for State and Local Government Excellence (SLGE) for its support of this research. The SLGE (http://www.slge.org) is a proud partner in seeking retirement security for public sector employees, part of its mission to attract and retain talented individuals to public service. The opinions and conclusions expressed in this brief are solely those of the authors and do not repre-sent the opinions or policy of the CRR or the SLGE.
pubplans.bc.edu
Visit our:
Center for Retirement Research18