uniqa group investor presentation · uniqa group investor presentation. 1 ... only bancassurance...
TRANSCRIPT

RCB Institutional Investor ConferenceZürs, 11/12 April 2013
UNIQA GroupInvestor Presentation

1
Presenters and Agenda
AgendaToday’s presenter
1. Business overview
2. Strategy programme UNIQA 2.0
3. Conclusion
Hannes BognerCFO
Andreas BrandstetterCEO
Investor meetings

Business overview
Strategy programme UNIQA 2.0
Conclusion
Appendix: Additional information
Agenda

3
UNIQA at a glance
(a) Based on GWP in 2011(b) Excluding Mannheimer Group (German operations sold in June 2012)(c) As of 4-Apr-13
Source: Company information
• UNIQA is one of the leading international insurance groups in Austria and across CEE
– Second-largest insurer in home market Austria with a market share of 22.2%(a)
– Broad international presence including 19(b) regional markets (excluding Austria)
• Active in all lines of insurance business (Property & Casualty, Health and Life insurance)
• Broad distribution network across a variety of channels
• Long-standing successful bancassurance partnership with Raiffeisen Banking Group
• Strong client access servicing 8.7m customers and 17.4m insurance policies (2012)
• Highly committed core shareholders
• Listed on the Vienna Stock Exchange with a current market cap of €2.3bn(c)

€m 2012 2011 %
Gross written premiums(a) 5,543 5,534 0.2%
(Recurring) gross written premiums(a) 5,010 4,933 1.5%
Investment result 792 202 292.2%
Earnings before tax (including one-offs) 205 (322)(b) nm
Earnings before tax (excluding one-offs) 205 145(b) 41.4%
Net profit(c) 130 (246) nm
Combined ratio (net) 101.3% 104.9% (3.6)ppts
RoS 3.9% nm nm
RoE 9.1% nm nm
Solvency ratio 214.9% 122.5% 92.4ppts
(a) Including savings position of premiums from unit- and index-linked life insurance(b) Including Mannheimer Group: Earnings before tax would have been €(326)m (including one-offs) and €158m (excluding one-offs) respectively(c) Including result from discontinued operations of €10.4m (Mannheimer Group)Note: Numbers excluding Mannheimer Group; FY 2011 numbers restated
409/04/2013 17:56 13bLD0109_Client Pitchbook template_New.pptx
Financial snapshot
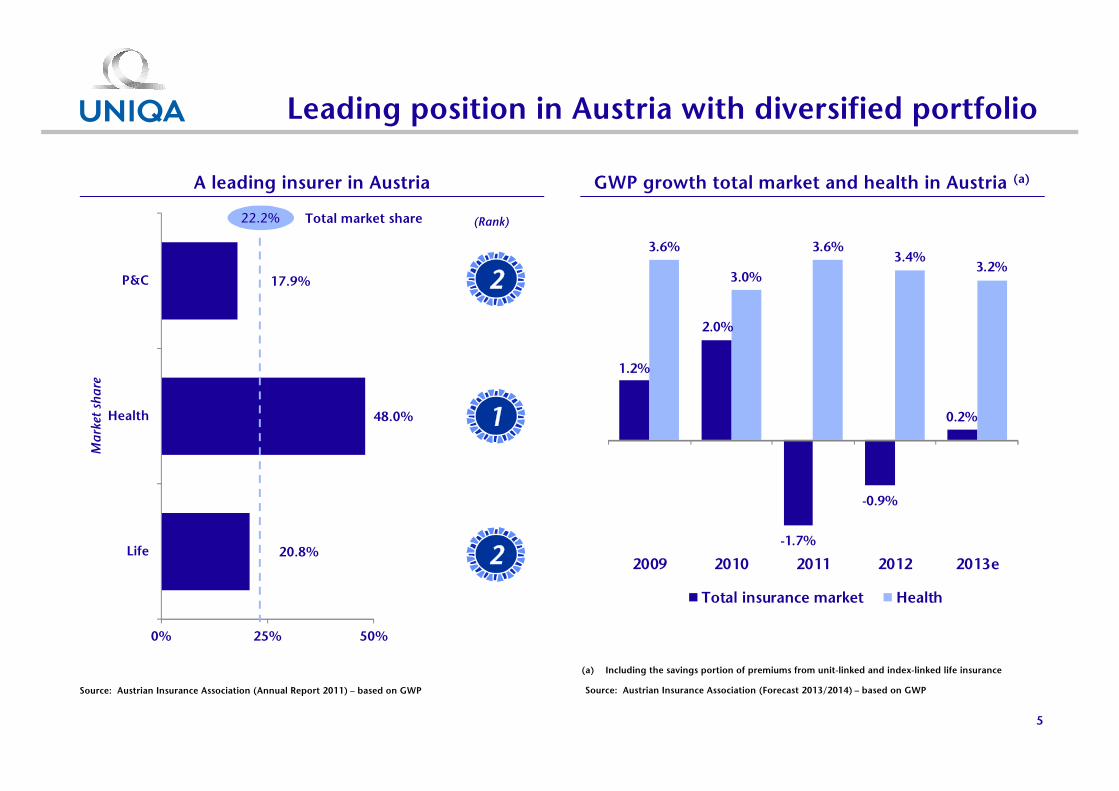
17.9%
48.0%
20.8%
0% 25% 50%
P&C
Health
Life
Ma
rket
sh
are
5
Leading position in Austria with diversified portfolio
2
Source: Austrian Insurance Association (Annual Report 2011) – based on GWP
GWP growth total market and health in Austria (a)A leading insurer in Austria
(a) Including the savings portion of premiums from unit-linked and index-linked life insurance
(Rank)
1
2
22.2% Total market share
Source: Austrian Insurance Association (Forecast 2013/2014) – based on GWP
1.2%
2.0%
-1.7%
-0.9%
0.2%
3.6%
3.0%
3.6%3.4%
3.2%
2009 2010 2011 2012 2013e
Total insurance market Health

138 157 179 215 247
702 730821
855904
814
1725
32
849902
1,0171,095
1,183
2008 2009 2010 2011 2012
Life P&C Health
6
Wide footprint across CEE with strong growth record
Note: In Russia and Slovenia, only bancassurance business
CESEE RussiaEE
(a) GWP excluding single premiums Source: Company information
UNIQA recurring premium volume in CEE (€m) (a)Broad presence in CEE

7
Diversified distribution channels and strong brands
Source: Company information
CEE GWP by distribution channel
Austria GWP by distribution channel
Total Austria GWP 2012: €3,556m
Total CEE GWP 2012: €1,296m
Strong brands in Austria and CEE
• Highest customer reach among all insurance companies
in Austria (31% in 2011)(a)
• UNIQA is the strongest Austrian insurance brand (with
an aided brand awareness of around 93% in 2011)(b)
• Winner of “Most Trusted Brand” Award 2012 in the
category “insurance” – for the tenth time in a row(c)
• UNIQA leading brand across CEE based on unified
brandscape
• Bancassurance partner Raiffeisen Banking Group with
the strongest banking brand in Austria and the strongest
international banking brand in its 17 CEE markets
(a) VMDS(b) Fessel-GfK(c) Reader’s Digest

Business overview
Strategy programme UNIQA 2.0
Conclusion
Appendix: Additional information
Agenda

Strategic framework of UNIQA 2.0presented in May 2011
• We aim to raise our number of customers to 15m by 2020
• In 2012 we serviced 8.7m customers
Increase number of
clients
• Concentration on stable market Austria and growth region CEE
• Diversified business mix across business lines
Concentrate on core insurance
business
• UNIQA Austria: increasing profitability
• Raiffeisen insurance Austria: increasing productivity
• UNIQA International: optimising CEE platform to capture long-term growth
• Risk/return profile: optimisation against the background of Solvency II
Execute 4 priority programs
• Goal to improve profit on ordinary activities by up to €400m by 2015 compared to 2010 (€142m)
Improve profit on ordinary activities
9

10
UNIQA 2.0: 4 priority programmes
Development of profit on ordinary activities (€m)
(a) Adjusted for one-offs (please refer to page 26); unadjusted EBT was a loss of €322m (excluding Mannheimer Group)
Note: 2011 and 2012 figures excluding Mannheimer Group (sold in June 2012)
(a)
142 145
205
2010 2011 2012 2015 (ambition)
Up to €400mimprovement
Restructuring of Austrian business1
Increase productivity of bancassurance in Austria
2
Profitable growth in CEE3
Optimising risk/return profile4

11
Restructuring of Austrian business to increase profitability
1
Note: P&C businesses only. UNIQA Austria (incl. Salzburger Landes-Versicherung AG and UNIQA Versicherungen AG), excl. €105m one-offs
Source: Company analysis
• Reorganisation of the 9 regional offices• Realignment of distribution and processes• Expansion of number of high quality regional
servicing centres from 300 to 400 by 2015• Salesforce effectiveness programme
Optimisation of distribution
network
• Centralisation of back-office functions to 5 locations from 11
• Standardisation and streamlining of processes• Target reduction of back-office headcount
(central and de-central) by 600 by 2015 in the Group, predominantly in Austria
• Partial shift of workforce towards high value-add areas (eg Risk, Corporate Business, ALM)
Reorganisation of back-office
• Simplified corporate structure• Achievement of synergies and regulatory
capital improvements
Simplification of corporate structure
Key initiativesNet cost ratios in Austria (2011)
• Reduction of exposure to unprofitable clients and brokers; restructuring of the fleet portfolio
• Reorganisation of discount system to improve NBM
• Optimisation of claims management
Improvement of underwriting
result
28.5%
25.6%
24.8%
22.2%
UNIQA Austria
Peer 1
Peer 2
Peer 3

Raiffeisen bancassurance
22%
Raiffeisen bancassurance
16%
12
Increase productivity of bancassurance in Austria
Productdensity
• “Best-in-class” Raiffeisen Banks (top 10%) reach productivity of approx. 23 insurance contracts per sales person per year (Raiffeisen sales person average of around 13.5 contracts)
Distribution power
• Further simplification and transparency for “annex” products tailored to Raiffeisen customers
• Further integration of IT systems, bank sales process and claims handling
Tailoredproductrange
Example: Accident insurance
In Austria In CEE
• Distribution via local Raiffeisen Banks through Raiffeisen Versicherung
• Leading retail network with c. 2,200 outlets and c. 4m customers
• Top 3 position in Austria
• Distribution via Raiffeisen Bank International
• Preferred partnership
• > 3,100 branches with c. 14.1m customers
• Top 5 market position in 13 countries
Share of GWP (2012)
2
Significant upside potential in AustriaRaiffeisen at a glance
Source: Raiffeisen Banking Group and UNIQA internal analysis
Note: Figures as of FY 2012
Total: €3,566m Total: €1,296m
~
~
~
60%
30%
10%
No accident insurance
Policies with competitors
Policies with Raiffeisen
Versicherung
16%22%

2,102
1,954
1,071
549
388 363296 275
115 112 105 86 79 77 56 51 36 18
0
500
1,000
1,500
2,000
2,500
EU 27 A SLO CZ SK PL H HR RUS BG MNE RO BiH SRB MK UA KS AL
An
nu
al in
sura
nce
pre
miu
ms
per
ca
pit
a
13
Growth potential in CEE markets
(a) Annual insurance premiums per capita(b) Life Ranking(c) 1-6/2012(d) No ranking as no operations in Slovenia; market is covered out of Austria(e) Data as per 2010Source: Sigma 03/2012, as per 2011; local insurance associations; internal analysis
Austria in 1961 – 1970
Austria in 1974 – 1984
Austria in 1993 – 2004
3
Insurance density(a) (€)
135(c)85474610(b)11612582Ranking UNIQA • Focus on the 16 CEE markets
• Increased investments in own distribution and bancassurance with RBI in CEE
• Implementation of transparent target operating model across CEE
• Roll-out of tied agency model
• Expansion of corporate business
• Consider selective acquisition opportunities
• Ambition for 2020: up to 50% of GWP and 30% – 40% profit before tax from CEE
(d) (e)

14
Optimising the risk/return profile4
Optimisation of reinsurance
• Central group re-insurance via UNIQA Re • Increase of retention rate (subject to adequate
pricing)• Structuring and pricing of reinsurance for local
entities under risk/capital perspective
Centralised asset
management
• Full front-to-back implementation rolled-out in key markets
• Envisaged roll-out in further countries
Best-in-class data
management system
• Implementation of a group-wide integrated data warehouse
• Comprehensive risk monitoring system available on group and local entity level
ALM
• Set-up of ALM process for group and all local entities
• Implementation of internal risk/return evaluation of non-life portfolio
Solvency II• Optimisation of existing portfolio and new business
• Product/capital strategy
Funds under own management (31 December 2012) Key initiatives
Development of exposure to PIIGS (€m)
Total : €21bn
Bonds71.4%
Cash10.2%
Real estate9.0%
Equities3.1%
Alternatives3.0% Participations
3.3%
892 790636 672
224 280290 197
153 15559 68
63 56
245105
1,578
1,386
986 937
Jun 11 Dec 11 Jun 12 Dec 12
Italy Ireland Spain Portugal Greece

15
What have we achieved so far?
Simplifiedcorporate structure
(a) European Bank for Reconstruction and Development, transaction completed in June 2012(b) Operations are derecognized as of 30 June 2012
• Strengthen balance sheet structure to capture short-term opportunities (buy-out of EBRD(a) minorities, M&A) and finance organic growth
– Rights issue of €500m successfully completed
Rights issue 2012
“Re-IPO”
UNIQA 2.0 priority
programmes
• Clear and less complex Group structure as basis for UNIQA 2.0 success
– Sale of German Mannheimer Group completed(b)
– Buy-out of EBRD minorities in CEE completed
– Contribution in kind of stake in UNIQA Personenversicherung AG and creation of a new single non-life and life insurance entity “UNIQA Austria” completed
– Closing of sale of Hotel Group (AHI) completed in Q1 2013
– Sale of media investments completed, stake in private hospitals increased to 100%
• Strengthen balance sheet and create strategic flexibility for mid- to long-term growth and upcoming consolidation in core markets
– Significant public offering envisaged
– Leading to a substantial increase of the free float in UNIQA
on track
• Ongoing focus on cost optimisation and profitable growth as part of UNIQA 2.0 initiative
– Reorganisation of regional structure in Austria on-going
– Cooperation agreements with Raiffeisen Landesbanken defining new form of cooperation signed in Q3 12
– Optimisation of CEE platform to fully capture long-term growth trends
– Optimise risk/return profile (exposure to Greece and Portugal already reduced to zero)
on track

Business overview
Strategic plan ‘UNIQA 2.0’
Conclusion
Appendix: Additional information
Agenda

17
Summary of FY 2012 results and outlook 2013
• Stable and sound underlying core operating business despite challenging market environment
• Continuing positive growth trend in P&C and Health partly offsets planned cutback of single premium business in Austria and Poland
• In FY 2012 UNIQA achieved earnings before tax of €205.4m (exceeding 2010 EBT by 44.9%)
• Ongoing focus on cost optimisation and profitable growth as part of UNIQA 2.0 initiative
• Target of further improvement in 2013 profit on ordinary activities compared with 2012. This assumes that the capital market environment will be stable, that economic development will continue to improve and that losses caused by natural disasters will remain within a normal range

18
Investment highlights
09/04/2013 17:56
Attractive combination of:
• Short-term restructuring play
• Mid-to long-term CEE growth story
• Leading position in Austria
• Strong upside from ongoing restructuring programme in Austria
• Wide footprint across CEE with strong profitable growth outlook
• Preferred bancassurance partnership with Raiffeisen Banking Group
• Powerful brands in Austria and CEE

Business overview
Strategic plan ‘UNIQA 2.0’
Conclusion
Appendix: Additional information
Agenda

100142 145
205
(322)
(322)
2009 2010 2011 2012
752
872
202
792
2009 2010 2011 2012
+292.2%
102.2
105.4 104.9
101.3
2009 2010 2011 2012
(3.6)ppts
4,884 5,140 4,933 5,010
855 1,084 601 533
5,739 6,224
5,534 5,543
2009 2010 2011 2012
Recurring premiums Single premiums
0.2%
2009/04/2013 17:56 13bLD0109_Client Pitchbook template_New.pptx
Key financials – FY 2012 results
GWP(a) (€m) Combined ratio (net) (%)
Investment result (€m) Earnings before tax (€m)
(a) Including savings portion of premiums from unit- and index-linked life insurance(b) Excluding Mannheimer Group (sold in June 2012)
(c) Adjusted for one-offs (refer to page 26)
(c)
(b) (b)
(b) (b)
(b) (b)
(b) (b)

2109/04/2013 17:56 13bLD0109_Client Pitchbook template_New.pptx
Premium growth: business segments
2,546
5,543909
1,555
533
+5.6%
+3.3%
(5.4)%
(11.2)% 0.2%
P&C Health Life – recurring Life – single premiums
Group
• The premium volume written in property and casualty
insurance grew by 5.6% to €2,546m
• The premium volume written in health insurance increased by
3.3% to €909m
• In life insurance, the premium volume written decreased by
7.0% to €2,088m
– Recurring premiums decreased by 5.4% to €1,555m
– Single premiums fell by 11.2% to €533m mainly impacted
by the decrease in Austria and Poland. In Austria, single
premium business was hit by adverse changes to the legal
framework. In Poland, UNIQA is consciously reducing
single premium business and is promoting more
profitable business areas which also tie up less risk capital
– Strategy to focus on life insurance products that are more
profitable in the long term and are at the same time
optimised from a risk and capital perspective
Note: Premiums written incl. the savings portion of premiums from unit- and index-linked life insurance; excluding Mannheimer Group
Recurring premiums: €5,010m (+1.5%)
Premiums by business segment (2012 vs 2011) (€m)

(3.2)%
+4.5%
+12.0% +0.2%
AT CEE WE Group
3,556
1,296
681
5,543
2209/04/2013 17:56 13bLD0109_Client Pitchbook template_New.pptx
Premium growth: regions
• In Austria, premiums written decreased by 3.2% to €3,566m
due to lower single premiums in life insurance
– Recurring premiums in Austria also declined by 2.0% to
€3,474m
– Single premiums declined by 34.2% to 92m due to the
extension of the minimum term of tax advantageous life
insurance policies implemented during 2011
• In Central and Eastern Europe, premiums written increased by
4.5% to €1,296m
– Recurring premiums strongly increased by 8.0% to
€1,183m
– In contrast, single premiums declined significantly
(especially in Poland) by 22.6% to €112m
• Premium volume in Western Europe (excluding Mannheimer
Group) strongly rose by 12.0% to €681m
– Recurring premiums increased strongly by 20.6% to
€352m
– Single premiums rose by 4.2% to €329m
Gross written premiums by region (2012 vs 2011) (€m)
Note: Premiums written incl. the savings portion of premiums from unit- and index-linked life insurance; CEE = Central Eastern Europe, WE = Western Europe (excluding Mannheimer Group)

36.9%
16.4%
20.5%
26.8%
32.9%
15.3%
19.9%
25.0%
P&C Health Life Group P&C Health Life Group
2011 2012
914 956
498
(6.6)%
363
1,413
1,319
Acquisition cost Other operating expenses
2011 2012
2309/04/2013 17:56 13bLD0109_Client Pitchbook template_New.pptx
Operating expenses
Operating expenses (net) (€m) Cost ratio (net)
(1.8)ppt
• Total operating expenses for the insurance business less reinsurance commissions received decreased by 6.6% to €1,319m
• Acquisition expenses increased by 4.5% to €956m
• Other operating expenses (administration costs) less reinsurance commissions received declined significantly by 27.1% to €363m
• The Group cost ratio decreased in 2012 to 25.0% (-1.8ppt)
Note: Figures in charts are net of the effect of reinsurance commissions and profit shares from reinsurance business ceded amounting to €35.7m
+4.5%
(27.1)%

65.8% 68.0% 66.6% 68.4%
35.4%36.9%
31.5%32.9%
101.2%104.9%
98.1%101.3%
100%
2011 gross
2011net
2012 gross
2012net
Loss ratio Cost ratio
• Net claims ratio rose slightly to 68.4% (+0.4ppt) due to an increase in major claims and some NatCat claims
• Operating expenses improved to 32.9% (-4.0ppt)
• Net combined ratio after reinsurance improved in 2012 from 104.9% to 101.3% (-3.6ppt)
• Gross combined ratio decreased correspondingly from 101.2% to 98.1% (-3.1ppt)
2409/04/2013 17:56 13bLD0109_Client Pitchbook template_New.pptx
Combined ratio (P&C)
(3.6)ppt

81%
19%
Total: €26.3bn
250207 215 200
175
103
(131)
80
200 204 218170
Q1 2010
Q2 2010
Q3 2010
Q4 2010
Q1 2011
Q2 2011
Q3 2011
Q4 2011
Q1 2012
Q2 2012
Q3 2012
Q4 2012
2509/04/2013 17:56 13bLD0109_Client Pitchbook template_New.pptx
Investment activity
Main portfolio financial assets Unit-linked financial assets
Investment income (€m)
Note: Excluding unit-linked
Investment breakdown
2011 2012
• The net investment income strongly increased to €792m due
to good performance on capital markets in 2012 while 2011
figures were impacted by write-down on Greek bonds
• The investment portfolio of the UNIQA Group amounted to
€26.3bn at 31 December 2012, an increase of 6.9% compared
to 31 December 2011
(a) Excluding German Mannheimer Group
(a) (a)(a) (a)
Total 2011: 227m/202m(a)
Total 2012: €792m(a)
82%
18%
Total: €24.6bn
(a)

Bonds71.0%
Real estate9.3%
Cash8.4%
Alternatives3.9%
Equities3.8% Participations
3.6%
2609/04/2013 17:56 13bLD0109_Client Pitchbook template_New.pptx
By product By rating
Investment allocation
Note: Excluding unit-linked
Total 2011: €20bn
Total 2012: €21bn
Bonds71.4%
Real estate9.0%
Cash10.2%
Alternatives3.0%
Equities3.1% Participations
3.3%
27.0%
14.0%
24.0%
20.9%
12.3%
1.7%
25.9%
16.0%
21.3%22.6%
11.0%
3.3%
AAA AA A BBB <BBB Not rated
2011 2012

2709/04/2013 17:56 13bLD0109_Client Pitchbook template_New.pptx
Income statement
€m 2012 2011 %
Premiums written (retained) 4,651 4,703 (1.1)%
Premiums earned (retained) 4,624 4,665 (0.9)%
Income from fees and commissions 36 29 22.1%
Net investment income 792 202 292.2%
Other income 47 77 (39.4)%
Total income 5,498 4,973 10.6%
Insurance benefits (3,759) (3,658) 2.8%
Operating expenses (1,355) (1,442) (6.0)%
Other expenses (123) (139) (11.6)%
Amortisation of goodwill (25) (24) 3.2%
Total expenses (5,261) (5,263) (0.0)%
Operating profit 236 (290)
Financing costs (31) (32) (3.2)%
Profit on ordinary activities 205 (322) nm
Profit on discontinued operations post tax 10 1 nm
Taxes (45) 78 nm
Net profit 170 (244) nm
of which consolidated profit 130 (246) nm
of which minority interests 40 2 nm

2809/04/2013 17:56
Balance sheet
Assets
€m 2012 2011 %
Tangible assets 307 384 (20.0)%
Land and buildings held as financial investments 1,691 1,567 7.9%
Intangible assets 1,414 1,500 (5.7)%
Shares in associated companies 530 530 (0.2)%
Investments 17,866 17,172 4.0%
Investments held on account and at risk of life insurance policyholders
5,067 4,396 15.3%
Share of reinsurance in technical provisions 606 684 (11.4)%
Share of reinsurance in technical provisions held on account and at risk of life insurance policyholders
409 406 0.8%
Receivables including receivables under insurance business
936 988 (5.2)%
Receivables from income tax 55 51 6.7%
Deferred tax assets 134 206 (35.2)%
Liquid funds 960 683 40.5%
Assets from discontinued operations 64 0 nm
Total assets 30,037 28,568 5.1%
Liabilities
€m 2012 2011 %
Total equity 2,018 1,096 84.2%
Subordinated liabilities 450 575 (21.7)%
Technical provisions 19,791 19,888 (0.5)%
Technical provisions for life insurance policies held on account and at risk of life insurance policyholders
4,983 4,318 15.4%
Financial liabilities 35 74 (52.6)%
Other provisions 916 788 16.2%
Payables and other liabilities 1,434 1,518 (5.5)%
Liabilities from income tax 29 19 49.1%
Deferred tax liabilities 371 292 27.1%
Liabilities from discontinued operations 11 0 nm
Total equity and liabilities 30,037 28,568 5.1%

2909/04/2013 17:56 13bLD0109_Client Pitchbook template_New.pptx
P&L regions
Premiums earned (retained)
Claims/insurance benefits Operating expenses
Profit on ordinaryactivities
€m 2012 2011 % 2012 2011 % 2012 2011 % 2012 2011 %
Austria 2,868 3,039 (5.6)% (2,557) (2,438) (4.9)% (798) (930) (14.2)% 153 (266) nm
WE 1,076 986 9.2% (790) (791) (0.1)% (320) (254) 26.0% 49 3 nm
CE
Poland 209 237 (12.0)% (149) (186) (20.1)% (91) (85) 6.8% 5 2 205.4%
Hungary 61 66 (8.2)% (19) (27) (27.6)% (66) (63) 4.2% (3) (6) (56.2)%
Czech Republic 124 122 1.9% (77) (73) 5.3% (70) (66) 5.2% 5 5 (1.8)%
Slovakia 54 52 4.1% (28) (29) (1.9)% (36) (34) 4.3% 9 8 23.0%
EE
Ukraine 64 42 52.7% (28) (20) 41.8% (40) (28) 41.6% (1) (1) (10.7)%
Romania 52 57 (8.1)% (35) (48) (27.4)% (40) (36) 13.4% (6) (27) (78.4)%
SEE
Bulgaria 35 33 7.8% (23) (22) 2.9% (23) (21) 9.3% (3) (3) (13.5)%
Serbia 30 29 3.8% (18) (19) (2.3)% (17) (17) (0.8)% 1 (3) nm
Croatia 20 20 (2.4)% (15) (16) (2.2)% (12) (13) (9.2)% 1 (0) nm
Bosnia 18 17 8.2% (12) (11) 15.0% (8) (8) (0.8)% 1 0 119.7%
Albania 17 16 11.1% (8) (8) (5.5)% (9) (8) 16.9% 2 1 91.0%
Kosovo 9 7 22.8% (3) (3) (1.9)% (5) (4) 20.9% 1 0 716.2%
Macedonia 8 6 28.8% (3) (3) (5.7)% (6) (4) 48.4% (0) 0 nm
Montenegro 7 6 23.7% (3) (3) 25.1% (5) (4) 20.1% (0) (1) (61.6)%
Russia 43 26 60.5% (23) (14) 63.5% (21) (16) 32.0% 1 (2) nm
Others – – – – (0) (0) nm (0) (0) nm
Consolidation (72 ) (96) (25.7)% 35 54 (34.6)% 211 149 40.9% (10) (31) (68.6)%
Total 4,624 4,665 (0.9)% 3,759 3,658 2.8% (1,355) 1,442 nm 205 (322) nm

3009/04/2013 17:56 13bLD0109_Client Pitchbook template_New.pptx
Product lines
Premiums earned (retained) Claims/Insurance benefits Operating expenses
Profit on ordinary activities
€m 2012 2011 % 2012 2011 % 2012 2011 % 2012 2011 %
P&C 2,403 2,257 6.4% (1,644) (1,529) 7.5% (798) (844) (5.4)% (20) (137) (85.2)%
Health 903 874 3.4% (757) (738) 2.5% (139) (143) (3.3)% 107 (17) nm
Life 1,328 1,542 (13.9)% (1,364) (1,391) (2.0)% (421) (457) (8.0)% 119 (172) nm
Consolidation (10) (8) 20.1% 7 1 571.5% 3 2 10.6% (1) 4 nm
Total 4,624 4,665 (0.9)% (3,759) (3,658) 2.8% (1,355) (1,442) (6.0)% 205 (322) nm
3109/04/2013 17:56 13bLD0109_Client Pitchbook template_New.pptx
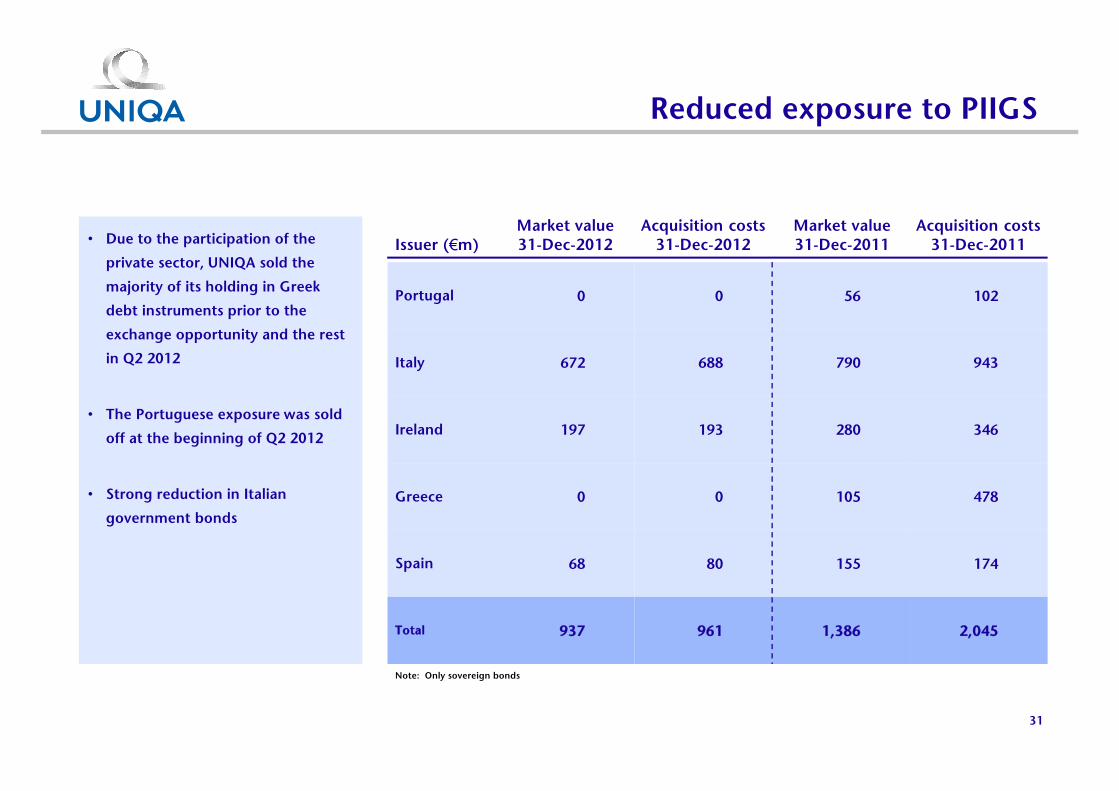
Reduced exposure to PIIGS
Issuer (€m)Market value31-Dec-2012
Acquisition costs31-Dec-2012
Market value 31-Dec-2011
Acquisition costs 31-Dec-2011
Portugal 0 0 56 102
Italy 672 688 790 943
Ireland 197 193 280 346
Greece 0 0 105 478
Spain 68 80 155 174
Total 937 961 1,386 2,045
• Due to the participation of the
private sector, UNIQA sold the
majority of its holding in Greek
debt instruments prior to the
exchange opportunity and the rest
in Q2 2012
• The Portuguese exposure was sold
off at the beginning of Q2 2012
• Strong reduction in Italian
government bonds
Note: Only sovereign bonds

1,096
2,018
(197)
(59)
524
242
36052
Equity 2011 Subscribed capital and capital reserves
Revenue reserves Revaluation reserves
Total profit Minority interests Other Equity 2012
3209/04/2013 17:56 13bLD0109_Client Pitchbook template_New.pptx
Equity position (including minority interest)
+€654m
+€922m
123% 215%
Solvency I ratio

Provisions for employee benefits
Expansion of pension scheme
Other restructuring costs including consulting costs, IT and other employee costs
Impairments on participations/holdings and real estate
Write-down on Greek government bonds
Positive effect from change in re-insurance strategy
Share of write-down on Greek government bonds in MannheimerGroup
3309/04/2013 17:56
Several one-time items affected the results in 2011
Personnel costs €(75)m
Pension scheme €(30)m
Other restructuring costs €(26)m
Impairments €(45)m
Write-down on Greek bonds €(348)m
Extraordinary income €40m
Total €(484)m
Impact sale of MannheimerGroup
€17m
Total (excl Mannheimer) €(467)m
1
2
3
4
5
Restructuring costs:
€(131)m
6
1
2
3
4
5
6

3409/04/2013 17:56
Simplified Group structure
Structure before Autumn 2012 New structure (Autumn 2012)
100%
63.4%(a)
100%
49%
100%
UNIQAInternational AG
UNIQAVersicherungen AG
51%
UNIQASachversicherung AG
UNIQAPersonenversicherung AG
RaiffeisenVersicherung AG
FINANCE LIFE Lebensversicherung AG
CALL DIRECTVersicherung AG
UNIQAVersicherungen AG
Raiffeisen Versicherung AG
100%
UNIQA Österreich Versicherungen AG(a)
100%
UNIQAInternational AG
100%(b)
FINANCE LIFE Lebensvers. AG
50%
(a) 36.6% Austria Privatstiftung and Collegialität Versicherung auf Gegenseitigkeit(b) 25% via Raiffeisen Versicherung AG
(a) Former UNIQA Personenversicherung AG, UNIQA Sachversicherung AG and CALL DIRECT Versicherung AG
(b) 25% via Raiffeisen Versicherung AG
Salzburger Landes-Versicherung AG
100%
Salzburger Landes-Versicherung AG
100%
100%(b)
50%

35
Risk management as a key focus area
Risk management organisation and culture
• UNIQA-wide risk management governance including stable risk management processes
• Risk management information is part of every management and supervisory board meeting
• Employee awareness through special training and ongoing communication
Risk management tools
• ALM process for optimising the ALM mismatch risk
• Group-wide partial internal model for the risk/return management of the P&C portfolio
• Integration of the standard approach calculation with SimCorp
• Set-up of a group-wide data warehouse for Solvency II (for internal as well as external purposes)
Risk management measurements
• Proactive management of market and ALM risk
• Launch of profit testing guidelines for the life business
• Ongoing monitoring of possible market-based threats to protect the equity base

36
UNIQA's management team
Andreas BrandstetterCEO
Hannes BognerCFO
• Appointed Chairman of the Management Board and CEO of the Company in 2011
• Before that, from 2010 until 2011, he was Deputy CEO and, from 2003 until 2010, Member of the Management Board, responsible for new markets, mergers and acquisitions and bancassurance
• From 2002 until 2003 he was a Deputy Member of the Management Board within the area of international markets and, from 2000 until 2002, he was company secretary
• Holds a master’s degree in business and administration (MBA) from California State University, Hayward (CSUH/IMADEC) and master’s and doctorate degrees in political science from the University of Vienna
• Appointed Chief Financial Officer (CFO) of the Company in 1999. His responsibilities as a member of the Management Board comprise Group Finance and as from July 2011 also Group Asset Management
• Joined the Group in 1994. Before his appointment to the Management Board of UNIQA Versicherungen AG in 1999 he was a Deputy Member of the Management Board of Bundesländer Versicherung AG and Austria Collegialität Versicherung AG
• He is a certified accountant and previously worked as a tax adviser and senior manager with international audit firms including KPMG and PwC
• Graduated from Innsbruck University in 1983 with a master’s degree in business administration, specializing in accounting, tax and controlling

37
UNIQA's management team (continued)
Wolfgang KindlUNIQA International
Thomas MünkelCOO
• Member of the Company's Management Board since 2011
• Appointed Chairman of the Management Board and CEO of UNIQA International Versicherungs-Holding AG in 2011
• From 2005 until 2011, he was managing director of UNIQA International Versicherungs-Holding GmbH and UNIQA International Beteiligungs-Verwaltungs GmbH, CEO of Swiss based UNIQA Assurances SA (from 2000 until 2004), area manager for Western Europe at UNIQA International Versicherungs-Holding GmbH (from 1999 until 2000) and area manager for Western Europe at BARC Versicherungs-Holding AG (from 1997 until 1999). From 1996 to 1997, he started his career at Bundesländer-Versicherungen AG in the HQ Sales Department
• Attended a postgraduate programme in environmental management at the Danube University in Lower Austria and holds a master’s degree of advanced studies (MAS). He is a graduate from the Vienna University of Business and Economics (Wirtschaftsuniversität Wien) and holds master’s and doctorate degrees in social and economic sciences
• Appointed as Chief Operating Officer (COO) of the Company in January 2013. His main tasks are aligning the processes and the organisation across the Group to future requirements. He heads Group IT, the Group Project Office and establishes the Group OPEX-team
• From 2010 until 2012 he was Chief Governance Officer at Allianz SE responsible for the group-wide corporate governance. From 2005 until 2010 he was Chief Administrative Officer at Allianz SE and from 2001 until 2004 he was a member of the Management Board of Allianz Versicherungen AG Berlin. From 1993 until 2000 he was a member and later chairman of the Management Board of Allianz pojistovna a.s. in Prague and Allianz poistovna a.s. in Bratislava (until 1998)
• He attended Heidelberg University in Germany and holds a master degree in psychology and is an INSEAD Fontainebleau alumni

38
UNIQA's management team (continued)
Kurt SvobodaCRO
• Appointed Chief Risk Officer (CRO) of the Company in 2011
• His main responsibilities at the Company lie within the area of investments back-office, Group actuarial services, Group controlling and value based management (VBM) including compliance, risk management and asset management as well as reinsurance
• Before that, from 2003 until 2011, he was managing director of UNIQA Finanz Service GmbH. Before joining the UNIQA Group he was head of finance at AXA Austria/Hungary/ Liechtenstein. From 1996 until 2001 he was deputy head of accounting at Vienna Insurance Group and from 1992 until 1996 he worked for KPMG Austria GmbH
• Attended an international management course (IMEA) at the University of St. Gallen and holds a master’s degree in business and administration from the University of Business and Economics Vienna (Wirtschaftsuniversität Wien)

0.40 0.40
0.00
0.25
2009 2010 2011 2012
3909/04/2013 17:56 13bLD0109_Client Pitchbook template_New.pptx
Shareholder information and contacts
General information Contact details
Dividend per share (in €)
• Listed since 1999 on the Vienna Stock Exchange
• 214.2m common shares
• ISIN: AT0000821103
UNIQA Group
Investor Relations
Michael Oplustil, Stefan Glinz
Address: Untere Donaustrasse 21, 1029 Wien
Tel.: (+43) 1 21175-3773
Fax.: (+43) 1 21175-793773
Email: [email protected]
Payout ratio
211% 41%133%
NAV per share (in €)
(a) Management board proposal; subject to shareholders approvalSource: Company information
-
(a)

40
Disclaimer
This presentation (the "Presentation"), and the information contained therein, is not directed to, or intended for viewing, release, distribution, publication or use by (directly orindirectly, in whole or in part), any person or entity that is a citizen of, or resident or located in, the United States, Australia, Canada or Japan or any jurisdiction where applicablelaws prohibit its viewing, release, distribution, publication or use.
This Presentation is being provided for information purposes to selected recipients only and does not constitute or form part of, and should not be construed as an offer or invitationor recommendation to, purchase or sell or subscribe for, or any solicitation of any offer to purchase or subscribe for any securities in UNIQA Versicherungen AG, a stock corporationorganized under Austrian law (the "Company"), in any jurisdiction. Neither the Presentation, nor any part of it nor anything contained or referred to in it, nor the fact of itsdistribution, should form the basis of or be relied on, in connection with, or act as an inducement in relation to, a decision to purchase or subscribe for or enter into any contract ormake any other commitment whatsoever in relation to any such securities.
The contents of this Presentation and any information relating to the Company received (whether in written or oral form) are confidential and may not be copied, distributed,published or reproduced, directly or indirectly, in whole or in part, or disclosed or distributed by recipients to any other person.
The information contained in this Presentation has been provided by the Company and has not been verified independently. Unless otherwise stated, the Company is the source ofinformation.
No reliance may be placed for any purpose whatsoever on the information or opinions contained in the Presentation or on its completeness, accuracy of fairness. No representationor warranty, express or implied, is made or given by or on behalf of the Company or any of its respective directors, officers, employees, agents or advisers as to the accuracy,completeness or fairness of the information or opinions contained in the Presentation and no responsibility or liability is accepted by any of them for any such information oropinions. In particular, no representation or warranty is given as to the achievement or reasonableness of, and no reliance should be placed on any projections, targets, estimates orforecasts contained in this Presentation and nothing in this Presentation is or should be relied on as a promise or representation as to the future.
This Presentation contains forward-looking statements based on the currently held beliefs and assumptions of the management of the Company, which are expressed in good faithand, in their opinion, reasonable. Forward-looking statements involve known and unknown risks, uncertainties and other factors, which may cause the actual results, financialcondition, performance, or achievements of the Company, or industry results, to differ materially from the results, financial condition, performance or achievements expressed orimplied by such forward-looking statements. Given these risks, uncertainties and other factors, recipients of this document are cautioned not to place undue reliance on theseforward-looking statements.
All features in this Presentation are current at the time of publication but may be subject to change in the future. The Company disclaims any obligation to update or revise anystatements, in particular forward-looking statements, to reflect future events or developments.
Statements contained in this Presentation regarding past events or performance should not be taken as a guarantee of future events or performance.
Prospective recipients should not treat the contents of this Presentation as advice relating to legal, taxation or investment matters, and are to make their own assessmentsconcerning such matters and other consequences of a potential investment in the Company and its securities, including the merits of investing and related risks.
In receiving any information relating to the Company (whether in written or oral form), including information in this Presentation, you will be deemed to have represented andagreed for the benefit of the Company (i) that you will only use such information for the purposes of discussions with the Company, (ii) to hold such information in strict confidenceand not to disclose it (or any discussions with the Company) to any person, except as may be required by law, regulation or court order, (iii) not to reproduce or distribute (in wholeor in part, directly or indirectly) any such information, (iv) that you are permitted, in accordance with all applicable laws, to receive such information, and (v) that you are solelyresponsible for your own assessment of the market position of the Company and that you will conduct your own analysis and be solely responsible for forming your own view of thepotential future performance of the Company's business.