unit 1 *gby12* higher tier - revision science
TRANSCRIPT

General Certificate of Secondary Education2018
Biology
Unit 1Higher Tier
[GBY12]FRIDAY 8 JUNE, MORNING
*28GBY1201*
*28GBY1201*
11253.05 R
*GBY12*
TIME1 hour 30 minutes.
INSTRUCTIONS TO CANDIDATESWrite your Centre Number and Candidate Number in the spaces provided at the top of this page.You must answer the questions in the spaces provided. Do not write outside the boxed area on each page or on blank pages.Complete in black ink only. Do not write with a gel pen.Answer all twelve questions.
INFORMATION FOR CANDIDATESThe total mark for this paper is 100.Figures in brackets printed down the right-hand side of pages indicate the marks awarded to each question or part question.Quality of written communication will be assessed in Questions 4 and 10(b).
Centre Number
Candidate Number
*GBY12*

*28GBY1202*
*28GBY1202*
11253.05 R
1 (a) A plant seedling received bright light from one side.
The diagram shows the plant seedling at the start and after 24 hours.
light light
At start After 24 hours
Look at the diagram.
(i) Name this response to light.
______________________________________ [1]
(ii) Name the plant hormone which brings about this response.
_____________________________________ [1]
(iii) Explain how this response is brought about.
_______________________________________________________________
_______________________________________________________________
_______________________________________________________________
_______________________________________________________________
_______________________________________________________________
_____________________________________________________________ [2]
(b) Give one commercial use of plant hormones.
______________________________________________________________ [1]
*28GBY1203*
*28GBY1203*
11253.05 R[Turn over
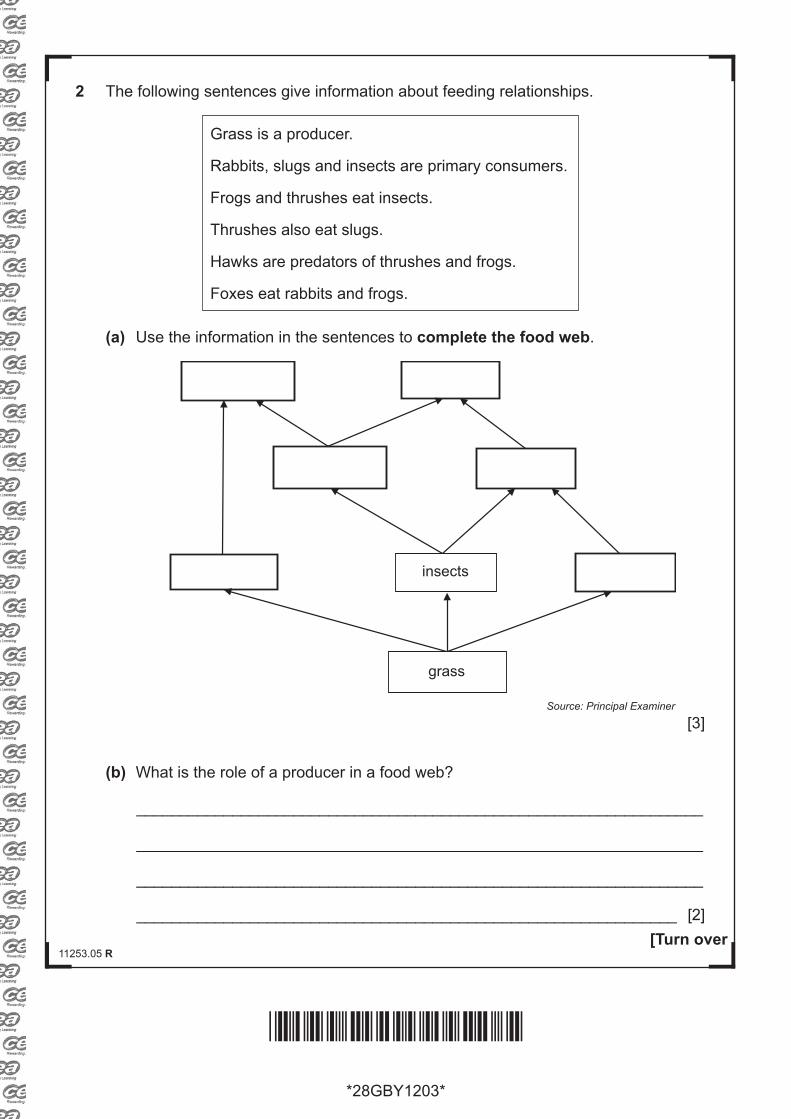
2 The following sentences give information about feeding relationships.
Grass is a producer.
Rabbits, slugs and insects are primary consumers.
Frogs and thrushes eat insects.
Thrushes also eat slugs.
Hawks are predators of thrushes and frogs.
Foxes eat rabbits and frogs.
(a) Use the information in the sentences to complete the food web.
grass
insects
Source: Principal Examiner
[3]
(b) What is the role of a producer in a food web?
_________________________________________________________________
_________________________________________________________________
_________________________________________________________________
______________________________________________________________ [2]

*28GBY1204*
*28GBY1204*
11253.05 R
3 The photograph shows a section of a leaf viewed under a microscope.
A pupil made a drawing of this leaf section.
Photograph of leaf section Drawing of leaf section
(a) Complete the drawing of this leaf section. [3]
(b) On the drawing, label with a line a:
palisade mesophyll cell.
guard cell. [2]
© Principal Examiner

*28GBY1205*
*28GBY1205*
11253.05 R[Turn over
BLANK PAGE
DO NOT WRITE ON THIS PAGE
(Questions continue overleaf)
*28GBY1206*
*28GBY1206*
11253.05 R
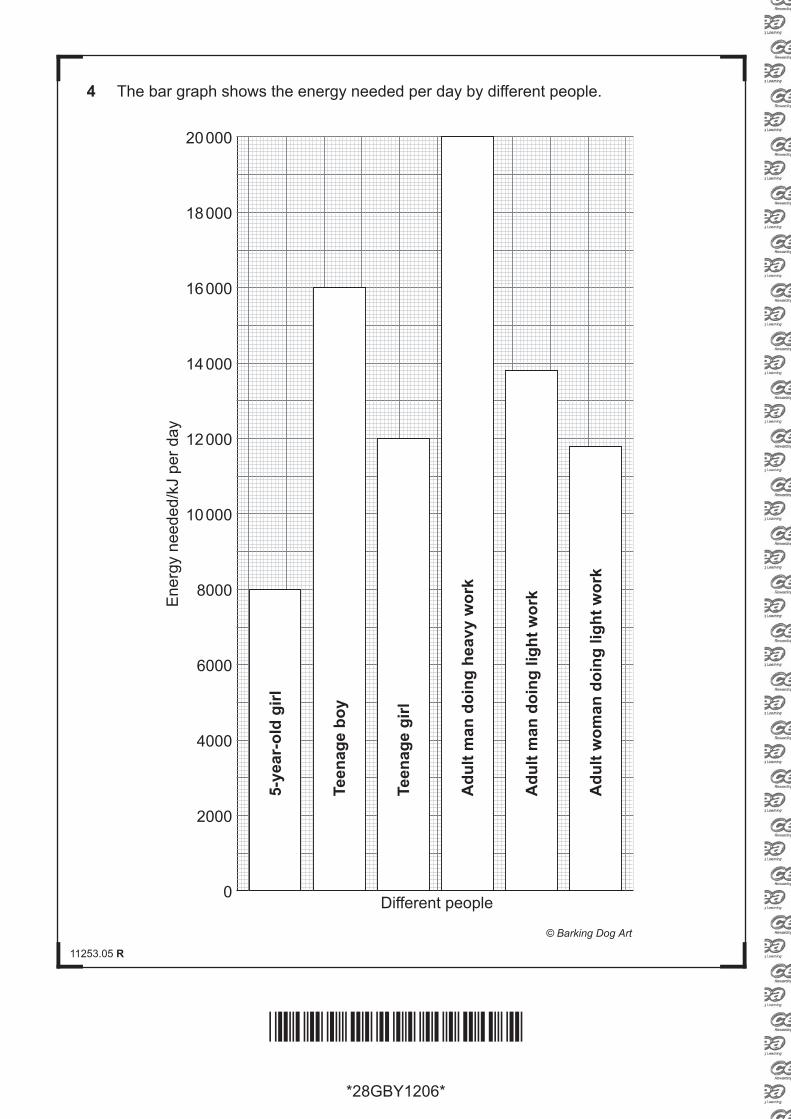
4 The bar graph shows the energy needed per day by different people.
5-ye
ar-o
ld g
irl
Teen
age
boy
Teen
age
girl
Adu
lt m
an d
oing
hea
vy w
ork
Adu
lt m
an d
oing
ligh
t wor
k
Adu
lt w
oman
doi
ng li
ght w
ork
20 000
18 000
16 000
14 000
12 000
10 000
8000
6000
4000
2000
0
Ene
rgy
need
ed/k
J pe
r day
Different people
© Barking Dog Art

*28GBY1207*
*28GBY1207*
11253.05 R[Turn over
Look at the bar graph.
Name three factors which affect the energy needs of different people.
Give data from the graph to support each answer.
In this question you will be assessed on your written communication skills,includingtheuseofspecialistscientificterms.
____________________________________________________________________
____________________________________________________________________
____________________________________________________________________
____________________________________________________________________
____________________________________________________________________
____________________________________________________________________
____________________________________________________________________
____________________________________________________________________
____________________________________________________________________
____________________________________________________________________
____________________________________________________________________
____________________________________________________________________
____________________________________________________________________
____________________________________________________________________
____________________________________________________________________
____________________________________________________________________
____________________________________________________________________
_________________________________________________________________ [6]
*28GBY1208*
*28GBY1208*
11253.05 R
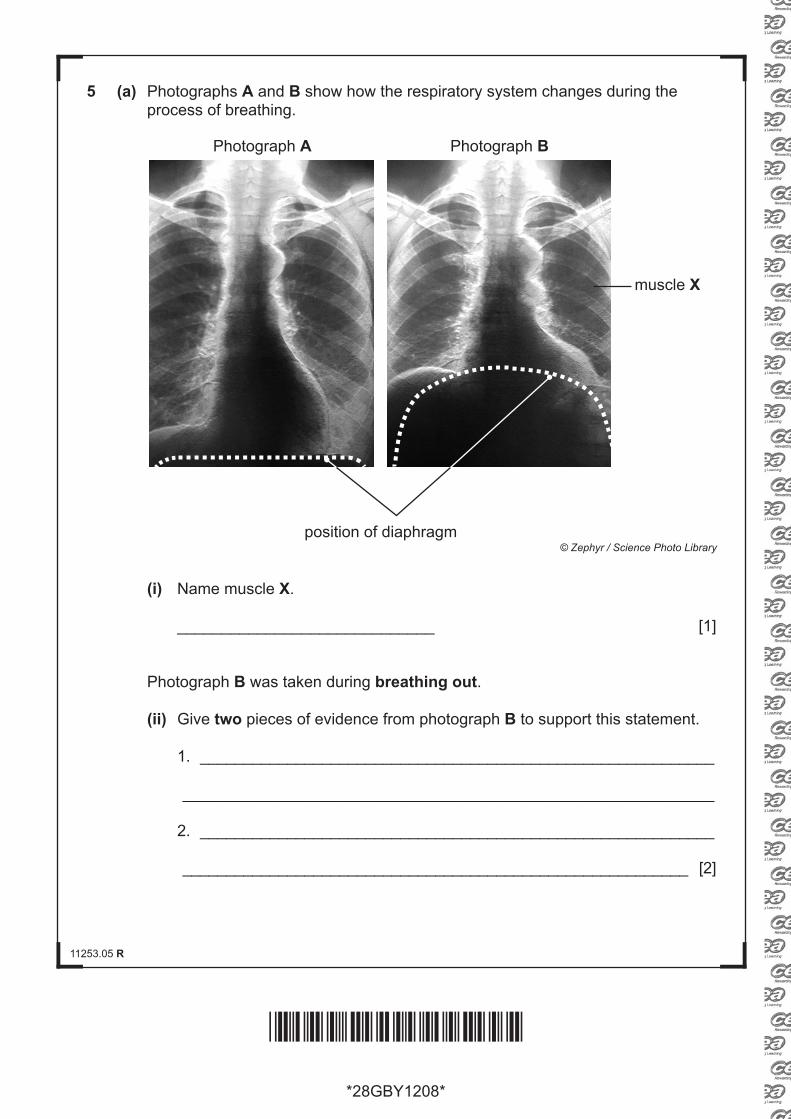
5 (a) Photographs A and B show how the respiratory system changes during the process of breathing.
Photograph A Photograph B
position of diaphragm
muscle X
© Zephyr / Science Photo Library
(i) Name muscle X.
_____________________________ [1]
Photograph B was taken during breathing out.
(ii) Give two pieces of evidence from photograph B to support this statement.
1. ___________________________________________________________
_____________________________________________________________
2. ___________________________________________________________
__________________________________________________________ [2]

*28GBY1209*
*28GBY1209*
11253.05 R[Turn over
Photograph C shows a lung model.
Photograph C
rubber sheet
© Louis Grace, Physics Lecture Demonstration Coordinator. Department of Physics, University of California, Santa Barbara
(b) Describe and explain how the lung model can be used to demonstratebreathing in.
_________________________________________________________________
_________________________________________________________________
_________________________________________________________________
_________________________________________________________________
_________________________________________________________________
_________________________________________________________________
_________________________________________________________________
_________________________________________________________________
______________________________________________________________ [4]
(c) Describe one way the process of breathing in, as demonstrated by this model,differs from the action of the respiratory system.
_________________________________________________________________
_________________________________________________________________
______________________________________________________________ [1]

*28GBY1210*
*28GBY1210*
11253.05 R
6 The diagram shows the action of an enzyme.
(a) Use the diagram to help describe the theory of enzyme action.
_________________________________________________________________
_________________________________________________________________
_________________________________________________________________
_________________________________________________________________
_________________________________________________________________
_________________________________________________________________
______________________________________________________________ [4]
(b) A pupil carried out an experiment to investigate the effect of pH on the rate ofreaction of two different enzymes, A and B.
The table shows the results.
pHRate of reaction/arbitrary unitsEnzyme A Enzyme B
1 5 02 20 03 75 04 36 05 0 56 0 107 0 638 0 889 0 5610 0 30

*28GBY1211*
*28GBY1211*
11253.05 R[Turn over
The graph shows the results for enzyme A.
(i) Complete the graph by plotting a line graph for the rate of reaction ofenzyme B. [3]
pH
0
10
20
30
40
50
60
70
80
90
1 2 3 4 5 6 7 8 9 10
Rat
e of
reac
tion/
arbi
trary
uni
ts
Enzyme A
(ii) Describe and explain how these enzymes are affected by pH.
Give data from the graph to support your answer.
_______________________________________________________________
_______________________________________________________________
_______________________________________________________________
_______________________________________________________________
_____________________________________________________________ [3]

*28GBY1212*
*28GBY1212*
11253.05 R
7 (a) The diagram shows changes in a person’s blood glucose level after eating a meal rich in carbohydrate.
Meal rich in carbohydrate eaten
Blood glucose level increases
Hormone A released
Target organ B
Blood glucose level decreases
Blood glucose level returns to normal
(i) Explain why the blood glucose level increases after eating a meal rich incarbohydrates.
_____________________________________________________________
_____________________________________________________________
_____________________________________________________________
__________________________________________________________ [2]
(ii) Name hormone A and target organ B.
Hormone A _________________________ [1]
Target organ B ______________________ [1]

*28GBY1213*
*28GBY1213*
11253.05 R[Turn over
(iii) Explain how hormone A decreases the blood glucose level.
_____________________________________________________________
_____________________________________________________________
_____________________________________________________________
__________________________________________________________ [2]
(b) The table shows the number of adults with diabetes in Northern Ireland.
Year Number of adults with diabetes
2004–5 51 541
2005–6 54 950
2006–7 56 924
2007–8 60 822
2008–9 65 066
2009–10 68 980
2010–11 72 693© Diabetes UK
(i) Calculate the percentage change in the number of adults with diabetes from2004–5 to 2010–11.
Show your working.
Answer ______________________ % [3]

*28GBY1214*
*28GBY1214*
11253.05 R
(ii) Suggest two reasons for this change in the number of adults with diabetes.
1. ___________________________________________________________
_____________________________________________________________
2. ___________________________________________________________
__________________________________________________________ [2]
(iii) Give one long-term effect of diabetes.
_____________________________________________________________
__________________________________________________________ [1]
(iv) Describe one cost to society of diabetes.
_____________________________________________________________
_____________________________________________________________
__________________________________________________________ [1]

*28GBY1215*
*28GBY1215*
11253.05 R[Turn over
BLANK PAGE
DO NOT WRITE ON THIS PAGE
(Questions continue overleaf)

*28GBY1216*
*28GBY1216*
11253.05 R
8 A pupil carried out an experiment to measure the concentration of vitamin C in orange juice.
1 cm3 of the DCPIP was placed in a test tube and the volume of orange juice required to decolourise it was recorded.
The experiment was repeated three times.
The results are shown in the table.
Experiment Volume of orange juice needed to decolourise 1 cm3 DCPIP/cm3
1 0.76
2 0.48
3 0.74
In a separate experiment carried out with a standard vitamin C solution, 0.1 mg of vitamin C was needed to decolourise 1 cm3 DCPIP.
(a) Calculate the average concentration of vitamin C in 1 cm3 orange juice.
Show your working.
_________________ mg cm–3 [3]

*28GBY1217*
*28GBY1217*
11253.05 R[Turn over
(b) The pupil concluded that the results in the table were unreliable.
Use evidence from the table to suggest why.
_________________________________________________________________
_________________________________________________________________
_________________________________________________________________
______________________________________________________________ [2]
(c) Suggest why the pupil found it difficult to decide when the DCPIP wasdecolourised.
_________________________________________________________________
_________________________________________________________________
______________________________________________________________ [1]

*28GBY1218*
*28GBY1218*
11253.05 R
9 (a) The diagram shows a reflex arc.
A B
© Barking Dog Art
(i) Name the neurones A and B.
A ______________________________ [1]
B ______________________________ [1]
Neurone B is long.
(ii) Describe and explain one other way neurones are adapted to transmitelectrical nerve impulses.
_____________________________________________________________
_____________________________________________________________
_____________________________________________________________
__________________________________________________________ [2]

*28GBY1219*
*28GBY1219*
11253.05 R[Turn over
(iii) Give two differences between an involuntary reflex action and avoluntary action.
1. ___________________________________________________________
__________________________________________________________ [1]
2. ___________________________________________________________
__________________________________________________________ [1]
The diagram shows a synapse between two neurones.
neurone C neurone D
transmitter vesicle
nerveimpulse
nerveimpulse
(b) Use the diagram to describe how the nerve impulse in neurone C causes anerve impulse in neurone D.
_________________________________________________________________
_________________________________________________________________
_________________________________________________________________
_________________________________________________________________
_________________________________________________________________
_________________________________________________________________
______________________________________________________________ [4]

*28GBY1220*
*28GBY1220*
11253.05 R
10 (a) Farmers apply fertilisers to increase the growth of grass.
Slurry is a mixture of faeces and urine from the farm animals which is used as fertiliser.
Farmers grow clover plants because they carry out nitrogen fixation.
The table gives some information about farming in three fields in County Tyrone.
Field Crop Fertiliser Percentage of air in soil/%
A grass slurry 32
B grass and clover mix slurry 39
C grass artificial fertiliser 16
Use the information in the table to help answer the following questions.
(i) Suggest which field A, B or C is most likely to become waterlogged afterheavy rain.
Explain your answer.
Field _____ [1]
Explanation ___________________________________________________
__________________________________________________________ [1]
(ii) Suggest two ways the farmer could reduce the chance of waterlogging inthis field.
1. ___________________________________________________________
2. ________________________________________________________ [2]

*28GBY1221*
*28GBY1221*
11253.05 R[Turn over
(b) Describe and explain two reasons why the grass in field B would grow morethan the grass in field A.
In this question you will be assessed on your written communicationskills, including the use of specialist scientific terms.
_________________________________________________________________
_________________________________________________________________
_________________________________________________________________
_________________________________________________________________
_________________________________________________________________
_________________________________________________________________
_________________________________________________________________
_________________________________________________________________
_________________________________________________________________
_________________________________________________________________
_________________________________________________________________
_________________________________________________________________
_________________________________________________________________
_________________________________________________________________
_________________________________________________________________
_________________________________________________________________
_________________________________________________________________
_________________________________________________________________
_________________________________________________________________
______________________________________________________________ [6]

*28GBY1222*
*28GBY1222*
11253.05 R
11 The diagram shows a section through the front of an eye.
iris
A
B
lens
suspensory ligaments
ciliary muscles
Source: CCEA
(a) (i) Name part A.
___________________________ [1]
(ii) Name the substance filling part B.
___________________________ [1]

*28GBY1223*
*28GBY1223*
11253.05 R[Turn over
(b) Explain how the ciliary muscles and suspensory ligaments change the shape ofthe lens when focusing on a distant object.
_________________________________________________________________
_________________________________________________________________
_________________________________________________________________
_________________________________________________________________
_________________________________________________________________
_________________________________________________________________
______________________________________________________________ [3]
(c) Describe how the muscles of the iris have adapted this eye for dim light.
Use evidence from the diagram to support your answer.
_________________________________________________________________
_________________________________________________________________
_________________________________________________________________
_________________________________________________________________
_________________________________________________________________
_________________________________________________________________
_________________________________________________________________
______________________________________________________________ [4]

*28GBY1224*
*28GBY1224*
11253.05 R
12 (a) Complete the balanced chemical equation for photosynthesis.
+ C6 H12 O6 + [3]
(b) The graph shows changes in the concentration of oxygen in the air around a leafover a 24-hour period.
MidnightMidnight 6pm6am 12 noon
100
90
80
70
60
50
40
30
20
10
0
-10
-20
-30
Time of day
Cha
nge
in c
once
ntra
tion
of o
xyge
n/ar
bitra
ry u
nits

*28GBY1225*
*28GBY1225*
11253.05 R
(i) Describe and explain the change in the concentration of oxygen betweenmidnight and 3 am.
_____________________________________________________________
_____________________________________________________________
_____________________________________________________________
_____________________________________________________________
_____________________________________________________________
_____________________________________________________________
_____________________________________________________________
_____________________________________________________________
__________________________________________________________ [5]
(ii) Explain why there is no change in the concentration of oxygen at 5:30 am.
_____________________________________________________________
_____________________________________________________________
_____________________________________________________________
_____________________________________________________________
_____________________________________________________________
__________________________________________________________ [3]
(iii) Explain the shape of the graph between 10 am and 2 pm.
_____________________________________________________________
_____________________________________________________________
_____________________________________________________________
__________________________________________________________ [2]

*28GBY1226*
*28GBY1226*
11253.05 R
THIS IS THE END OF THE QUESTION PAPER
BLANK PAGE
DO NOT WRITE ON THIS PAGE

*28GBY1227*
*28GBY1227*
11253.05 R
BLANK PAGE
DO NOT WRITE ON THIS PAGE

Permission to reproduce all copyright material has been applied for.In some cases, efforts to contact copyright holders may have been unsuccessful and CCEAwill be happy to rectify any omissions of acknowledgement in future if notified.
Examiner Number
For Examiner’suse only
QuestionNumber Marks
1 2 3 4 5 6 7 8 9101112
TotalMarks
*28GBY1228*
*28GBY1228*
11253.05 R
DO NOT WRITE ON THIS PAGE