unit 1 review_session
TRANSCRIPT
Unit I: Basic Economic Concepts
Why are we “Speed Reviewing”?1. Having you review on your own
wouldn’t be effective2. Lecturing about every concept would
be too boring.
“Speed Reviewing” will help you identify what you need to study.
So you must come see me about specific things you
don’t understand.

What is Economics in General?
Economics is the study of _________.
• Economics is the science of scarcity.• Scarcity is the condition in which our wants are greater than our limited resources.• Since we are unable to have everything we desire, we must make choices on how we will use our resources. • In economics we will study the choices of individuals, firms, and governments.
choices

Economics DefinedEconomics-Social science concerned with the efficient use of limited resources to achieve maximum satisfaction of economic wants.
(Study of how individuals and societies deal with ________)
Examples:
You must choose between buying jeans or buying shoes.Businesses must choose how many people to hireGovernments must choose how much to spend on welfare.
scarcity

Micro vs. MacroMICROeconomics-
Study of small economic units such as individuals, firms, and industries (competitive markets, labor markets, personal decision making, etc.)
MACROeconomics-Study of the large economy as a whole or in its basic subdivisions (National Economic Growth, Government Spending, Inflation, Unemployment, etc.)
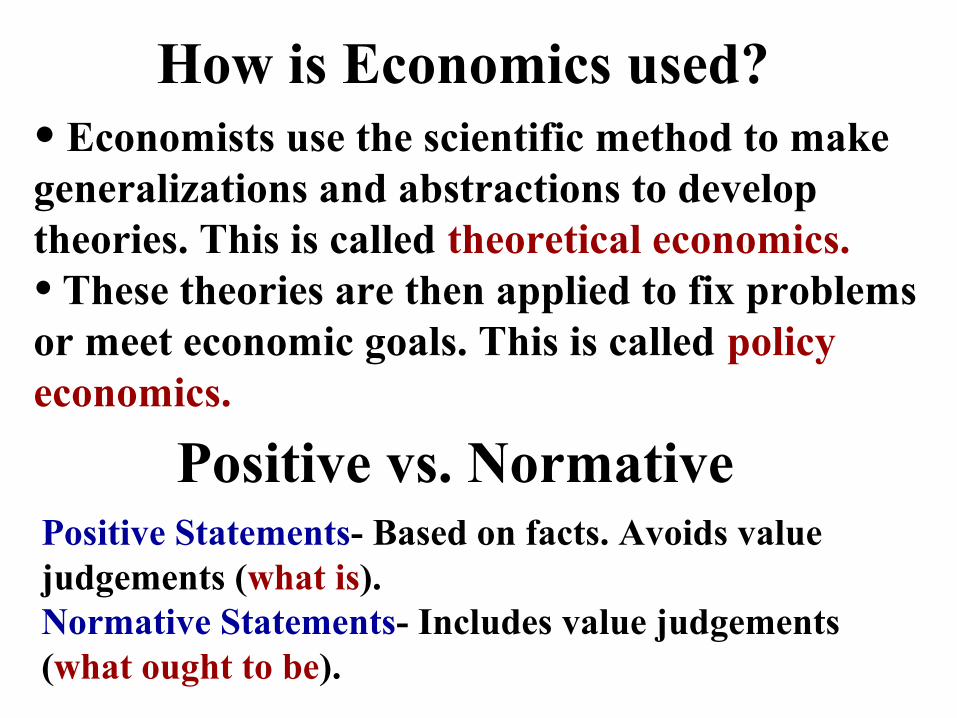
Positive vs. Normative Positive Statements- Based on facts. Avoids value judgements (what is).Normative Statements- Includes value judgements (what ought to be).
How is Economics used? • Economists use the scientific method to make generalizations and abstractions to develop theories. This is called theoretical economics. • These theories are then applied to fix problems or meet economic goals. This is called policy economics.

Would you see the movie three times?Notice that the total benefit is more than the
total cost but you would NOT watch the movie the 3rd time.
Thinking at the Margin
# Times Watching Movie
Benefit Cost
1st $30 $10
2nd $15 $10
3rd $5 $10
Total $50 $30
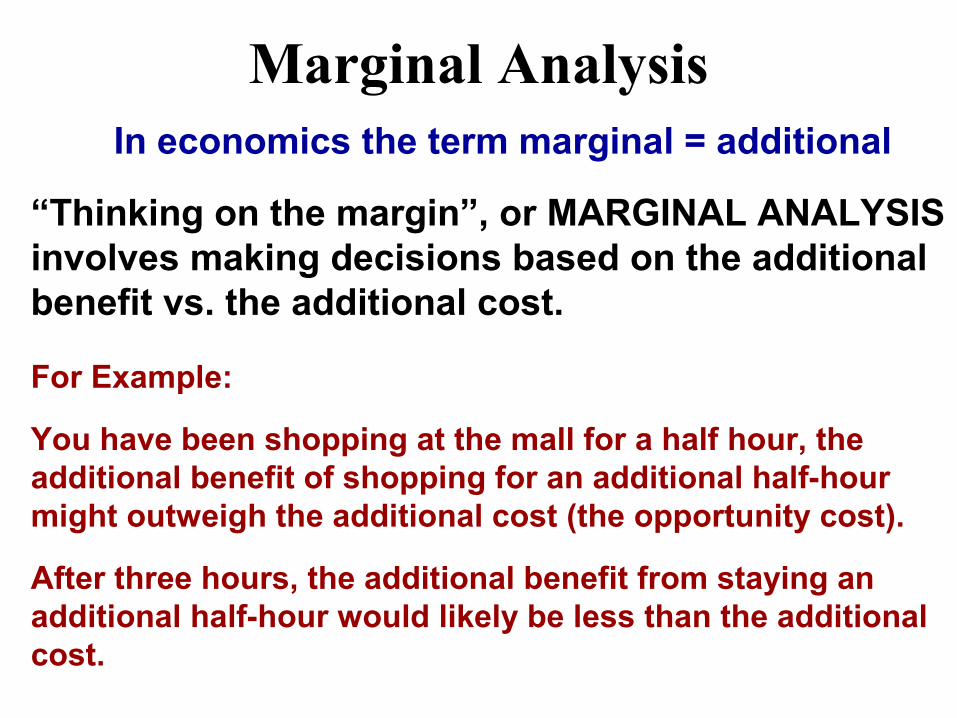
Marginal AnalysisIn economics the term marginal = additional
“Thinking on the margin”, or MARGINAL ANALYSIS involves making decisions based on the additional benefit vs. the additional cost.
For Example:
You have been shopping at the mall for a half hour, the additional benefit of shopping for an additional half-hour might outweigh the additional cost (the opportunity cost).
After three hours, the additional benefit from staying an additional half-hour would likely be less than the additional cost.
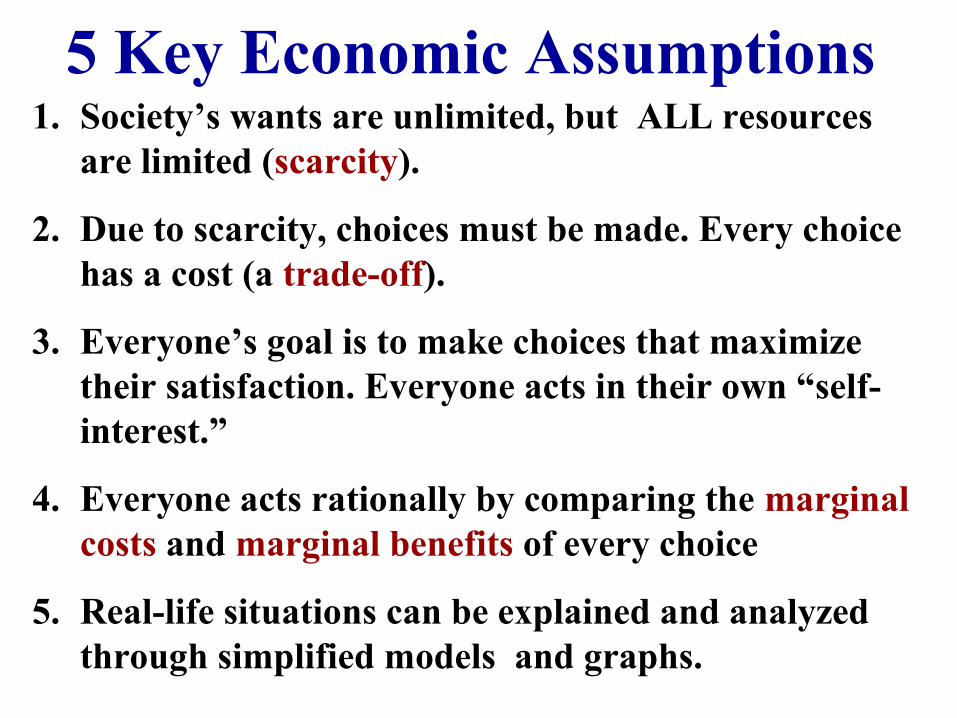
5 Key Economic Assumptions1. Society’s wants are unlimited, but ALL resources
are limited (scarcity).
2. Due to scarcity, choices must be made. Every choice has a cost (a trade-off).
3. Everyone’s goal is to make choices that maximize their satisfaction. Everyone acts in their own “self-interest.”
4. Everyone acts rationally by comparing the marginal costs and marginal benefits of every choice
5. Real-life situations can be explained and analyzed through simplified models and graphs.

Given the following assumptions, make a rational choice in your own self-interest (hold everything else constant)…
1. You want to visit your friend for the weekend
2. You work every weekday earning $100 per day
3. You have three flights to choose from:Thursday Night Flight = $300Friday Early Morning Flight = $345Friday Night Flight = $380
Which flight should you choose? Why?11

Trade-offsALL decisions involve trade-offs.
The most desirable alternative given up as a result of a decision is known as opportunity cost.
Trade-offs are all the alternatives that we give up whenever we choose one course of action over others.
(Examples: going to the movies)
What are trade-offs of deciding to go to college? What is the opportunity cost of going to college?
12

46%

The Factors of Production
14

The Production Possibilities Curve
(PPC)Using Economic Models…
Step 1: Explain concept in wordsStep 2: Use numbers as examplesStep 3: Generate graphs from numbersStep 4: Make generalizations using graph
15
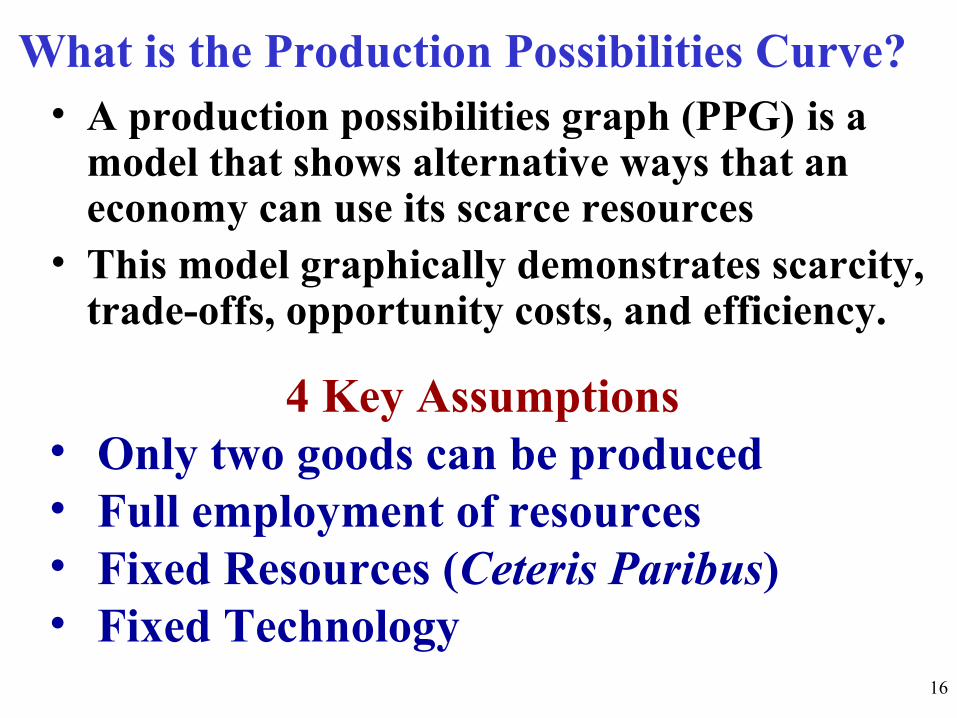
What is the Production Possibilities Curve?• A production possibilities graph (PPG) is a
model that shows alternative ways that an economy can use its scarce resources
• This model graphically demonstrates scarcity, trade-offs, opportunity costs, and efficiency.
4 Key Assumptions• Only two goods can be produced • Full employment of resources• Fixed Resources (Ceteris Paribus)• Fixed Technology
16

a b c d e f14 12 9 5 0 00 2 4 6 8 10
Bikes
Computers
NOW GRAPH IT: Put bikes on y-axis and computers on x-axis
Production “Possibilities” Table
Each point represents a specific combination of goods that can be
produced given full employment of resources.
17

Bik
es
Computers
14
12
10
8
6
4
2
0
0 2 4 6 8 10
A
B
C
D
E
G
Inefficient/ Unemployment
Impossible/Unattainable (given current resources)
Efficient
PRODUCTION POSSIBILITIESHow does the PPG graphically demonstrates scarcity,
trade-offs, opportunity costs, and efficiency?
18
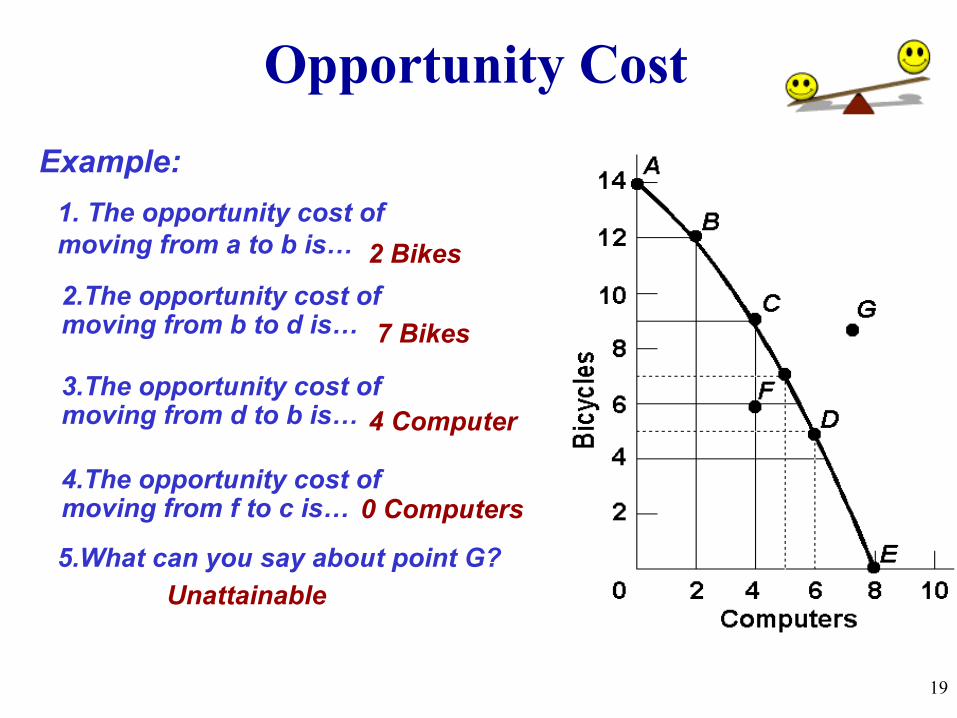
2 Bikes
2.The opportunity cost of moving from b to d is…
4.The opportunity cost of moving from f to c is…
3.The opportunity cost of moving from d to b is…
7 Bikes
4 Computer
0 Computers
5.What can you say about point G?
Unattainable
1. The opportunity cost of moving from a to b is…
Example:
Opportunity Cost
19

The Production Possibilities Curve (or Frontier)
20
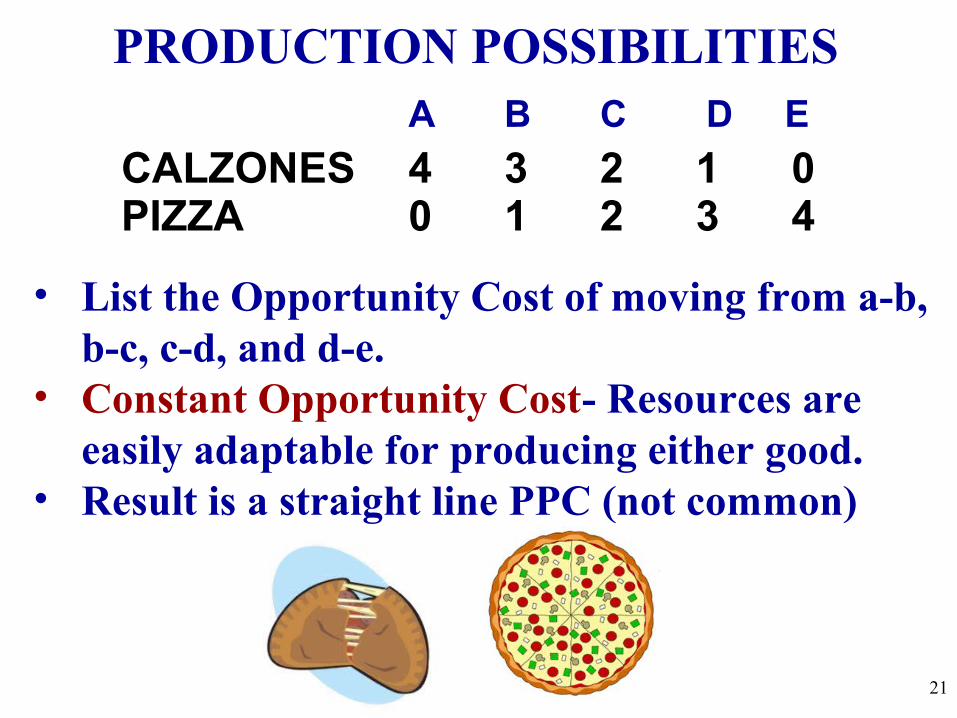
PIZZA 0 1 2 3 4CALZONES 4 3 2 1 0
• List the Opportunity Cost of moving from a-b, b-c, c-d, and d-e.
• Constant Opportunity Cost- Resources are easily adaptable for producing either good.
• Result is a straight line PPC (not common)
PRODUCTION POSSIBILITIESA B C D E
21
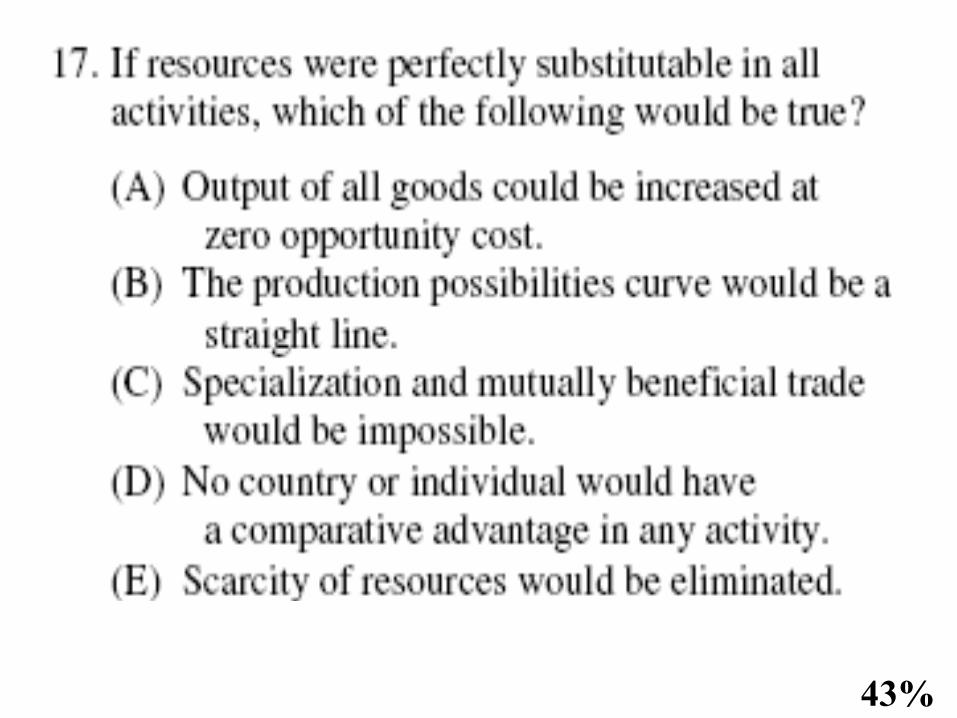
43%
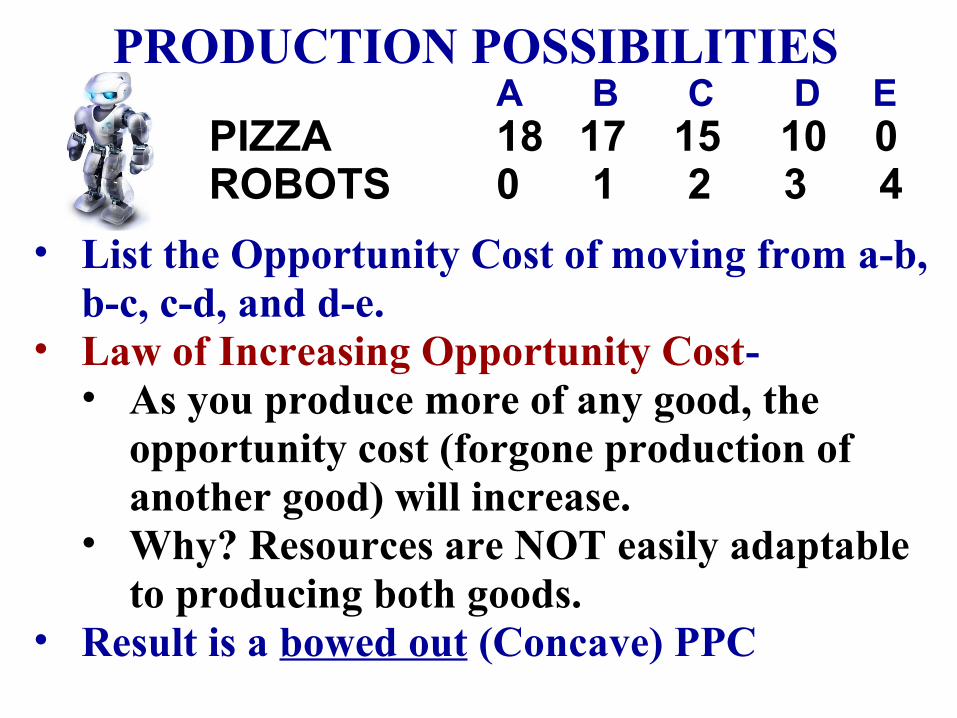
PIZZA 18 17 15 10 0ROBOTS 0 1 2 3 4
• List the Opportunity Cost of moving from a-b, b-c, c-d, and d-e.
• Law of Increasing Opportunity Cost-• As you produce more of any good, the
opportunity cost (forgone production of another good) will increase.
• Why? Resources are NOT easily adaptable to producing both goods.
• Result is a bowed out (Concave) PPC
A B C D EPRODUCTION POSSIBILITIES

1 Bike2.The PER UNIT opportunity cost of moving from b to c is…
4.The PER UNIT opportunity cost of moving from d to e is…
3.The PER UNIT opportunity cost of moving from c to d is…
1.5 (3/2) Bikes
2 Bikes
2.5 (5/2) Bikes
= Opportunity CostUnits Gained
1. The PER UNIT opportunity cost of moving from a to b is…
Example:
PER UNIT Opportunity CostHow much each marginal
unit costs
NOTICE: Increasing Opportunity Costs 24
Shifting the Production Possibilities Curve
25

PRODUCTION POSSIBILITIES
4 Key Assumptions Revisited• Only two goods can be produced • Full employment of resources• Fixed Resources (4 Factors)• Fixed Technology
What if there is a change?
3 Shifters of the PPC1. Change in resource quantity or quality 2. Change in Technology3. Change in Trade 26
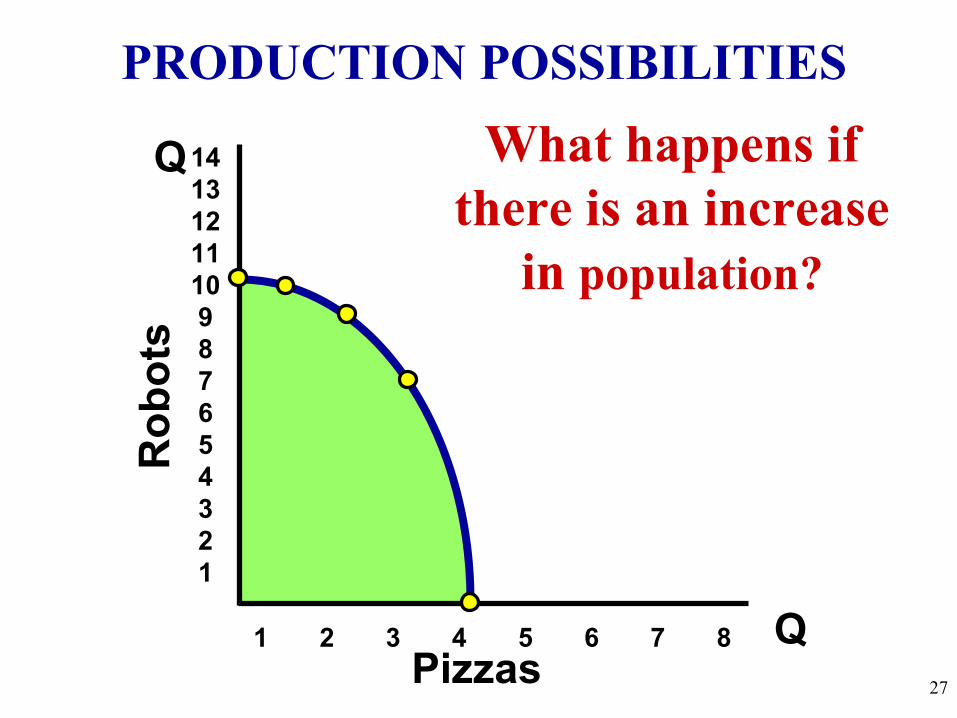
PRODUCTION POSSIBILITIES
Q
Q
Ro
bo
ts
Pizzas
1413121110 9 8 7 6 5 4 3 2 1
1 2 3 4 5 6 7 8
What happens if there is an increase
in population?
27
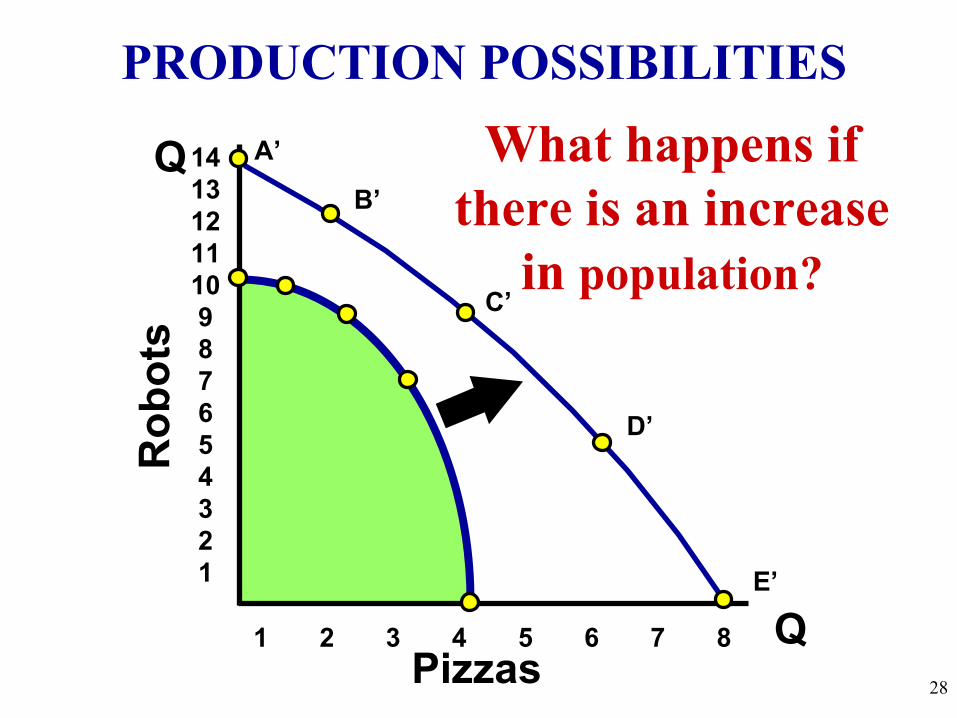
PRODUCTION POSSIBILITIES
Q
Q
Ro
bo
ts
Pizzas
1413121110 9 8 7 6 5 4 3 2 1
1 2 3 4 5 6 7 8
A’
B’
C’
D’
E’
What happens if there is an increase
in population?
28
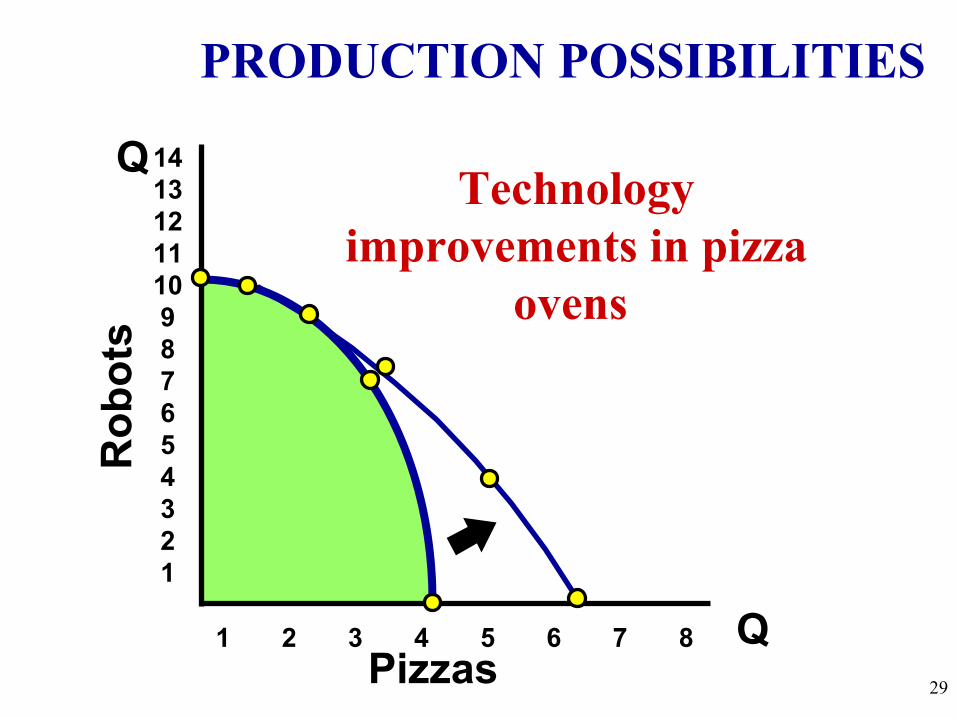
Technology improvements in pizza
ovens
Q
Q
Ro
bo
ts
Pizzas
1413121110 9 8 7 6 5 4 3 2 1
1 2 3 4 5 6 7 8
PRODUCTION POSSIBILITIES
29
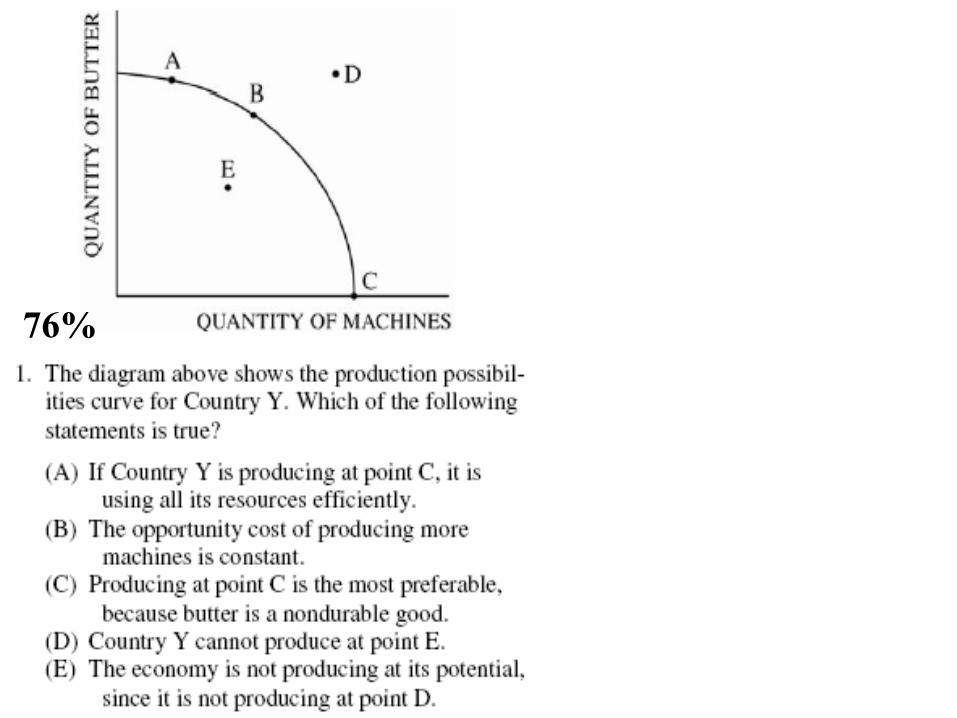
76%

The Production Possibilities Curve and Efficiency
31

Productive Efficiency- • Products are being produced in the
least costly way. • This is any point ON the Production
Possibilities CurveAllocative Efficiency- • The products being produced are the
ones most desired by society.• This optimal point on the PPC depends
on the desires of society.
Two Types of Efficiency
32

Productive and Allocative EfficiencyB
ike
s
Computers
14
12
10
8
6
4
2
0
0 2 4 6 8 10
A
B
C
D
F
E
Which points are productively efficient?Which are allocatively efficient?
G
33
Productively Efficient points are A through D
Allocative Efficient points depend on the
wants of society (What if this represents a
country with no electricity?)
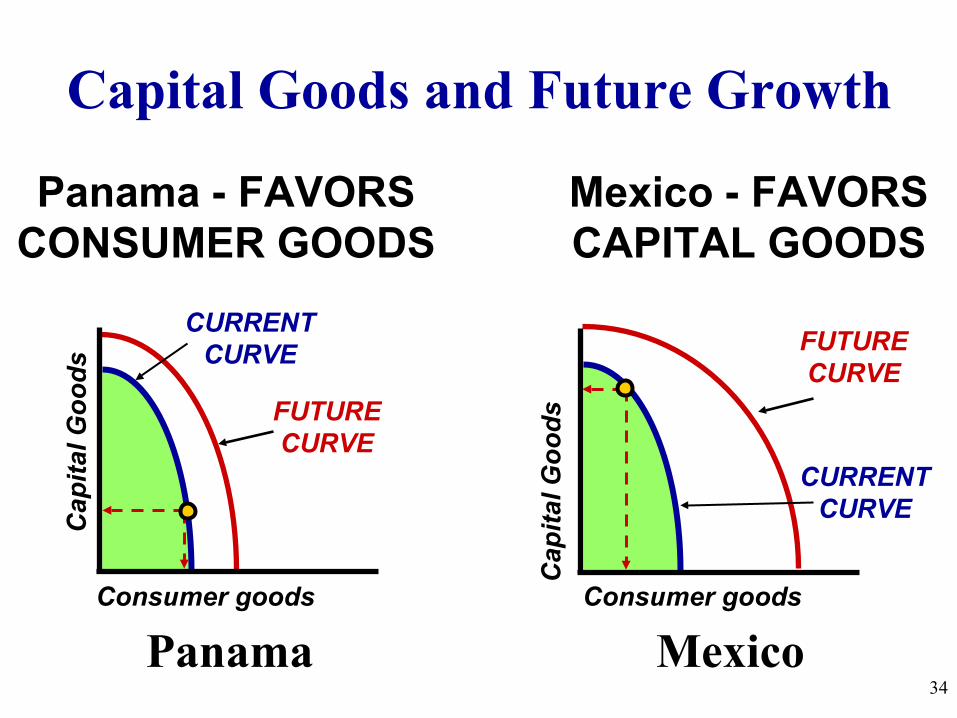
Panama - FAVORSCONSUMER GOODS
Mexico - FAVORSCAPITAL GOODS
Consumer goods
Ca
pit
al G
oo
ds
CURRENTCURVE
FUTURECURVE
Consumer goods
Cap
ita
l Go
od
s
FUTURECURVE
CURRENTCURVE
Capital Goods and Future Growth
MexicoPanama34

PPC PracticeDraw a PPC showing changes for each of the
following:Pizza and Robots (3)
1. New robot making technology2. Decrease in the demand for pizza
3. Mad cow disease kills 85% of cows
Consumer goods and Capital Goods (4) 4. BP Oil Spill in the Gulf 5. Faster computer hardware 6. Many workers unemployed 7. Significant increases in education
35

New robot making technologyQ
Q
Ro
bo
ts
Pizzas
Question #1
36
A shift only for Robots
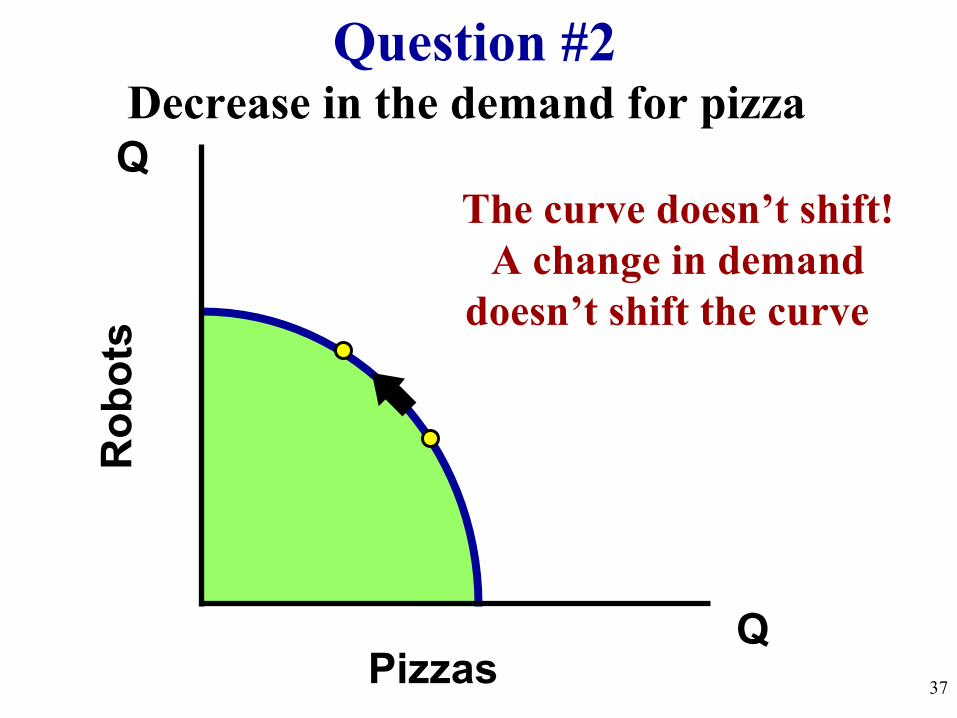
Decrease in the demand for pizzaQ
Q
Ro
bo
ts
Pizzas
Question #2
37
The curve doesn’t shift!A change in demand
doesn’t shift the curve
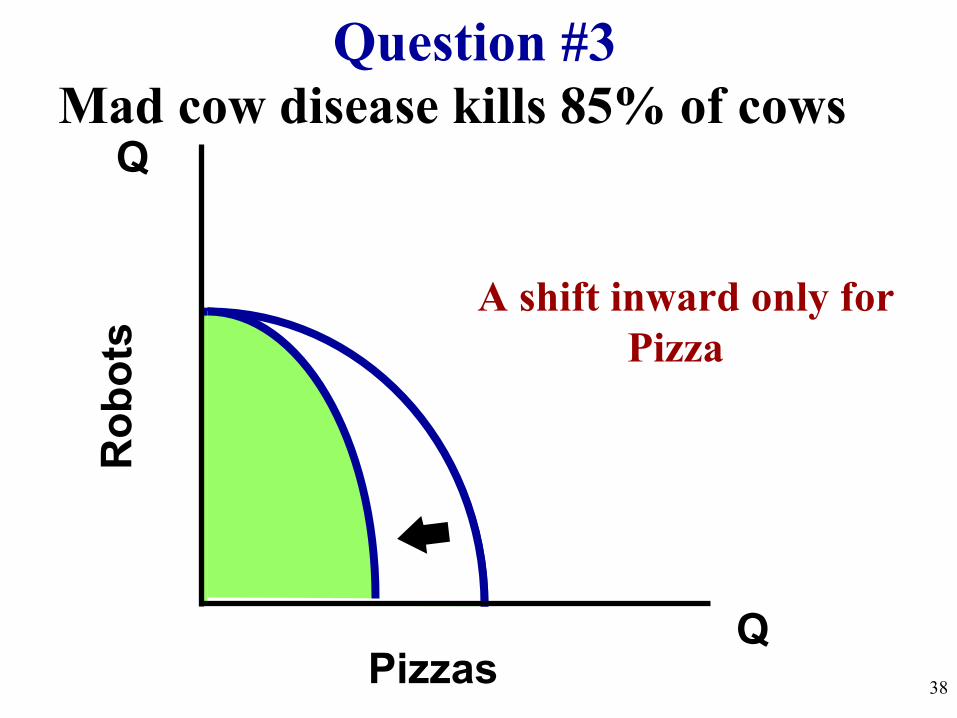
Mad cow disease kills 85% of cowsQ
Q
Ro
bo
ts
Pizzas
Question #3
38
A shift inward only for Pizza

BP Oil Spill in the GulfQ
Q
Ca
pit
al G
oo
ds
(G
un
s)
Consumer Goods (Butter)
Question #4
39
Decrease in resources decrease production
possibilities for both

Faster computer hardwareQ
Q
Ca
pit
al G
oo
ds
(G
un
s)
Consumer Goods (Butter)
Question #5
40
Quality of a resource improves shifting the
curve outward

Many workers unemployedQ
Q
Ca
pit
al G
oo
ds
(G
un
s)
Consumer Goods (Butter)
Question #6
41
The curve doesn’t shift!Unemployment is just a point inside the curve

Significant increases in educationQ
Q
Ca
pit
al G
oo
ds
(G
un
s)
Consumer Goods (Butter)
Question #7
42
The quality of labor is improved. Curve shifts
outward.

International TradeWhy do countries trade and
what is specialization?
43

Per Unit Opportunity Cost Review
Assume it costs you $50 to produce 5 t-shirts. What is your PER UNIT cost for each shirt?
$10 per shirt
Now, take money our of the equation. Instead of producing 5 shirts you could have made 10
hats.
1. What is your PER UNIT OPPORTUNITY COST for each shirt in terms of hats given up?
1 shirt costs 2 hats 2. What is your PER UNIT OPPORTUNITY COST for
each hat in terms of shirts given up? 1 hat costs a half of a shirt
44
= Opportunity CostUnits Gained
Per Unit Opportunity Cost

Per Unit Opportunity Cost ReviewRonald McDonald can produce 20 pizzas or 200 burgers
Papa John can produce 100 pizzas or 200 burgers1. What is Ronald’s opportunity cost for one pizza in
terms of burgers given up?2. What is Ronald’s opportunity cost for one burger in
terms of pizza given up?3. What is Papa John’s opportunity cost for one pizza in
terms of burgers given up?4. What is Papa John’s opportunity cost for one burger
in terms of pizza given up?
45
Ronald has a COMPARATIVE ADVANTGE in the production of burgers
Papa John has a COMPARATIVE ADVANTAGE in the production of pizza
1 pizza cost 10 burgers
1 burger costs 1/10 pizza
1 pizza costs 2 burgers
1 burger costs 1/2 pizza

Absolute and Comparative AdvantageAbsolute Advantage
•The producer that can produce the most output OR requires the least amount of inputs (resources)•Ex: Papa John has an absolute advantage in pizzas because he can produce 100 and Ronald can only make 20.
Comparative Advantage•The producer with the lowest opportunity cost.•Ex: Ronald has a comparative advantage in burgers because he has a lowest PER UNIT opportunity cost.
46
Countries should trade if they have a relatively lower opportunity cost.
They should specialize in the good that is “cheaper” for them to produce.
Benefits of Specialize and Trade
47

International Trade
Su
gar
(to
ns)
Su
gar
(to
ns)
45
40
35
30
25
20
15
10
5
0
30
25
20
15 10 5
05 10 15 20 25 30 5 10 15 20
Wheat (tons) Wheat (tons)
S W
0 30
1.5 29
3 28
4.5 27
6 26
7.5 25
9 24
10.5 23
12 22
13.5 21
15 20
16.5 19
18 18
19.5 17
S W
20 0
18.5 1
17 2
15.5 3
14 4
12.5 5
11 6
9.5 7
8 8
6.5 9
5 10
3.5 11
The US Specializes and makes ONLY Wheat
Brazil Makes ONLY Sugar
48
USA Brazil
Trade: 1 Wheat for 1.5 Sugar

TRADE SHIFTS THE PPC!S
ug
ar (
ton
s)
Su
gar
(to
ns)
45
40
35
30
25
20
15
10
5
0
30
25
20
15 10 5
05 10 15 20 25 30 5 10 15 20
AFTER TRADE
AFTER TRADE
Wheat (tons) Wheat (tons)
International Trade
49
USA Brazil

Su
gar
(to
ns)
Su
gar
(to
ns)
45
40
35
30
25
20
15
30
25
20
15 10
5 10 15 20 25 30 5 10 15 20Wheat (tons) Wheat (tons)
USA
Brazil
Wheat Sugar
30 30
10 20
(1W costs 1S) (1S costs 1W)
(1W costs 2S) (1S costs 1/2W)
Which country has a comparative advantage in wheat?
1. Which country should EXPORT Sugar?2. Which country should EXPORT Wheat? 3. Which country should IMPORT Wheat?
50

Output Questions:
OOO=Output: Other goes Over
51
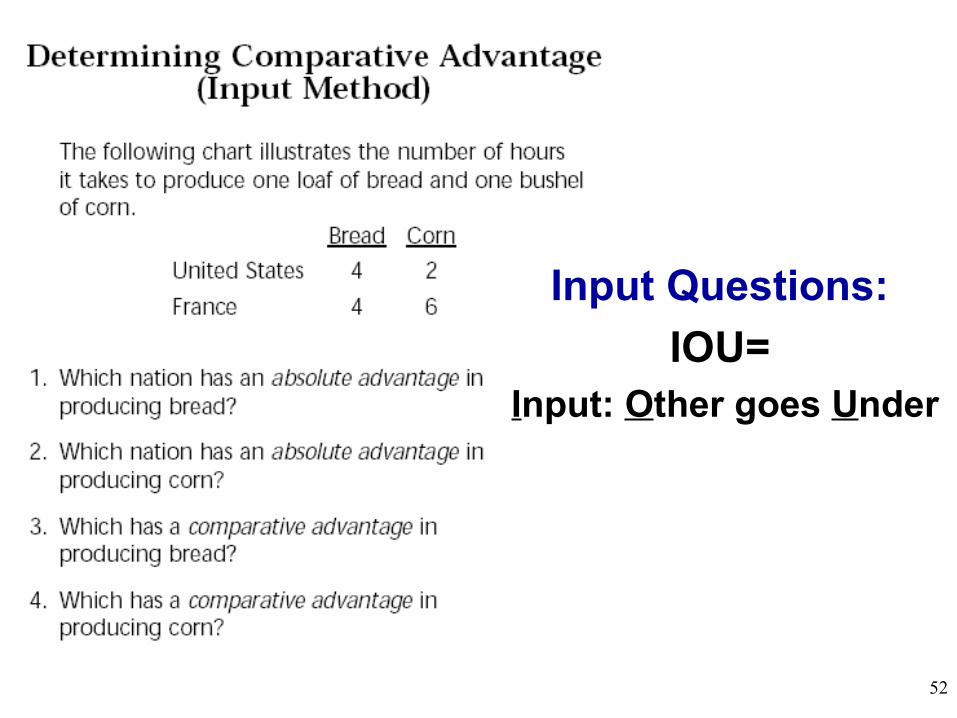
Input Questions:
IOU= Input: Other goes Under
52

Comparative Advantage PracticeCreate a chart for each of the following problems.
•First- Identify if it is a output or input question •Second-Identify who has the ABSOLUTE ADVANTAGE•Third-Identify who has a COMPARATIVE ADVANTAGE•Fourth- Identify how they should specialize
1. Sara gives 2 haircuts or 1 perm and hour. Megan gives 3 haircuts or 2 perms per hour.
2. Justin fixes 16 flats or 8 brakes per day. Tim fixes 14 flats or 8 brakes per day.
3. Hannah takes 30 minutes to wash dishes and 1 hour to vacuum the house. Kevin takes 15 minutes to wash dishes and 45 minutes to vacuum.
4. Americans produce 50 computers or 50 TVs per hour. Chinese produce 30 computers or 40 TVs per hour.
53
Unit 1: Basic Economic Concepts
54

Scarcity Means There Is Not Enough For Everyone
Government must step in to help allocate (distribute) resources 55

Every society must answer three questions:
The Three Economic Questions1. What goods and services should be
produced? 2. How should these goods and services be
produced? 3. Who consumes these goods and services?
The way these questions are answered determines the economic system
An economic system is the method used by a society to produce and distribute goods and
services. 56
Economic Systems1. Centrally-Planned
(Command) Economy2. Free Market Economy3. Mixed Economy
57
Centrally-Planned Economies
(aka Communism)
58

Centrally Planned EconomiesIn a centrally planned economy (communism)
the government… 1. owns all the resources. 2. decides what to produce, how much to
produce, and who will receive it.Examples:
– Cuba, China, North Korea, former Soviet Union
Why do centrally planned economies face problems of poor-quality goods, shortages,
and unhappy citizens? NO PROFIT MEANS NO INCENTIVES!!
59

Advantages and Disadvantages
1. Low unemployment-everyone has a job
2. Great Job Security-the government doesn’t go out of business
3. Equal incomes means no extremely poor people
4. Free Health Care
What is GOOD about Communism?
What is BAD about Communism?
1. No incentive to work harder
2. No incentive to innovate or come up with good ideas
3. No Competition keeps quality of goods poor.
4. Corrupt leaders5. Few individual
freedoms60
Free Market System(aka Capitalism)
61

Characteristics of Free Market1. Little government involvement in the economy.
(Laissez Faire = Let it be)
2. Individuals OWN resources and answer the three economic questions.
3. The opportunity to make PROFIT gives people INCENTIVE to produce quality items efficiently.
4. Wide variety of goods available to consumers.
5. Competition and Self-Interest work together to regulate the economy (keep prices down and quality up).
Reword for Communism 62
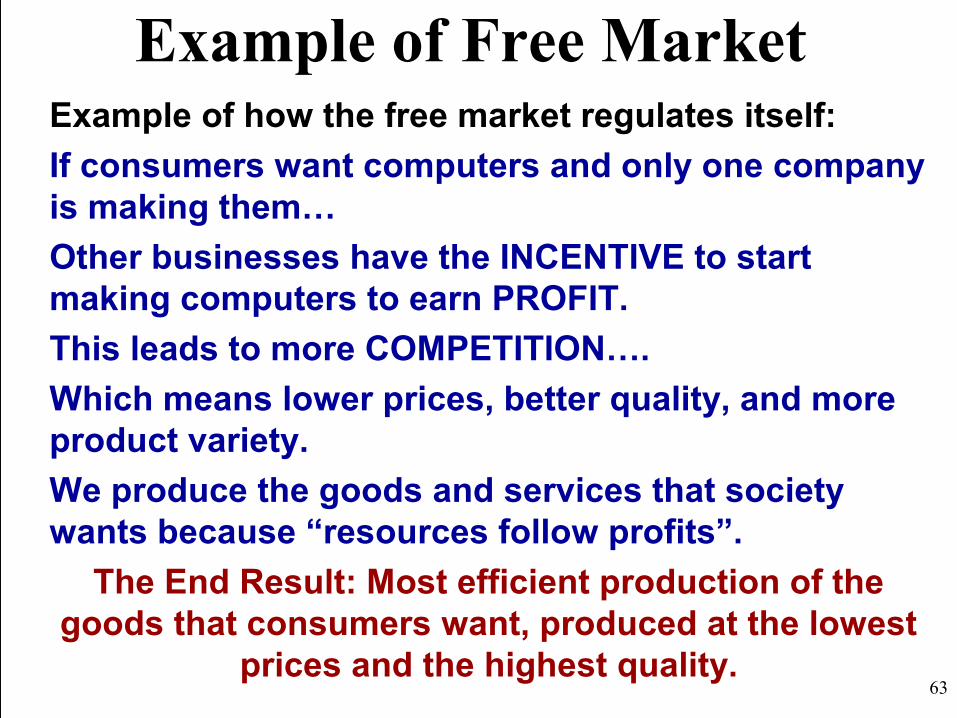
Example of Free MarketExample of how the free market regulates itself:
If consumers want computers and only one company is making them…
Other businesses have the INCENTIVE to start making computers to earn PROFIT.
This leads to more COMPETITION….
Which means lower prices, better quality, and more product variety.
We produce the goods and services that society wants because “resources follow profits”.
The End Result: Most efficient production of the goods that consumers want, produced at the lowest
prices and the highest quality.63

The Invisible HandThe concept that society’s goals will be met as
individuals seek their own self-interest.
Example: Society wants fuel efficient cars…•Profit seeking producers will make more.•Competition between firms results in low prices, high quality, and greater efficiency. •The government doesn’t need to get involved since the needs of society are automatically met.
Competition and self-interest act as an invisible hand that regulates the free market.
64
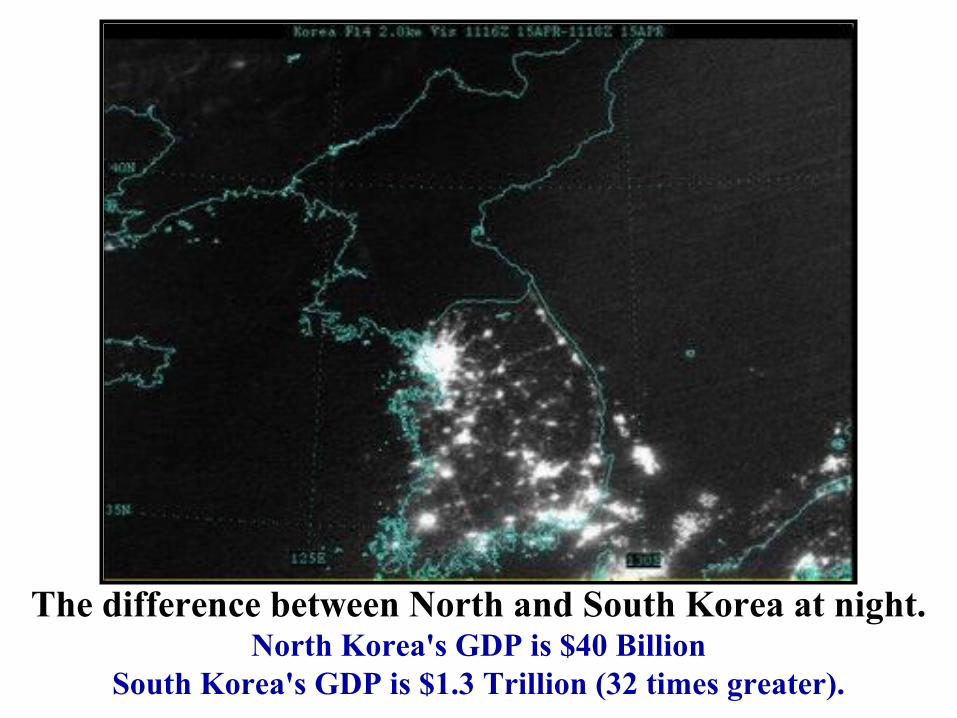
The difference between North and South Korea at night. North Korea's GDP is $40 Billion
South Korea's GDP is $1.3 Trillion (32 times greater).

Connection to the PPC
Communism in the Long Run
Free Markets in the Long Run
Consumer goods
Ca
pit
al G
oo
ds
CURRENTCURVE
FUTURECURVE
Consumer goodsC
ap
ital
Go
od
s
FUTURECURVE
CURRENTCURVE
Puerto RicoCuba66
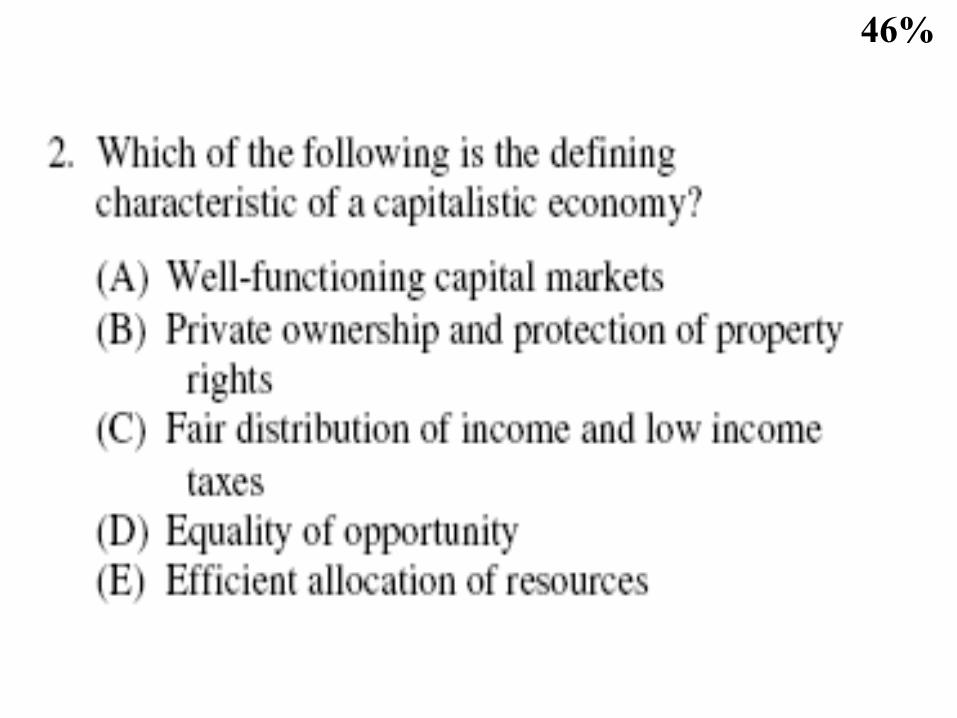
46%

The Circular Flow Model
68

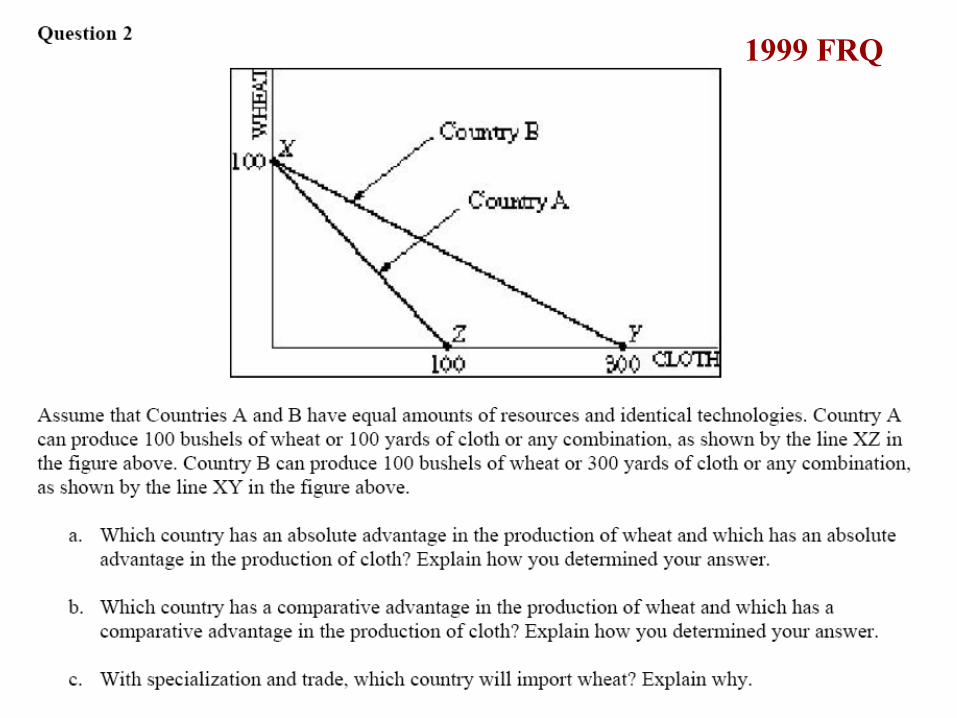
1999 FRQ
