unit 2: supply, demand, and consumer choice - wikispaces 2 summary (for... · unit 2: supply,...
TRANSCRIPT
Unit 2: Supply, Demand, and Consumer Choice
1

Unit 2: Supply, Demand, and Consumer Choice
Length: 3 WeeksChapters: 3, 20, and 21Activity: Pearl ExchangeAssignment: PS #2
2

DEMAND DEFINEDWhat is Demand?
Demand is the different quantities of goods that consumers are willing and able to buy at different prices.(Ex: Bill Gates is able to purchase a Ferrari, but if
he isn’t willing he has NO demand for one)
What is the Law of Demand? The law of demand states There is an
INVERSE relationship between price and quantity demanded
3
Why does the Law of Demand occur?
The law of demand is the result of three separate behavior patterns that overlap:1.The Substitution effect 2.The Income effect3.The Law of Diminishing Marginal
UtilityWe will define and explain each…
4

• If the price goes up for a product, consumer but less of that product and more of another substitute product (and vice versa)
1. The Substitution Effect
• If the price goes down for a product, the purchasing power increases for consumers -allowing them to purchase more.
2. The Income Effect
Why does the Law of Demand occur?
5
• Utility = Satisfaction• We buy goods because we get utility from them• The law of diminishing marginal utility states that as
you consume more units of any good, the additional satisfaction from each additional unit will eventually start to decrease
• In other words, the more you buy of ANY GOOD the less satisfaction you get from each new unit.
Discussion Questions:1. What does this have to do with the Law of Demand?2. How does this effect the pricing of businesses?
3. Law of Diminishing Marginal UtilityWhy does the Law of Demand occur?
U-TIL- IT- Y
6

The Demand Curve• A demand curve is a graphical representation
of a demand schedule.• The demand curve is downward sloping
showing the inverse relationship between price (on the y-axis) and quantity demanded (on the x-axis)
• When reading a demand curve, assume all outside factors, such as income, are held constant. (This is called ceteris paribus)
Let’s draw a new demand curve for cereal…
7

GRAPHING DEMAND
Qo
$5
4
3
2
1
Price of Cereal
Quantity of Cereal
Demand Schedule
10 20 30 40 50 60 70 80
8
PriceQuantity
Demanded
$5 10
$4 20
$3 30
$2 50
$1 80Demand

Where do you get the Market Demand?
Q
Billy Price Q Demd
$5 1$4 2$3 3$2 5$1 7
Jean Other Individuals Price Q Demd
$5 0$4 1$3 2$2 3$1 5
Price Q Demd
$5 9$4 17$3 25$2 42$1 68
Price Q Demd
$5 10$4 20$3 30$2 50$1 80
Market
3
P
Q2
P
Q25
P
Q30
P
$3 $3 $3 $3D DDD
Shifts in DemandCHANGES IN DEMAND • Ceteris paribus-“all other things held constant.”• When the ceteris paribus assumption is
dropped, movement no longer occurs along the demand curve. Rather, the entire demand curve shifts.
• A shift means that at the same prices, more people are willing and able to purchase that good.
This is a change in demand, not a change in quantity demanded
10
Changes in price DON’T shift
the curve!

Change in Demand
Qo
$5
4
3
2
1
Price of Cereal
Quantity of Cereal
Demand Schedule
10 20 30 40 50 60 70 80
11
PriceQuantity
Demanded
$5 10
$4 20
$3 30
$2 50
$1 80Demand
What if cereal makes you smarter?

Change in Demand
Qo
$5
4
3
2
1
Price of Cereal
Quantity of Cereal
Demand Schedule
10 20 30 40 50 60 70 80
12
PriceQuantity
Demanded
$5 10 30
$4 20 40
$3 30 50
$2 50 70
$1 80 100Demand
D2
Increase in DemandPrices didn’t change but
people want MORE cereal

Change in Demand
Qo
$5
4
3
2
1
Price of Cereal
Quantity of Cereal
Demand Schedule
10 20 30 40 50 60 70 80
13
PriceQuantity
Demanded
$5 10
$4 20
$3 30
$2 50
$1 80
What if cereal causes baldness?
Demand

Change in Demand
Qo
$5
4
3
2
1
Price of Cereal
Quantity of Cereal
Demand Schedule
10 20 30 40 50 60 70 80
14
PriceQuantity
Demanded
$5 10 0
$4 20 5
$3 30 20
$2 50 30
$1 80 60
DemandD2
Decrease in DemandPrices didn’t change but people want LESS cereal

What Causes a Shift in Demand?
5 Determinates (SHIFTERS) of Demand:
1.Tastes and Preferences2.Number of Consumers3.Price of Related Goods4.Income5.Future Expectations
Changes in PRICE don’t shift the curve. It only causes movement along the curve.
15
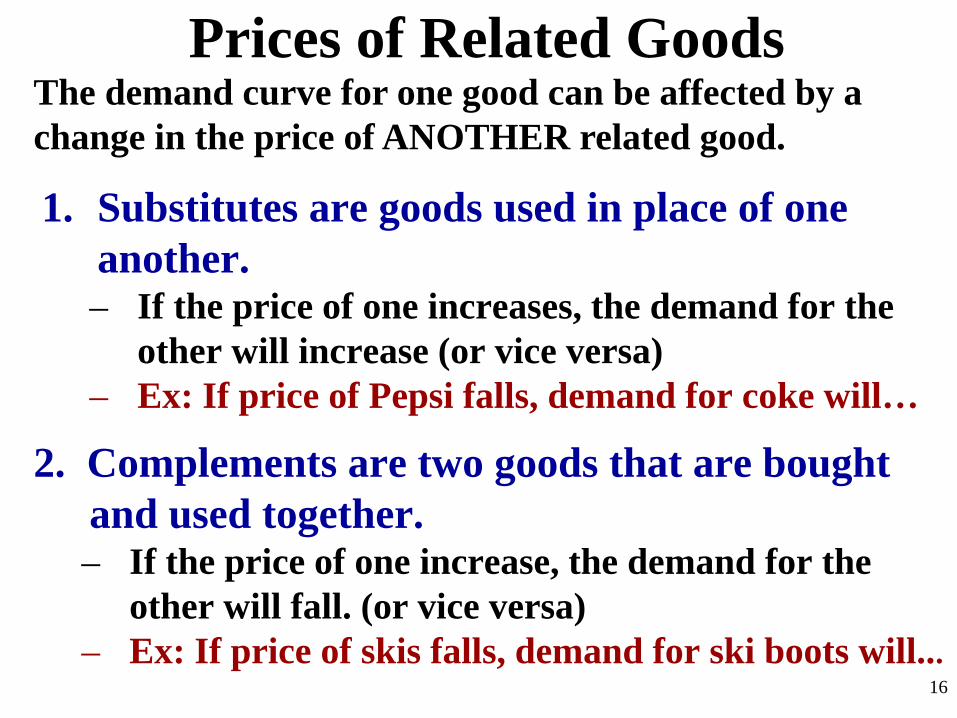
Prices of Related Goods
2. Complements are two goods that are bought and used together. – If the price of one increase, the demand for the
other will fall. (or vice versa)– Ex: If price of skis falls, demand for ski boots will...
1. Substitutes are goods used in place of one another. – If the price of one increases, the demand for the
other will increase (or vice versa)– Ex: If price of Pepsi falls, demand for coke will…
The demand curve for one good can be affected by a change in the price of ANOTHER related good.
16

Income
2. Inferior Goods – As income increases, demand falls– As income falls, demand increases– Ex: Top Romen, used cars, used cloths,
1. Normal Goods – As income increases, demand increases– As income falls, demand falls– Ex: Luxury cars, Sea Food, jewelry, homes
The incomes of consumer change the demand, but how depends on the type of good.
17

P
Q Cerealo
$3
$2
D1
Price of Cereal
Quantity of Cereal10 20
Change in Qd vs. Change in Demand
A C
B
There are two ways to increase quantity from 10 to 20
D2
1. A to B is a change in quantity demand (due to a change in price)
2. A to C is a change in demand (shift in the curve)

PracticeFirst, identify the determinant (shifter) then
decide if demand will increase or decrease
19
Shifter Increase or Decrease Left or Right
12345678
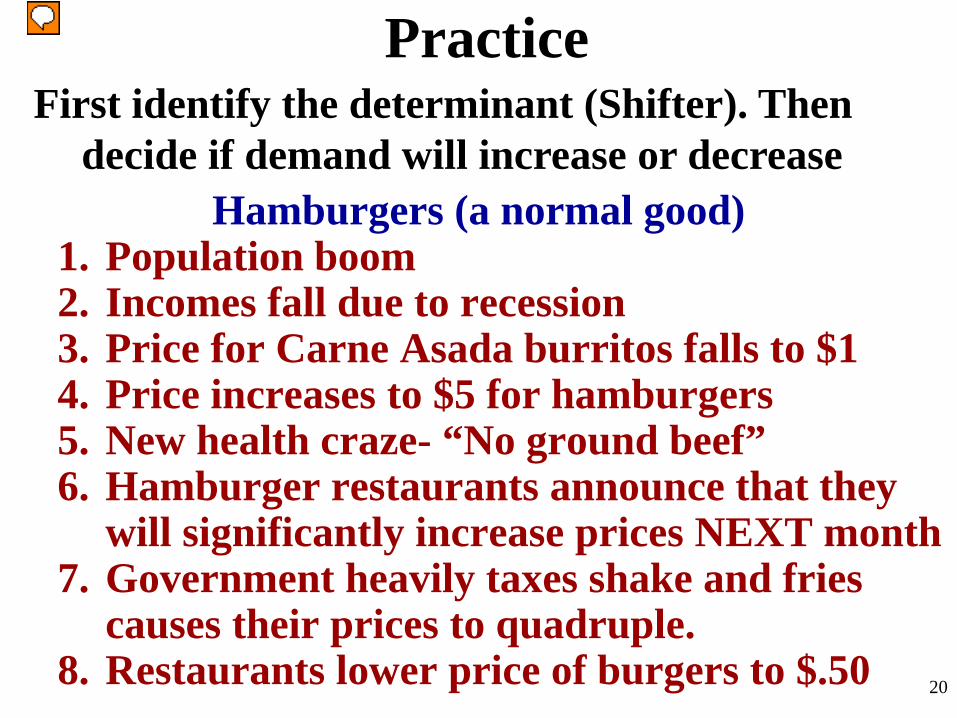
Practice
Hamburgers (a normal good)1. Population boom 2. Incomes fall due to recession3. Price for Carne Asada burritos falls to $1 4. Price increases to $5 for hamburgers5. New health craze- “No ground beef”6. Hamburger restaurants announce that they
will significantly increase prices NEXT month 7. Government heavily taxes shake and fries
causes their prices to quadruple.8. Restaurants lower price of burgers to $.50
First identify the determinant (Shifter). Then decide if demand will increase or decrease
20

Supply
21
Supply DefinedWhat is supply?Supply is the different quantities of a good that sellers are willing and able to sell (produce) at different prices.
What is the Law of Supply?There is a DIRECT (or positive) relationship between price and quantity supplied.
•As price increases, the quantity producers make increases•As price falls, the quantity producers make falls.
Why? Because, at higher prices profit seeking firms have an incentive to produce more.
EXAMPLE: Mowing Lawns 22
GRAPHING SUPPLY
Qo
$5
4
3
2
1
Price of Cereal
Quantity of Cereal
Supply Schedule
10 20 30 40 50 60 70 80
23
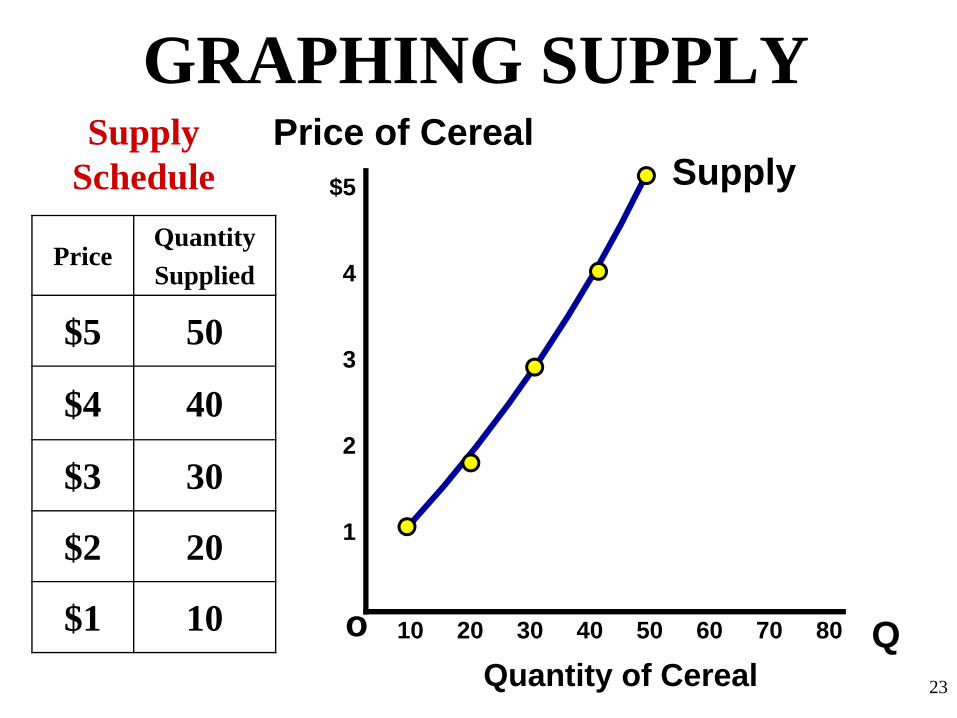
PriceQuantitySupplied
$5 50
$4 40
$3 30
$2 20
$1 10
Supply
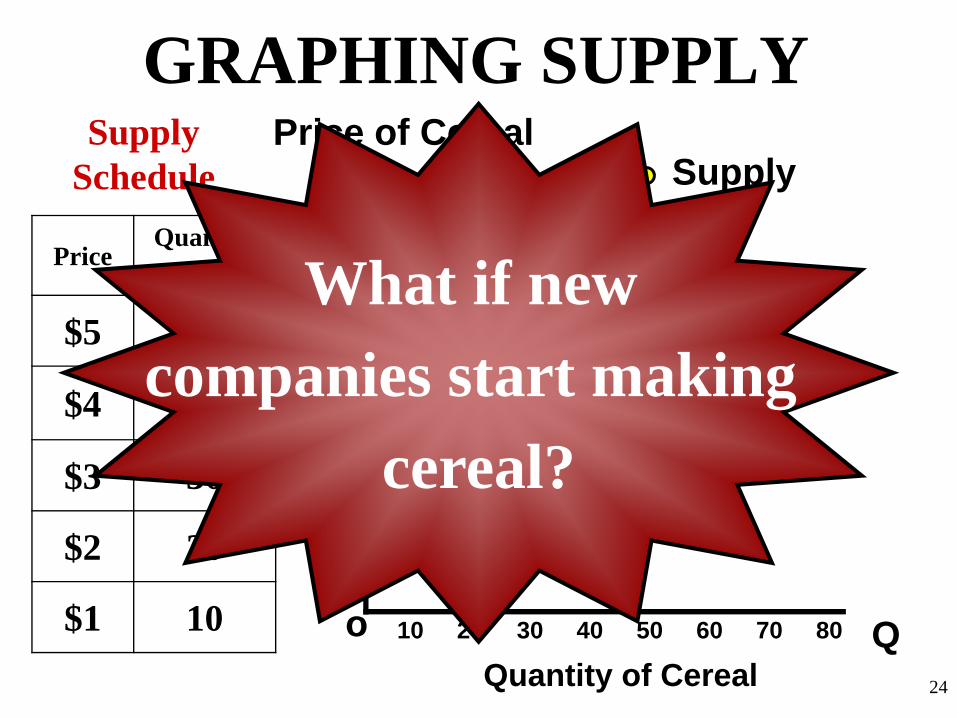
GRAPHING SUPPLY
Qo
$5
4
3
2
1
Price of Cereal
Quantity of Cereal
Supply Schedule
10 20 30 40 50 60 70 80
24
PriceQuantitySupplied
$5 50
$4 40
$3 30
$2 20
$1 10
Supply
What if new companies start making
cereal?

Change in Supply
Qo
$5
4
3
2
1
Price of Cereal
Quantity of Cereal
Supply Schedule
10 20 30 40 50 60 70 80
25
SupplyS2
PriceQuantitySupplied
$5 50 70
$4 40 60
$3 30 50
$2 20 40
$1 10 30
Increase in SupplyPrices didn’t change but
there is MORE cereal produced
Change in Supply
Qo
$5
4
3
2
1
Price of Cereal
Quantity of Cereal
Supply Schedule
10 20 30 40 50 60 70 80
26
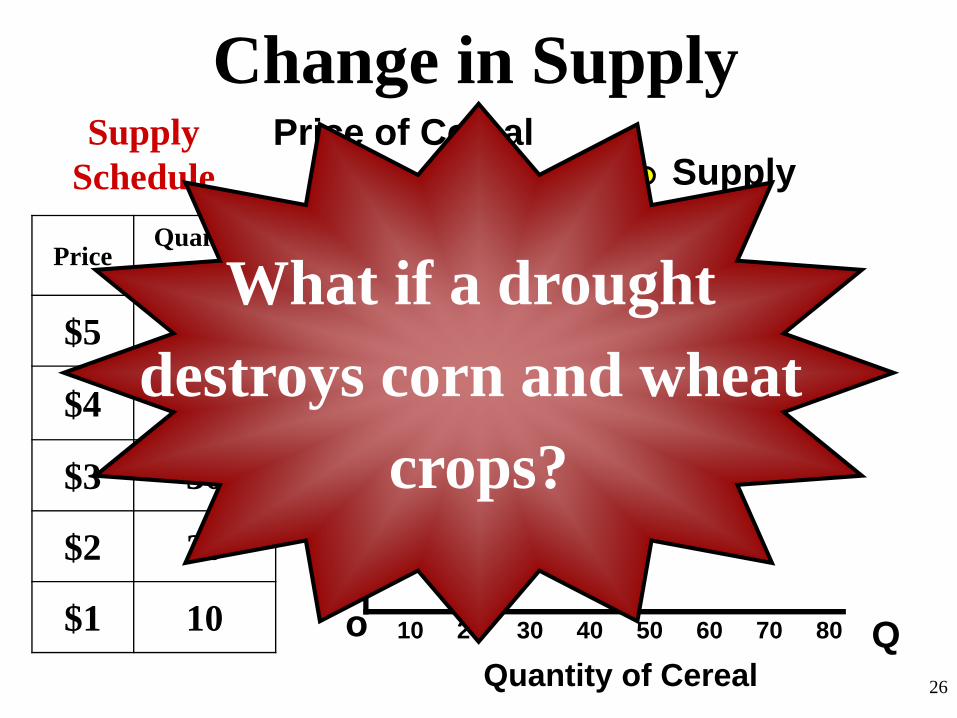
PriceQuantitySupplied
$5 50
$4 40
$3 30
$2 20
$1 10
Supply
What if a drought destroys corn and wheat
crops?
Change in Supply
Qo
$5
4
3
2
1
Price of Cereal
Quantity of Cereal
Supply Schedule
10 20 30 40 50 60 70 80
27
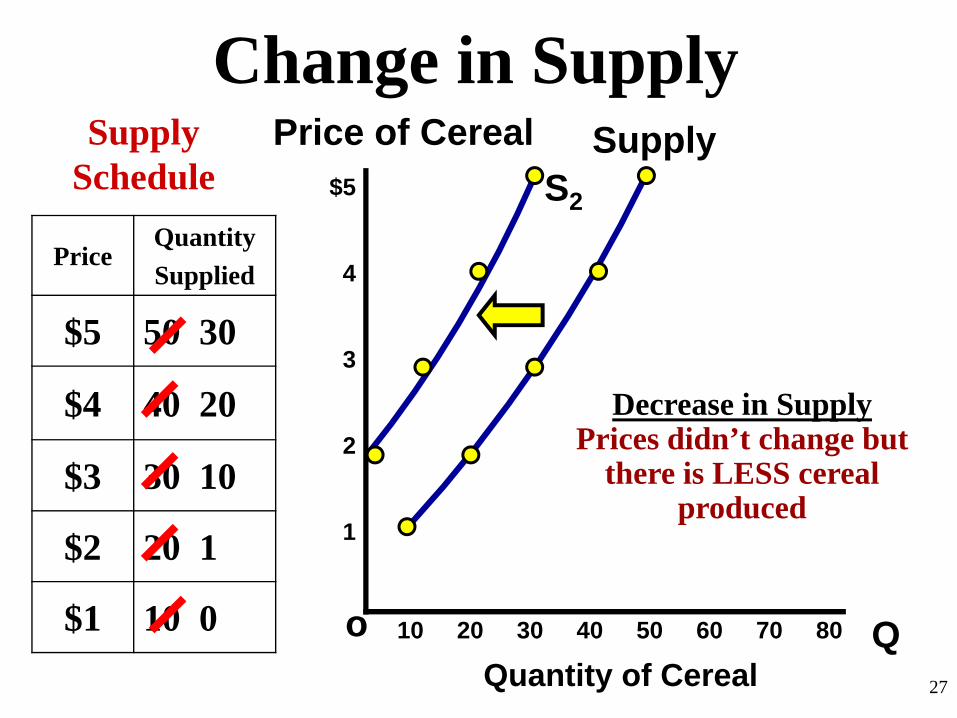
SupplyS2
PriceQuantitySupplied
$5 50 30
$4 40 20
$3 30 10
$2 20 1
$1 10 0
Decrease in SupplyPrices didn’t change but
there is LESS cereal produced

6 Determinants (SHIFTERS) of Supply1. Prices/Availability of inputs (resources)2. Number of Sellers3. Technology4. Government Action: Taxes & Subsidies
SubsidiesA subsidy is a government payment that supports a business or market.
Subsidies cause the supply of a good to increase.
5. Opportunity Cost of Alternative Production
6. Expectations of Future ProfitChanges in PRICE don’t shift the curve. It only
causes movement along the curve. 28

Supply PracticeFirst, identify the determinant (shifter) then
decide if supply will increase or decrease
29
Shifter Increase or Decrease Left or Right
123456

Supply Practice
Hamburgers1. Mad cow kills 20% of cows 2. Price of burgers increase 30%3. Government taxes burger producers4. Restaurants can produce burgers and/or
tacos. A demand increase causes the price for tacos to increase 500%
5. New bun baking technology cuts production time in half
6. Minimum wage increases to $10
1. Which determinant (SHIFTER)?2. Increase or decrease?3. Which direction will curve shift?
30

Qo
$5
4
3
2
1
PDemand Schedule
10 20 30 40 50 60 70 80
31
P Qd
$5 10
$4 20
$3 30
$2 50
$1 80
Supply Schedule
P Qs
$5 50
$4 40
$3 30
$2 20
$1 10
Supply and Demand are put together to determine equilibrium price and equilibrium quantity
Equilibrium Price = $3 (Qd=Qs)
Equilibrium Quantity is 30
D
S
Qo
$5
4
3
2
1
PDemand Schedule
10 20 30 40 50 60 70 80
32
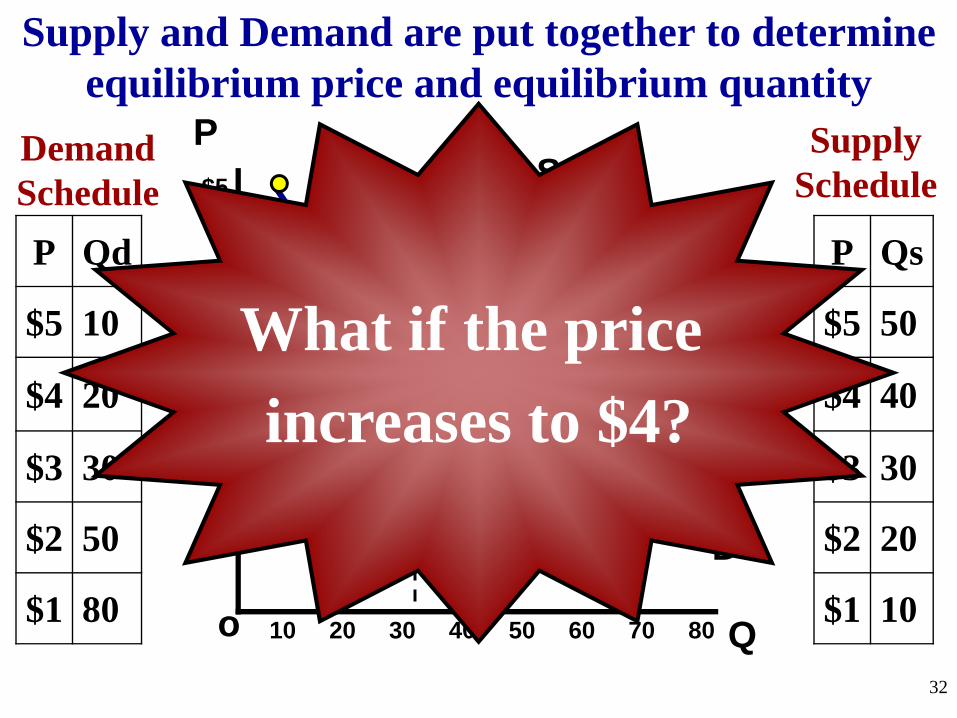
P Qd
$5 10
$4 20
$3 30
$2 50
$1 80
Supply Schedule
P Qs
$5 50
$4 40
$3 30
$2 20
$1 10
Supply and Demand are put together to determine equilibrium price and equilibrium quantity
D
S
What if the price increases to $4?
Qo
$5
4
3
2
1
PDemand Schedule
10 20 30 40 50 60 70 80
33
P Qd
$5 10
$4 20
$3 30
$2 50
$1 80
Supply Schedule
P Qs
$5 50
$4 40
$3 30
$2 20
$1 10
D
S
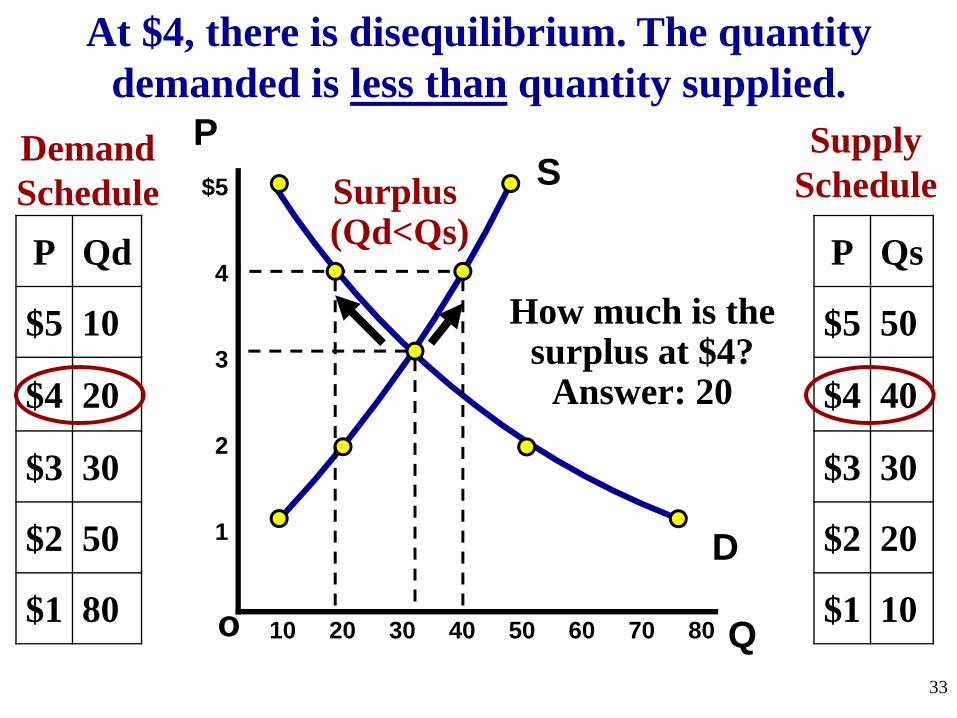
At $4, there is disequilibrium. The quantity demanded is less than quantity supplied.
Surplus(Qd<Qs)
How much is the surplus at $4?
Answer: 20

Qo
$5
4
3
2
1
PDemand Schedule
10 20 30 40 50 60 70 80
34
P Qd
$5 10
$4 20
$3 30
$2 50
$1 80
Supply Schedule
P Qs
$5 50
$4 40
$3 30
$2 20
$1 10
D
S
How much is the surplus if the price is $5?
Answer: 40What if the price decreases to $2?
Qo
$5
4
3
2
1
PDemand Schedule
10 20 30 40 50 60 70 80
35
P Qd
$5 10
$4 20
$3 30
$2 50
$1 80
Supply Schedule
P Qs
$5 50
$4 40
$3 30
$2 20
$1 10
D
S
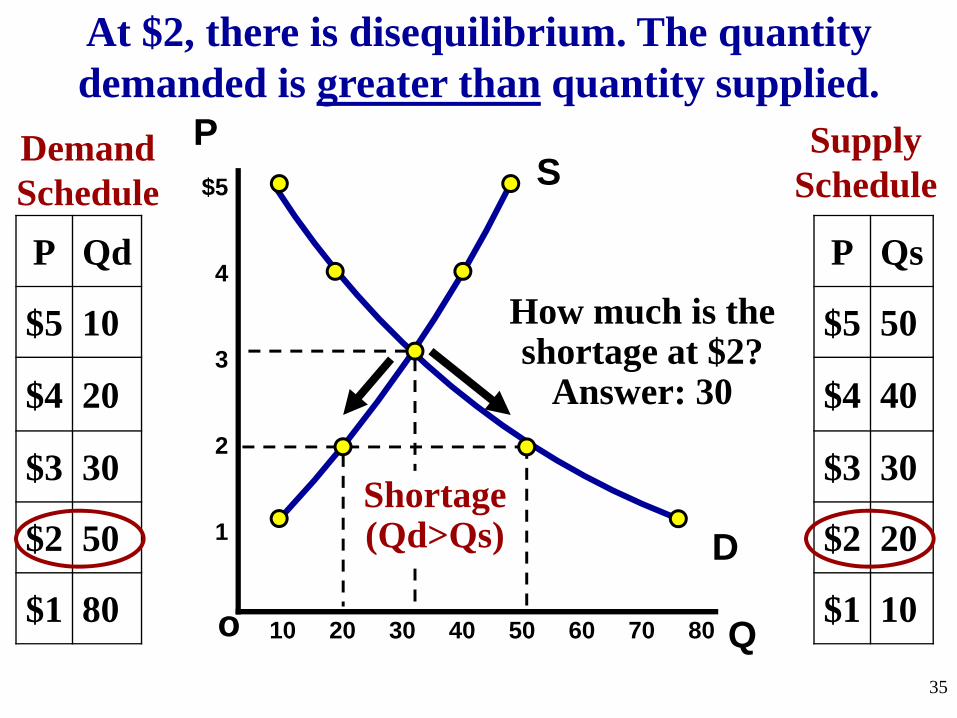
At $2, there is disequilibrium. The quantity demanded is greater than quantity supplied.
Shortage(Qd>Qs)
How much is the shortage at $2?
Answer: 30

Qo
$5
4
3
2
1
PDemand Schedule
10 20 30 40 50 60 70 80
36
P Qd
$5 10
$4 20
$3 30
$2 50
$1 80
Supply Schedule
P Qs
$5 50
$4 40
$3 30
$2 20
$1 10
D
S
Answer: 70
How much is the shortage if the price is $1?
Qo
$5
4
3
2
1
PDemand Schedule
10 20 30 40 50 60 70 80
37
P Qd
$5 10
$4 20
$3 30
$2 50
$1 80
Supply Schedule
P Qs
$5 50
$4 40
$3 30
$2 20
$1 10
D
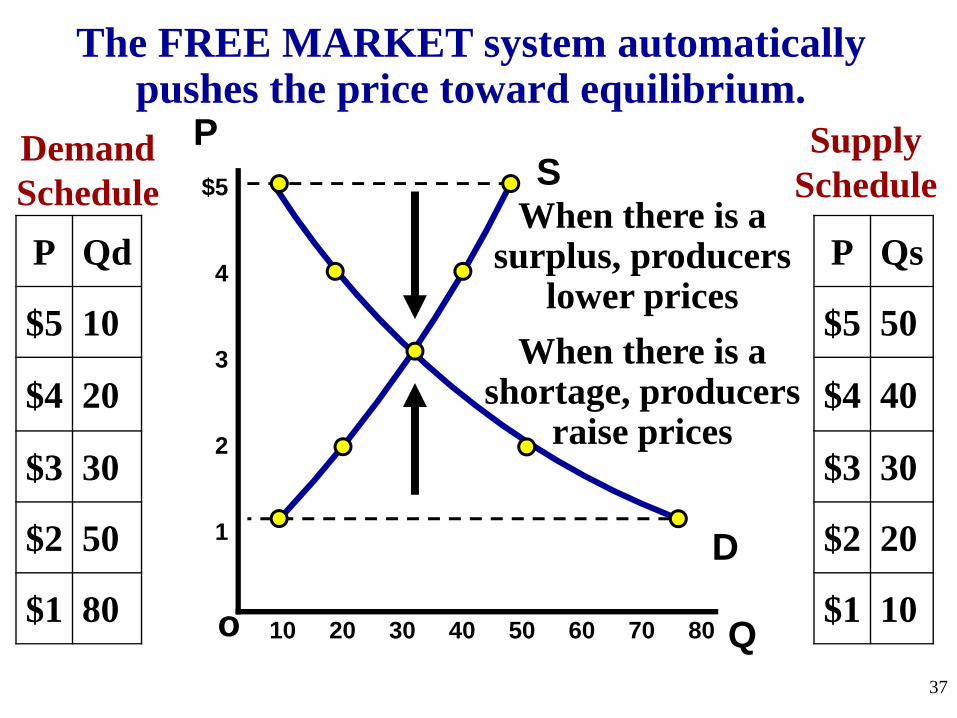
SWhen there is a
surplus, producers lower prices
The FREE MARKET system automatically pushes the price toward equilibrium.
When there is a shortage, producers
raise prices

Shifting Supply and Demand
38

Supply and Demand AnalysisEasy as 1, 2, 3
1. Before the change:• Draw supply and demand • Label original equilibrium price and quantity
2. The change:• Did it affect supply or demand first?• Which determinant caused the shift? • Draw increase or decrease
3. After change:• Label new equilibrium?• What happens to Price? (increase or decrease)• What happens to Quantity? (increase or decrease)
Let’s Practice! 39

S&D Analysis Practice
Analyze Hamburgers1. Price of sushi (a substitute) increases2. New grilling technology cuts production
time in half3. Price of burgers falls from $3 to $1. 4. Price for ground beef triples5. Human fingers found in multiple burger
restaurants.
1. Before Change (Draw equilibrium) 2. The Change (S or D, Identify Shifter)3. After Change (Price and Quantity After)
40

Double Shifts• Suppose the demand for sports cars fell at the
same time as production technology improved. • Use S&D Analysis to show what will happen to
PRICE and QUANTITY.
If TWO curves shift at the same time, EITHER price or quantity
will be indeterminate.
41

Consumer Surplus is the difference between what you are willing to pay and what you actually pay.
CS = Buyer’s Maximum – Price
Producer’s Surplus is the difference between the price the seller received and how much they were willing to sell it for.
PS = Price – Seller’s Minimum
Voluntary Exchange Terms
42

S
P
Q
D
Consumer and Producer’s Surplus
$10
8
6$5
4
2
1
102 4 6 8
CS
PS
43
Calculate the area of:1. Consumer Surplus2. Producer Surplus3. Total Surplus
1. CS= $252. PS= $203. Total= $45

Unit 2: Supply, Demand, and Consumer Choice
44

Government Involvement
#1-Price Controls: Floors and Ceilings#2-Import Quotas#3-Subsidies#4-Excise Taxes
45

#1-PRICE CONTROLSWho likes the idea of having a price ceiling on gas so prices will never go over $1 per gallon?
46

Qo
$5
4
3
2
1
P
10 20 30 40 50 60 70 80 47
D
S
Shortage(Qd>Qs)
Maximum legal price a seller can charge for a product.Goal: Make affordable by keeping price from reaching Eq.
Gasoline
Does this policy help consumers?
Result: BLACK
MARKETSPrice Ceiling
Price Ceiling
To have an effect, a price ceiling must be
below equilibrium

Qo
$
4
3
2
1
P
10 20 30 40 50 60 70 80 48
D
SSurplus(Qd<Qs)
Minimum legal price a seller can sell a product.Goal: Keep price high by keeping price from falling to Eq.
Corn
Does this policy help
corn producers?
Price Floor
Price Floor
To have an effect, a price floor must be above equilibrium
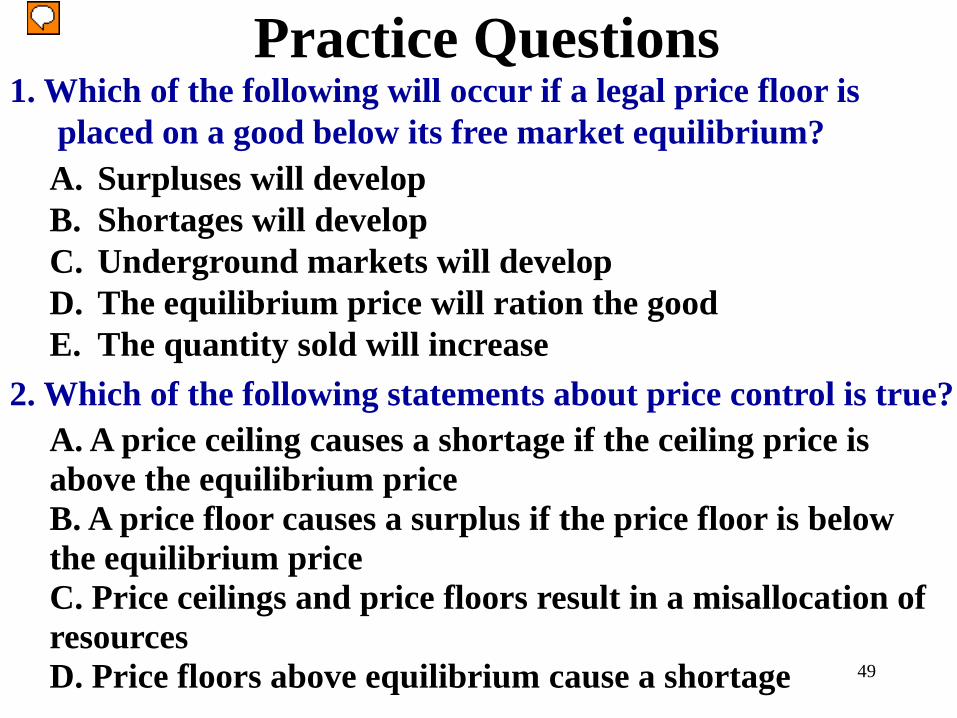
Practice Questions1. Which of the following will occur if a legal price floor is
placed on a good below its free market equilibrium?A. Surpluses will developB. Shortages will developC. Underground markets will developD. The equilibrium price will ration the goodE. The quantity sold will increase
A. A price ceiling causes a shortage if the ceiling price is above the equilibrium priceB. A price floor causes a surplus if the price floor is below the equilibrium priceC. Price ceilings and price floors result in a misallocation of resourcesD. Price floors above equilibrium cause a shortage
2. Which of the following statements about price control is true?
49

Are Price Controls Good or Bad?To be “efficient” a market must maximize
consumers and producers surplus
Q
P
D
S
Pc
Qe
CS
PS
50
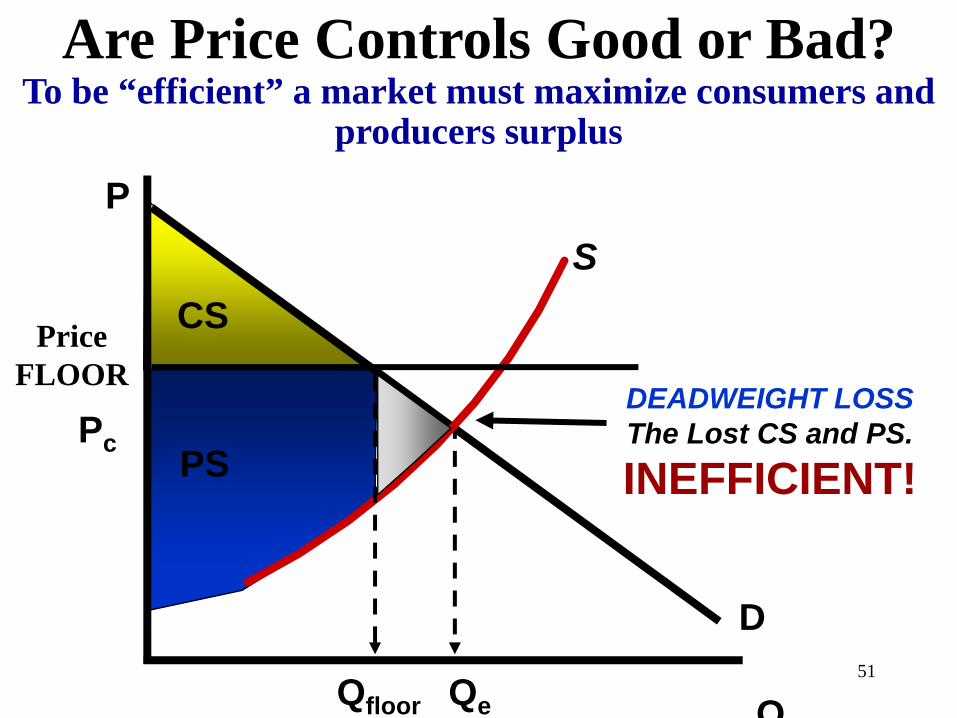
Are Price Controls Good or Bad?To be “efficient” a market must maximize consumers and
producers surplus
Price FLOOR
Q
P
D
S
Pc
QeQfloor
DEADWEIGHT LOSSThe Lost CS and PS.
INEFFICIENT!
CS
PS
51
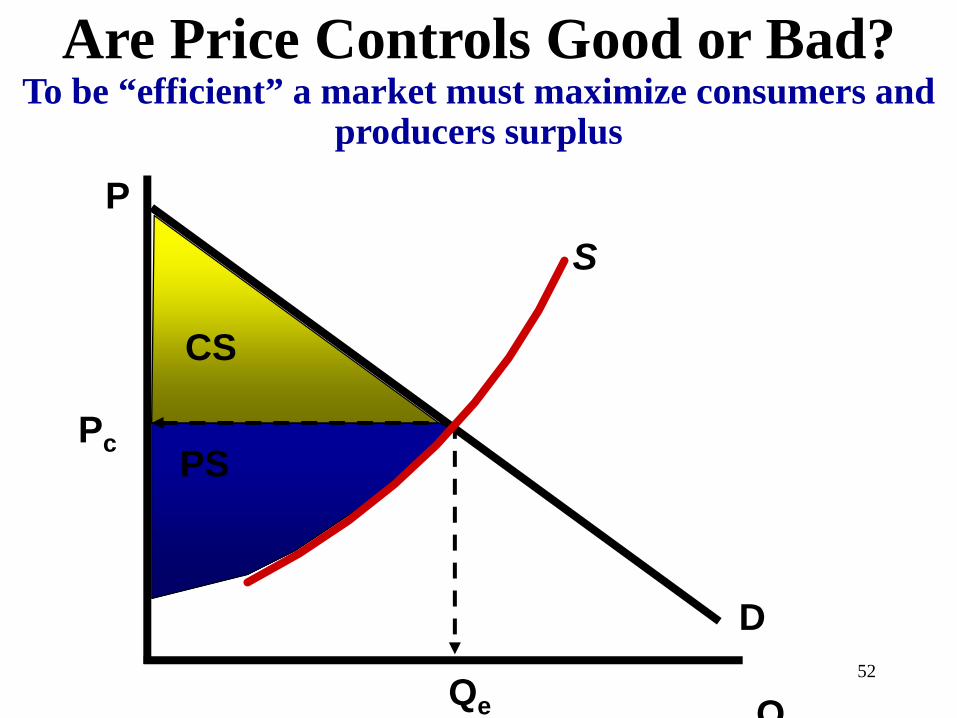
Are Price Controls Good or Bad?To be “efficient” a market must maximize consumers and
producers surplus
Q
P
D
S
Pc
Qe
CS
PS
52

Are Price Controls Good or Bad?To be “efficient” a market must maximize consumers and
producers surplus
Price CEILING
Q
P
D
S
Pc
QeQceiling
DEADWEIGHT LOSSThe Lost CS and PS.
INEFFICIENT!CS
PS
53

#2 Import QuotasA quota is a limit on number of exports.
The government sets the maximum amount that can come in the country.
Purpose:•To protect domestic producers from a cheaper world price.•To prevent domestic unemployment
54

International Trade and QuotasIdentify the following:1. CS with no trade2. PS with no trade3. CS if we trade at
world price (PW)4. PS if we trade at
world price (PW)5. Amount we import at
world price (PW)6. If the government sets
a quota on imports of Q4 - Q2, what happens to CS and PS?
This graphs show the domestic supply and demand for grain.
The letters represent area.
#3 SubsidiesThe government just gives producers money.The goal is for them to make more of the goods that the government thinks are important.
Ex:•Agriculture (to prevent famine)•Pharmaceutical Companies•Environmentally Safe Vehicles•FAFSA
56

Result of Subsidies to Corn Producers
Qo
Price of Corn
Quantity of Corn 57
SSSubsidy
Price DownQuantity Up
Everyone Wins, Right?
Pe
P1
Qe Q1
D
Unit 2: Supply, Demand, and Consumer Choice
58

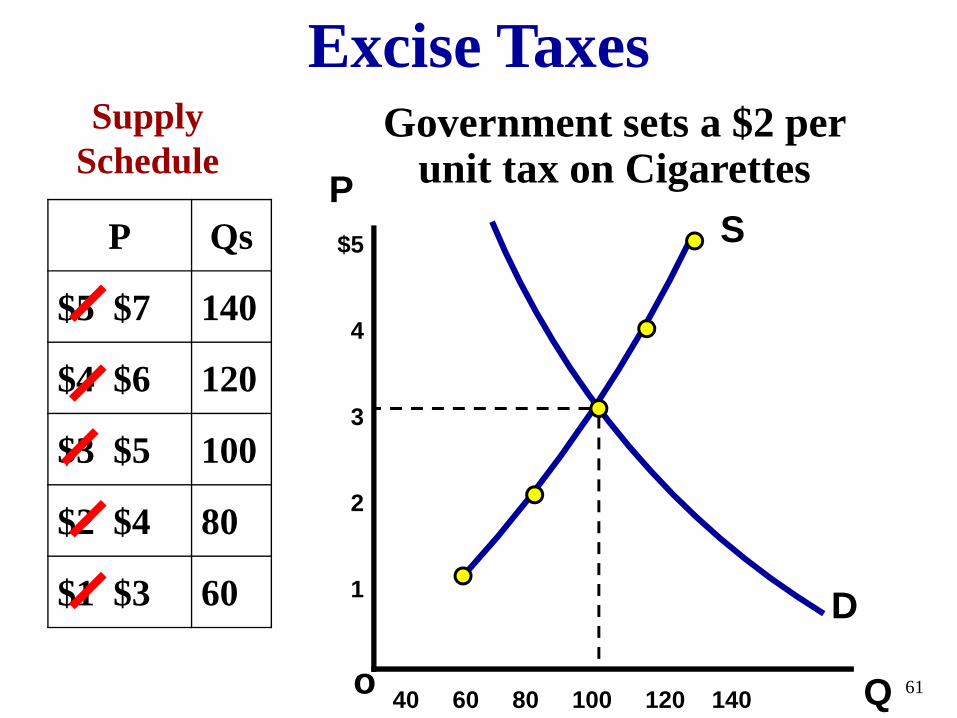
#4 Excise TaxesExcise Tax = A per unit tax on producers
For every unit made, the producer must pay $NOT a Lump Sum (one time only)TaxThe goal is for them to make less of the goods that the government deems dangerous or unwanted.
Ex:•Cigarettes “sin tax”•Alcohol “sin tax”•Tariffs on imported goods•Environmentally Unsafe Products•Etc.
59

Excise Taxes
Qo
$5
4
3
2
1
P
60
Supply Schedule
P Qs
$5 140
$4 120
$3 100
$2 80
$1 60 D
S
40 60 80 100 120 140
Government sets a $2 per unit tax on Cigarettes
Excise Taxes
Qo
$5
4
3
2
1
P
61
Supply Schedule
P Qs
$5 $7 140
$4 $6 120
$3 $5 100
$2 $4 80
$1 $3 60 D
S
40 60 80 100 120 140
Government sets a $2 per unit tax on Cigarettes

Excise Taxes
Qo
$5
4
3
2
1
P
62
Supply Schedule
P Qs
$5 $7 140
$4 $6 120
$3 $5 100
$2 $4 80
$1 $3 60 D
S
40 60 80 100 120 140
Tax is the vertical distance between
supply curves
STax
Excise Taxes
Qo
$5
4
3
2
1
P
63
D
S
40 60 80 100 120 140
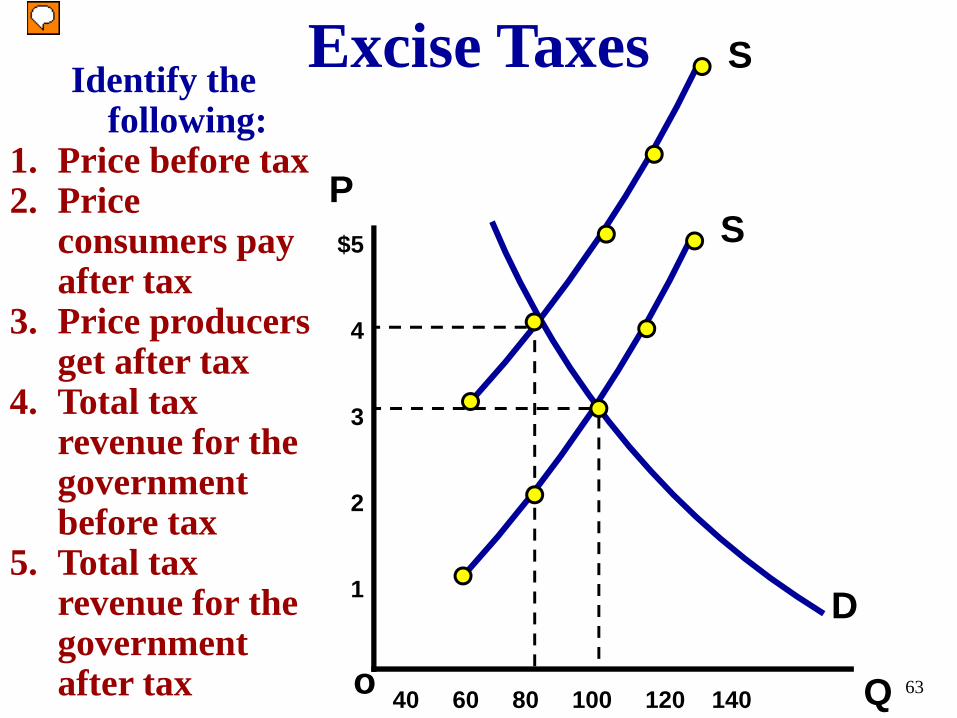
Identify the following:
1. Price before tax2. Price
consumers pay after tax
3. Price producers get after tax
4. Total tax revenue for the government before tax
5. Total tax revenue for the government after tax
S

64
1. CS Before Tax2. PS Before Tax3. CS After Tax4. PS After Tax5. Tax Revenue
for Government6. Dead Weight
Loss due to tax7. Amount of tax
revenue producers pay
Tax Practice

4 Types of Elasticity1. Elasticity of Demand2. Elasticity of Supply3. Cross-Price Elasticity (Subs vs. Comp)4. Income Elasticity (Norm or Infer)
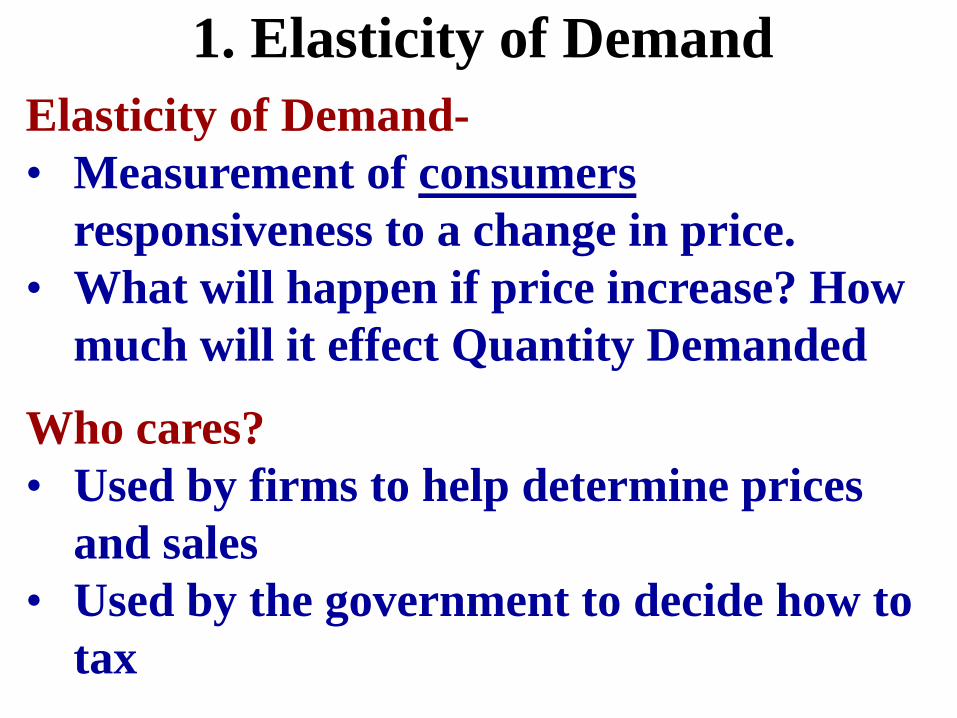
1. Elasticity of DemandElasticity of Demand-• Measurement of consumers
responsiveness to a change in price.• What will happen if price increase? How
much will it effect Quantity Demanded
Who cares?• Used by firms to help determine prices
and sales• Used by the government to decide how to
tax

Inelastic Demand
•If price increases, quantity demanded will fall a little•If price decreases, quantity demanded increases a little.
In other words, people will continue to buy it.
20%
5%
INelastic = Insensitive to a change in price.
Examples:•Gasoline•Milk•Diapers
A INELASTIC demand curve is steep! (looks like an “I”)
•Chewing Gum•Medical Care•Toilet paper

Inelastic Demand
20%
5%
General Characteristics of INelastic Goods:
•Few Substitutes•Necessities•Small portion of income•Required now, rather than later•Elasticity coefficient less than 1

Elastic Demand
•If price increases, quantity demanded will fall a lot•If price decreases, quantity demanded increases a lot.
In other words, the amount people buy is sensitive to price.
Elastic = Sensitive to a change in price.
An ELASTIC demand curve is flat!Examples:•Soda•Boats•Beef
•Real Estate•Pizza•Gold

Elastic DemandGeneral Characteristics
of Elastic Goods:• Many Substitutes• Luxuries• Large portion of income• Plenty of time to decide• Elasticity coefficient greater than 1

Elastic or Inelastic?Beef-
Gasoline-Real Estate-
Medical Care-Electricity-
Gold-
Elastic- 1.27INelastic - .20Elastic- 1.60INelastic - .31INelastic - .13Elastic - 2.6
What about the demand for insulin for
diabetics?
Perfectly INELASTIC(Coefficient = 0)
What if % change in quantity demanded equals
% change in price?
Unit Elastic (Coefficient =1)45 Degrees

Total Revenue TestUses elasticity to show how changes in price will
affect total revenue (TR).(TR = Price x Quantity)
Elastic Demand-• Price increase causes TR to decrease• Price decrease causes TR to increase
Inelastic Demand-• Price increase causes TR to increase• Price decrease causes TR to decrease
Unit Elastic-• Price changes and TR remains unchanged
Ex: If demand for milk is INelastic, what will happen to expenditures on milk if price increases?
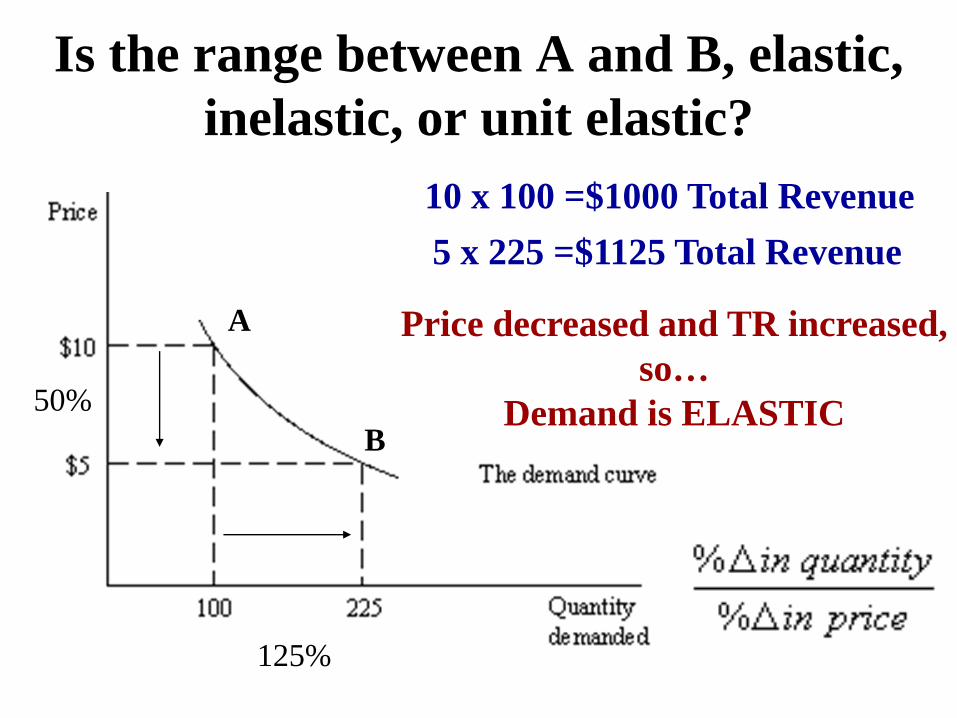
Is the range between A and B, elastic, inelastic, or unit elastic?
A
B
10 x 100 =$1000 Total Revenue5 x 225 =$1125 Total Revenue
Price decreased and TR increased, so…
Demand is ELASTIC
125%
50%

2. Price Elasticity of SupplyElasticity of Supply-• Elasticity of supply shows how sensitive producers
are to a change in price. Elasticity of supply is based on time limitations.
Producers need time to produce more.
INelastic = Insensitive to a change in price (Steep curve)• Most goods have INelastic supply in the short-run Elastic = Sensitive to a change in price (Flat curve)• Most goods have elastic supply in the long-runPerfectly Inelastic = Q doesn’t change (Vertical line)• Set quantity supplied

3. Cross-Price Elasticity of Demand• Cross-Price elasticity shows how sensitive a product
is to a change in price of another good • It shows if two goods are substitutes or compliments
% change in price of product “a”% change in quantity of product “b”
• If coefficient is negative (shows inverse relationship) than the goods are complements
• If coefficient is positive (shows direct relationship) than the goods are substitutes
P increases 20% Q decreases 15%

• Income elasticity shows how sensitive a product is to a change in INCOME
• It shows if goods are normal or inferior
% change in income% change in quantity
• If coefficient is negative (shows inverse relationship) than the good is inferior
• If coefficient is positive (shows direct relationship) than the good is normalEx: If income falls 10% and quantity falls 20%…
Income increases 20%, and quantity decreases 15% then the good is a…
4. Income-Elasticity of Demand
INFERIOR GOOD

Consumer Choice and Utility Maximization
77

Calculate Marginal Utility# of Slices of
PizzaTotal Utility (in dollars)
Marginal Utility/Benefit
0 01 82 143 194 235 256 267 268 24
How many pizzas would you buy if the price per slice was $2? 78

Calculate Marginal Utility# of Slices of
PizzaTotal Utility (in dollars)
Marginal Utility/Benefit
0 0 01 8 82 14 63 19 54 23 45 25 26 26 17 26 08 24 -2
How many pizzas would you buy if the price per slice was $2?
Marginal Cost
$2$2$2$2$2$2$2$2$2
79

Calculate Marginal Utility# of Slices of
PizzaTotal Utility (in dollars)
Marginal Utility/Benefit
0 0 01 8 82 14 63 19 54 23 45 25 26 26 17 26 08 24 -2
How many pizzas would you buy if the price per slice was $2?
Marginal Cost
222222222
You will continue to consume until
Marginal Benefit = Marginal Cost
80

If you only have $25, what combination of movies and go carts maximizes your utility?
Utility Maximization
# Times Going
Marginal Utility
(Movies)
MU/P(Price =$10)
Marginal Utility
(Go Carts)
MU/P(Price =$5)
1st 30 102nd 20 53rd 10 24th 5 1
$10 $5

If you only have $25, what combination of movies and go carts maximizes your utility?
Utility Maximization
# Times Going
Marginal Utility
(Movies)
MU/P(Price =$10)
Marginal Utility
(Go Carts)
MU/P(Price =$5)
1st 30 $3 10 $22nd 20 $2 5 $13rd 10 $1 2 $.404th 5 $.50 1 $.20
$10 $5

If you only have $25, what combination of movies and go carts maximizes your utility?
Utility Maximization
# Times Going
Marginal Utility
(Movies)
MU/P(Price =$10)
Marginal Utility
(Go Carts)
MU/P(Price =$5)
1st 30 $3 10 $22nd 20 $2 5 $13rd 10 $1 2 $.404th 5 $.50 1 $.20
$10 $5

If you only have $25, what combination of movies and go carts maximizes your utility?
Utility Maximization
# Times Going
Marginal Utility
(Movies)
MU/P(Price =$10)
Marginal Utility
(Go Carts)
MU/P(Price =$5)
1st 30 $3 10 $22nd 20 $2 5 $13rd 10 $1 2 $.404th 5 $.50 1 $.20
$10 $5
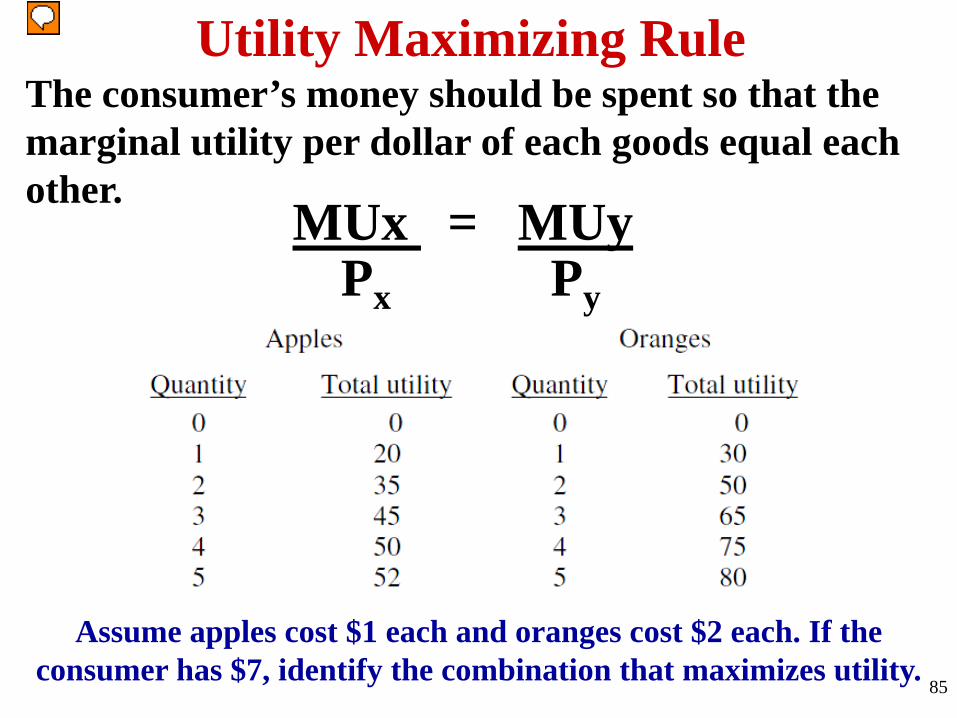
Utility Maximizing RuleThe consumer’s money should be spent so that the marginal utility per dollar of each goods equal each other.
MUx = MUy
85
Px Py
Assume apples cost $1 each and oranges cost $2 each. If the consumer has $7, identify the combination that maximizes utility.